Abstract
Soil erosion is a serious environmental threat amongst the prevailing major natural hazards which affects the livelihood of millions of people around the world. The deterioration of nutrient-rich topsoil can affect the sustainability of agriculture and various ecosystems by decreasing soil productivity. Conservation measures should be implemented in those regions which are critical to soil erosion. The identification of areas susceptible to soil erosion through prioritization of watershed can help in proper planning and implementation of suitable conservational measures. Therefore, in this study, the prioritization of 23 micro-watersheds present in the Dnyanganga watershed of Tapti River basin is carried out based on morphometric parameters and Technique for Order of Preference by Similarity to Ideal Solution (TOPSIS). TanDEM-X 90m openly accessible DEM generated from SAR interferometry, obtained through DLR, is used for determining the morphometric parameters. These parameters are grouped into linear, areal and relief aspects. Initially, the relative weights of various morphometric parameters used in TOPSIS were determined using Saaty’s Analytical Hierarchy Process (AHP). Thereafter, the MCDM package in R software was utilized to implement TOPSIS. The micro-watersheds were classified into very high (0.459–0.357), high (0.326–0.240), moderate (0.213–0.098), and low (0.096–0.088) prioritization levels based on the TOPSIS highest closeness (Ci+) to ideal solution. It is evident from the results that micro-watersheds (MW10, MW18, MW19, MW2, MW11, and MW17) are highly susceptible to soil erosion and thus, conservation measures can be carried out in these micro-watersheds with the priority to ensure the sustainability of future agriculture by preventing excessive soil loss through erosion.
1. Introduction
Soil erosion has been considered as one of the serious natural hazards which affects the sustainable development of a watershed worldwide in case of agriculture and natural resources management [,,]. Accelerated erosion in a watershed can be slowed down by identifying and prioritizing regions sensitive to soil erosion []. Morphometric analysis aids in the identification of sensitive regions which are vulnerable to soil erosion as the linear and shape parameters have a direct and indirect relationship with erodability []. There have been various studies which utilize morphometric parameters for the prioritization of watershed especially using MCDM [,,,]. In this study, the prioritization of 23 micro-watersheds present in the Dnyanganga watershed of Tapti River basin was carried out in order to identify the erosion prone micro-watersheds based on the morphometric parameters through Technique for Order Preference by Similarity to Ideal Solution (TOPSIS) method using R.
2. Study Area
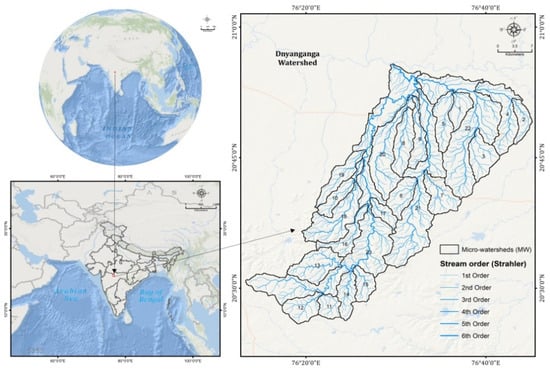
The Dnyanganga watershed of Tapti River basin is situated in the north-western part of Maharashtra, covering the districts of Buldana and Akola (Figure 1). It comprises of Dnyanganga River which is a tributary of Purna River, which is the only river in upper Tapti basin having a perennial flow. The Dnyanganga River falls into Purna River near Yerli Taluk of Maharashtra, India. The watershed extends between the northern latitudes of 20°25′56.34′′ and 20°55′46.02′′ and between the eastern longitudes of 76°13′17.96′′ and 76°45′08.46′′. The Dnyanganga watershed covers a total area of about 1288.42 km2. The watershed has a tropical wet climate experiencing high rainfall in summer and low in winter. The average rainfall in the Dnyanganga watershed is about 830 mm and experiences an annual average temperature of 25 °C.

Figure 1.
Geographical location of the study area.
3. Dataset and Methodology
3.1. Dataset used
The present study utilises TanDEM-X (3-arcsec) data obtained from EOC GeoserviceTDM90 [] for the evaluation of morphometric indices and prioritization of the Dnyanganga micro-watersheds using TOPSIS MCDM.
3.2. Methodology
3.2.1. Morphometric Analysis
Firstly, the TanDEM-X data is projected and processed using the watershed analysis tool in the TNTmips 2019 software by providing the inlet, outlet, basin, and branch parameters required for delineating the micro-watersheds along with providing the critical threshold for the generation of stream networks which plays an important role in the evaluation of morphometric parameters. The layout and map preparation were carried out using ArcGIS 10.1.1. In the present study, eight morphometric parameters such as Rb, Fs, Dd, T, Lo, Rc, Rf, and Re were used to prioritize the 23 micro-watersheds of Dnyanganga watershed. The formulae present in the Table 1 are used to calculate the linear and shape morphometric parameters used in this study for the prioritization of Dnyanganga micro-watersheds.

Table 1.
Formulae for calculating morphometric parameters used in this study.
3.2.2. TOPSIS
The TOPSIS model was introduced in 1981 [], which ranks the alternative based on the closest distance to the ideal solution and the farthest distance to the negative-ideal solution. The steps of the TOPSIS model are as follows,
Step 1. Establishing a decision matrix for ranking which is given in Equation (1).
Step 2. Determine the normalized decision matrix as follows
where, Rij is a normalized decision matrix element and aij is the i-th alternative performance in j-th criteria.
Step 3. Determine the weighted normalized decision matrix as follows
where, Vij is the weighted normalized matrix element, Rij is the normalized matrix elements, and Wj is the weight of criteria j. The weights of the criteria were calculated using Saaty’s Analytical Hierarchy Process [].
Step 4. Determining and measuring the positive ideal solution (PIS) and negative ideal solution (NIS) as given in Reference [].
Step 5. The final step is to calculate the closest coefficient of the alternatives to the ideal solution.
where, cli+ is the closeness coefficient, di+ is the positive ideal solution (PIS), and di− is the negative ideal solution (NIS).
4. Results and Discussion
The present study utilizes eight morphometric parameters for the prioritization of Dnyanganga micro-watershed using the TOPSIS MCDM approach performed through R statistical software. The five linear (Rb, Fs, Dd, T, Lo) and three shape (Rc, Rf, Re) parameters of each micro-watershed present in the study area has been calculated using the basic morphometric parameters such as area, perimeter, stream length, no. of streams, and minimum and maximum elevation. Linear parameters have a direct relationship with soil erodibility while shape parameters have an inverse relationship. The higher the values of linear parameters, the greater the erosion will be, whereas lthe ower the values of the shape parameters, the higher the erosion will be and vice versa [1-3]. Higher and lower values of linear (Rb, Fs, Dd, T & Lo) and shape (Rc, Rf & Re) parameters indicating higher susceptibility to erosion are seen in the micro-watersheds of 11, 13, 13, 13, 12, 23, 23, and 17. In this study, the linear parameters were taken as positive criteria where the maximum values are favored for high erosion while the shape parameters were taken as negative criteria where the minimum values are favored for high erosion.
In this study, the relative weights of each criterion were determined through AHP (Table 2) using R statistical software [] and the determined weights were given as inputs for determining the best alternatives through TOPSIS using the MCDM Package [] in R.

Table 2.
Selected criteria along with its type and weights (AHP).
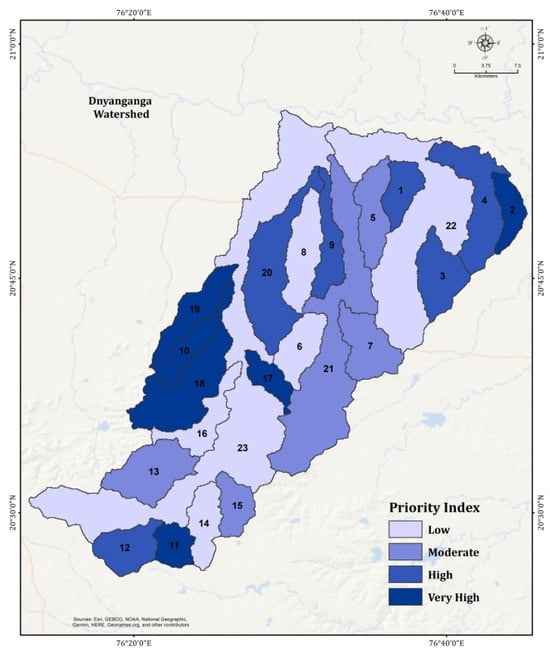
Based on the results (Table 3), the micro-watersheds were classified into very high (0.459–0.357), high (0.326–0.240), moderate (0.213–0.098), and low (0.096–0.088) prioritization levels based on the TOPSIS highest closeness (Ci+) to ideal solution (Figure 2).

Table 3.
The values of morphometric parameters and closest coefficient (Ci+) to the ideal solution with ranking (R*) and priority index of Dnyanganga micro-watersheds.

Figure 2.
Soil erosion prioritization using TOPSIS model in Dnyanganga watershed.
It is evident from the results that micro-watersheds (MW10, MW18, MW19, MW2, MW11, and MW17) are highly susceptible to soil erosion and thus, conservation measures can be carried out in these micro-watersheds with the priority to ensure the sustainability of future agriculture by preventing excessive soil loss through erosion.
5. Conclusion
The morphometric parameters have a great influence on the hydrological behavior of a river basin that identifies vulnerable regions to natural hazards such as soil erosion, which causes a huge economic loss to human lives. Thus, in this study, the prioritization of 23 micro-watersheds was carried out in order to reduce and control the effects of soil erosion in the Dnyanganga watershed. The micro-watersheds having very high and high vulnerability to erosion should be taken care of for soil and water conservation measures in order to ensure the sustainable development of agriculture and natural resources. This study establishes the usage of the TOPSIS MCDM approach with the help of R which makes the calculation easy for the decision makers in formulating soil conservation plans at different levels.
Author Contributions
Conceptualization, S.N. and A.B.; Methodology, S.N., A.B. and C.D.; Software and Analysis, S.N. and C.D.; Validation, A.B., S.N. and S.A.R.; Writing-Original Draft Preparation, S.N.; Writing-Review & Editing, S.N. and A.B.; Supervision, A.B.
Funding
This research received no external funding.
Conflicts of Interest
The authors declare no conflict of interest.
References
- Arabameri, A.; Pradhan, B.; Pourghasemi, H.R.; Rezaei, K. Identification of erosion-prone areas using different multi-criteria decision-making techniques and GIS. Geomat Nat Haz Risk 2018, 9, 1129–1155. [Google Scholar] [CrossRef]
- Nitheshnirmal, S.; Thilagaraj, P.; Rahaman, S.A.; Jegankumar, R. Erosion risk assessment through morphometric indices for prioritisation of Arjuna watershed using ALOS-PALSAR DEM. Model. Earth Syst. Environ. 2019, 1–18. [Google Scholar] [CrossRef]
- Amiri, M.; Pourghasemi, H.R.; Arabameri, A.; Vazirzadeh, A.; Yousefi, H.; Kafaei, S. Prioritization of Flood Inundation of Maharloo Watershed in Iran Using Morphometric Parameters Analysis and TOPSIS MCDM Model. Spatial Model. GIS R Earth Environ. Sci. 2019, 371–390. [Google Scholar] [CrossRef]
- Biswas, S.; Sudhakar, S.; Desai, V.R. Prioritisation of sub-watersheds based on morphometric analysis of drainage basin: A remote sensing and GIS approach. J. Indian Soc Remote Sens 1999, 27, 155–166. [Google Scholar] [CrossRef]
- Farhan, Y.; Anaba, O. A Remote Sensing and GIS Approach for Prioritization of Wadi Shueib Mini-Watersheds (Central Jordan) Based on Morphometric and Soil Erosion Susceptibility Analysis. J. Geogr. Inf. Syst. 2016, 8, 1–19. [Google Scholar] [CrossRef]
- Rahaman, S.A.; Ajeez, S.A.; Aruchamy, S.; Jegankumar, R. Prioritization of Sub Watershed Based on Morphometric Characteristics Using Fuzzy Analytical Hierarchy Process and Geographical Information System—A Study of Kallar Watershed, Tamil Nadu. Aquat. Procedia 2015, 4, 1322–1330. [Google Scholar] [CrossRef]
- Balasubramani, K.; Gomathi, M.; Bhaskaran, G.; Kumaraswamy, K. GIS-based spatial multi-criteria approach for characterization and prioritization of micro-watersheds: A case study of semi-arid watershed, South India. Appl. Geomat. 2019, 1–19. [Google Scholar] [CrossRef]
- Meshram, S.G.; Alvandi, E.; Singh, V.P.; Meshram, C. Comparison of AHP and fuzzy AHP models for prioritization of watersheds. Soft Comput. 2019, 1–11. [Google Scholar] [CrossRef]
- Aouragh, H.M.; Essahlaoui, A. A TOPSIS approach-based morphometric analysis for sub-watersheds prioritization of high Oum Er-Rbia basin, Morocco. Spat. Inf. Res. 2018, 26, 187–202. [Google Scholar] [CrossRef]
- EOC GeoserviceTDM90. Available online: https://download.geoservice.dlr.de/TDM90/ (accessed on 13 June 2019).
- Horton, R.E. Erosional development of streams and their drainage basins; hydro-physical approach to quantitative morphology. GSA Bulletin 1945, 56, 275–370. [Google Scholar] [CrossRef]
- Strahler, A.N. Quantitative analysis of watershed geomorphology. Transactions of the American Geophysical Union 1957, 38, 913–920. [Google Scholar] [CrossRef]
- Hwang, C.L.; Yoon, K. Multiple attribute decision making methods and applications; Springer: Heidelberg, Germany, 1981. [Google Scholar] [CrossRef]
- Saaty, T.L. A scaling method for priorities in hierarchical structures. J. Math. Pshychol. 1977, 15, 234–281. [Google Scholar] [CrossRef]
- R statistical software. Available online: https://cran.r-project.org/web/packages/ahp/index.html (accessed on 13 June 2019).
- MCDM Package. Available online: https://cran.r-project.org/web/packages/MCDM/MCDM.pdf (accessed on 13 June 2019).
© 2019 by the authors. Licensee MDPI, Basel, Switzerland. This article is an open access article distributed under the terms and conditions of the Creative Commons Attribution (CC BY) license (https://creativecommons.org/licenses/by/4.0/).