Abstract
Analysis for the energy optimization of 5 centers of distribution (COD) of dairy products that includes measures of saving and efficiency and implantation of photovoltaic solar energy that solves the problem of the instability of the electric network of the country.
1. Introduction
The electricity sector in the Dominican Republic has traditionally been a limitation of the country’s economic growth. A prolonged electric crisis and inefficient corrective measures cause regular blackouts, high operating costs of distribution companies, large losses (including theft of electricity through illegal connections), high retail rates to cover these inefficiencies, low invoice collection rates, a significant fiscal burden for the government through direct and indirect subsidies, and very high costs for consumers, since many depend on a very expensive self-generated alternative electricity.
The evolution of the national electricity tariff during the last years has suffered an increase close to 350%. While the cost of electricity in 2002 was set at 2.14 RD $/kWh, at the end of 2013 it stood at 8.41 RD $/kWh. In that period of time, the price of diesel suffered an average annual increase of 24.21%, and that of electricity an increase of 14.75%.
The Dominican Republic enjoys a tropical climate throughout the year. Depending on the location, the average annual temperature ranges between 25 °C and 31 °C. The coldest season occurs between November and April, and the warmest between May and October.
Bearing in mind that the activity object of this study is clearly marked by the refrigerated storage of dairy products and their derivatives, the climatic factor can be highlighted as the most relevant at the time of performing the energy analysis.
Energy costs follow a homogenous trend throughout the year. This is due to the country’s tropical climate that creates temperature variations of little significance, which increase slightly in the summer months, which in turn coincide with the highest energy billing periods.
Virtually all of the primary energy consumption comes from the electricity of the national network and from diesel generated by combustion in generators. Only a small part goes to steam generation in the distribution center located in Santiago.
2. Methodology
The study is carried out with the data provided by the internal accounting department (production and energy consumption), with the information obtained during the visits of the facilities which have been complemented with energy invoices and electricity analysis carried out in each of the centers under study. Santiago, San Isidro, La Romana, Azua and Pimentel.
In each one of them, the values corresponding to the generation and consumption of electricity steam, cold and compressed air, have been analyzed.
3. Analysis of Consumes and Energy Costs
The global average value of all the centers is considered, given their repeatability. The monthly energy costs and consumptions corresponding to the year under study are shown in Figure 1. The consumption of diesel electric generation refers to electric energy production during periods of lack of power supply from the electric national network.
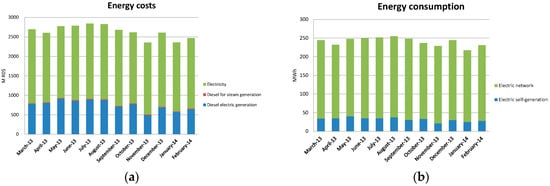
Figure 1.
(a) Energy costs (b) Energy consumption.
Of the global energy invoice, 71% of the cost corresponds to the electric energy purchased from the electric network, 28% to the cost of diesel fuel for electric generation, which represents only 15% of the energy generated and 1% to the gasoil expense for steam generation in the center of Santiago.
In the visits made to the facilities, it is observed that the electric efficiency of the diesel generators were, in general, less than 20%. This is the main reasons for the electric self-generation with these devices to not be profitable.
For the power levels of the current installations, the generation efficiency should be close to 45%, and taking into account the partial load operations, they should not be less than 40%.
The data of the global invoices of all the centers are presented in Table 1.

Table 1.
Data of energy invoices of all the centers.
4. Distribution of Energy Consumption
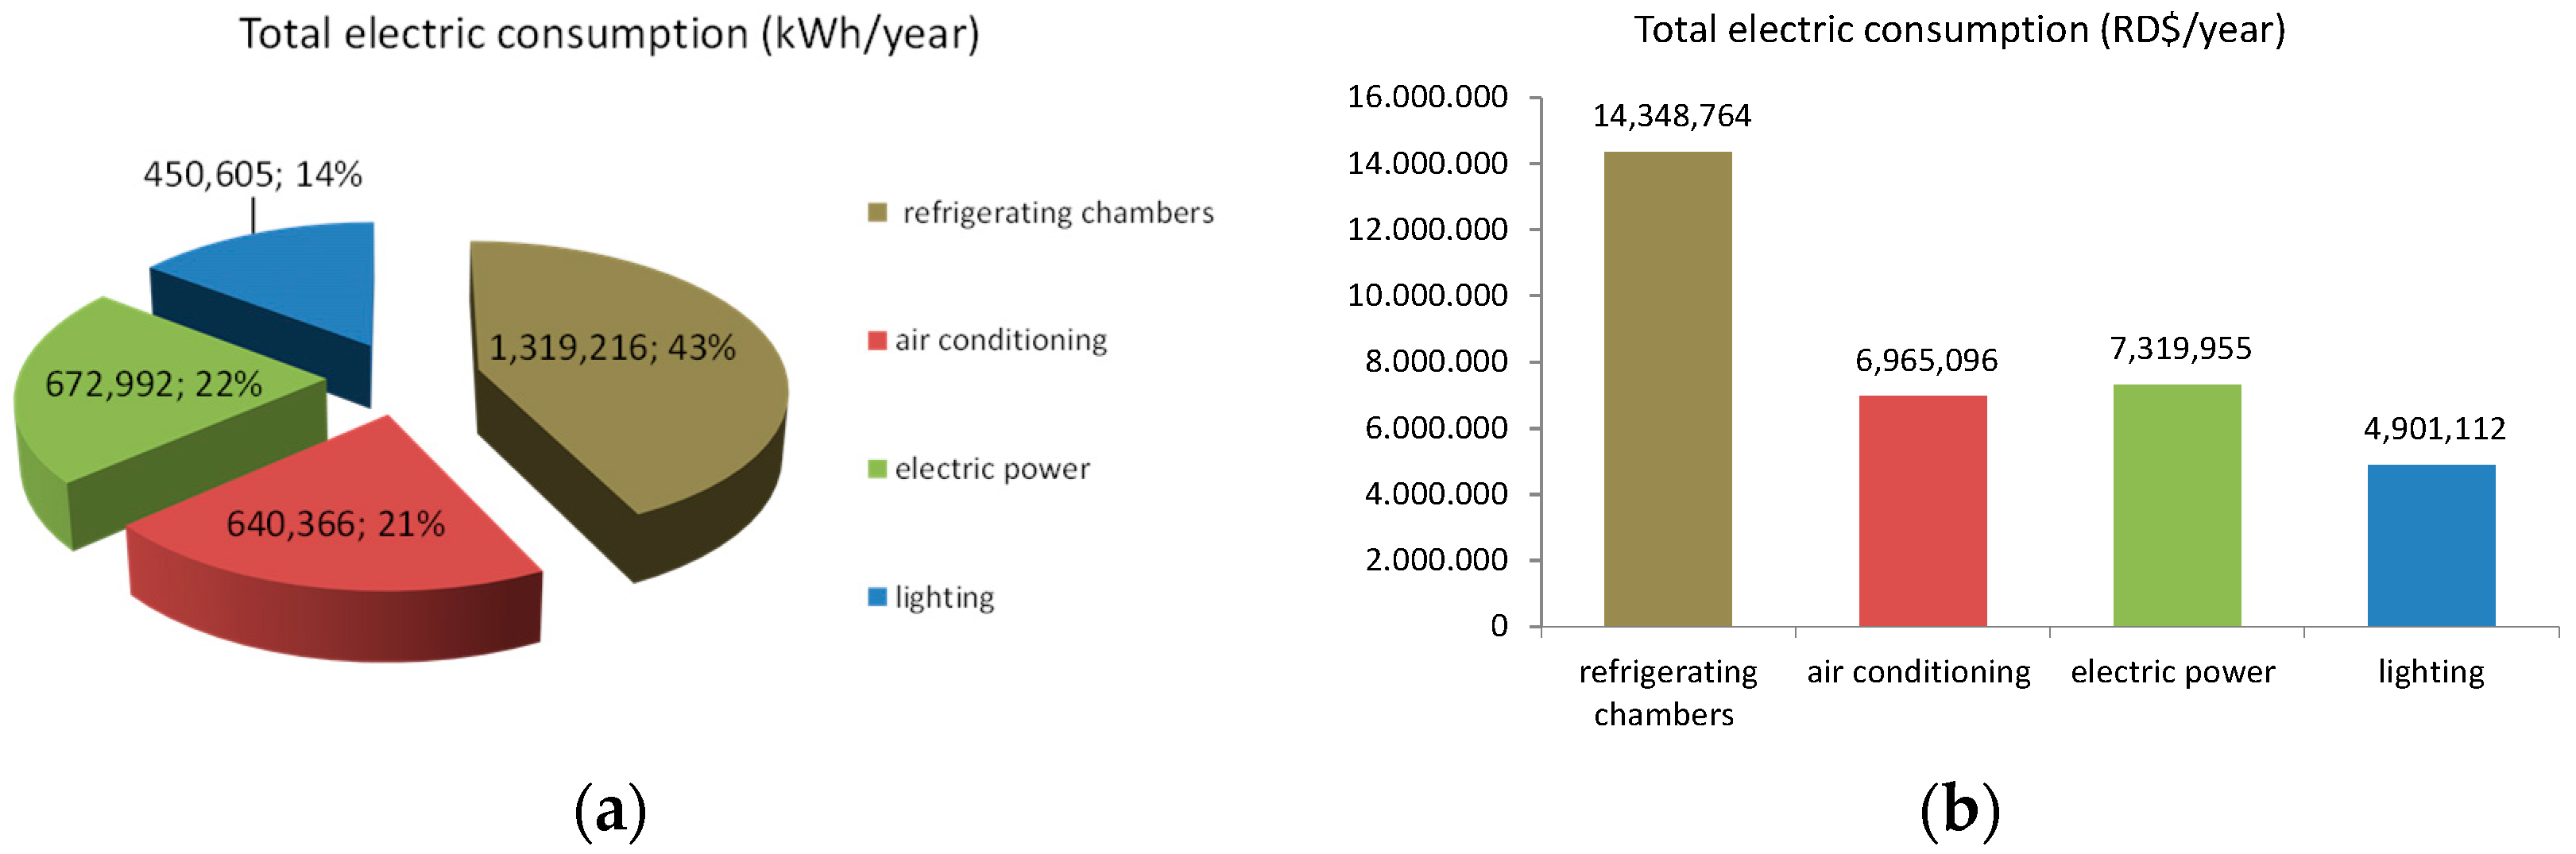
Within the distribution centers, the energy consumption by order of importance is the cold production of the refrigerating chambers (43%), the air conditioning (21%), the electrical power (22%) and the lighting (14%).
Within the power consumption, the loading of refrigerated trucks, water pumping and offices takes on special importance. In lighting we can distinguish the interior (chambers, industrial ships, offices) and the exterior.
For the analysis of the cold consumption and generation of each equipment, the following characteristics have been considered: cooling capacity, efficiency or performance, electric power consumed, estimated hours of operation, and estimated total consumption. The total values associated with the consumers considered are indicated in Figure 2.

Figure 2.
(a) Distribution of total electric consumers (b) Distribution of total electric costs by consumers.
5. Savings and Efficiency Measures
5.1. Improvements in Electrical Generation
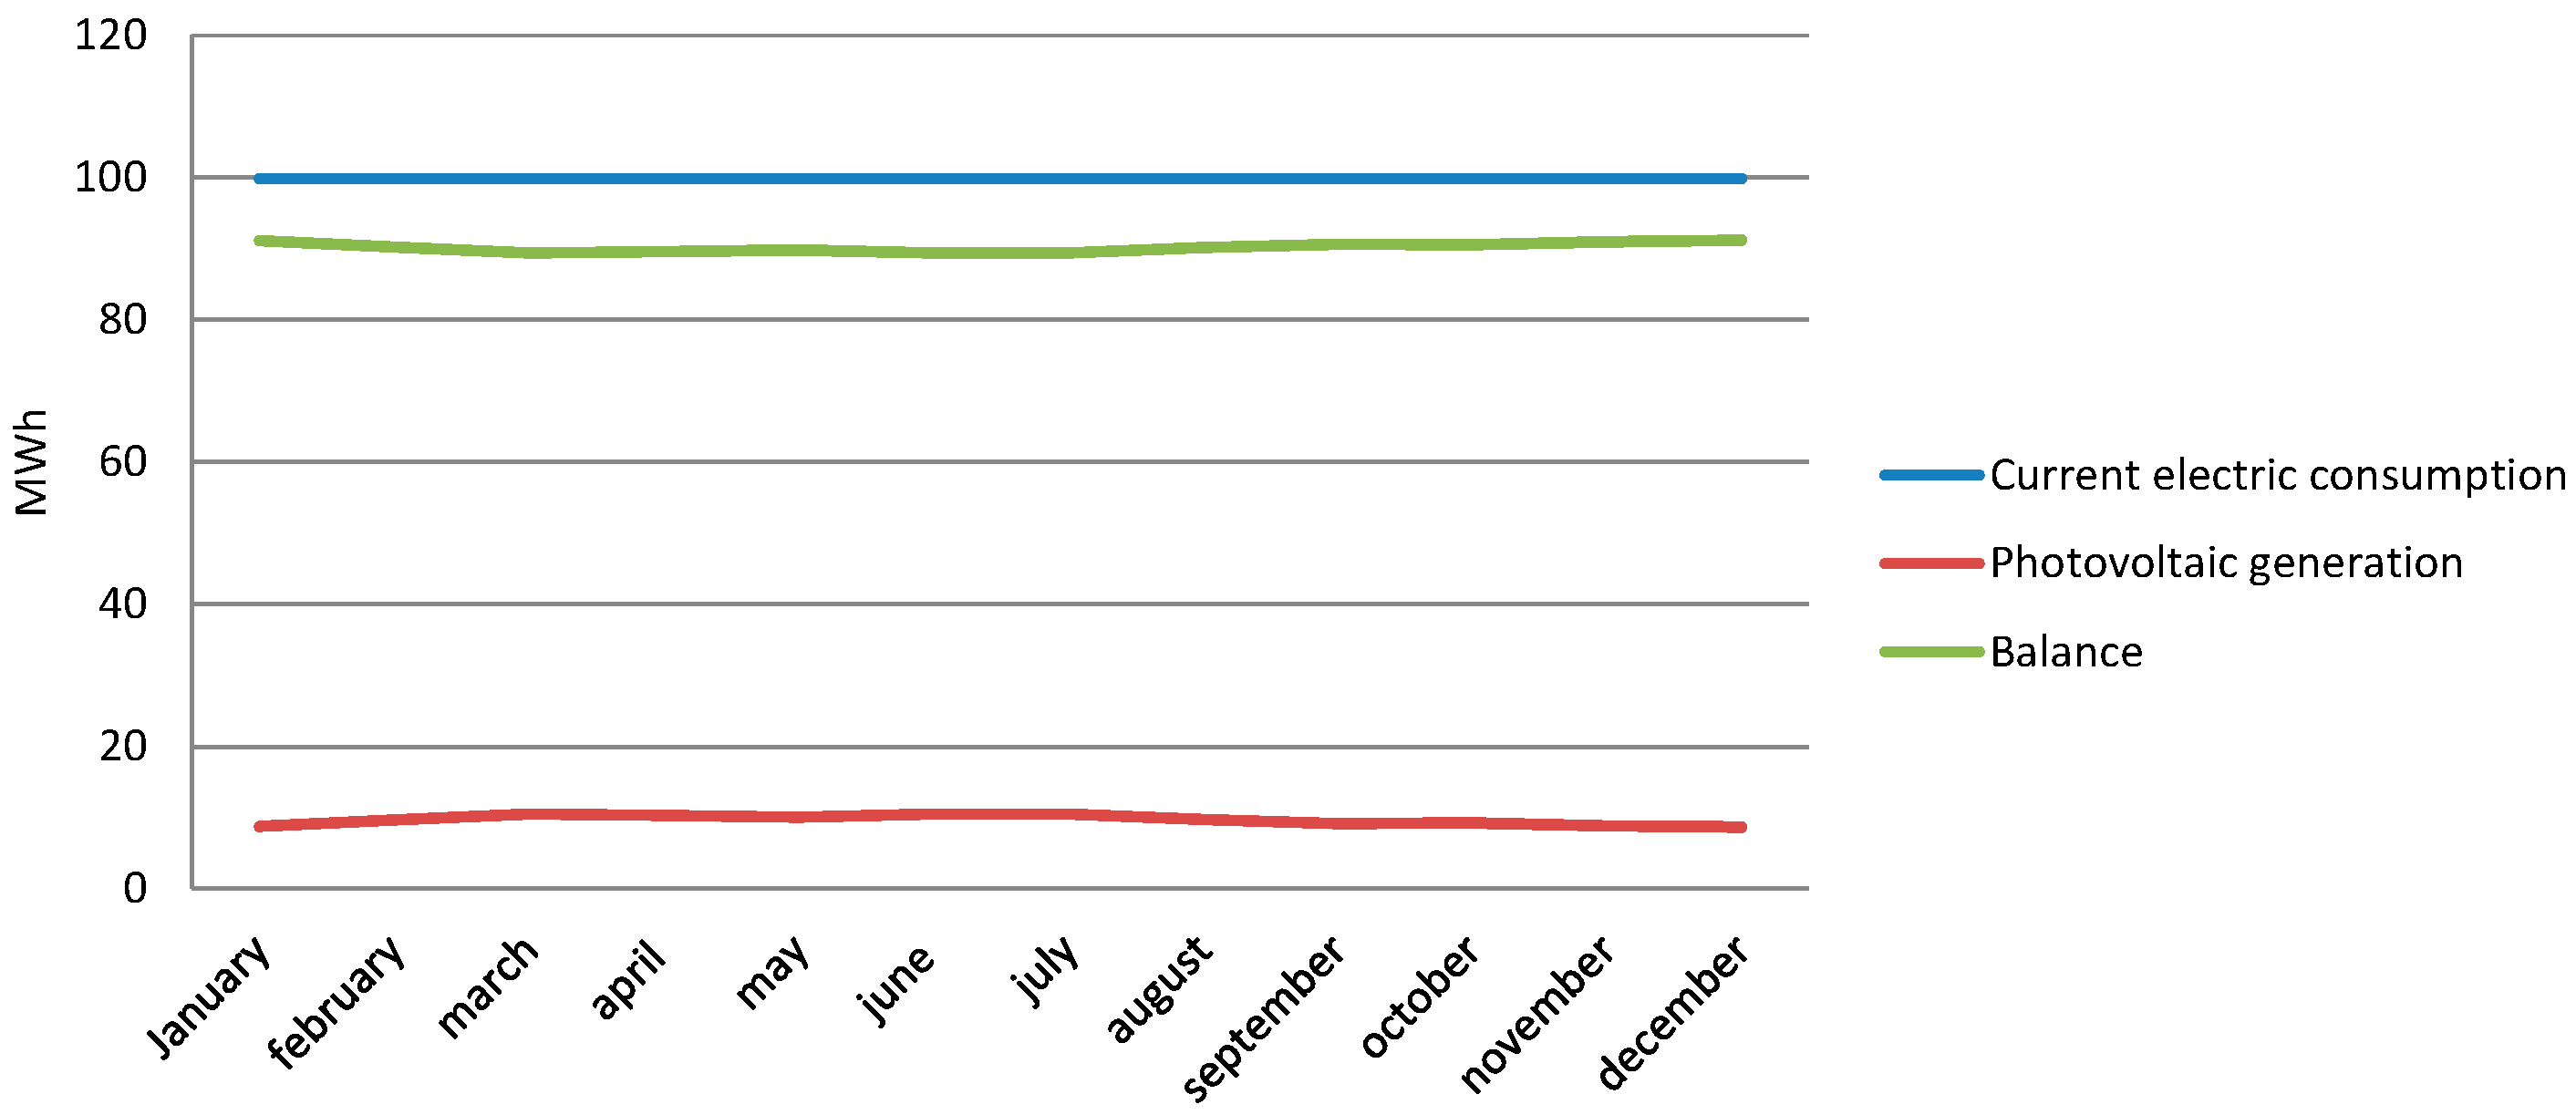
In order to reduce the high cost of electricity generation by diesel generators as well as the consumption of electricity from the network, a technical and economic study has been carried out to install a Photovoltaic Central (PhC) in mode “Net Measurement” according to the “Regulation of Net Measurement” of July 2012 of the Dominican Republic [1]. The PhC proposed for the distribution center in Santiago for example, would reduce the network power consumption by 10% (Figure 3).
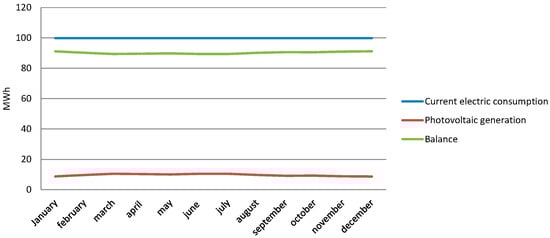
Figure 3.
Electric consumption and annual photovoltaic generation in the COD of Santiago.
The PhC has a power of 80 kW, is composed of 320 polycrystalline modules of 250 W and generates annually 16 MWh. The usable area necessary to locate the modules considering the characteristics of the roof has been estimated at 750 m2.
During the first years of operation of the PhC, the savings generated in the electricity invoice is used to offset its amortization and maintenance costs.
It is recommended to use the total tax credit of 40% according to Law 57-07 for the accelerated payment of the Photovoltaic Power Plant [2].
In this way and assuming financing of the total cost at 7% interest, it would be amortized in less than 5 years without any cost.
5.2. Improvements of Cold Generation Equipment
Replacement of piston equipment for increasing cold needs for high efficiency centrifugal chiller type. Condensers for air conditioning are located on the roof of the building very close to each other, which creates an overheated air bag on the equipment that lowers the efficiency; To avoid this inconvenience the condensers will be relocated to improve air circulation, so that without reducing the air required, a greater dissipation of the hot air in the condensing units is achieved [3].
5.3. Improvements in Refrigerating Chambers
The engine room will be located as close as possible to the cold demand zone to avoid losses and to decrease the initial investment. In the case of sets of chambers, they will be installed in blocks, to achieve the maximum of common walls to save on insulation and operating costs due to heat losses. Other improvements are: optimize orientation, avoid or minimize transmission thermal losses by painting with light colors and counteract the radiation by a good ventilation and increase the insulation thicknesses [4].
5.4. Other Improvements
Change of inefficient luminaires by LED technology and installation of automatic presence and shutdown detection systems. General recommendations and culture of saving for reduction of consumption of air conditioning in offices will also be proposed.
6. Conclusions
These measures could represent savings in the energy invoice between 36% and 60% depending on the horizon of improvement available in each of the studied centers, with investment returns ranging from 1 to 8 years depending on the type of investment measure derived from business strategies. Table 2 shows the savings obtained in the center of Santiago and the summary of all COD.
Table 2.
Savings and efficiency measures in Santiago and all COD.
References
- Gobierno R. Dominicana, Comisión Nacional de la Energía. “Reglamento de Medición Neta”; Gobierno R. Dominicana: Hispaniola, Dominican Republic, 2012. [Google Scholar]
- Gobierno R. Dominicana. Dominicana. Ley 57-07 de Incentivo a las Energías Renovables y Regímenes Especiales; Gobierno R. Dominicana: Hispaniola, Dominican Republic, 2007. [Google Scholar]
- IDAE. Technical and Training Manuals for Conservation of Energy Nr 6. Production of Industrial Cold; IDAE: Madrid, España, 1983. [Google Scholar]
- Carrier. Carrier Air Conditioning Manual; Edit; Marcombo: Barcelona, España, 1986. [Google Scholar]

Publisher’s Note: MDPI stays neutral with regard to jurisdictional claims in published maps and institutional affiliations. |
© 2018 by the authors. Licensee MDPI, Basel, Switzerland. This article is an open access article distributed under the terms and conditions of the Creative Commons Attribution (CC BY) license (http://creativecommons.org/licenses/by/4.0/).