1. Introduction
Despite the initial controversy that the global warming caused among the world scientific community, nowadays no one can deny that the temperature of our planet is increasing decade after decade. At this point it is easy to understand that this phenomena is basically due to the increase in the greenhouse gas emissions produced by human activity.
Analyzing the data from the United States Environmental Protection Agency it is possible to see that, with the exception of the 24% generated by agriculture, the rest of the global greenhouse gas emissions are produced in sectors where, directly or indirectly, non-renewable energy sources are used. Furthermore, the 65% of the Global Greenhouse Gas emissions are Carbon Dioxide, a gas that is extremely linked to the use of fossil fuels [
1].
To solve this serious problem, it is very important to start making decisions that open the door to replace the prevailing energy model based on fossil fuels, to a new renewable and sustainable system.
Studying the current energy production from renewable sources all over the world, we may ask the reason why the tidal and ocean energy has so little impact, if the World Energy Counsel estimated the energy potential of the tides at 22,000 TWh/year, previsions that exceeded those for solar and eolic energy developed on land [
2].
Following these optimistic estimates, plenty of energy companies are investing in different facilities to measure the energy that can be obtained from marine currents [
3,
4,
5,
6]. In this line of research the Spanish company INERSA S.L., with the collaboration of the Power Electronics Department from the Gijon Polytechnic School of Engineering and the Department of Fluid Mechanics from the Mieres Polytechnic School, is currently developing the HIDROCIMAR project that seeks, through the use of the marine currents, to cover for example, the demand for lighting of marinas.
2. Materials and Methods
The first step consist in designing the hydraulic system that will allow to perform the tests with the different prototypes of vertical axis hydrokinetic microturbines [
7]. This test bench, which has been designed following the guidelines of the Department of Fluid Mechanics (see
Figure 1a), consists of: a main tank, built using stainless steel, which has three vertical deflectors to break turbulence that generate a non-speed reservoir of water at the entrance of the canal. This tank has been covered to prevent water overflowing; a test canal, design to hold the different prototypes of microturbines, built basically with methacrylate allowing the filming of the flow from different positions; two stainless steel floodgates to manually control the height of the water at the beginning and at the end of the canal; the suction tank where the water from the test canal accumulates; and the pumping system that takes the water from the suction tank and pumps it to the main tank, generating a close circuit of water. The pumping system is connected to two electronic drives whose frequency sets the flow speed.
Once the hydraulic system has been designed, the next step consists in developing the control and monitoring system to adjust different hydraulic parameters and to control the operation of the microturbine under test. This system, also known as TURTLE (Turbine Test Laboratory Equipment), will provide the necessary measures to obtain the Cp-λ curves of the microturbine, which will enable us to extract the Maximum Power Point. This curves, where λ represents the ratio between the blade tip speed and the fluid speed and Cp the percentage of the theoretical power from the fluid that the system is obtaining, are used in wind turbine design to determine the rotor power for any combination of wind and rotor speed:
This curves had to be obtained for different fluid velocities, so we need to design a system that help us to get that information.
According to the scheme of the TURTLE System shown in
Figure 1b, it is possible to see that the fluid velocity (vs) can be obtained in two ways: the first, using the Bernoulli equation, considering the height in the main tank (hd) and the gravity; the second, using the continuity equation, considering the dimension of the canal, the flow and the water height before the turbine (hs). Once the dynamics of the water tunnel have been analyzed, the Department of Fluid Mechanics has concluded that the best option consist in measuring the fluid speed by keeping the water height at the beginning of the canal at a constant value.
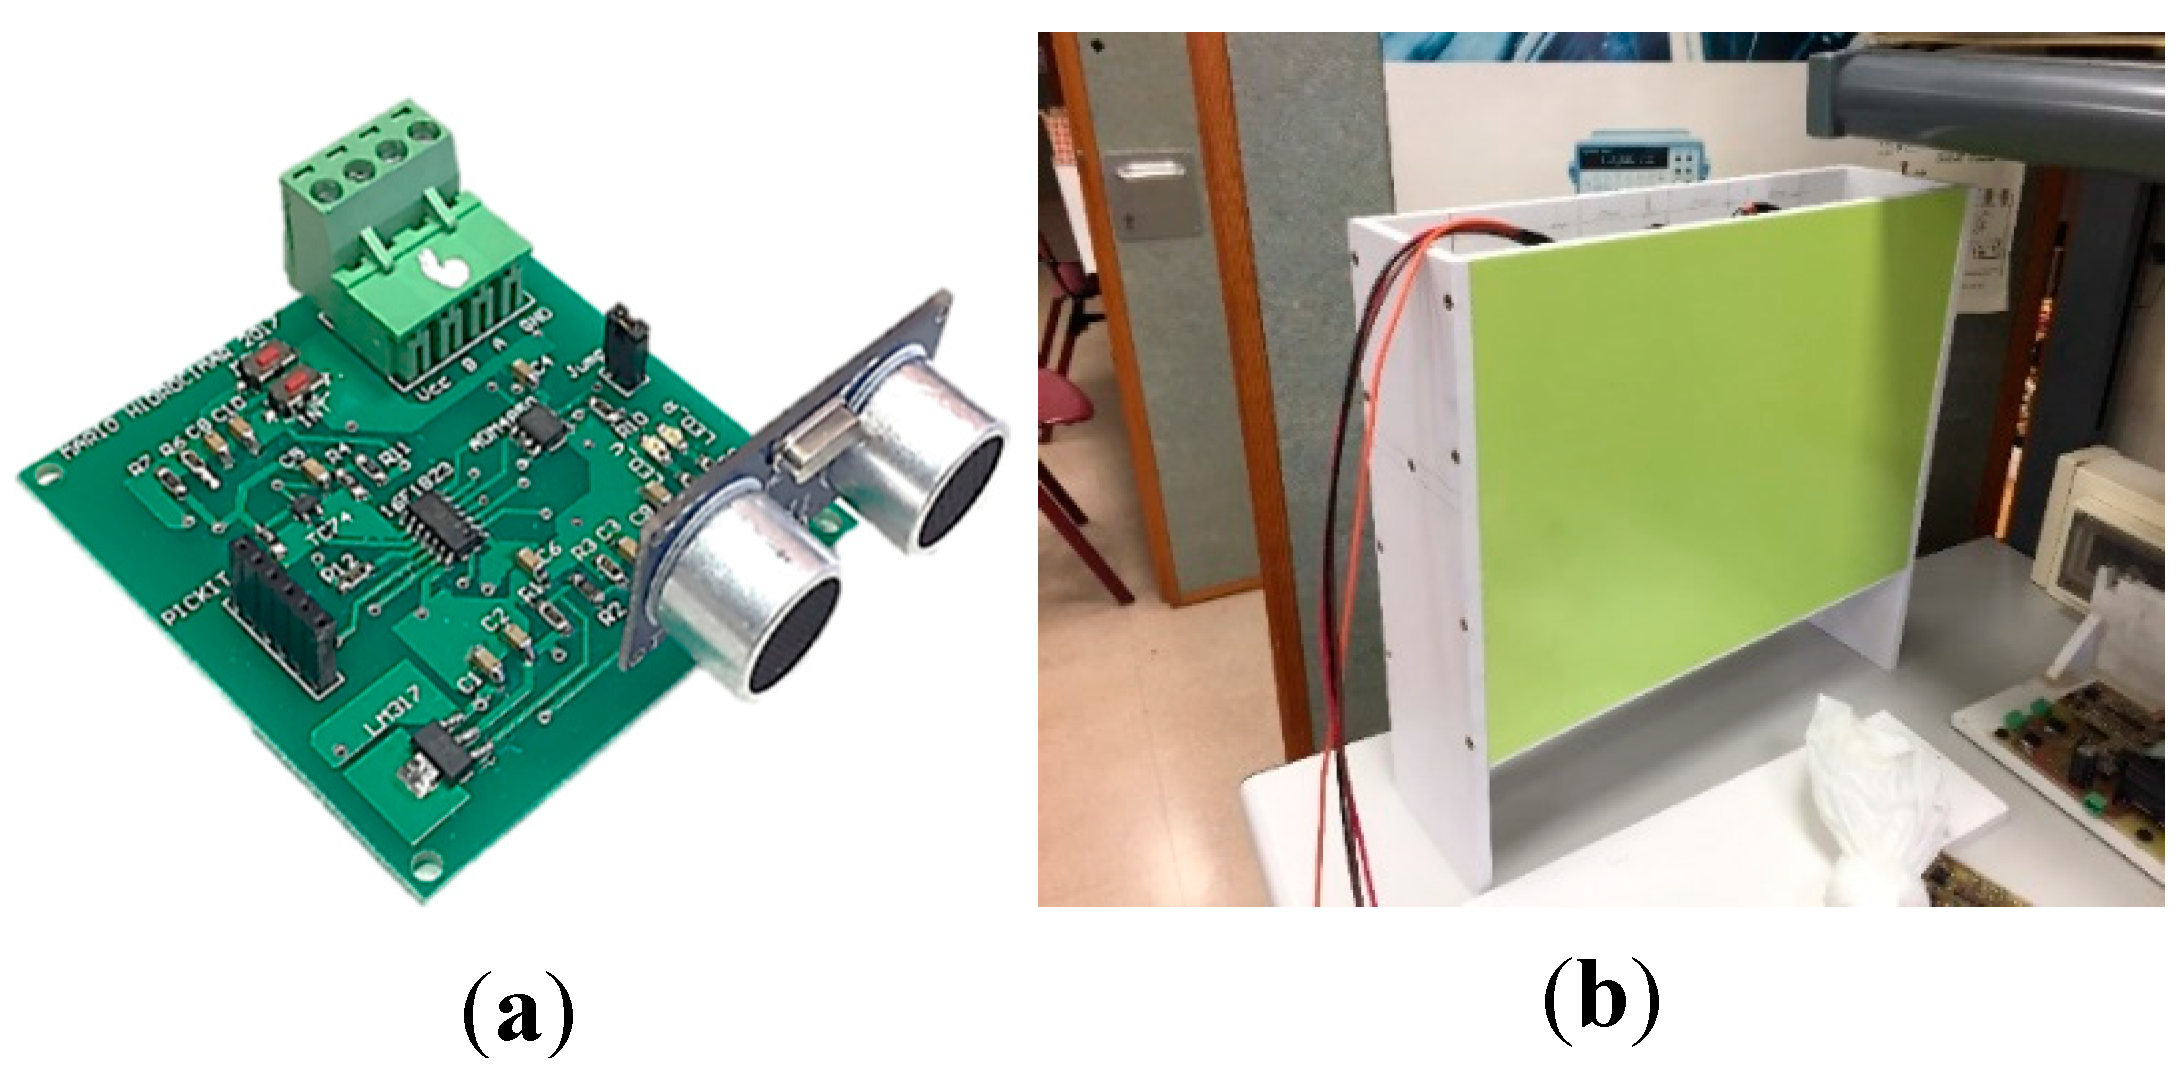
That water level will be obtained by means of an ultrasonic height measuring station (See
Figure 2). The ultrasonic sensors are a very good choice for this kind of designs because they are affordable, easy to control and insensitive to moisture, an issue that must be taken into account because they are going to be used in high humidity environments.
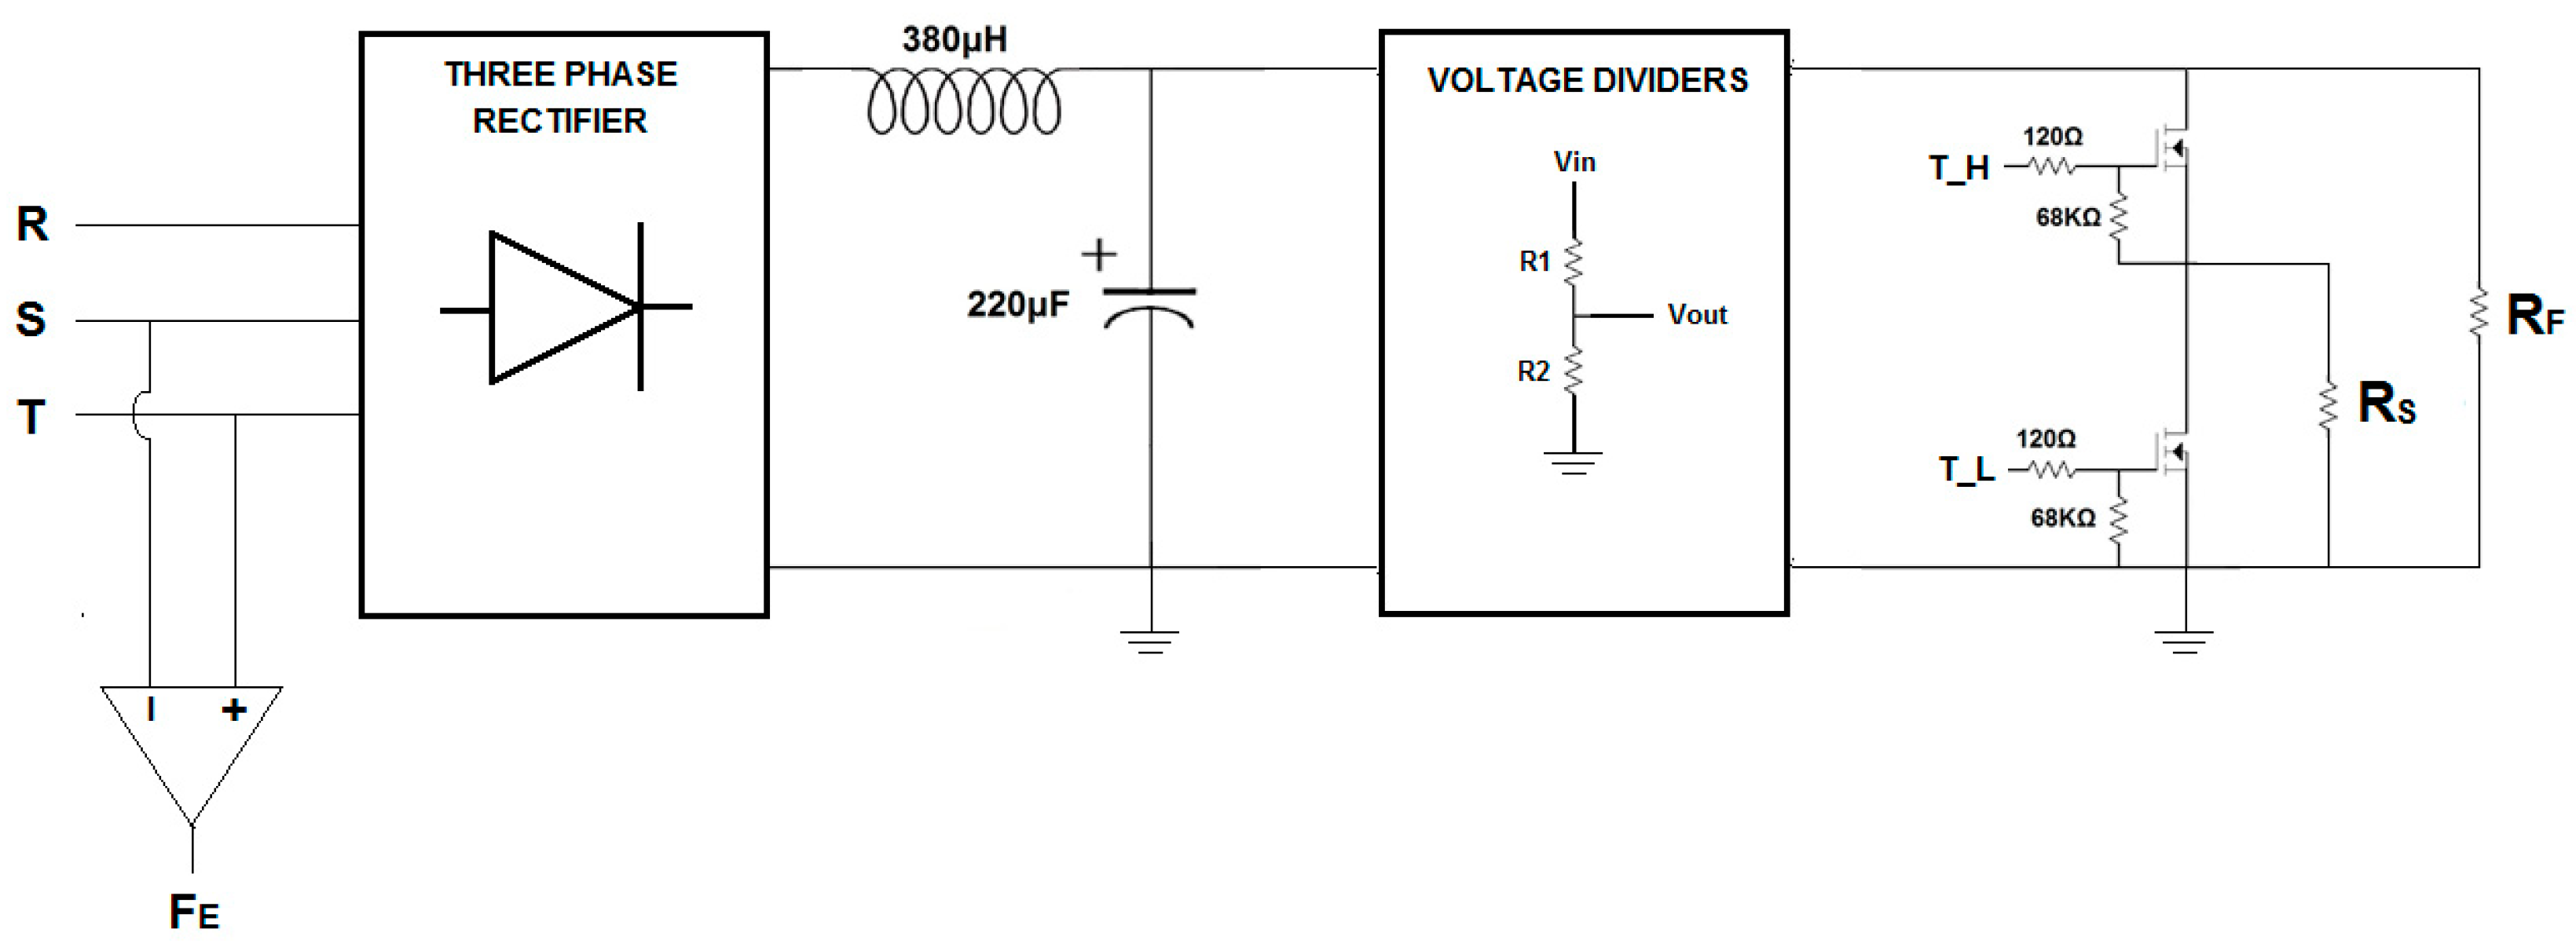
The power electronic system will perform the tests using a fixed and a switched resistance which will let us modify the current extracted from the rectifier (see
Figure 3). The working DC voltage and the duty cycle in the power circuit will set the electrical output power to a certain value during the test.
The microturbine under test is connected to a Permanent Magnet Generator (PMG) with a known number of poles so, if the rotational speed of the microturbine is calculated by measuring the electrical frequency of the voltage signal from the generator, the TSR (λ) is easy to obtain.
The ultrasonic height measuring station and the power electronics system are connected to a two-wire RS-485 communication bus, following a master-slave architecture, where the computer sends different commands to the electronic devices connected to the bus, which will respond, all within the MODBUS communication protocol. To follow the real-time results that we are obtaining from the control and monitoring system, a computer application has been programmed using C#.
3. Results
To check the correct operation of the TURTLE System and obtain the Maximum Power Point for the microturbine, two tests took place in the water tunnel. The results were collected in a spreadsheet that allowed us obtaining the Cp-λ curves that best fitted those values (see
Figure 4).
4. Conclusions
According to the results shown in
Figure 4, it is easy to conclude that the aim of the project which consisted in designing a control and monitoring system to obtain the Cp-λ curves for a microturbine under test and, from it, extract the Maximun Power Point, has been successfully achieved.
It is also very important to mention that, during the tests, the TURTLE System reached peaks of power close to eleven watts, which is a significant amount of power especially because we are working on an experimental laboratory test bench. These results are making us really optimistic in relation to the power capabilities of the marine currents and, without any doubts, it is a great starting point to develop in the future, in a location with a real water current, a larger scale installation which will let us estimate the real level of power that can be extracted using vertical axis hydrokinetic turbines.


