Abstract
This study explores the gap between producer price (PP) and consumer price (CP) in Cyprus’s fresh fruit and vegetable supply chain (2020–2022). Results show persistent disparities, with PP consistently below half of CP. Marketing margins in Cyprus exceed those in other EU countries, suggesting systemic inefficiencies such as weak producer organizations, intermediaries’ concentration, high logistics costs, and limited market transparency. Addressing these issues requires strengthening producer groups, enhancing transparency, promoting short supply chains, and reducing market concentration to ensure fairer supply chains.
1. Introduction
Price volatility is a major concern in food supply chains (FSCs), affecting both producers and consumers. It refers to large, unpredictable price fluctuations that heighten uncertainty and risk for all market participants [1]. These fluctuations disproportionately impact farmers, often resulting in unstable incomes. In contrast, prices downstream in the FSC tend to be more stable, reflecting market power dynamics [2].
The persistent gap between producer price (PP) and consumer price (CP) has drawn increasing attention. Existing literature attributes these gaps to factors such as market structure, logistical costs, and unequal bargaining power [3]. Recent global events—such as the COVID-19 pandemic and Russia–Ukraine war—have further exposed weaknesses in FSCs and intensified concerns about fairness and efficiency.
In Cyprus, the widening disparity between PP and CP for fresh fruits and vegetables (F&V) has become a pressing issue. This price gap has significant implications for farm viability and consumer welfare. Yet, empirical evidence on this issue in the Cypriot context is currently lacking.
This study assesses the price gap for selected F&V in Cyprus by analyzing PP and CP volatility and marketing margins (MMs) over time and comparing these trends with other EU countries. Focusing on the 2020–2022 period—marked by major global shocks—the analysis reveals persistent price gaps, high volatility and MMs in Cyprus, underscoring the need for targeted policy responses.
2. Materials and Methods
The analysis is based on price data for various fresh F&V covering the period 2020–2022, sourced from the Cyprus Statistical Service (monthly national data) and Eurostat (annual data for other EU countries).
The products were grouped into three main categories: vegetables and melons, fresh fruits, and citrus. Due to the word limit, this paper focuses on one representative product from each category—tomatoes, apples, and lemons, respectively.
For each selected product, a set of indicators was defined and calculated as follows [4]:
- Producer Price (PP) (EUR/kg): The average farm-gate price received by farmers.
- Consumer Price (CP) (EUR/kg): The average retail price paid by consumers.
- Marketing Margin (MM): The absolute difference between CP and PP (MM = CP − PP); it includes marketing costs and intermediaries’ profits.
- Farmer Share (FS): The share of PP in CP: FS = (PP ÷ CP) × 100.
- Percentage Marketing Margin (PMM): The share of MM in CP: PMM = (MM ÷ CP) × 100.
- Percentage Spread (PS): The share of MM in PP: PS = (MM ÷ PP) × 100.
The mean, standard deviation (SD) and coefficient of variation (COV) were calculated to assess price volatility over time. Line graphs were used to visually examine price trends and volatility across time. Correlation analysis examined links between PP, CP, and other indicators, while a comparative analysis with other EU countries provided context for Cyprus’s fresh F&V pricing dynamics.
3. Results and Discussion
The analysis reveals significant price disparities between PP and CP. For instance, during 2020–2022, the average PP for tomatoes was substantially lower than CP, with a MM of EUR 0.93/kg, a PMM of 50.3%, and a PS exceeding 100%, suggesting potential market inefficiencies, such as high intermediary costs. Similar trends were observed for apples and lemons (Table 1).

Table 1.
Price gap indicators for F&V (average monthly prices, 2020–2022).
The FS ranged from 39.3% (lemons) to 49.7% (tomatoes), indicating that more than half of the CP is absorbed by downstream FSC actors, reflecting farmers’ vulnerability [5] that could affect their sustainability, especially if production costs are high.
Moreover, the COV for PP was consistently higher than for CP across all three products, indicating that CPs exhibit lower volatility, especially for apples. This may indicate the role of intermediaries in absorbing part of the price variability or a tendency for CP to adjust more gradually over time.
The correlation between PP and CP was strong and significant for tomatoes and lemons (rs = 0.95, p < 0.01), indicating effective price transmission [6], but with some absorption of volatility by intermediaries, as shown by the lower COV for CP. The correlation for apples was weak and insignificant (rs = 0.18, p > 0.05), which, combined with a low COV for CP (3%) (Table 1), points to weak price transmission and relatively stable CP.
These findings are further supported by the figures below. For example, both PP and CP for tomatoes display substantial fluctuations, with a persistent price gap, indicating consistently high MM (Figure 1). In contrast, CP for apples remain relatively stable over time (Figure 2). This low volatility in CP supports the idea of retailer control over pricing.
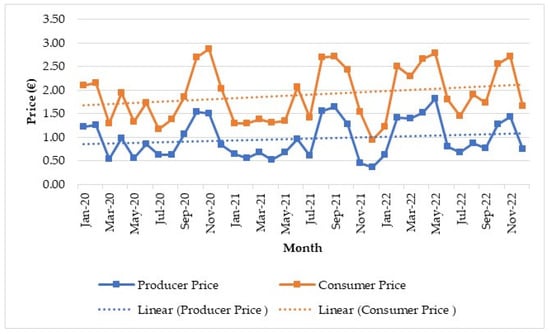
Figure 1.
Producer and consumer prices (EUR/kg) for tomatoes, monthly data, 2020–2022.
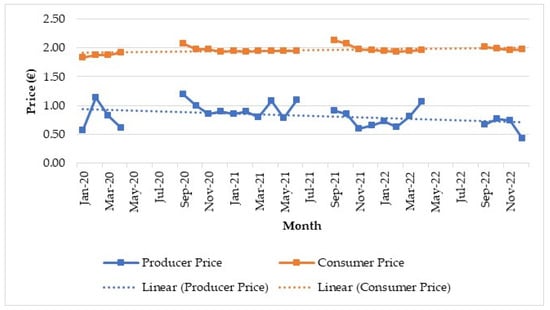
Figure 2.
Producer and consumer prices (EUR/kg) for apples, monthly data, 2020–2022.
The comparative analysis indicates that MMs in Cyprus are generally higher, and FS lower, compared to other EU countries (Table 2; tomatoes). This may reflect structural issues such as small market size, logistical challenges, and weak producer organization. Similar patterns are seen for lemons and apples.
Table 2.
Price gap indicators for tomatoes (annual prices, 2020–2022).
4. Conclusions
The study reveals a substantial and persistent price gap in Cyprus’s fresh F&V supply chain, with PP often representing less than half of CP. While some degree of price transmission exists, high MM might point to structural inefficiencies and imbalances in bargaining power. This appears to be a systemic issue, probably exacerbated by small market size, logistical constraints, and weak producer organization. Producers face high volatility, while consumers encounter more stable but elevated prices. Contributing factors may include information asymmetry, limited price transparency, and high intermediary costs. Policy actions should focus on strengthening producer organizations, enhancing market transparency, supporting short FSCs, and reducing market concentration. Future research will employ econometric modeling to investigate the magnitude, speed, and asymmetry of price transmission across the FSC.
Author Contributions
Conceptualization, A.S. and M.G.; methodology, A.S. and M.G.; validation, A.S. and M.G.; formal analysis, A.S. and M.G.; investigation, A.S. and M.G.; data curation, A.S.; writing—original draft, A.S. and M.G.; writing—review and editing, A.S. and M.G.; visualization, M.G.; supervision, A.S.; project administration, A.S. All authors have read and agreed to the published version of the manuscript.
Funding
This research received no external funding.
Institutional Review Board Statement
Not applicable.
Informed Consent Statement
Not applicable.
Data Availability Statement
The raw data supporting the conclusions of this article will be made available by the authors on request.
Acknowledgments
The authors express their sincere gratitude to the staff of the Statistical Service of Cyprus for providing the raw data on monthly producer and consumer prices.
Conflicts of Interest
The authors declare no conflicts of interest.
References
- Rezitis, A.N.; Pachis, D.N. Investigating the price volatility transmission mechanisms of selected fresh vegetable chains in Greece. J. Agribus. Dev. Emerg. Econ. 2020, 10, 587–611. [Google Scholar] [CrossRef]
- European Commission. Market Transparency in the EU’s Food Supply Chain; Commission Staff Working Document; European Commission: Brussels, Belgium, 2019. [Google Scholar]
- Food and Agriculture Organization of the United Nations. The State of Agricultural Commodity Markets 2022: The Geography of Food and Agricultural Trade: Policy Approaches for Sustainable Development; Food and Agriculture Organization of the United Nations: Rome, Italy, 2022. [Google Scholar] [CrossRef]
- Gardner, B.L. The Farm-Retail Price Spread in a Competitive Food Industry. Am. J. Agric. Econ. 1975, 57, 399–409. [Google Scholar] [CrossRef]
- OECD. Making Better Policies for Food Systems; OECD Publishing: Paris, France, 2021. [Google Scholar] [CrossRef]
- Reziti, I.N. The Price Transmission Process in the Greek Agri-Food Sector: The Case of Fruits and Vegetables; Working Paper in Greek; The Centre for Planning and Economic Research (KEPE): Athens, Greece, 2010; ISBN 978-960-341-089-8. [Google Scholar]
Disclaimer/Publisher’s Note: The statements, opinions and data contained in all publications are solely those of the individual author(s) and contributor(s) and not of MDPI and/or the editor(s). MDPI and/or the editor(s) disclaim responsibility for any injury to people or property resulting from any ideas, methods, instructions or products referred to in the content. |
© 2025 by the authors. Licensee MDPI, Basel, Switzerland. This article is an open access article distributed under the terms and conditions of the Creative Commons Attribution (CC BY) license.