Abstract
Traditional linear models struggle to capture the complex behavior of financial markets. This study revisits RMB exchange rate volatility through a nonlinear perspective based on G-expectation and multifractal theory. Using multifractal detrended fluctuation analysis (MF-DFA), we examine the scaling properties and efficiency of RMB volatility. We further apply multifractal detrended cross-correlation analysis (MF-DCCA) to explore nonlinear linkages among different RMB exchange rate volatilities. Mixing and phase randomization are employed to identify the sources of multifractality. The results reveal that adverse shocks weaken market efficiency and amplify multifractality. Significant cross-correlations are detected across RMB volatilities, with the Hurst exponent and multifractal spectrum indicating persistent long-range dependence and fat-tailed distributions. Moreover, USDCNY volatility exhibits stronger multifractality than other RMB pairs, underscoring its dominant role in volatility transmission. The time-varying Hurst exponent effectively captures nonlinear and memory effects, offering predictive value for exchange rate trends. These findings deepen our understanding of RMB exchange rate dynamics and provide implications for monetary regulation and risk management under uncertainty.
1. Introduction
Economic globalization is an inevitable outcome of contemporary social and economic development []. With the rapid growth of China’s economy, the internationalization of the RMB is intensifying. The RMB’s influence in the global arena is increasing daily, and the scale of RMB settlements is gradually expanding [,]. Data released by the Society for Worldwide Interbank Financial Telecommunication (SWIFT) show that in December 2023, the RMB remained the fourth most active currency globally based on transaction volume, accounting for 4.14%. These phenomena, on one hand, indicate the growing recognition of the RMB in international trade. On the other hand, they suggest that exchange rate fluctuations related to RMB settlements will continue to attract the international community’s attention.
In recent years, due to various factors such as the rapid rise in international trade protectionism and the COVID-19 pandemic, global economic growth has slowed, external risk uncertainties have intensified, and the two-way fluctuations of the RMB exchange rate have increased []. Even small fluctuations in the exchange rate can result in significant economic losses []. Concurrently, China is undergoing a critical period of financial system reform and RMB internationalization. Lahmiri [] posits that the globalization of the economy, the interconnectedness of national markets, and enhanced collaboration in monetary policies have escalated the intricacies of exchange rate fluctuations. This interdependence presents both challenges and opportunities. For academics and policymakers, there is a need to deepen the understanding of RMB exchange rate volatility. Therefore, this study aims to examine the time-varying nature of the correlation between RMB exchange rate fluctuations. It seeks to provide regulatory agencies with a robust basis for decision-making, ensure that the RMB exchange rate remains within a more stable range, support the ongoing internationalization of the RMB, and foster a conducive market environment for the stable and rapid development of China’s economy.
Research on financial market correlations has long relied on the Efficient Market Hypothesis (EMH), but extreme events—such as economic crises, geopolitical tensions, and health emergencies—demonstrate that exchange rate market efficiency is influenced by both internal and external factors [,,,]. This suggests that the relationships in the RMB exchange rate market are nonlinear, and the EMH fails to capture many economic phenomena [,,]. As linear models fall short, nonlinear methods, like fractal theory, offer a better framework to explain persistent and nonlinear market behaviors [,]. Persistent processes in markets indicate deviations from full efficiency [,]. The complexity of modern financial markets, driven by information flow, participants, and diverse investments, leads to phenomena like speculative bubbles and crashes. Econophysics has emerged as a dynamic interdisciplinary field, applying physics methods to uncover features in financial time series that traditional economic theory misses [,]. Studies have revealed complexity features in financial markets, including “fat tails” in return distributions [], volatility clustering, long memory [], strong stochasticity, nonlinear correlations, persistence, and fractal-like or even multifractal effects [,]. Econophysicists advocate for multifractal analysis as a novel method for assessing market risk []. This study applies fractal market theories to analyze RMB exchange rate volatility from a nonlinear perspective.
Recent research has applied the multifractal approach, grounded in the fractal market hypothesis, to explore market efficiency. Fractal theory, introduced by Mandelbrot [], is used to calculate and extract the eigenvalues of time series, a nonlinear method for analyzing the dynamic characteristics of complex phenomena. Compared to single fractal processes, multifractal theory more effectively quantifies the complex volatility features of capital markets, making it widely adopted in research. Kantelhardt et al. [] introduced the MF-DFA method, which has been extensively used to analyze the multifractal properties of financial time series, including stock prices [,], cryptocurrencies [,], exchange rates [,], and other financial variables with multifractal characteristics. The MF-DFA method is also applied in the energy sector. For instance, Khurshid et al. [] used it to study the asymmetric multifractal characteristics and efficiency of renewable energy and technology prices in both international and Chinese markets. Memon et al. [] applied MF-DFA to analyze efficiency changes in the energy, agriculture, and metal markets before and after the onset of the COVID-19 pandemic. Furthermore, Podobnik and Stanley [] integrated DFA with DCCA to examine the long-term cross-correlation between two non-stationary time series.
MF-DCCA was proposed by Zhou [] as an extension of MF-DFA to study the multifractal features between two time series. Since its introduction, the MF-DCCA approach has gained widespread use in investigating the multifractal characteristics between two time series. Wang et al. [] utilized MF-DCCA to investigate the relationship between coal and WTI crude oil, demonstrating that the risks associated with them are not simply averaged or superimposed; rather, they are transmitted and interactively linked. Bentes [] used MF-DCCA to investigate the cross-correlation between gold and financial markets under extreme market conditions. Huang et al. [] employed MF-DCCA to investigate the interdependence between the crude oil market and the equity markets of both importing and exporting nations before and after the onset of the Russia–Ukraine conflict.
Previous research has primarily focused on investigating the fractal structure of financial markets, yet the direct application of multifractal characteristics to exchange rate forecasting remains limited. Some studies suggest that multifractal volatility indices, such as the generalized Hurst index, exhibit correlations with market trends, particularly under extreme market conditions, where fractal properties may serve as indicators of market instability [,,]. The utility of multifractal characteristics in exchange rate forecasting lies in their ability to capture non-stationarity, long memory, and the effects of extreme events. Traditional forecasting methods, which often assume stationarity or weak non-stationarity, struggle to adapt to structural changes induced by policy shifts and global economic events. In contrast, multifractal analysis offers a more effective approach to modeling market complexity and capturing its dynamic nature []. Moreover, the inherent long memory and susceptibility to extreme events in exchange rate markets make multifractal theory particularly well-suited for characterizing long-range dependence and local structural variations [], thereby enhancing predictive accuracy. Building upon these insights, this study examines how multifractal characteristics can be leveraged to improve exchange rate forecasting by constructing multifractal indicators and incorporating them as predictive factors to better capture the intricate dynamics of exchange rate movements.
Previous empirical studies have shown that return time series exhibit multifractal behavior, and recent research has expanded to include volatility time series. Exchange rate volatility, reflecting changes in the returns of foreign exchange assets, is a key measure of foreign exchange risk and significantly impacts both the economy and the financial system. However, no studies have yet used the MF-DCCA method to analyze the cross-correlation of RMB exchange rate volatility. Kyle [] suggests that asset volatility contains more information than the price itself. This study extends existing literature by systematically investigating the multifractal properties of volatility pairs from the top ten RMB exchange rates in the currency basket. The motivation for studying these correlations lies in the need for regulators to monitor whether movements in different RMB exchange rates remain within acceptable limits. If volatilities are correlated, an increase in the volatility of one exchange rate could affect another, either in the same or opposite direction. Given that RMB exchange rate fluctuations often show correlation, which varies with political and economic interactions, this study uses the MF-DCCA method to explore the multifractal intercorrelation of RMB exchange rate volatilities. Additionally, the sources of multifractality in the time series are examined using mixed washout and random phase datasets.
Accurately characterizing volatility in a time series is challenging due to its inherent unpredictability. Traditional models assume that financial asset returns follow a random walk and exhibit a normal distribution. However, returns often display volatility clustering, leptokurtic distributions, and heavy tails [,]. Modeling volatility accurately is crucial for precise estimation and prediction. The depiction of volatility depends on model specifications, parameter estimation, and error management. Additionally, volatility exhibits dynamic features such as clustering, autocorrelation, and asymmetric responses. One of the earliest successful models for volatility was the autoregressive conditional heteroskedasticity (ARCH) model [], marking a milestone in volatility research. Building on this, Bollerslev [] introduced the Generalized Autoregressive Conditional Heteroskedasticity (GARCH) model, which captures the empirical features of volatility. The GARCH model, driven by historical data, has a simple structure and is widely applied in RMB exchange rate analysis [,,]. However, the GARCH model assumes a specific data distribution and uses squared returns to measure volatility, whereas financial markets are influenced by multiple information sources, making them a complex nonlinear system.
Traditional probabilistic systems use a linear expectation framework where variance is unique. However, many problems in fields like statistics, quantum mechanics, and risk management involve non-additive phenomena, prompting a shift towards nonlinear expectations. Recent crises, such as financial downturns and public health emergencies, have highlighted the limitations of traditional risk models and brought Knightian uncertainty into focus [,,]. Nonlinear expectation theory, proposed by Peng [], addresses this uncertainty. Unlike classical probability, where variance is unique, it becomes non-unique in the presence of model uncertainty. Research shows that the nonlinear expectation theory better captures dynamic, real-world phenomena. For example, Epstein and Ji [] applied G-expectation theory to asset pricing under Radner equilibrium, and Bai and Buckdahn [] demonstrated its superior practical performance. This study quantifies volatility using upper variance from G-expectation theory, which accounts for nonlinearity and avoids the assumption of a specific data distribution. The technical roadmap is illustrated in Figure 1.
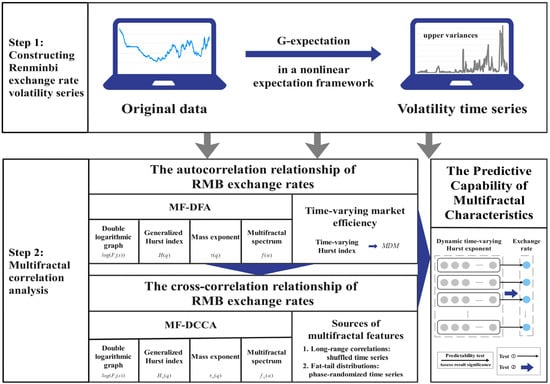
Figure 1.
Framework of Renminbi exchange rate volatility correlation analysis.
This study aims to achieve two key objectives: (a) to examine the stochastic structure, particularly multifractals, and nonlinear cross-correlations among ten RMB exchange rate volatility pairs; and (b) to analyze the time-varying nature of these cross-correlations, with a particular focus on the impact of extreme events on the stochastic processes of RMB exchange rate volatility. In light of these objectives, this study makes three key contributions to the literature. First, this study pioneers the examination of multifractal dynamics in RMB exchange rates and advocates for the substitution of traditional yield series with volatility time series to establish a more robust macroeconomic analysis framework, particularly in addressing the prevalent issue of structural mutations in exchange rate series. Second, drawing on G-expectation theory, this study introduces the concept of variance of random variables under mean uncertainty to quantify the risk associated with RMB exchange rate volatility, thereby offering a novel perspective for risk assessment. Third, leveraging the intrinsic relationship between multifractal properties and exchange rate volatility, this study investigates the predictive efficacy of multifractal indicators in forecasting models and extends the application frontiers of multifractal theory in financial markets.
The remainder of the study is organized as follows: The “Section 2” outlines the upper variance and MF-DCCA methods. The “Section 3” describes the data and presents the basic statistical tests. The “Section 4” applies MF-DFA and MF-DCCA to conduct empirical analyses, quantifying the multifractal characteristics of the cross-relationships between RMB exchange rate volatility series. The “Section 5” presents the study’s conclusions.
2. Methodology
2.1. Upper Variance
In classical probability theory, variance measures the degree to which a random variable deviates from its mean, a concept that is essential in fields such as statistics, economics, and finance [,,]. Unlike linear expectations, G-expectations are nonlinear and defined on real-valued functions, exhibiting properties such as monotonicity, preservation of constants, sublinearity, and positive homogeneity []. The upper variance of the G-normal distribution, which accounts for mean uncertainty, offers a more comprehensive view of risk in financial markets. Thus, this study uses upper variance to model RMB exchange rate volatility and address Knightian uncertainty.
First, we introduce the upper variance of a random variable with mean uncertainty. In the probability space , the variance of a random variable can be defined as
The variance is minimized when . It is natural to use the sublinear expectation rather than the linear expectation in the above equation. For each random variable in the sublinear expectation space, , the upper variance of under is defined as
Let X be a random variable in the sublinear expectation space that satisfies . We can then obtain
If , then
Similarly, if , we can define it as follows:
It is evident that as a function of , is continuous on , thus giving the upper variance a minimum.
The upper variance , as described in Walley [], serves as an upper prediction rather than and can be viewed as a sublinear expectation operating in the linear space of bounded random variables. Walley presents an interpretation of these definitions, suggesting that the upper variance reflects the least price at which a seller is inclined to sell. If has average certainty, is often referred to as the maximum volatility of .
It is evident that the upper and lower variances inherit some fundamental properties from classical variances.
Let be a random variable in the sublinear expectation space for each . We have
2.2. MF-DCCA
The volatility series of the RMB exchange rate market exhibits a complex, nonlinear time series structure that deviates from a normal distribution and demonstrates non-stationary behavior. Traditional statistical methods are insufficient for analyzing these relationships. The MF-DFA method, introduced by Kantelhardt et al. [], is particularly effective in studying non-stationary time series, allowing for the examination and comparison of long-range correlations and multifractal properties between two time series using the q-order Hurst exponent. However, the relationship between two market time series is often more intricate, interconnected, and interdependent. Therefore, this study applies the MF-DCCA method proposed by Zhou [] to analyze the cross-correlation of volatility across the RMB exchange rate market and investigate the risk transmission effects between different RMB exchange rate volatilities.
Step 1: Construct New Time Series
First, two time series of RMB exchange rate volatility are constructed by calculating the upper variance, denoted as and .
Step 2: Equally Spaced Segmentation of Subintervals
Starting from the beginning and end of the time series and , respectively, perform two equally spaced segmentations with length to obtain non-overlapping subsequences. The elements of the v-th subsequence are denoted as and {Y(I_v + t), t = 1, 2, …, s}, where for and for .
Step 3: Calculate Covariance
Fit the local trend of these subsequences using the least squares method to obtain the covariance :
where .
Step 4: Calculate the q-Order Volatility Function
For a fixed value of , compute the q-order covariance function for various sub-interval segmentation lengths .
Step 5: Calculate the Generalized Interaction Correlation Index
If there is a power-law interaction correlation between two time series, the following relationship holds:
where is referred to as the generalized interaction correlation index, which represents the power-law correlation between the two time series.
In particular, MF-DCCA becomes equivalent to MF-DFA when the two sequences are identical, and the generalized interaction correlation index corresponds to the generalized Hurst index . When = 2, this simplifies to the classical Hurst index. If remains constant for all , the sequence is monofractal; otherwise, it is multifractal. For > 0.5, the sequence shows positive persistence, with values closer to 1 indicating stronger persistence. Conversely, .5 indicates inverse persistence, and .5 suggests random changes. When = 2, MF-DFA reduces to DFA, and when sequences differ, MF-DCCA reduces to DCCA.
The generalized interaction correlation index differs from the generalized Hurst index in its interpretation. If varies with , the interaction correlation between the two sequences is multifractal; otherwise, it is unifractal. When 0.5, the sequences show positive persistence, meaning if one increases (or decreases), the other tends to follow the same trend. Conversely, if 0.5, the cross-correlation is antipersistent, meaning one sequence increases (or decreases) while the other tends to move in the opposite direction. Specifically, when 0.5, there is no significant interaction correlation, or it is short-range. For > 0, captures the scaling behavior of large fluctuations, and for < 0, it reflects the scaling behavior of small fluctuations.
Step 6: Calculate the Multifractal Quality Index
The multifractality of the cross-correlation between two sequences can also be characterized by the quality index , which is related to as follows:
If is linear with respect to q, it indicates that the cross-correlation between two sequences exhibits a single fractal structure. Conversely, if shows a nonlinear relationship with , it suggests that the interaction correlation between the sequences has multifractal characteristics. Moreover, a more pronounced nonlinear relationship between and reflects a stronger multifractal nature of the interaction correlation.
Step 7: Calculate the Singularity Index and Multifractal Spectrum
The Legendre transform of Equations (14) and (15) yields the singularity index and the multifractal spectrum :
In multifractal analysis, the singularity index characterizes local fractal properties, with a smaller signifying a higher degree of singularity. A wider multifractal spectrum indicates more pronounced multifractal features.
In the context of MF-DFA, the multifractal characteristics of a sequence can be assessed using the multifractal spectrum . If the plot forms a single-peaked bell shape, the sequence exhibits multifractal properties. If it reduces to a single point, the sequence is monofractal. The degree of multifractality is quantified by the width of the multifractal spectrum and the multifractal intensity . Higher values of these metrics indicate stronger multifractality and greater exposure to complex risks.
Similarly, in MF-DCCA, the plot can be used to determine whether the interaction between two sequences exhibits multifractal correlations. Two fractal statistics are employed to quantify the strength of multifractality: the multifractal spectral width and the multifractal strength . Higher values of these statistics indicate stronger multifractality, suggesting a more complex cross-correlation between the two series and a greater risk-transfer effect.
The selection of key parameters is critical to ensuring the robustness of the model, including the scale size , moment order , and polynomial order used for local detrending. Polynomial orders are applied to eliminate local trends. Following Ihlen [], we set = 2 to achieve a balance between underfitting and overfitting after comparing the multifractal spectra under different polynomial orders. The minimum scale should be sufficiently larger than the polynomial order []. Therefore, we set and , ensuring adequate coverage of both short and long scales, consistent with the recommendations in [,]. According to Lashermes et al. [], the moment order was defined over the range with 21 equally spaced values to comprehensively capture the multifractal characteristics of financial time series.
3. Data
This study constructs an RMB exchange rate market system using daily volatility data from China’s major trading partners. On 21 July 2005, China’s central bank announced the shift to a managed floating exchange rate system, guided by market supply and demand and informed by a basket of currencies. This reform marked a significant step in the marketization of the RMB exchange rate. As the marketization of China’s exchange rate has progressed, the international status of the RMB has risen, accompanied by increased volatility. To comprehensively assess the impact of exchange rates on trade, investment, and the balance of payments, we focus on the top ten RMB exchange rates, which together account for 81.87% of the currency basket. Data from 5 March 2007 to 13 October 2023 is sourced from the Wind database, as shown in Figure A1.
The RMB exchange rate is a complex system characterized by nonlinearity, non-stationarity, and significant volatility, influenced by political, economic, and other multifaceted factors. While variance has a fixed value in classical probability theory, in practice, uncertainty in the mean is more common. This study extends the concept of upper variance within the nonlinear expectation framework to examine the asymmetric volatility of the RMB exchange rate. As shown in Figure A2, the fluctuation trends of various RMB exchange rates differ across periods, with the small gray lines representing the time series of ten RMB exchange rates.
The descriptive statistics of RMB exchange rate volatility are presented in Table 1. As shown in Table 1, the average volatility of the RUBCNY exchange rate is higher than that of other RMB exchange rates and has the largest standard deviation, indicating that RUBCNY exhibits the highest volatility. The skewness coefficients unmistakably indicate that the volatility distributions of all ten RMB exchange rates are significantly right-skewed. The kurtosis coefficients further emphasize that these distributions are characterized by marked right skewness and fat tails. Additionally, the Jarque–Bera statistic compellingly shows that the volatilities of all RMB exchange rates fail to conform to a normal distribution. The ADF and PP test results robustly confirm the stationarity of the volatility series for the ten RMB exchange rates. Lastly, the Ljung–Box Q statistic reveals pronounced autocorrelation in the volatility of all RMB exchange rates.

Table 1.
Descriptive statistics of RMB exchange rate volatility.
4. Empirical Analysis of Multifractal Characteristics
4.1. Multifractal Characteristics of Autocorrelation
This study first examines the fractal characteristics of ten independent time series of RMB exchange rate volatility using MF-DFA analysis. According to relevant studies [], the fractal order q typically ranges between −10 and 10, which is suitable for most cases. Based on this, the value range of q in this study is set to . The analysis results yield ten sequences of RMB exchange rate volatility corresponding to four metrics: the versus the double logarithmic plot of scale , the q-order generalized Hurst exponent , Rennie’s exponent , and the multifractal spectrum .
As illustrated in the upper-left subplot of Figure 2, the volatility function plotted against the logarithmic scale for the exchange rates fits well across all q values ranging from −10 to 10, exhibiting an approximately linear relationship on the log-log scale. This close-to-linear scaling behavior indicates the presence of power-law scaling, a hallmark of long-range correlations. These results confirm that all ten RMB exchange rate volatility series display multifractal characteristics. Moreover, the scaling behavior clearly demonstrates the fractal structure inherent in the volatility series. However, the degree of multifractality differs across the exchange rates, reflecting the distinctive dynamics of each series. For example, the USDCNY exchange rate shows greater volatility and uncertainty compared with the other RMB exchange rate pairs.
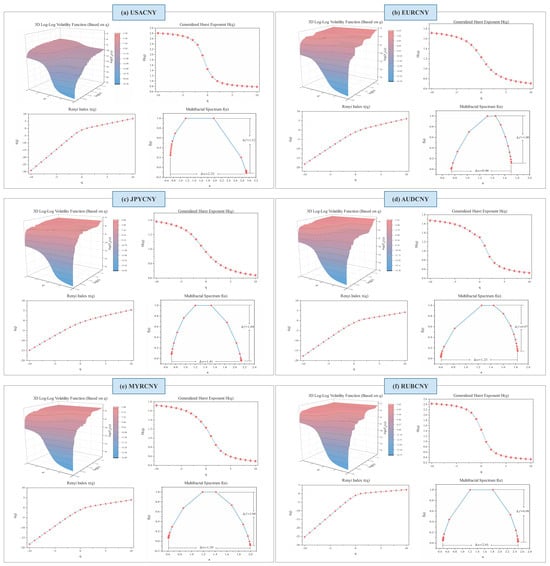
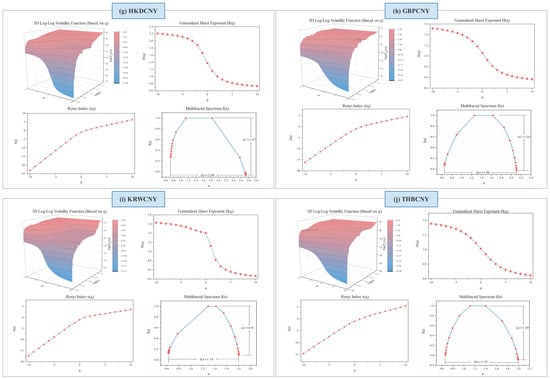
Figure 2.
Multiple fractal spectra of ten RMB exchange rate volatility series based on MF-DFA analysis.
Moreover, as shown in upper-right subplot of Figure 2, the q-order generalized Hurst exponent for the ten RMB exchange rate volatility series demonstrates a distinct nonlinear decreasing trend. The coefficients fluctuate with the q-value, emphasizing the multifractal nature of these volatility series. Notably, the values for all series exceed 0.5, providing strong evidence against the random walk hypothesis. This suggests positive persistence in exchange rate volatility, reflecting long-term memory in market dynamics. Furthermore, a closer examination reveals that is consistently higher for small fluctuations than for large ones across all series, indicating that the market exhibits more pronounced long-memory characteristics during periods of minor volatility. The long-memory effect in RMB exchange rate volatilities highlights the role of long-range correlations in driving multifractal behavior. These insights into the Hurst indices provide a foundation for defining the degree of multifractality as follows:
The degree of multifractality for each exchange rate volatility series is summarized in Table 2. Notably, the USACNY exchange rate exhibits the highest multifractality ( = 2.02), followed by HKDCNY ( = 1.82) and RUBCNY ( = 1.81), indicating significant localized volatility and imbalance. In contrast, EURCNY has the lowest multifractality ( = 0.77), reflecting its lower level of localized volatility. The multifractality of other exchange rate volatilities falls within the mid-range. Multifractal characteristics are often associated with the efficiency of financial markets []. Specifically, USACNY demonstrates stronger multifractal behavior and greater long-term persistence than other exchange rates, regardless of the q-value. These findings suggest that USACNY exhibits the most extreme behavior among the ten exchange rates studied, highlighting inefficiencies in all RMB exchange rate volatilities, with USACNY showing the most pronounced inefficiencies.

Table 2.
Degree of multifractality of RMB exchange rate volatility.
The lower-left subplot of Figure 2 illustrates that the relationship between the Renyi index and is a monotonically increasing convex function, characteristic of multifractal series, which indicates the presence of multifractality in exchange rate fluctuations. Previous studies [] have demonstrated that the strength of a multifractal time series is proportional to the curvature of the mass index curve. The greater the curvature, the stronger the multifractal characteristics of the time series. This curvature is evident across all exchange rate trends, further validating the presence of multifractal behavior in exchange rate fluctuations.
The multifractal spectrum in the lower-right subplot of Figure 2 displays a single peak, confirming the presence of multifractals in the ten exchange rate volatility series. The parameter is used to characterize the strength of the multifractal features across different time series. It reflects the degree of dispersion in the distribution of trends within the financial time series and serves as a measure of the absolute range of the series’ volatility. is calculated using the following formula:
Among the exchange rates, the values for USACNY, RUBCNY, and HKDCNY are higher than those of other exchange rates, indicating a stronger multifractal structure in these volatility series. A higher fractal dimension suggests a more complex and unpredictable pattern of exchange rate volatility, leading to increased uncertainty. This implies that USACNY, RUBCNY, and HKDCNY may be more prone to heightened volatility when subjected to external shocks.
4.2. Temporal Dynamics of Market Efficiency
To assess potential changes in market efficiency over time, this study incorporates the time-varying Hurst index to construct a Market Defect Measure (MDM) for the RMB exchange rate volatility series. Following the work of Cajueiro and Tabak [], rolling window analysis has become a popular approach for uncovering the time-varying dynamics of financial variables and assessing the potential effects of external events. According to Wang et al. [], in efficient markets, all forms of volatility should exhibit random walk behavior. By considering both large and small fluctuations, we define the MDM as follows:
In this context, the scaling indices and are used to represent small and large fluctuations, respectively. The market is considered efficient if the MDM value approaches 0, while a large MDM value indicates market inefficiency.
Table 3 presents the efficiency rankings of RMB exchange rates over the entire period. The observed differences in efficiency can be attributed to the varying levels of China’s economic and trade relationships with different countries, a factor investors should consider when allocating assets and assessing portfolio risks. AUDCNY and KRWCNY exhibit the lowest MDM values, indicating they are the most efficient exchange rates, while USACNY ranks the least efficient. The higher MDM values for USACNY may reflect herding behavior in the forex market, suggesting higher volatility and instability in its efficiency, making it susceptible to external shocks. Despite this, USACNY remains inefficient, offering significant investment opportunities in the future.

Table 3.
Ranking of the efficiency of RMB exchange rate fluctuations.
Our sample period encompasses all cycles of the RMB, including the recent NKP epidemic. To capture the time-varying nature of MDM and account for potential structural changes, we compute a rolling window defect measure using a fixed window of 250 observations with a step size of 1 day. This approach is consistent with the methodologies employed by Wang et al. [], Wang et al. [], Liu & Wan [], Lee et al. [], Ruan et al. [], and Guo et al. []. However, employing larger window sizes can obscure the effects of particular events on short-term market fluctuations. Seasonal influences and economic cycles can diminish the localized accuracy of the calculated statistics, rendering them ineffective in capturing short-term developments. Conversely, smaller window sizes result in more pronounced fluctuations in the scaling indices.
Figure 3 illustrates the trend evolution of the MDM for RMB exchange rate volatility with a fixed window length of 250 days, revealing that different exchange rates exhibit varying time-varying efficiencies. In this study, we mark the occurrence of major events likely to impact RMB exchange rate volatility with black lines on the timeline. Observing the time evolution of the MDM, it becomes evident that different events cause distinct trends in MDM movements.
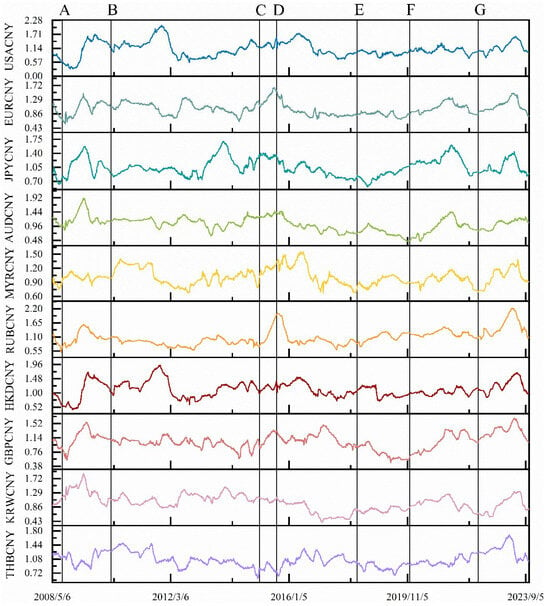
Figure 3.
Evolution of MDM with window shift based on time-varying Hurst index construction (the length of the window period is fixed at 250 days). The top section of the chart is annotated with significant events that have occurred over time, potentially influencing the volatility of the RMB exchange rate. Each event is represented by a distinct letter: (A) Global financial crisis; (B) European debt crisis; (C) Chinese stock market crash; (D) 8·11 RMB exchange rate reform; (E) China-U.S. trade war; (F) COVID-19 pandemic; (G) Russia–Ukraine war.
For instance, the global financial crisis of 2008 triggered a severe economic downturn and extreme turbulence in international financial markets, placing substantial internal and external pressure on the RMB exchange rate. Despite timely and decisive interventions by the Chinese government, these pressures amplified the currency’s volatility. Similarly, the Eurozone debt crisis starting in 2010 had widespread effects on the global economy, including the RMB exchange rate. Increased capital liquidity, shifts in forex market sentiment, and policy responses contributed to greater volatility. The dramatic fluctuations in the Chinese stock market in 2015, including sharp declines and a loss of market confidence, likely led to capital outflows, further straining the exchange rate. The U.S.–China trade war in 2018, with tariffs and trade barriers, impacted China’s exports and foreign trade revenues, escalating uncertainty in the global economy and increasing concerns among investors. The COVID-19 pandemic, which began in late 2019, severely affected the global economy, while the Russia–Ukraine conflict in 2022 disrupted global energy prices, supply chains, and capital flows, contributing to the instability and volatility of the RMB exchange rate.
These major events generally led to an upward trend in the MDM values for most RMB exchange rate volatilities, indicating decreased market efficiency. However, the “811 exchange rate reform” introduced in 2015, which aimed to increase the market’s role in determining the exchange rate, allowed the RMB to more effectively respond to multilateral supply and demand dynamics in the global market. This reform made the RMB more flexible, stable, and resilient, leading to a gradual decline in the MDM values for most RMB exchange rates, reflecting an improvement in market efficiency. In summary, the analysis shows that shocks from extreme events, particularly adverse ones, often lead to reduced market efficiency.
Overall, the MDM values for USACNY and HKDCNY exchange rates are higher than those of other RMB exchange rates. This is primarily due to the Hurst index remaining significantly above 0.5, even during large-scale fluctuations. Since the Hong Kong dollar is pegged to the U.S. dollar at a fixed exchange rate, further analysis focuses exclusively on USACNY. A strong long-memory effect is observed in USACNY, evident not only in small fluctuations but also in large ones, consistent with the previous section’s analysis. Overall, the results from the rolling window framework indicate that RMB exchange rate volatility exhibits long-term memory, with varying degrees over time.
To enhance robustness, we also adjusted the length of each window to 175 working days [] and presented the results graphically in Figure A3. The results are consistently comparable, suggesting that the conclusions drawn from this study are trustworthy.
4.3. Multifractal Properties of Cross-Correlation
Exchange rate fluctuations play a crucial role in shaping trade and investment in the real economy, which inherently involves multiple currencies and international interactions. Consequently, significant interdependencies and interactions exist among various RMB exchange rates. Qualitative assessments of cross-correlation between exchange rate time series are thus critical for this study. Investors and policymakers should regard the two markets as interconnected entities; focusing on one while neglecting the other can lead to a biased understanding of the overall dynamics. However, this relationship is not directly observable due to the differing development stages of RMB exchange rates and external environmental influences. To address this, the study further explores the use of the MF-DCCA method, alongside MF-DFA, to quantify the nonlinear inter-correlation between time series, offering deeper insights into the nonlinear dynamics of RMB exchange rate volatility.
First, we present the relationship between and for different q values. As illustrated in Figure A4, the fluctuation functions of all RMB exchange rate pairs increase with the segment scale s, demonstrating clear power-law behavior and long-range cross-correlations among the ten RMB exchange rate pairs. More specifically, the fluctuation–scale plots in the log–log plane exhibit an approximately linear pattern for all q values ranging from −10 to 10, confirming that the scaling relationship defined in Equation (12) holds empirically. Moreover, the slopes gradually decrease as increases, indicating pronounced multifractality in the exchange rate volatilities. This suggests that the volatilities are highly sensitive to each other’s variations and exhibit strong cross-correlated dynamics.
For multifractal behavior, the scalar function varies with . If it remains constant, the behavior is unifractal. As shown in Figure 4a–j, decreases as changes, indicating clear multifractal characteristics across all RMB exchange rate volatility pairs. RMB exchange rate volatility displays strong persistence, especially with negative values, as reflected by the generalized Hurst index. Moreover, all RMB exchange rate volatility pairs have values exceeding 0.5, signaling positive persistence: when volatility in one RMB exchange rate series rises, it often triggers increased volatility in another. Empirical results show that the Hurst exponent calculated from volatility series may exceed 1 in certain cases, a phenomenon also observed in previous studies [,,,]. This outcome can be attributed to the fact that volatility, as a second-order process of price changes, typically exhibits pronounced volatility clustering and state persistence. When such characteristics dominate, the scaling behavior may display “super-persistence,” causing the estimated Hurst exponent to surpass its theoretical upper bound. In the context of the RMB exchange rate, this super-persistence reflects the lagged and self-reinforcing nature of volatility adjustments, where external shocks are amplified and prolonged by heterogeneous agent behaviors, policy interventions, and cross-border liquidity differences, resulting in a much slower dissipation of volatility and statistically abnormal persistence.
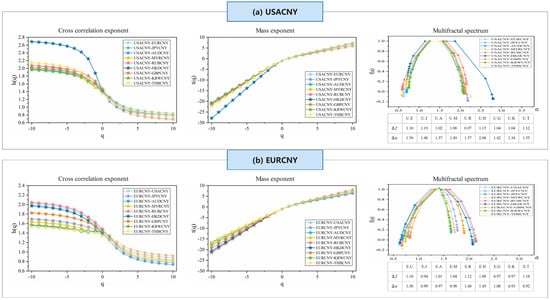
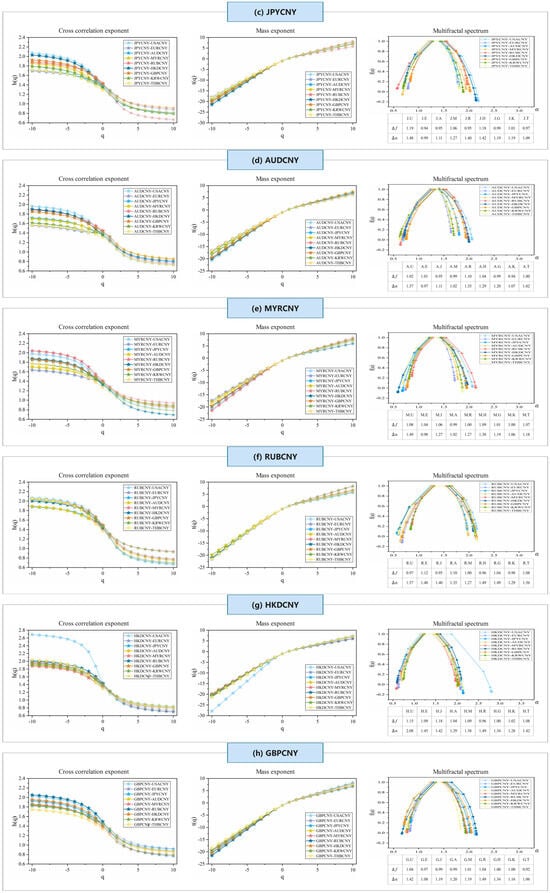
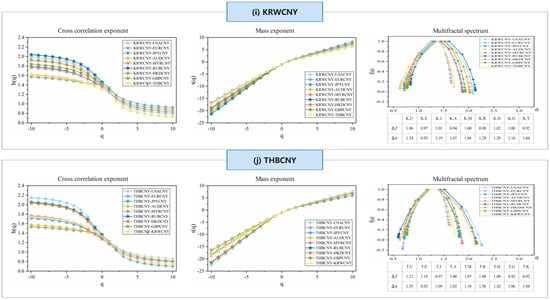
Figure 4.
Multiple fractal spectra of ten pairs of RMB exchange rate volatility series based on MF-DCCA analysis. Cross Correlation Exponent: Shows the cross-correlation exponent, indicating the strength of statistical dependence between volatility series of different RMB exchange rate pairs; Mass Exponent: Displays the mass exponent, characterizing the multifractal nature and distribution of singularities in the volatility series; Multifractal Spectrum: Illustrates the multifractal spectrum, revealing the degree of multifractality and variability across the exchange rate volatility series. (a) USACNY; (b) EURCNY; (c) JPYCNY; (d) AUDCNY; (e) MYRCNY; (f) RUBCNY; (g) HKDCNY; (h) GBPCNY; (i) KRWCNY; (j) THBCNY.
Our analysis also shows that, for any given , the generalized Hurst index for USACNY pairs consistently exceeds that of other RMB exchange rate pairs, indicating stronger positive persistence in the USACNY pairs. This likely stems from the U.S. dollar’s substantial influence as the primary global reserve currency, where fluctuations in the USACNY series significantly impact other RMB exchange rates. In today’s interconnected global economy, substantial changes in the USACNY rate can drive reassessments of global trade and capital flows, indirectly influencing other RMB exchange rates through various channels. Despite China’s role as a major trading nation, a relatively small portion of its international trade and financial transactions are conducted in currencies other than the U.S. dollar, resulting in lower liquidity for non-USD RMB pairs in the global forex market. Additionally, regulators are able to quickly access information and implement measures to counter large fluctuations, thus providing stronger resilience against persistent volatility.
Meanwhile, this study employs the best-fitting model (In this study, the EGARCH(1,1) model based on the skew-t distribution was selected as the optimal solution from the GARCH family of models. The selection process and fitness verification have been explained in the reply section.) within the GARCH family to estimate the volatility of the RMB exchange rate and subsequently calculate the Hurst exponent. As illustrated in Figure A5, the Hurst exponent derived from the volatility series exhibits a value range and dynamic pattern largely consistent with those of the original series, thereby confirming the robustness of the results.
Furthermore, Table 4 shows the values of for RMB exchange rate volatility as changes from −10 to 10. reflects the strength of the correlation between the time series pairs, with larger values indicating stronger correlations. We observe that, within the given range of -values, the values for the USACNY series pairs are generally larger than those for other RMB exchange rate series, followed by RUBCNY. This suggests that the volatility of these series exhibits greater fluctuations compared to other RMB exchange rate volatilities.

Table 4.
The intensity of the multiple fractal spectrum between pairs of RMB exchange rate volatility series .
The presence of multifractals is also confirmed by the Renyi index and the multifractal spectrum shown in Figure 4. The value of exhibits a nonlinear relationship and is contingent upon . The multifractal spectrum observed in these markets changes in relation to , further validating the presence of multifractal features. Some scholars, such as Ivanov et al. [], have shown that the curvature of the quality index curve is directly related to the correlation between pairs of time series. The greater the curvature of the mass index curve, the stronger the correlation between the time series pairs. Additionally, a larger difference in the extreme values of suggests more complex local fluctuations within the time series. The spectrum can also reflect the trend of relative highs and lows and the manner of fluctuation. As shown in panel (c), the volatility of the USACNY series pairs is relatively large, while that of the AUDCNY series pairs is relatively small.
The earlier analysis of the generalized Hurst exponent and the multifractal spectrum offers merely a qualitative insight into multifractality. To effectively quantify the degree of multifractality, a quantitative analysis is necessary. The disparity between the highest and lowest singularity values () offers an estimate of the range of variation in the fractal pattern. Since represents the frequency ratio of maximum to minimum fluctuations, a positive value suggests that maximum fluctuations are more likely than minimum fluctuations. The values for all pairs of RMB exchange rate series are around 1, which is significantly larger than 0.
Additionally, we calculate the width of the multifractal spectrum . A broader spectrum signifies a greater degree of multifractality. Among the values for different pairs of RMB exchange rate volatility series, USACNY and RUBCNY exhibit higher values, implying that these two RMB exchange rates demonstrate a stronger degree of multifractality, along with greater complexity and higher volatility risk. The reasons for these stronger outcomes are as follows: a. USACNY: USD/CNY is one of the most heavily traded currency pairs globally. High liquidity and substantial trading activity can generate complex price dynamics, contributing to the market’s complexity and multifractal nature. b. RUBCNY: This outcome may be attributed to the outbreak of the Russia–Ukraine conflict in February 2022. The war and the resulting international sanctions, along with political and economic uncertainty, had a significant impact on RUBCNY, mainly through spillover effects on other RMB exchange rates by affecting Russia’s economic stability, external terms of trade, and international investment flows.
In conclusion, the analysis of the entire sample reveals that the cross-correlations among RMB exchange rate volatilities display pronounced multifractal traits. Notably, the USACNY pair shows a higher degree of multifractality, shaped by the overall market conditions.
4.4. Exploration of Multifractal Feature Driving Mechanisms
Financial time series, including futures, stock indices, interest rates, and exchange rates, exhibit multifractality, largely due to long-range temporal correlations and thick-tailed distributions [,,]. To disentangle the sources of multifractality for each time series pair [,,,], we construct both mix-washed and phase-randomized surrogate series. For the mix-washed series, we shuffle an index array of the original data and reorder the observations accordingly, effectively removing temporal dependencies. This shuffling procedure is repeated multiple times to ensure robustness. For the phase-randomized series, we generate a Gaussian-distributed sequence, which is then phase-randomized and reordered, allowing us to examine the influence of phase randomization on the multifractal properties.
Following the above procedure, we first compute the inter-correlation generalized Hurst exponent and then . From Figure A6 and Figure A7, we observe that the phase-randomized time series pairs are free of cross-correlation, while all the remaining pairs exhibit multifractality. The values for all the mix-washed RMB exchange rate volatility series pairs are slightly larger than 0.5, but much smaller than those of the original series pairs, indicating that the mix-washed series pairs become more weakly persistent. In contrast, the values for the phase-randomized time series pairs are very close to 0.5, indicating a lack of interaction correlation. The values of and for the original, mix-washed, and phase-randomized time series pairs are presented in Table 5. To achieve reliable outcomes, we take the mean of 50 replicated values for both the mix-washed and phase-randomized time series.

Table 5.
Multifractality of original, shuffled, and phase-randomized series of RMB exchange rate volatility.
We examine the origins of multifractality in two pairs of sequences by comparing the multifractal spectra of the original, mix-washed, and phase-randomized series. Using MF-DCCA, as presented in Table 5, we quantify the strength of multifractality across these variants. The results indicate that the mix-wash procedure largely eliminates multifractality. Following phase randomization, the resulting series pairs generally exhibit only weak cross-correlation or short-range cross-correlation. These findings suggest that long-range temporal correlations constitute the primary source of multifractality in these series pairs, while heavy-tailed distributions play a secondary, supporting role.
5. Further Analysis: Predictive Value and Implications of Multifractal Effects
Using the ARX(1) model, we regress the RMB exchange rate on the one-period lagged dynamic Hurst index as an exogenous variable. Table 6 reports the forecasting results for ten such indices, revealing their significant impact on the RMB exchange rate and strong predictive power. Different exchange rates exhibit distinct correlations with the Hurst index, suggesting that market fluctuations are shaped by diverse factors, leading to inconsistencies in their relationships. Notably, USACNY, EURCNY, AUDCNY, and GBPCNY are most affected, likely due to the dominant role of Europe and the United States in the global economy. Their exchange rates are more sensitive to economic turbulence, reflecting influences from global risk appetite, capital flows, and macroeconomic conditions.

Table 6.
Forecasting Performance of the Dynamic Hurst Index in RMB Exchange Rate Prediction Using the ARX(1) Model.
To assess the predictive power of the dynamic Hurst index, we conducted a Mantel test to examine its correlation with various exchange rates (Figure 5). The results indicate a strong Pearson correlation among the ten currency pairs against the RMB, with RUBCNY and MYRCNY reaching 0.93, reflecting a synchronized trend, while AUDCNY and HKDCNY exhibit some negative correlation. The time-varying Hurst index matrix captures the long-term memory characteristics of currency markets and their evolution across different time windows, where dark orange lines denote strong long-term dependence and green lines indicate weak correlations. Structural variations in these connections suggest that the long-term memory of the foreign exchange market is dynamic, influenced by market conditions, policy shifts, and risk appetite. Additionally, subtle differences exist in the internal relationships among different exchange rates’ long-term memory characteristics. These findings confirm that the Hurst index not only reflects long-term market dependence but also holds predictive significance.
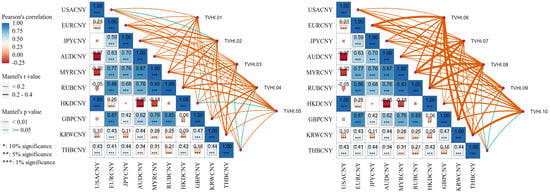
Figure 5.
Correlation Analysis of the Dynamic Hurst Index with RMB Exchange Rates Using the Mantel Test.
Based on the above analyses, we find that the dynamic time-varying Hurst index is crucial for forecasting the RMB exchange rate. It captures exchange rate nonlinearity and long-term dependence, revealing distinct responses, especially in major European and U.S. currencies. Its long-term memory and nonlinearity shape volatility, improving predictability. Strong long-term memory makes Hurst index changes effective signals, enhancing exchange rate forecasting.
6. Conclusions
This study investigates the volatility dynamics of the RMB exchange rate through a multifractal and quantitative framework. Specifically, we introduce the upper variance of random variables under mean uncertainty as a risk measure, particularly when the family of probability measures is constrained. Using MF-DFA, we first analyze the RMB exchange rate volatility series and identify long-range correlations and pronounced multifractal characteristics across all series. To further evaluate market efficiency, we construct an MDM model based on a time-varying Hurst index, revealing that RMB exchange rate efficiency is highly sensitive to external shocks, with adverse events frequently triggering efficiency declines. Employing MF-DCCA, we examine interdependencies among RMB exchange rate volatility pairs and observe strong multifractal features, suggesting that risk interactions within cross-correlated pairs evolve dynamically rather than simply aggregating. A comparative analysis of multifractal spectra indicates that the USDCNY pair exhibits the highest volatility and multifractality, highlighting its substantial influence on other RMB exchange rates and the need for targeted regulatory oversight. To explore the origins of multifractality, we apply mix-washing and phase randomization techniques, revealing that long-range correlations are the primary driver of multifractality in RMB exchange rate volatility pairs, while heavy-tailed distributions also contribute to their interdependencies. Finally, employing the ARX(1) model and the Mantel test, we demonstrate that the dynamic time-varying Hurst index effectively captures the nonlinear and long-term dependencies of exchange rate fluctuations, reinforcing its role as a key predictive factor in RMB exchange rate forecasting.
The above conclusions help to understand the non-linear dependence and potential dynamics between China’s RMB exchange rates and can also provide a basis for investors and regulators to make decisions. For investors, since different RMB exchange rate volatility series pairs do not present the same multiple fractal characteristics, market participants should fully observe and understand different market trends and make reasonable investments according to their risk preferences when making investment decisions. For regulators, they should focus on the USACNY while closely monitoring the RUBCNY, which has been more volatile recently, to guard against risk resonance triggered by major crises or extreme events. By utilizing the predictive properties of the time-varying Hurst Index, potential risks triggered by the market environment, policy changes and global economic turbulence can be identified earlier, thus improving the dynamic monitoring system of RMB exchange rate uncertainty and enhancing the flexibility of economic policy adjustments, and effectively preventing systematic transmission of cross-exchange rate risks.
Author Contributions
Conceptualization, W.Z. and Z.H.; methodology, W.Z.; software, W.Z.; validation, Z.H.; formal analysis, W.Z.; investigation, Z.H.; resources, Z.H.; data curation, Z.H.; writing—original draft preparation, W.Z.; writing—review and editing, Z.H.; visualization, W.Z.; supervision, Z.H.; project administration, Z.H.; funding acquisition, Z.H. All authors have read and agreed to the published version of the manuscript.
Funding
This research was funded by the National Natural Science Foundation of China, grant number 72273032.
Data Availability Statement
Restrictions apply to the availability of these data. The data used in this study were obtained from the Wind Database (https://www.wind.com.cn/) and are available from the authors with the permission of Wind Information Co., Ltd.
Conflicts of Interest
The authors declare no conflicts of interest.
Abbreviations
The following abbreviations are used in this manuscript:
| MF-DFA | Multifractal Detrended Fluctuation Analysis |
| MF-DCCA | Multifractal Detrended Cross-correlation Analysis |
Appendix A
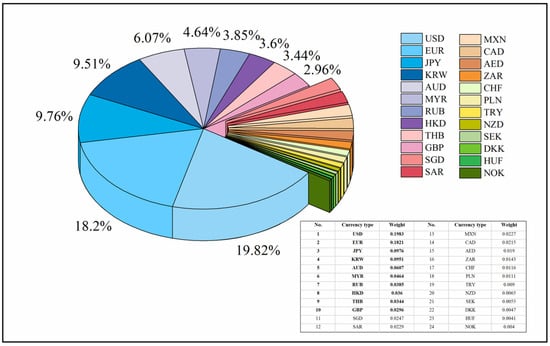
Figure A1.
CFETS RMB Exchange Rate Index Currency Basket Weights for 2023. Source: China Money Network.
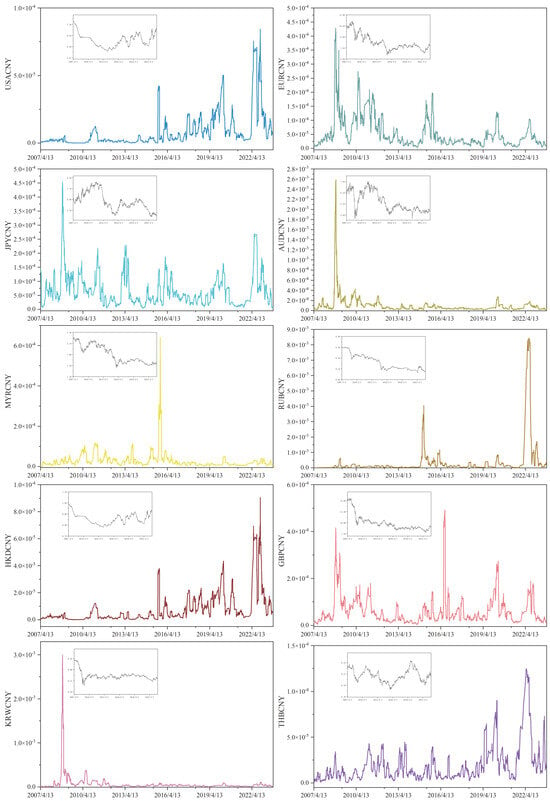
Figure A2.
RMB exchange rate volatility using upper variance statistics.
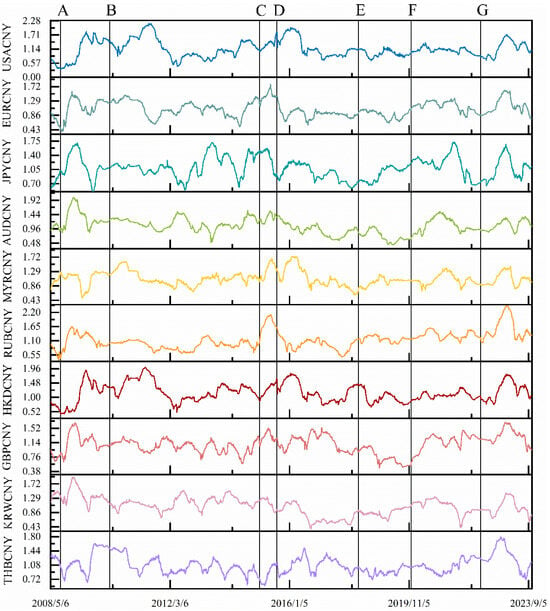
Figure A3.
Evolution of MDM with window shift based on time-varying Hurst exponent construction (the length of the window period is fixed at 175 days). The top section of the chart is annotated with significant events that have occurred over time, po-tentially influencing the volatility of the RMB exchange rate. Each event is represented by a distinct letter: (A) Global financial crisis; (B) European debt crisis; (C) Chinese stock market crash; (D) 8·11 RMB exchange rate reform; (E) China-U.S. trade war; (F) COVID-19 pandemic; (G) Russia–Ukraine war.
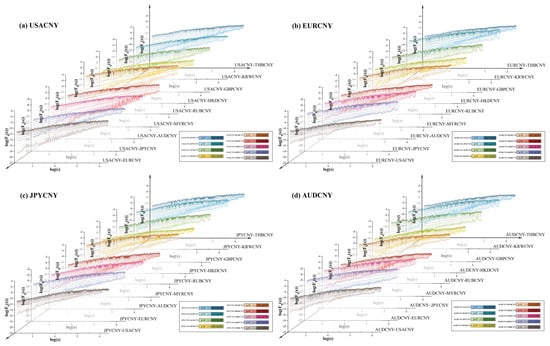
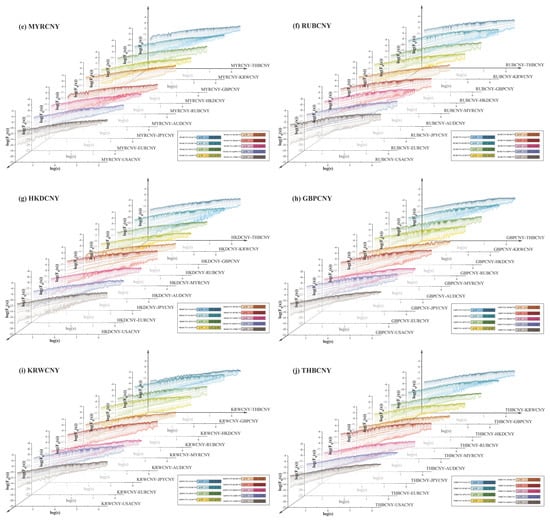
Figure A4.
Double-logarithmic plots of fluctuation functions between RMB exchange rate volatility series. Each sub-figure represents one exchange rate and illustrates its fluctuation function relationships with the remaining nine. The color legend identifies the specific currency pairs compared in each panel, with colors transitioning from light to dark corresponding to values ranging from 10 to –10.
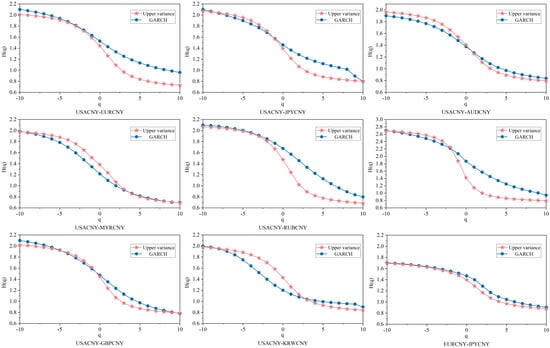
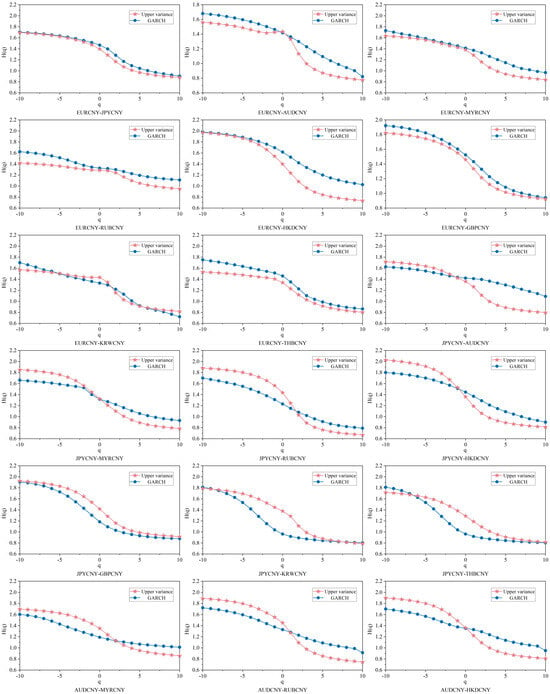
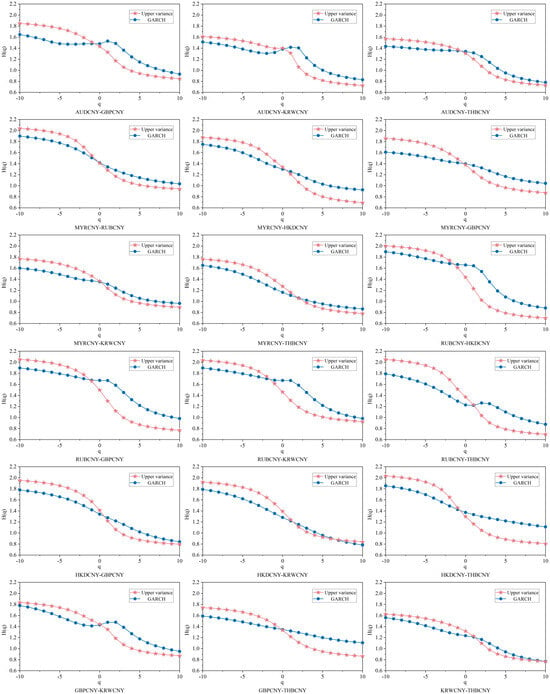
Figure A5.
Comparison of Hurst exponents based on different volatility measures.
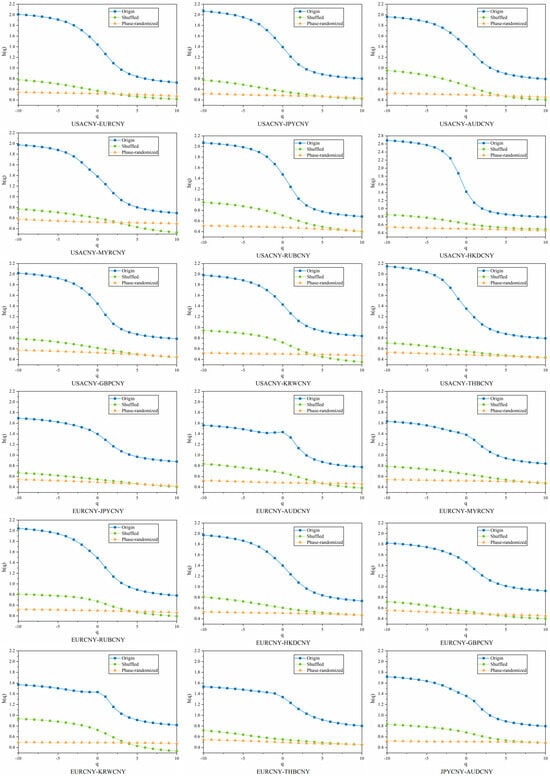
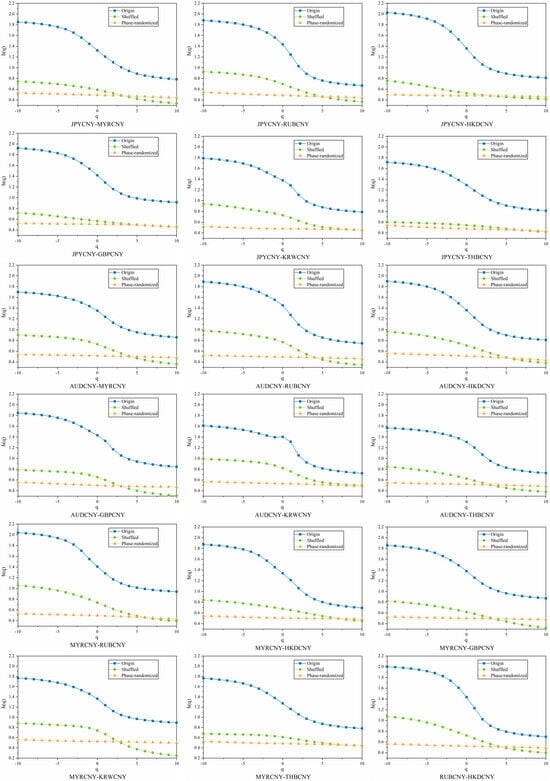
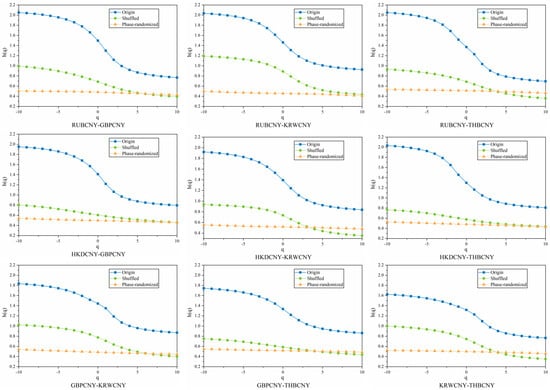
Figure A6.
Generalized Hurst Index with Raw, Blended, and Phase Randomization for Different Pairs of RMB Exchange Rate Fluctuation Sequences.
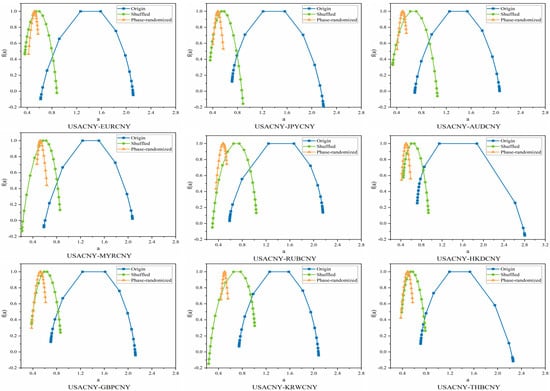
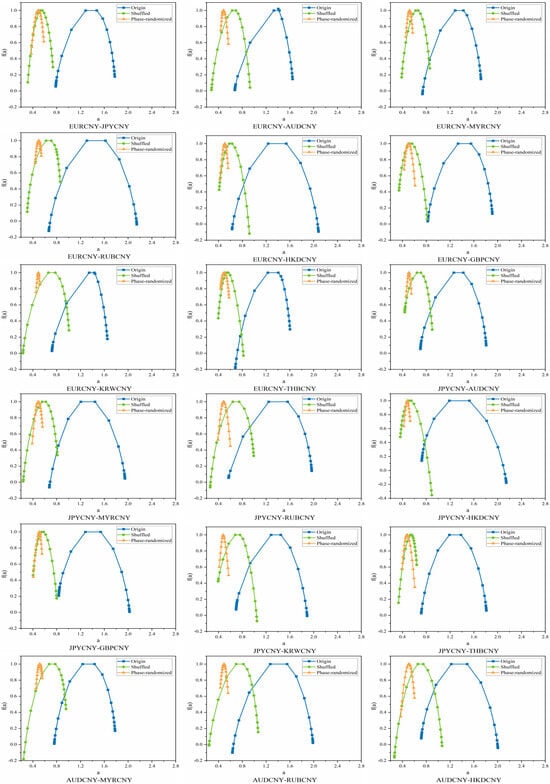
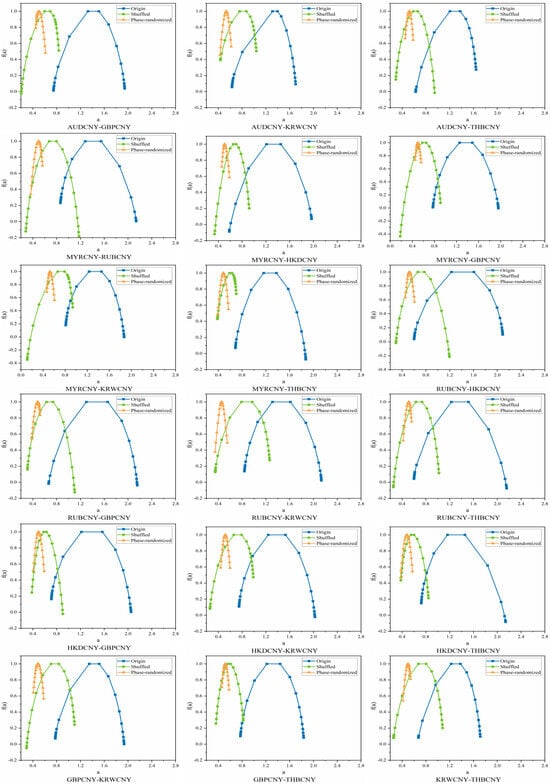
Figure A7.
Multiple fractal spectra of original, blended and phase-randomized pairs of different RMB exchange rate fluctuation series.
References
- Liang, F.; Zhang, H.; Fang, Y. The analysis of global RMB exchange rate forecasting and risk early warning using ARIMA and CNN model. J. Organ. End User Comput. (JOEUC) 2022, 34, 1–25. [Google Scholar] [CrossRef]
- Cheung, Y. A decade of RMB internationalisation. Econ. Polit. Stud. 2023, 11, 47–74. [Google Scholar] [CrossRef]
- Cheung, Y.; Hui, C.; Tsang, A. The RMB central parity formation mechanism: August 2015 to December 2016. J. Int. Money Financ. 2018, 86, 223–243. [Google Scholar] [CrossRef]
- He, Q.; Wang, W.; Yu, J. Exchange rate co-movements and corporate foreign exchange exposures: A study on RMB. Int. Rev. Financ. Anal. 2023, 90, 102831. [Google Scholar] [CrossRef]
- Mitra, S.; Karathanasopoulos, A.; Sermpinis, G.; Dunis, C.; Hood, J. Operational risk: Emerging markets, sectors and measurement. Eur. J. Oper. Res. 2015, 241, 122–132. [Google Scholar] [CrossRef]
- Lahmiri, S. Modeling and predicting historical volatility in exchange rate markets. Phys. A 2017, 471, 387–395. [Google Scholar] [CrossRef]
- Yu, X.; Li, Y.; Wang, X. RMB exchange rate forecasting using machine learning methods: Can multimodel select powerful predictors? J. Forecast. 2024, 43, 644–660. [Google Scholar] [CrossRef]
- Narayan, P.K. Understanding exchange rate shocks during COVID-19. Financ. Res. Lett. 2022, 45, 102181. [Google Scholar] [CrossRef]
- Li, K.; Devpura, N.; Cheng, S. How did the oil price affect Japanese yen and other currencies? Fresh insights from the COVID-19 pandemic. Pac.-Basin Financ. J. 2022, 75, 101857. [Google Scholar] [CrossRef]
- Keddad, B.; Sato, K. The influence of the renminbi and its macroeconomic determinants: A new Chinese monetary order in Asia? J. Int. Financ. Mark. Inst. Money 2022, 79, 101586. [Google Scholar] [CrossRef]
- Long, S.; Zhang, M.; Li, K.; Wu, S. Do the RMB exchange rate and global commodity prices have asymmetric or symmetric effects on China’s stock prices? Financ. Innov. 2021, 7, 48. [Google Scholar] [CrossRef]
- Liu, T.; Lee, C. Exchange rate fluctuations and interest rate policy. Int. J. Financ. Econ. 2022, 27, 3531–3549. [Google Scholar] [CrossRef]
- Liu, J. Impact of uncertainty on foreign exchange market stability: Based on the LT-TVP-VAR model. China Financ. Rev. Int. 2021, 11, 53–72. [Google Scholar] [CrossRef]
- Ruan, Q.; Zhang, S.; Lv, D.; Lu, X. Financial liberalization and stock market cross-correlation: MF-DCCA analysis based on Shanghai-Hong Kong Stock Connect. Phys. A 2018, 491, 779–791. [Google Scholar] [CrossRef]
- Guo, Y.; Yao, S.; Cheng, H.; Zhu, W. China’s copper futures market efficiency analysis: Based on nonlinear Granger causality and multifractal methods. Resour. Policy 2020, 68, 101716. [Google Scholar] [CrossRef]
- Yao, C.; Mo, Y.; Zhang, Z. A study of the efficiency of the Chinese clean energy stock market and its correlation with the crude oil market based on an asymmetric multifractal scaling behavior analysis. N. Am. Econ. Financ. 2021, 58, 101520. [Google Scholar] [CrossRef]
- Adarsh, S.; Nourani, V.; Archana, D.S.; Dharan, D.S. Multifractal description of daily rainfall fields over India. J. Hydrol. 2020, 586, 124913. [Google Scholar] [CrossRef]
- Abdullah, M.; Chowdhury, M.A.F.; Sulong, Z. Asymmetric efficiency and connectedness among green stocks, halal tourism stocks, cryptocurrencies, and commodities: Portfolio hedging implications. Resour. Policy 2023, 81, 103419. [Google Scholar] [CrossRef]
- Aslam, F.; Aziz, S.; Nguyen, D.K.; Mughal, K.S.; Khan, M. On the efficiency of foreign exchange markets in times of the COVID-19 pandemic. Technol. Forecast. Soc. Change 2020, 161, 120261. [Google Scholar] [CrossRef]
- Herrera, R.; Rodriguez, A.; Pino, G. Modeling and forecasting extreme commodity prices: A Markov-Switching based extreme value model. Energy Econ. 2017, 63, 129–143. [Google Scholar] [CrossRef]
- Lahmiri, S.; Uddin, G.S.; Bekiros, S. Nonlinear dynamics of equity, currency and commodity markets in the aftermath of the global financial crisis. Chaos Solitons Fract. 2017, 103, 342–346. [Google Scholar] [CrossRef]
- He, L.; Chen, S. Multifractal detrended cross-correlation analysis of agricultural futures markets. Chaos Solitons Fract. 2011, 44, 355–361. [Google Scholar] [CrossRef]
- Kristoufek, L.; Vosvrda, M. Commodity futures and market efficiency. Energy Econ. 2014, 42, 50–57. [Google Scholar] [CrossRef]
- Wątorek, M.; Drożdż, S.; Kwapień, J.; Minati, L.; Oświęcimka, P.; Stanuszek, M. Multiscale characteristics of the emerging global cryptocurrency market. Phys. Rep. 2021, 901, 1–82. [Google Scholar] [CrossRef]
- Mandelbrot, B.B. A multifractal walk down Wall Street. Sci. Am. 1999, 280, 70–73. [Google Scholar] [CrossRef]
- Kantelhardt, J.W.; Zschiegner, S.A.; Koscielny-Bunde, E.; Havlin, S.; Bunde, A.; Stanley, H. Multifractal detrended fluctuation analysis of nonstationary time series. Phys. A 2002, 316, 87–114. [Google Scholar] [CrossRef]
- Fu, X.; Gao, X.-L.; Shan, Z.; Ma, Y.-J.; Jiang, Z.-Q.; Zhou, W.-X. Multifractal characteristics and return predictability in the Chinese stock markets. Ann. Oper. Res. 2023, 352, 415–440. [Google Scholar] [CrossRef]
- Saâdaoui, F. Segmented multifractal detrended fluctuation analysis for assessing inefficiency in North African stock markets. Chaos Solitons Fract. 2024, 181, 114652. [Google Scholar] [CrossRef]
- Telli, Ş.; Chen, H. Multifractal behavior in return and volatility series of Bitcoin and gold in comparison. Chaos Solitons Fract. 2020, 139, 109994. [Google Scholar] [CrossRef]
- Khuntia, S.; Pattanayak, J.K. Adaptive long memory in volatility of intra-day bitcoin returns and the impact of trading volume. Financ. Res. Lett. 2020, 32, 101077. [Google Scholar] [CrossRef]
- Shahzad, S.J.H.; Hernandez, J.A.; Hanif, W.; Kayani, G.M. Intraday return inefficiency and long memory in the volatilities of forex markets and the role of trading volume. Phys. A 2018, 506, 433–450. [Google Scholar] [CrossRef]
- Khurshid, A.; Khan, K.; Cifuentes-Faura, J.; Chen, Y. Asymmetric multifractality: Comparative efficiency analysis of global technological and renewable energy prices using MFDFA and A-MFDFA approaches. Energy 2024, 289, 130106. [Google Scholar] [CrossRef]
- Memon, B.A.; Yao, H.; Naveed, H.M. Examining the efficiency and herding behavior of commodity markets using multifractal detrended fluctuation analysis. Empirical evidence from energy, agriculture, and metal markets. Resour. Policy 2022, 77, 102715. [Google Scholar] [CrossRef]
- Podobnik, B.; Stanley, H.E. Detrended Cross-Correlation Analysis: A New Method for Analyzing Two Nonstationary Time Series. Phys. Rev. Lett. 2008, 100, 084102. [Google Scholar] [CrossRef]
- Zhou, W. Multifractal detrended cross-correlation analysis for two nonstationary signals. Phys. Rev. E 2008, 77, 066211. [Google Scholar] [CrossRef]
- Wang, Q.; Yang, X.; Li, R. The impact of the COVID-19 pandemic on the energy market–A comparative relationship between oil and coal. Energy Strat. Rev. 2022, 39, 100761. [Google Scholar] [CrossRef]
- Bentes, S. Is gold a safe haven for the CIVETS countries under extremely adverse market conditions? Some new evidence from the MF-DCCA analysis. Phys. A 2023, 623, 128898. [Google Scholar] [CrossRef]
- Huang, M.; Shao, W.; Wang, J. Correlations between the crude oil market and capital markets under the Russia–Ukraine conflict: A perspective of crude oil importing and exporting countries. Resour. Policy 2023, 80, 103233. [Google Scholar] [CrossRef]
- Metescu, A. Fractal market hypothesis vs. Efficient market hypothesis: Applying the r/s analysis on the Romanian capital market. J. Public Adm. Financ. Law 2022, 11, 199–209. [Google Scholar] [CrossRef]
- Kownatzki, C.; Park, J. Unveiling market turning points: Analysing skewness, kurtosis and Hurst exponent in intraday data. J. Risk Manag. Financ. Inst. 2025, 18, 149–170. [Google Scholar] [CrossRef]
- Madani, M.A.; Ftiti, Z. Is gold a hedge or safe haven against oil and currency market movements? A revisit using multifractal approach. Ann. Oper. Res. 2022, 313, 367–400. [Google Scholar] [CrossRef]
- Gao, J.; Wang, J.; Wei, D.; Zeng, B. An innovative decision-making system integrating multifractal analysis and volatility forecasting. Ann. Oper. Res. 2024, 1–43. [Google Scholar] [CrossRef]
- Oral, E.; Unal, G. Modeling and forecasting time series of precious metals: A new approach to multifractal data. Financ. Innov. 2019, 5, 22. [Google Scholar] [CrossRef]
- Kyle, A.S. Continuous auctions and insider trading. Econometrica 1985, 53, 1315–1335. [Google Scholar] [CrossRef]
- Gong, X.; Liu, X.; Xiong, X. Measuring tail risk with GAS time varying copula, fat tailed GARCH model and hedging for crude oil futures. Pac.-Basin Financ. J. 2019, 55, 95–109. [Google Scholar] [CrossRef]
- Lee, Y.; Pai, T. REIT volatility prediction for skew-GED distribution of the GARCH model. Expert Syst. Appl. 2010, 37, 4737–4741. [Google Scholar] [CrossRef]
- Engle, R.F. Autoregressive conditional heteroscedasticity with estimates of the variance of United Kingdom inflation. Econometrica 1982, 50, 987–1007. [Google Scholar] [CrossRef]
- Bollerslev, T. Generalized autoregressive conditional heteroskedasticity. J. Econ. 1986, 31, 307–327. [Google Scholar] [CrossRef]
- Yang, Y.; Peng, Z.; Ryou, J. What determines the long-term volatility of the offshore RMB exchange rate? Appl. Econ. 2023, 55, 2367–2388. [Google Scholar] [CrossRef]
- Zhou, W. Did Donald Trump’s tweets on Sino–US Trade affect the offshore RMB exchange rate? Financ. Res. Lett. 2023, 58, 104283. [Google Scholar] [CrossRef]
- Yang, Z.; Fei, Z.; Wang, J. Research on the Correlation between the Exchange Rate of Offshore RMB and the Stock Index Futures. Mathematics 2024, 12, 695. [Google Scholar] [CrossRef]
- Feduzi, A.; Faulkner, P.; Runde, J.; Cabantous, L.; Loch, C.H. Heuristic methods for updating small world representations in strategic situations of Knightian uncertainty. Acad. Manag. Rev. 2022, 47, 402–424. [Google Scholar] [CrossRef]
- Dicks, D.; Fulghieri, P. Uncertainty, investor sentiment, and innovation. Rev. Financ. Stud. 2021, 34, 1236–1279. [Google Scholar] [CrossRef]
- Izhakian, Y.; Yermack, D.; Zender, J.F. Ambiguity and the tradeoff theory of capital structure. Manag. Sci. 2022, 68, 4090–4111. [Google Scholar] [CrossRef]
- Peng, S. Multi-dimensional G-Brownian motion and related stochastic calculus under G-expectation. Stoch. Process. Their Appl. 2008, 118, 2223–2253. [Google Scholar] [CrossRef]
- Epstein, L.G.; Ji, S. Ambiguous volatility, possibility and utility in continuous time. J. Math. Econ. 2014, 50, 269–282. [Google Scholar] [CrossRef]
- Bai, X.; Buckdahn, R. Inf-convolution of G-expectations. Sci. China Math. 2010, 53, 1957–1970. [Google Scholar] [CrossRef]
- Baines, D.; Disegna, M.; Hartwell, C.A. Portfolio frontier analysis: Applying mean-variance analysis to health technology assessment for health systems under pressure. Soc. Sci. Med. 2021, 276, 113830. [Google Scholar] [CrossRef]
- Schöniger, F.; Morawetz, U.B. What comes down must go up: Why fluctuating renewable energy does not necessarily increase electricity spot price variance in Europe. Energy Econ. 2022, 111, 106069. [Google Scholar] [CrossRef]
- Lai, Z.; Yang, H. A survey on gaps between mean-variance approach and exponential growth rate approach for portfolio optimization. ACM Comput. Surv. 2022, 55, 25. [Google Scholar] [CrossRef]
- Cai, Y.; Tang, Z.; Chen, K.; Liu, D. Quantifying the international stock market risk spillover: An analysis based on G-expectation upper variances. Financ. Res. Lett. 2023, 58, 104346. [Google Scholar] [CrossRef]
- Wasserman, L.; Walley, P. Statistical reasoning with imprecise probabilities. J. Am. Stat. Assoc. 1993, 88, 700. [Google Scholar] [CrossRef]
- Ihlen, E.A. Introduction to multifractal detrended fluctuation analysis in Matlab. Front. Physiol. 2012, 3, 141. [Google Scholar] [CrossRef]
- Wang, J.; Shao, W.; Kim, J. Cross-correlations between bacterial foodborne diseases and meteorological factors based on MF-DCCA: A case in South Korea. Fractals 2020, 28, 2050046. [Google Scholar] [CrossRef]
- Ruan, Q.; Yang, H.; Lv, D.; Zhang, S. Cross-correlations between individual investor sentiment and Chinese stock market return: New perspective based on MF-DCCA. Phys. A 2018, 503, 243–256. [Google Scholar] [CrossRef]
- Lashermes, B.; Abry, P.; Chainais, P. New insights into the estimation of scaling exponents. Int. J. Wavelets Multiresolution Inf. Process. 2004, 2, 497–523. [Google Scholar] [CrossRef]
- Anagnostidis, P.; Varsakelis, C.; Emmanouilides, C.J. Has the 2008 financial crisis affected stock market efficiency? The case of Eurozone. Phys. A 2016, 447, 116–128. [Google Scholar] [CrossRef]
- Ivanov, P.C.; Amaral, L.A.; Goldberger, A.L.; Havlin, S.; Rosenblum, M.G.; Struzik, Z.R.; Stanley, H.E. Multifractality in human heartbeat dynamics. Nature 1999, 399, 461–465. [Google Scholar] [CrossRef]
- Cajueiro, D.O.; Tabak, B.M. The Hurst exponent over time: Testing the assertion that emerging markets are becoming more efficient. Phys. A 2004, 336, 521–537. [Google Scholar] [CrossRef]
- Wang, Y.; Liu, L.; Gu, R. Analysis of efficiency for Shenzhen stock market based on multifractal detrended fluctuation analysis. Int. Rev. Financ. Anal. 2009, 18, 271–276. [Google Scholar] [CrossRef]
- Wang, Y.; Wei, Y.; Wu, C. Cross-correlations between Chinese A-share and B-share markets. Phys. A 2010, 389, 5468–5478. [Google Scholar] [CrossRef]
- Wang, Y.; Wei, Y.; Wu, C. Analysis of the efficiency and multifractality of gold markets based on multifractal detrended fluctuation analysis. Phys. A 2011, 390, 817–827. [Google Scholar] [CrossRef]
- Liu, L.; Wan, J. A study of correlations between crude oil spot and futures markets: A rolling sample test. Phys. A 2011, 390, 3754–3766. [Google Scholar] [CrossRef]
- Lee, M.; Song, J.W.; Kim, S.; Chang, W. Asymmetric market efficiency using the index-based asymmetric-MFDFA. Phys. A 2018, 512, 1278–1294. [Google Scholar] [CrossRef]
- Ruan, Q.; Yang, B.; Ma, G. Detrended cross-correlation analysis on RMB exchange rate and Hang Seng China Enterprises Index. Phys. A 2017, 468, 91–108. [Google Scholar] [CrossRef]
- Fernandes, L.H.; Silva, J.W.; Araujo, F.H.; Bariviera, A.F. Quantifying the COVID-19 shock in cryptocurrencies. Fractals 2024, 32, 2450019. [Google Scholar] [CrossRef]
- Fernandes, L.H.; de Araújo, F.H.; Silva, I.E. The (in) efficiency of nymex energy futures: A multifractal analysis. Phys. A 2020, 556, 124783. [Google Scholar] [CrossRef]
- Takaishi, T. Rough volatility of Bitcoin. Financ. Res. Lett. 2020, 32, 101379. [Google Scholar] [CrossRef]
- Zou, S.; Zhang, T. Multifractal detrended cross-correlation analysis of the relation between price and volume in European carbon futures markets. Phys. A 2020, 537, 122310. [Google Scholar] [CrossRef]
- Sun, L.; Xiang, M.; Shen, Q. A comparative study on the volatility of EU and China’s carbon emission permits trading markets. Phys. A 2020, 560, 125037. [Google Scholar] [CrossRef]
- Saâdaoui, F.; Rabbouch, H. Financial forecasting improvement with LSTM-ARFIMA hybrid models and non-Gaussian distributions. Technol. Forecast. Soc. Change 2024, 206, 123539. [Google Scholar] [CrossRef]
- Zhou, W. Finite-size effect and the components of multifractality in financial volatility. Chaos Solitons Fract. 2012, 45, 147–155. [Google Scholar] [CrossRef]
- Kluszczyński, R.; Drożdż, S.; Kwapień, J.; Stanisz, T.; Wątorek, M. Disentangling sources of multifractality in time series. Mathematics 2025, 13, 205. [Google Scholar] [CrossRef]
- Kwapień, J.; Blasiak, P.; Drożdż, S.; Oświęcimka, P. Genuine multifractality in time series is due to temporal correlations. Phys. Rev. E 2023, 107, 034139. [Google Scholar] [CrossRef]
- Drożdż, S.; Kwapień, J.; Oświecimka, P.; Rak, R. Quantitative features of multifractal subtleties in time series. Eur. Lett. 2010, 88, 60003. [Google Scholar] [CrossRef]
Disclaimer/Publisher’s Note: The statements, opinions and data contained in all publications are solely those of the individual author(s) and contributor(s) and not of MDPI and/or the editor(s). MDPI and/or the editor(s) disclaim responsibility for any injury to people or property resulting from any ideas, methods, instructions or products referred to in the content. |
© 2025 by the authors. Licensee MDPI, Basel, Switzerland. This article is an open access article distributed under the terms and conditions of the Creative Commons Attribution (CC BY) license (https://creativecommons.org/licenses/by/4.0/).