Abstract
The effect of different acids on the pore structure and fractal characteristics of micropores and mesopores was determined with the help of low-temperature liquid nitrogen adsorption, X-ray diffraction, and the Frenkel–Halsey–Hill (FHH) model by using Yuwu coal as a sample and placing it in acidic environments, such as HF, HCl, HNO3, and CH3COOH. The results show that the acidization effects of HF and CH3COOH are separately dominated by the micropore and mesopore formation effects, while HCl and HNO3 mainly play their roles in expanding mesopores. After acidization, the surface fractal dimensions D1 and D1′ of micropores and mesopores in coal are always negatively correlated with the total specific surface area SBET, specific surface area Smic of micropores, and specific surface area Smes of mesopores. After being acidized by HF, D2 is negatively correlated with the total volume Vtot and the corresponding micropore volume Vmic, while acidization with HCl and HNO3 leads to the opposite result. After being acidized by CH3COOH, D2 has a negative correlation with Vtot and a positive correlation with Vmic. The structural fractal dimensions D2′ of mesopores in samples acidized by HF and CH3COOH are positively correlated with both the volume Vtot and mesopore volume Vmes, while it is the opposite for samples acidized by HNO3. D2′ of coal samples acidized by HCl is negatively correlated with Vtot while positively correlated with Vmes.
1. Introduction
Coal is a type of organic rock composed of inorganic minerals and organic matter and containing complex pore–fracture systems [1,2,3,4,5]. The pore–fracture systems in coal are storage and migration channels of coalbed methane (CBM), and they are likely to be filled with minerals to become closed or semi-closed pores and fractures, which influences the diffusion and migration of CBM [6,7,8,9,10]. Acid fracturing is one of the most effective methods to solve mineral blocking of pores and fractures in coal seams [11,12,13]. Previous research has shown that, when using acid solutions as fracturing fluids, they can dissolve minerals in coal reservoirs, enlarge the volume and specific surface area of mesopores in coal, and simplify pore structures [14,15,16,17,18]. Zhang et al. compared the dissolution effects before and after acidizing coal samples with hydrochloric acid (HCl) and acetic acid (CH3COOH) and found that hydrogen fluoride (HF) plays a stronger role in dissolving clay minerals, so the mineral dissolution rate when using HF is much greater than that of HCl and HAc [19]. By applying Fourier transform infrared spectroscopy, X-ray diffraction (XRD), and scanning electron microscopy, Yu et al. revealed changes in coal compositions, parameters of organic functional groups, and crystal structures of coal. They found that as the concentration rises, CH3COOH plays an enhancing role in dissolving surface fractures of coal. In the reaction between CH3COOH and coal, kaolinite is recrystallized within 24 h after dissolution and completely dissolved by CH3COOH within 72 h [20]. Dou et al. experimentally studied changes in the CO2 adsorption/desorption characteristics after acidizing coal with HF and nitric acid (HNO3) by using the CO2 adsorption/desorption system and low-temperature nitrogen adsorption method. They stated that HF acidization mainly plays a role in micropore formation while HNO3 acidization mainly expands the pores. Acidization increases the desorption capacity of coal samples and reduces the desorption time [21]. Ni et al. studied changes in pore structures after HNO3 acidization and found that HNO3 plays an obvious role in expanding pores. As the HNO3 concentration is increased, the pore size, volume, and specific surface area of coal samples all gradually increase [22]. Therefore, revealing changes in pore structures in coal acidized by different acid solutions can lay the foundation for adsorption/desorption research into the extraction of CBM in acidized coal seams.
Fractal geometry, proposed by Mandelbrot [23], has become one of the important approaches for evaluating the anisotropy of internal structures of complex porous materials after years of development [24,25,26,27,28,29,30]. Based on the mercury intrusion method and fractal dimension, Liu et al. [31] described pore structures in coal samples with different grades of metamorphism. Ma et al. [32] found that low-temperature nitrogen adsorption is superior to the mercury intrusion method when they are used to study micropores and mesopores. Zhu et al. [33] studied the structures and fractal features of micropores and mesopores in the steam activation process of activated carbon using low-temperature nitrogen adsorption and the Frenkel–Halsey–Hill model. They found that in the steam activation process, micropores and mesopores were developed; activation at 750 °C was more conducive to the development of mesopore structures. Zhao et al. [34] investigated the difference in pores in raw coal and tectonic coal and stated that the surface fractal dimension D1 of pores increases with the reduction in particle size. Tectonic coal has a larger D1 than raw coal while its structural fractal dimension D2 of pores is lower than that of raw coal. Han et al. [35] adopted the mercury intrusion method and nitrogen adsorption method to study pore structures in coal with different grades of metamorphism and revealed that the fractal dimension of pores shows piecewise characteristics. Therefore, they proposed a new fractal-based classification scheme for pores based on the piecewise fractal dimension. Yi et al. [36] adopted low-temperature gas adsorption (LTGA) to explore changes in pores in coal samples treated with HCl and found that, as the mineral content decreases, the macropore volume increases while mesopore volume decreases, then increases. In addition, many closed mesopores turn into semi-open or open pores, which increases the fractal dimension D2 and the specific surface area of pores. Whereas the increase in the specific surface area does not have a significant relationship with the fractal dimension D1 of surface roughness of pores. Zheng et al. [37] studied the influences of HCl, tetrahydrofuran (THF), and carbon disulfide (CS2) on structural parameters and fractal features of pores in coal through low-temperature liquid nitrogen adsorption (LT-N2GA), XRD, and fractal theory. They unveiled that after HCl treatment, lots of closed pores are opened, the proportion of micropores increases, and the D1 of pores declines. THF extraction enlarges the pore volume and specific surface area. After extracting low-molecular-weight organic matter using CS2, the pore size increases, thereby increasing the volumes of transitional pores and mesopores. After treatment with organic solvents, the solvents are retained in pores in coal, so that D1 increases and the pore surface becomes rough.
In summary, treatment with chemical solvents can change pore structures in coal and affect the surface roughness of pores; however, previous research hardly combines chemical changes of mineral compositions in coal after acid treatment with the change mechanism of pore structures and fractal features. Considering this, the present research explored changes in the structural parameters of pores in coal samples treated with HF, HCl, HNO3, and CH3COOH by combining LT-N2GA and XRD analysis. This involved quantitative analysis of the specific surface areas of micropores and mesopores, pore volume, and pore size distribution from the microscopic perspective. Additionally, the surface and structural fractal dimensions of micropores and mesopores were calculated based on LT-N2GA data. In this way, the relationships of different acid solutions, changes in different mineral compositions, and fractal dimensions of micropores (mesopores) with the structural parameters of pores were determined.
2. Sample Preparation and Experiments
2.1. Coal Sample Preparation
① Coal sample pulverization
The experimental coal samples were taken from the Yuwu Mine in Changzhi City, Shanxi Province. The collected coal samples were crushed and ground to less than 0.075 mm and dried under vacuum at 80 °C for 12 h.
② Sample acidification
Five grams of treated coal powder was taken into a tetrafluoroethylene beaker and 400 mL of hydrofluoric acid, hydrochloric acid, nitric acid, and acetic acid with a mass fraction of 8% were added. The samples were magnetically stirred in the acid solution for 24 h at room temperature to ensure homogeneous acidification; the acid-washed coal samples were separated by centrifuge and washed with deionized water until the PH paper was neutral. About 12 h of drying treatment at 60 °C was taken out to complete the acidification of the sample. The original coal samples were numbered as YUAN, and the hydrofluoric acid, hydrochloric acid, nitric acid, and acetic acid acidified coal samples were numbered as HF, HCl, HNO3, and CH3COOH, respectively. The relevant parameters are shown in Figure 1.
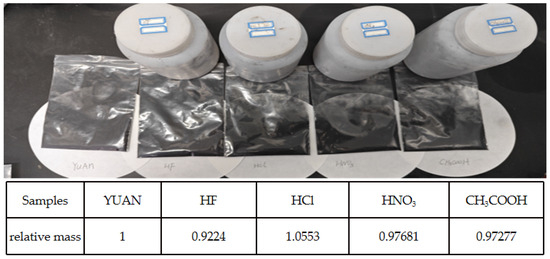
Figure 1.
Sample parameters and photos before and after acidification.
2.2. XRD Analysis Experiment
The XRD experiment was carried out by the D8 ADVANCE X-ray diffractometer manufactured by Bruker, Karlsruhe, Germany. Experimental conditions are described in detail in the literature [38]. Origin 9.0 software was used to denoise the XRD spectrum. The three fitting Gaussian peaks, which are γ peak,002 peak, and 100 peak, were fitted at 20°, 26°, and 42°, respectively.
2.3. Low-Temperature Nitrogen Experiment
Low-temperature nitrogen experiment was performed according to the Chinese national standard GB/T 21650.3-2011 [39]. The pore structure of the coal samples was tested using ASAP 2460 automatic surface area and porosity analyzer by Micromeritics, Shanghai, Chinese and the accompanying MicroActive software (https://www.micromeritics.com/) to derive the specific surface area, pore volume, and pore size distribution of the coal samples. Before the pore structure test, the coal samples were degassed under a vacuum at 130 °C for 12 h to completely remove air, water, and other impurities.
The specific surface area (SBET) model was used to calculate the total specific surface area. The surface area (Smes) of mesopores (1.7 nm < D < 300 nm) and the volume of mesopores (Vmes) were calculated using the BJH method. The surface area of the micropores (Smic) was calculated from the difference between SBET and Smes. The volume of total pores (Vtot) was calculated from the amount of liquid nitrogen adsorbed at a relative pressure of 0.98, and the volume of micropores (Vmic) was calculated from the difference between Vtot and Vmes.
2.4. Calculation of Fractal Dimension
The fractal dimension is one of the most important parameters of fractal geometry and is used to characterize the complexity of pore structure and surface roughness. Based on the Frenkel–Halsey–Hill (FHH) model, the fractal dimension of the pore surface and pore structure is calculated [40,41]. The equation is as follows:
where P is the gas adsorption equilibrium pressure, MPa; P0 is the saturated vapor pressure, MPa; V is the gas adsorption volume at the equilibrium pressure P, mL/g; Vm is the adsorption volume of the monomolecular layer, mL/g; C is the fitting constant; and A is the slope of the double logarithmic curve drawn by ln(V/Vm) against ln(ln(P0/P)). P0 is the gas adsorption saturation pressure, Pa; P is the gas adsorption equilibrium pressure, Pa.
The fractal dimension D of Equation (1) as a function of the slope A is as follows [42]:
A = D − 3
3. Results and Analysis
3.1. Mineral Phases
The XRD patterns of raw and acidized coal samples are shown in Figure 2.
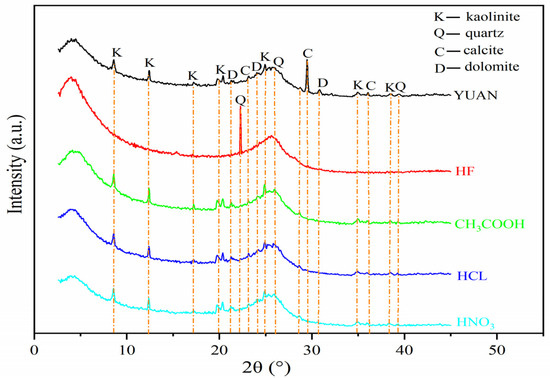
Figure 2.
X-ray diffractogram of coal samples.
As displayed in Figure 2, the raw coal samples (YUAN) mainly contain clay minerals (kaolinite (AL2Si2O5(OH)4)), silicate minerals (quartz (SiO2)), and carbonate minerals (calcite (CaCO3) and dolomite (CaMg(CO3)2)).
A comparison of XRD patterns of raw and acidized coal samples reveals that the intensity of diffraction peaks in XRD patterns of HF-treated coal samples decreases, and only quartz is retained. HCl, CH3COOH, and HNO3 all completely dissolve carbonate minerals (calcite and dolomite), while the diffraction peaks of silicate minerals (quartz) and clay minerals (kaolinite) change slightly.
3.2. Characteristics of Pores
3.2.1. N2 Adsorption/Desorption Isotherms
Based on LT-N2GA, the N2 adsorption/desorption isotherms and accumulated surface areas of raw and acidized coal samples are separately shown in Figure 3 and Figure 4.
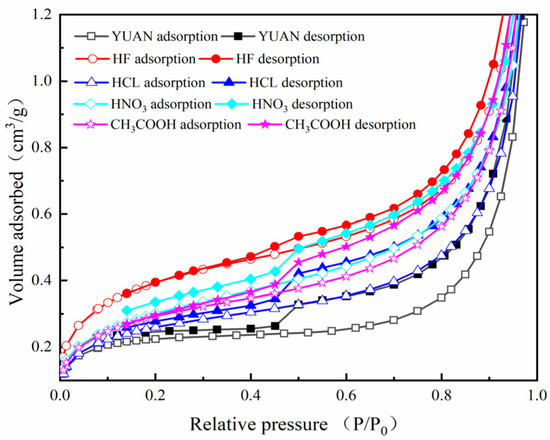
Figure 3.
Adsorption/desorption isotherms of coal samples.
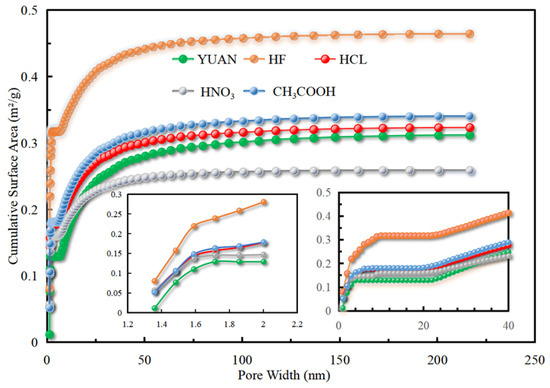
Figure 4.
Specific surface area accumulation graph.
According to the IUPAC (International Union of Pure and Applied Chemistry) classification, the isothermal adsorption/desorption curves of coal samples before and after acidization belong to type-IV isotherms [43], which are typically characterized by the presence of adsorption hysteresis [44]. Acidized coal samples exhibit obvious hysteresis and higher adsorption capacity. This indicates an increment in the specific surface area of coal.
Adsorption is divided into a monolayer adsorption stage, a multilayer adsorption stage, and a capillary condensation stage.
Comparison of N2 adsorption isotherms before and after acidization shows that when the relative pressure P/P0 reaches 0.2, N2 adsorption in micropores finishes. Under the condition, the highest N2 adsorption capacity is 0.395 cm3/g, which is found in the coal sample treated with HF, followed by 0.301 and 0.293 cm3/g in samples separately treated with HNO3 and CH3COOH. The coal samples treated with HCl and YUAN demonstrate the lowest N2 adsorption capacities of 0.260 and 0.224 cm3/g. These results indicate that acidization is conducive to the formation of micropores.
Under relative pressures P/P0 of 0.2 to 0.8, N2 monolayer adsorption and multilayer adsorption are achieved successively in mesopores. At that time, the largest increment of 0.286 cm3/g of N2 adsorption capacity was found in the coal sample treated with HNO3, followed by increments of 0.278 and 0.270 cm3/g in samples treated with HF and CH3COOH. The increments are the lowest in samples treated with HCl and YUAN, which are 0.216 and 0.125 cm3/g, respectively. These results suggest that acidization is conducive to the formation of mesopores.
Under relative pressures P/P0 of 0.8 to 1, capillary condensation occurs in pores within the coal, which leads to an abrupt rise in the adsorption isotherms. At that time, the largest increment of 1.844 cm3/g of N2 adsorption capacity was found in the samples treated with HF, followed by those of 1.801 and 1.751 cm3/g in samples separately treated with CH3COOH and YUAN. The lowest increments of N2 adsorption capacities are 1.598 and 1.332 cm3/g in samples acidized by HCl and HNO3. This indicates that pores in samples treated with HCl and HNO3 are greatly influenced by capillary condensation. This is also related to the generation of CaCl2 and Ca(NO3)2 during acidization of calcite by HCl and HNO3, so that increments of N2 adsorption capacities in samples treated with the two acid solutions are lower than that of YUAN coal samples.
Altogether, acidization is conducive to the formation of micropores and mesopores in coal. HF and HNO3 separately play the greatest roles in forming micropores and mesopores.
3.2.2. Structural Parameters and Pore Size Distribution of Pores
Figure 5 and Figure 6 and Table 1 list the surface areas and pore volumes corresponding to coal samples treated with different acid solutions.
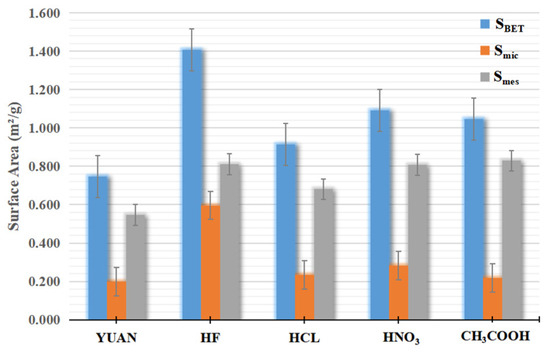
Figure 5.
Specific surface area of the sample.
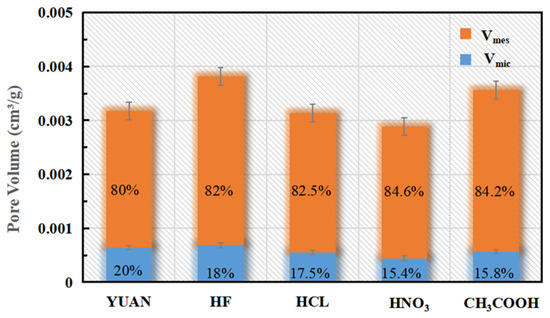
Figure 6.
Volume of the sample.

Table 1.
Pore structure parameters of the samples.
Acid solutions exert two effects on pores: one is pore formation, that is, dissolving closed pores into open pores; the other is pore expansion, that is, dissolving and expanding pre-existing pores.
The Vmic/Vtot ratio of YUAN coal samples is 20%, while those of coal samples treated with HF, HCl, HNO3, and CH3COOH are separately 18%, 17.5%, 15.4%, and 15.8%. The Smic/SBET ratio of YUAN coal samples is 26.7%, while those of coal samples acidized by HF, HCL, HNO3, and CH3COOH are 42.4%, 25.6%, 26.0%, and 20.8%, respectively. This indicates that HCl, HNO3, and CH3COOH mainly play their roles in expanding micropores. Smic of coal samples treated with HF is about three times that of YUAN coal samples, which implies that numerous closed micropores in coal samples acidized by HF are dissolved into open pores and therefore the specific surface area is increased. This suggests that HF mainly plays its role in forming micropores.
The Vmes/Vtot ratio of YUAN coal samples is 80%, while those of samples treated with HF, HCl, CH3COOH, and HNO3 are 82%, 82.5%, 84.6%, and 84.2%, respectively. The Smes/SBET ratio of YUAN coal samples is 73.3%, while those of samples treated with HF, HCl, CH3COOH, and HNO3 are separately 57.6%, 74.4%, 74.0%, and 79.2%. This indicates that HF exerts an expansion effect on mesopores, and the effect is weaker than that on micropores. HCL and HNO3 mainly expand mesopores, while CH3COOH mainly forms mesopores.
According to the N2 adsorption isotherms, NLDFT was used to calculate the pore size distribution in the range from 1.3 to 216 nm (Figure 7).
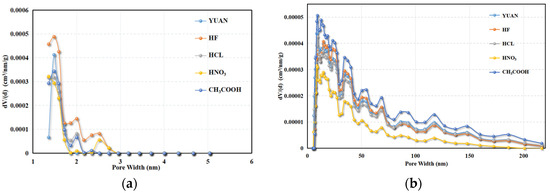
Figure 7.
Pore size distribution based on NLDFT approach. (a) Microporous pore size. (b) Mesopore aperture.
The pore size of micropores in coal samples is mainly concentrated within the range from 1.3 to 2.0 nm. A comparison of peaks of pore sizes in coal samples treated with HF and YUAN coal samples in the range of 1.3 to 1.7 nm shows that the micropore formation effect of HF focuses on micropores within this range, and the pore expansion effect is concentrated on micropores in the range of 1.7 to 2.0 nm. The pore size of mesopores in coal is mainly in the range of 2 to 40 nm, dominated by those between 2 and 9 nm. This indicates that mesopore structures are mainly small; CH3COOH mainly exerts its role in the formation of mesopores measuring 6 to 40 nm.
The Vmes/Vtot ratio of YUAN coal samples is 80%, while those of coal samples acidized by HF, HCl, CH3COOH, and HNO3 are 82%, 82.5%, 84.6%, and 84.2%, respectively. The Smes/SBET ratio of YUAN coal samples is 73.3%, while those of coal samples treated with HF, HCl, CH3COOH, and HNO3 are separately 57.6%, 74.4%, 74.0%, and 79.2%.
3.3. Fractal Features of Pore Structures
3.3.1. Fractal Features of Micropore Structures
Based on the Polanyi adsorption potential theory, the Dubinin–Radushkevich (D-R) method can be used to characterize micropore structures [45]. According to N2 adsorption isotherms, the D-R diagram of coal samples was plotted (Figure 8).
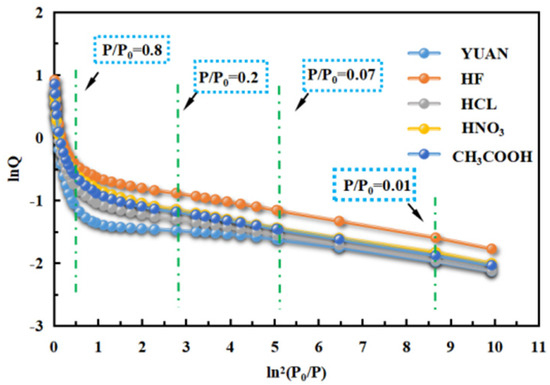
Figure 8.
Curve D-R diagram of coal samples.
When P/P0 is approximately 0.01, the first inflection point appears on the fitted line on the D-R diagram, indicating that micropores being two times the diameter of N2 molecules have been fully filled, that is, ultra-micropores smaller than 0.7 nm have been fully filled.
When P/P0 reaches 0.07, the second inflection point appears, which means that monolayer adsorption on the surface of micropores with the size being three to four times the diameter of N2 molecules has been finished. Therefore, it can be used to calculate the surface fractal dimension D1 of micropores measuring 1.2 to 1.8 nm (Figure 7a), that is, at the transition point from monolayer adsorption to multilayer adsorption, and to characterize the surface roughness of the micropores.
At P/P0 of 0.2, micropores as large as three to four times the diameter of N2 molecules have been fully filled. The results show that N2 adsorption under P/P0 of 0.07 to 0.2, that is, multilayer adsorption and filling in micropores measuring 1.2 to 1.8 nm, can be used to calculate the structural fractal dimension D2 of micropores and characterize the structural complexity of the micropores.
According to N2 adsorption data pertaining to the micropores, the fitted lines for ln(V/Vm) v. ln(ln(P0/P)) curves of coal samples were plotted (Figure 9). The slopes A1 and A2 of lines are fitted, and the fractal dimensions D1 and D2 of micropores are calculated.
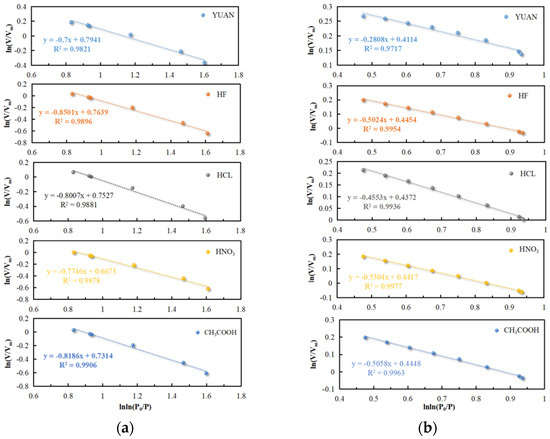
Figure 9.
Fractal dimensions D1 and D2 of microporous pores: (a) microporous fractal dimension D1 of P/P0 at 0.07 and (b) microporous fractal dimension D2 for P/P0 in the range 0.07~0.2.
The fractal dimensions D1 and D2 of micropores and the correlation coefficient R2 of coal samples are listed in Table 2.

Table 2.
Parameterized table of fractal dimensions of micropores.
Data in Table 2 show that the correlation coefficient R2 is always greater than 0.972, indicative of the reliability of the regression analysis.
The value of D1 of coal samples varies within the range from 2.150 to 2.300, indicating obvious fractal features on micropore surfaces. The value of D1 of YUAN coal samples is 2.300, while that of acidized coal samples is in the range of 2.150 to 2.225. This is mainly because acidization induces dissolution of carbonate minerals and swelling of clay minerals in coal, so that the micropore surfaces become smooth. Therein, coal samples treated with HF have the lowest D1 and the smoothest micropore surfaces.
The value of D2 of coal samples varies from 2.470 to 2.719, which suggests that micropore structures also exhibit fractal features. This indicates complex micropore structures and high anisotropy. The value of D2 of YUAN coal samples is 2.719, while it is between 2.470 and 2.545 for acidized coal samples. This is mainly because acidization removes minerals and organic matter in coal, simplifies micropore structures, and contributes to more uniform pore size distribution. Therein, coal samples treated with HNO3 have the smallest D2, simplest micropore structures, and most uniform pore size distribution.
3.3.2. Fractal Features of Mesopore Structures
In accordance with N2 adsorption isotherms in mesopores when P/P0 is between 0.2 and 1, ln(V/Vm) v. ln(ln(P0/P)) curves were subjected to piecewise linear fitting (Figure 10).
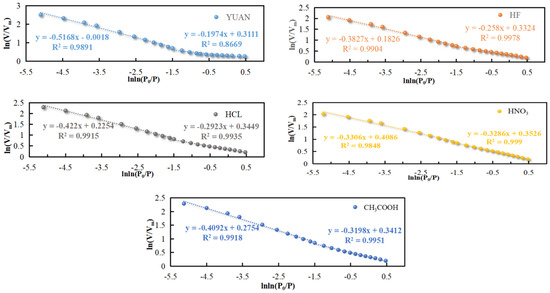
Figure 10.
Mesoporous fractal dimensions D1′ and D2′ for P/P0 in the range 0.2~1.
Figure 10 shows that there is an inflection point on each of the fractal curves in the FHH model when ln(ln(P0/P)) is about −1.5, which corresponds to P/P0 of 0.8. This means that at the inflection point, N2 adsorption in mesopores turns from monolayer adsorption into multilayer adsorption. Therefore, N2 adsorption data before and after the inflection point can be used to calculate the surface and structural fractal dimensions of mesopores and describe the two different fractal features [46,47].
When P/P0 is in the range of 0.2 to 0.8, N2 molecules have monolayer adsorption on mesopore surfaces due to surface tension, which can be used to calculate the surface fractal dimension D1′ of mesopores. When P/P0 is greater than 0.8, mesopores are full of N2 molecules under the van der Waals’ force (VDW), and capillary condensation occurs, which can be used to calculate the structural fractal dimension D2′ of mesopores.
The fractal dimensions D1′ and D2′ of mesopores in coal samples and their correlation coefficient R2 are listed in Table 3.

Table 3.
Parameterized table of fractal dimensions of mesopores.
Table 3 demonstrates that R2 is always greater than 0.867, indicating the reliability of the regression analysis.
The value of D1′ of coal samples is between 2.671 and 2.803, indicating that mesopore surfaces show obvious fractal features and high roughness. The value of D1′ of YUAN coal samples is 2.803, while that of acidized coal samples is between 2.671 and 2.742. This suggests that acidization can smooth the mesopore surface in coal. Therein, D1′ of coal samples treated with HNO3 is the lowest, and mesopore surfaces are smoothest.
The value of D2′ of coal samples varies between 2.483 and 2.669, which indicates that mesopore structures exhibit fractal features. The result suggests that mesopore structures are complex and highly anisotropic. The value of D2′ of YUAN coal samples is 2.483, while that of acidized coal samples is in between 2.578 and 2.669. Combined with Figure 7, acidization expands mesopores in coal and some micropores expand to become mesopores, thus increasing D2′. As a result, mesopore structures in acidized coal samples become more complex, and pore sizes are distributed less uniformly. Therein, coal samples treated with HNO3 have the largest D2′, most complex mesopore structures, and strongest anisotropy of pore size distribution.
3.4. Relationship between Pore Characteristics and Fractal Dimensions
To study changes in the fractal dimension of pores, the relationships between characteristic parameters and fractal dimensions of micropores and mesopores were established.
The relationship between the surface fractal dimension D1 and surface area parameters (SBET and Smic) of micropores and the relationship between the structural fractal dimension D2 and volume parameters (Vtot and Vmic) of micropores are illustrated in Figure 11. The relationship between the surface fractal dimension D1′ and surface area parameters (SBET and Smic) of mesopores and the relationship between the structural fractal dimension D2′ and volume parameters (Vtot and Vmes) of mesopores are illustrated in Figure 11.
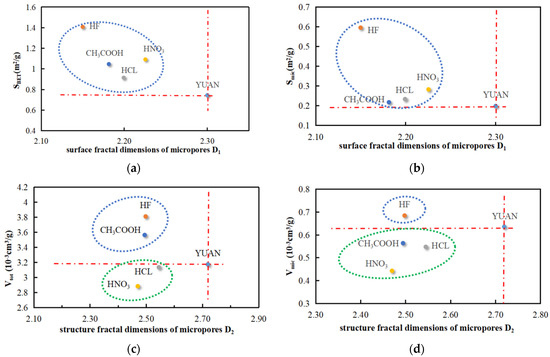
Figure 11.
Microporous parameters versus fractal dimension. (a) SBET vs. D1. (b) Smic vs. D1. (c) Vtot vs. D2. (d) Vmic vs. D2.
According to the analysis of the data in Figure 11, the surface fractal dimension D1 of micropores in acidized coal samples is negatively correlated with the surface area SBET and micropore surface area Smic. The structural fractal dimension D2 of micropores in coal samples treated with HF has negative correlations with the volume Vtot and micropore volume Vmic. The structural fractal dimension D2 of micropores in coal samples acidized by CH3COOH is negatively correlated with volume Vtot and positively correlated with micropore volume Vmic. The structural fractal dimensions D2 of micropores in coal samples treated with HCL and HNO3 are both positively correlated with volume Vtot and micropore volume Vmic.
Analysis of Figure 12 shows that the surface fractal dimension D1′ of mesopores in acidized coal samples has negative correlations with both the surface area SBET and mesopore surface area Smes. The structural fractal dimensions D2′ of mesopores in coal samples acidized by HF and CH3COOH are positively correlated with the volume Vtot and mesopore volume Vmes. The structural fractal dimension D2′ of mesopores in coal samples treated with HCl has a negative correlation with volume Vtot while a positive correlation with mesopore volume Vmes. The structural fractal dimension D2′ of mesopores in coal samples treated with HNO3 is negatively correlated with the volume Vtot and mesopore volume Vmes.
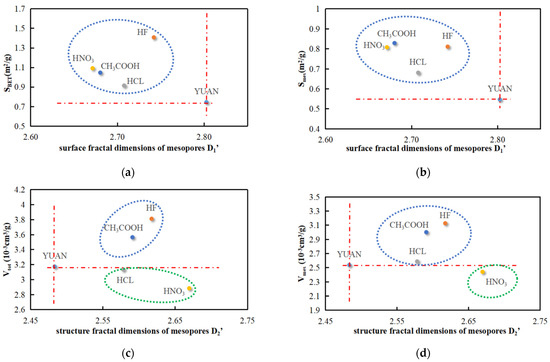
Figure 12.
Mesopore parameters versus fractal dimension. (a) SBET vs. D1′. (b) Smes vs. D1′. (c) Vtot vs. D2′. (d) Vmes vs. D2′.
According to XRD data and Figure 11c,d and Figure 12c,d, Vtot in coal samples acidized by HCL and HNO3 is smaller than that of YUAN coal samples because solid particles CaCl2 and Ca(NO3)2 not completely dissolved in water are generated in pores during acidization of carbonate mineral calcite and then block some pores. This leads to different relationships between acidization effects and the pore volume (Vtot). The acid solutions are listed in descending order as HF, CH3COOH, YUAN, HCl, and HNO3 according to the acidization effects. The micropore volumes Vmic and mesopore volumes Vmes before and after acidization show that the generation of CaCl2 and Ca(NO3)2 has greater influences on Vmic than on Vmes, and CaCl2 exerts weaker influences on the pore volume compared with Ca(NO3)2.
4. Conclusions
The mineral compositions, pore structures, and fractal features of coal samples collected from the Yuwu coal mine treated with HF, HCL, HNO3, and CH3COOH were studied through LT-N2GA and X-ray diffraction. The following conclusions were obtained:
(1) By using X-ray diffraction, CaCl2 and Ca(NO3)2 that block micropores are produced when calcite is acidized by HCl and HNO3, thus influencing the acidization effect. Acid solutions are listed in descending order as HF, CH3COOH, YUAN, HCl, and HNO3 according to the acidization effects.
(2) The acidization effects of HF and CH3COOH are separately dominated by the micropore and mesopore formation effects, while HCl and HNO3 mainly play their roles in expanding mesopores.
(3) After acidization, the surface fractal dimensions D1 and D1′ of micropores and mesopores in coal are always negatively correlated with the total specific surface area SBET, specific surface area Smic of micropores, and specific surface area Smes of mesopores. After being acidized by HF, D2 is negatively correlated with the total volume Vtot and the corresponding micropore volume Vmic, while acidization with HCl and HNO3 leads to the opposite result. After being acidized by CH3COOH, D2 has a negative correlation with Vtot and a positive correlation with Vmic. The structural fractal dimensions D2′ of mesopores in samples acidized by HF and CH3COOH are positively correlated with both the volume Vtot and mesopore volume Vmes, while it is the opposite for samples acidized by HNO3. D2′ of coal samples acidized by HCl is negatively correlated with Vtot while positively correlated with Vmes.
According to the results, relationships of different acid solutions, changes in different mineral compositions, and fractal dimensions of micropores (mesopores) with structural parameters of pores were established. They are expected to provide a reference for research on acid solution selection and acidization mechanism during acid fracturing for CBM extraction.
Author Contributions
Methodology, X.L.; software, E.S.; writing—original draft preparation, J.Z.; writing—review and editing, X.N.; supervision, X.N.; project administration, X.N.; funding acquisition, X.N. All authors have read and agreed to the published version of the manuscript.
Funding
This study was supported by National Natural Fund Projects (42072189 and 42372198) and the Collaborative Innovation Center of Coal Work Safety and Clean High Efficiency Utilization.
Data Availability Statement
Data are contained within the article.
Conflicts of Interest
The authors declare no conflicts of interest.
References
- Liu, X.F.; Nie, W.; Zhou, W.J.; Liu, C.; Liu, Q.; Wei, C. The optimization of a dust sup-pression and clean production scheme in a TBM-constructed tunnel based on an or-thogonal experiment. Process Saf. Environ. Prot. 2020, 136, 353–370. [Google Scholar] [CrossRef]
- Ni, G.H.; Li, Z.; Sun, Q.; Li, S.; Dong, K. Effects of [Bmim][Cl] ionic liquid with different concentrations on the functional groups and wettability of coal. Adv. Powder Technol. 2019, 30, 610–624. [Google Scholar]
- Zhou, W.J.; Nie, W.; Liu, C.Q.; Liu, Q.; Wang, H.; Wei, C.; Yan, J.; Yin, S.; Xiu, Z.; Xu, C. Modelling of ventilation and dust control effects during tunnel construction. Int. J. Mech. Sci. 2019, 160, 358–371. [Google Scholar] [CrossRef]
- Han, W.B.; Zhou, G.; Zhang, Q.T.; Pan, H.; Liu, D. Experimental study on modification of physicochemical characteristics of acidified coal by surfactants and ionic liquids. Fuel 2020, 266, 116966. [Google Scholar] [CrossRef]
- Aljawad, M.S.; Aljulaih, H.; Mahmoud, M.; Desouky, M. Integration of field, laboratory, and modeling aspects of acid fracturing: A comprehensive review. J. Pet. Sci. Eng. 2019, 181, 106158. [Google Scholar] [CrossRef]
- Finkelman, R.B.; Dai, S.; French, D. The importance of minerals in coal as the hosts of chemical elements: A review. Int. J. Coal Geol. 2019, 212, 103251. [Google Scholar] [CrossRef]
- Liu, Y.; Zhu, Y.; Chen, S. Effects of chemical composition, disorder degree and crystallite structure of coal macromolecule on nanopores (0.4–150 nm) in different rank naturally-matured coals. Fuel 2019, 242, 553–561. [Google Scholar] [CrossRef]
- Cai, P.; Nie, W.; Chen, D.; Yang, S.; Liu, Z. Effect of air flowrate on pollutant dis-persion pattern of coal dust particles at fully mechanized mining face based on numerical simulation. Fuel 2019, 239, 623–635. [Google Scholar] [CrossRef]
- Xu, C.; Nie, W.; Liu, Z.; Peng, H.; Yang, S.; Liu, Q. Multi-factor numerical simula-tion study on spray dust suppression device in coal mining process. Energy 2019, 182, 544–558. [Google Scholar] [CrossRef]
- Teklu, T.W.; Abass, H.H.; Hanashmooni, R.; Carratu, J.C.; Ermila, M. Experimental investigation of acid imbibition on matrix and fractured carbonate rich shales. J. Nat. Gas Sci. Eng. 2017, 45, 706–725. [Google Scholar] [CrossRef]
- Qin, L.; Li, S.; Zhai, C.; Lin, H.; Zhao, P.; Shi, Y.; Bai, Y. Changes in the pore structure of lignite after repeated cycles of liquid nitrogen freezing as determined by nitrogen adsorption and mercury intrusion. Fuel 2020, 267, 117214. [Google Scholar] [CrossRef]
- Yan, S.; Wang, G.; Wang, Q.; Li, H.; Wang, W. Characteristics of seepage of microemulsions in coal. J. Mol. Liq. 2020, 304, 112742. [Google Scholar] [CrossRef]
- Xu, Q.; Liu, R.; Ramakrishna, S. Comparative experimental study on the effects of organic and inorganic acids on coal dissolution. J. Mol. Liq. 2021, 339, 116730. [Google Scholar] [CrossRef]
- Li, P.; Zhang, X.; Zhang, S. Structures and fractal characteristics of pores in low volatile bituminous deformed coals by low-temperature N2 adsorption after different solvents treatments. Fuel 2018, 224, 661–675. [Google Scholar] [CrossRef]
- Zhang, J.; Li, L.; Qin, Q. Effects of micropore structure of activated carbons on the CH4/N2 adsorption separation and the enrichment of coal-bed methane. Clean Energy 2021, 5, 329–338. [Google Scholar] [CrossRef]
- Zhao, L.; Chen, X.; Zou, H.; Liu, P.; Liang, C.; Zhang, N.; Li, N.; Luo, Z.; Du, J. A review of diverting agents for reservoir stimulation. J. Pet. Sci. Eng. 2020, 187, 106734. [Google Scholar] [CrossRef]
- Asadollahpour, E.; Baghbanan, A.; Hashemolhosseini, H.; Mohtarami, E. The etching and hydraulic conductivity of acidized rough fractures. J. Pet. Sci. Eng. 2018, 166, 704–717. [Google Scholar] [CrossRef]
- Li, S.; Ni, G.; Wang, H.; Xun, M.; Xu, Y. Effects of acid solution of different components on the pore structure and mechanical properties of coal. Adv. Powder Technol. 2020, 31, 1736–1747. [Google Scholar] [CrossRef]
- Zhang, X.; Yu, K.; Zhang, S.; Du, Z. Change Mechanism in Surface Properties of Treated Tectonic Coal by Different Acids. Coal Convers. 2017, 40, 1–7. [Google Scholar]
- Yu, Y.; Gao, C.; Yang, H.; Cheng, W.; Xin, Q.; Zhang, X. Effect of acetic acid concentration and dissolution time on the evolution of coal phases: A case report of bituminous coal. J. Mol. Liq. 2021, 340, 117298. [Google Scholar] [CrossRef]
- Dou, H.; Xie, J.; Xie, J.; Sun, G.; Li, Z.; Wang, Z.; Miao, Y. Study on the mechanism of the influence of HNO3 and HF acid treatment on the CO2 adsorption and desorption characteristics of coal. Fuel 2022, 309, 122187. [Google Scholar] [CrossRef]
- Ni, G.; Li, S.; Rahman, S.; Xun, M.; Wang, H.; Xu, Y.; Xie, H. Effect of nitric acid on the pore structure and fractal characteristics of coal based on the low-temperature nitrogen adsorption method. Powder Technol. 2020, 367, 506–516. [Google Scholar] [CrossRef]
- Ma, B.; Hu, Q.; Yang, S.; Zhang, T.; Qiao, H.; Meng, M.; Zhu, X.; Sun, X. Pore structure typing and fractal characteristics of lacustrine shale from Kongdian formation in East China. J. Nat. Gas Sci. Eng. 2021, 85, 103709. [Google Scholar] [CrossRef]
- Lai, J.; Wang, G. Fractal analysis of tight gas sandstones using high-pressure mercury intrusion techniques. J. Nat. Gas Sci. Eng. 2015, 24, 185–196. [Google Scholar] [CrossRef]
- Mandelbrot, B.B. The Fractal Geometry of Nature; Time Books: San Francisco, CA, USA, 1982. [Google Scholar]
- Chen, S.; Tang, D.; Tao, S.; Ji, X.; Xu, H. Fractal analysis of the dynamic variation in pore-fracture systems under the action of stress using a low-field NMR relaxation method: An experimental study of coals from western Guizhou in China. J. Pet. Sci. Eng. 2019, 173, 617–629. [Google Scholar] [CrossRef]
- Zhang, K.; Lai, J.; Bai, G.; Pang, X.; Ma, X.; Qin, Z.; Zhang, X.; Fan, X. Comparison of fractal models using NMR and CT analysis in low permeability sandstones. Mar. Pet. Geol. 2020, 112, 104069. [Google Scholar] [CrossRef]
- He, J.H. Fractal calculus and its geometrical explanation. Results Phys. 2018, 10, 272–276. [Google Scholar] [CrossRef]
- Zhou, S.; Liu, D.; Cai, Y.; Yao, Y. Fractal characterization of pore-fracture in low-rank coals using a low-field NMR relaxation method. Fuel 2016, 181, 218–226. [Google Scholar] [CrossRef]
- Vasilenko, T.; Kirillov, A.; Islamov, A.; Doroshkevich, A.; Łudzik, K.; Chudoba, D.M.; Mita, C. Permeability of a coal seam with respect to fractal features of pore space of fossil coals. Fuel 2022, 329, 125113. [Google Scholar] [CrossRef]
- Liu, C.J.; Wang, G.X.; Sang, S.X.; Gilani, W.; Rudolph, V. Fractal analysis in pore structure of coal under conditions of CO2 sequestration process. Fuel 2015, 139, 125–132. [Google Scholar] [CrossRef]
- Ma, X.; Xie, X.; Ye, X.; He, J.; Zhu, J. Fractal characteristics of pore structure of calcium- based geopolymer based on nitrogen adsorption. Mater. Rev. 2019, 33, 1989–1994. [Google Scholar]
- Zhu, Y.; Liu, H.; Wang, T.; Wang, Y.; Liu, H. Evolution of pore structures and fractal characteristics of coal-based activated carbon in steam activation based on nitrogen adsorption method. Powder Technol. 2023, 424, 118522. [Google Scholar] [CrossRef]
- Wang, Z.Y.; Cheng, Y.P.; Qi, Y.X.; Wang, R.; Wang, L.; Jiang, J. Experimental study of pore structure and fractal characteristics of pulverized intact coal and tectonic coal by low temperature nitrogen adsorption. Powder Technol. 2019, 350, 15–25. [Google Scholar] [CrossRef]
- Han, W.; Zhou, G.; Gao, D.; Zhang, Z.; Wei, Z.; Wang, H.; Yang, H. Experimental analysis of the pore structure and fractal characteristics of different metamorphic coal based on mercury intrusion-nitrogen adsorption porosimetry. Powder Technol. 2020, 362, 386–398. [Google Scholar] [CrossRef]
- Yi, M.; Cheng, Y.; Wang, C.; Wang, Z.; Hu, B.; He, X. Effects of composition changes of coal treated with hydrochloric acid on pore structure and fractal characteristics. Fuel 2021, 294, 120506. [Google Scholar] [CrossRef]
- Zheng, C.; Liu, S.; Xue, S.; Jiang, B.; Chen, Z. Effects of chemical solvents on coal pore structural and fractal characteristics: An experimental investigation. Fuel 2022, 327, 125246. [Google Scholar] [CrossRef]
- Jiang, J.Y.; Zhang, Q.; Cheng, Y.P.; Wang, H.; Liu, Z. Quantitative investigation on the structural characteristics of thermally metamorphosed coal: Evidence from multi-spectral analysis technology. Environ. Earth Sci. 2017, 76, 406. [Google Scholar] [CrossRef]
- GB/T 21650.3-2011; Pore Size Distribution and Porosity of Solid Materials by Mercury Porosimetry and Gas Adsorption—Part 3: Analysis of Micropores by Gas Adsorption. Standardization Administration: Beijing, China, 2011. (In Chinese)
- Pfeifer, P.; Avnir, D. Chemistry in noninteger dimensions between two and three. I. Fractal theory of heterogeneous surfaces. J. Chem. Phys. 1983, 79, 3558–3565. [Google Scholar] [CrossRef]
- Drake, J.M.; Yacullo, L.N.; Levitz, P.; Klafter, J. Nitrogen adsorption on porous silica: Model-dependent analysis. J. Phys. Chem. 1994, 98, 380–382. [Google Scholar] [CrossRef]
- Xu, L.; Zhang, J.; Ding, J.; Liu, T.; Shi, G.; Li, X.; Dang, W.; Cheng, Y.; Guo, R. Pore structure and fractal characteristics of different shale lithofacies in the dalong formation in the western area of the lower yangtze platform. Minerals 2020, 10, 72. [Google Scholar] [CrossRef]
- Liu, R.L.; Cheng, W.M.; Yu, Y.B.; Xu, Q.; Jiang, A.; Lv, T. An impacting factors analysis of miners’ unsafe acts based on HFACS-CM and SEM. Process Saf. Environ. Prot. 2019, 122, 221–231. [Google Scholar] [CrossRef]
- Alafnan, S.; Awotunde, A.; Glatz, G.; Adjei, S.; Alrumaih, I.; Gowida, A. Langmuir adsorption isotherm in unconventional resources: Applicability and limitations. J. Pet. Sci. Eng. 2021, 207, 109172. [Google Scholar] [CrossRef]
- Nie, B.; Liu, X.; Yang, L.; Meng, J.; Li, X. Pore structure characterization of different rank coals using gas adsorption and scanning electron microscopy. Fuel 2015, 158, 908–917. [Google Scholar] [CrossRef]
- Wang, D.; Yang, H.; Wu, Y.; Zhao, C.; Ju, F.; Wang, X.; Zhang, S.; Chen, H. Evolution of pore structure and fractal characteristics of coal char during coal gasification. J. Energy Inst. 2020, 93, 1999–2005. [Google Scholar] [CrossRef]
- Li, Z.; Ni, G.; Sun, L.; Sun, Q.; Li, S.; Dong, K.; Xie, J.; Wang, G. Effect of ionic liquid treatment on pore structure and fractal characteristics of low rank coal. Fuel 2020, 262, 116513. [Google Scholar]
Disclaimer/Publisher’s Note: The statements, opinions and data contained in all publications are solely those of the individual author(s) and contributor(s) and not of MDPI and/or the editor(s). MDPI and/or the editor(s) disclaim responsibility for any injury to people or property resulting from any ideas, methods, instructions or products referred to in the content. |
© 2024 by the authors. Licensee MDPI, Basel, Switzerland. This article is an open access article distributed under the terms and conditions of the Creative Commons Attribution (CC BY) license (https://creativecommons.org/licenses/by/4.0/).