Abstract
Stock trading faces significant challenges due to market volatility and the complexity of integrating diverse data sources, such as financial texts and numerical market data. This paper proposes an innovative automated trading system that integrates advanced natural language processing (NLP) and deep reinforcement learning (DRL) to address these challenges. The system combines two novel components: PrimoGPT, a Transformer-based NLP model fine-tuned on financial texts using instruction-based datasets to generate actionable features like sentiment and trend direction, and PrimoRL, a DRL model that expands its state space with these NLP-derived features for enhanced decision-making precision compared to traditional DRL models like FinRL. An experimental evaluation over seven months of leading technology stocks reveals cumulative returns of up to 58.47% for individual stocks and 27.14% for a diversified portfolio, with a Sharpe ratio of 1.70, outperforming traditional and advanced benchmarks. This work advances AI-driven quantitative finance by offering a scalable framework that bridges qualitative analysis and strategic action, thereby fostering smarter and more equitable participation in financial markets.
1. Introduction
Financial markets are the lifeblood of global economies, channeling resources among individuals, businesses, and governments to drive investment and prosperity [1,2]. At the heart of this system lies the stock market, a dynamic domain where stocks, bonds, and other long-term instruments shape economic outcomes [3]. The stock market is a volatile and complex system. It is influenced by corporate earnings, policy shifts, investor sentiment, and breaking news [4]. This intricate interplay presents a formidable challenge: how to navigate its unpredictability and capitalize on its opportunities with precision and efficiency. For decades, investors and analysts have sought tools to decode this complexity, evolving from manual strategies to increasingly sophisticated technologies [5].
The quest for automation in stock trading reflects a recognition that human decision-making, while insightful, is often outpaced by the speed and scale of modern markets [6]. Traditional trading approaches rely on historical data and human intuition, struggling to adapt to rapid market changes or process vast amounts of information [7]. Today, artificial intelligence (AI) offers a transformative solution, enabling systems to analyze vast datasets, interpret qualitative narratives, and execute decisions in real time [8]. Among these advancements, natural language processing (NLP) and deep reinforcement learning (DRL) stand out as powerful tools to address the dual demands of understanding market context and optimizing trading actions [9,10]. By blending the ability to extract meaning from text with adaptive decision-making, these technologies can potentially revolutionize how we engage with financial markets [11].
This research is driven by the need to overcome the limitations of conventional trading systems in an era of unprecedented data richness and market dynamism [12]. Financial texts, news reports, earnings statements, and online discourse carry critical insights that numerical data alone cannot capture, influencing investor behavior and stock valuations [13]. Meanwhile, the unpredictable nature of markets demands strategies that evolve through experience, balancing risk and reward without rigid assumptions [14]. Integrating NLP and DRL, this study proposes the Primo system, a novel framework to process diverse inputs and deliver robust trading outcomes, aiming to mirror the expertise of seasoned analysts while surpassing their speed and scalability [15]. Beyond technical innovation, this work provides open-source implementations and transparent methodologies [16].
The paper introduces two custom-built components: PrimoGPT, an NLP model designed to distill actionable insights from financial texts, and PrimoRL, a DRL agent crafted to refine trading strategies in real-world market simulations. Together, they form a system that predicts market trends and acts on them with precision, addressing challenges like volatility and information overload [17]. Section 2 reviews prior efforts in this space, providing context for the proposed approach. The subsequent sections outline the methodology, experimental design, and findings, culminating in a discussion of their implications for financial technology. By harnessing AI to integrate qualitative and quantitative data, this study aims to advance automated trading methodologies.
The unique contribution of this paper lies in its integration of PrimoGPT, a Transformer-based NLP model fine-tuned to generate structured, actionable features (e.g., sentiment, trend direction, investor confidence) from financial texts, with PrimoRL, a DRL framework that employs a continuous action space and a dynamic Sharpe ratio-based reward function for precise, risk-adjusted trading decisions. Unlike prior systems like FinRL, which use discrete actions and numerical data, or financial NLP models like FinBERT, which focus on broad text processing, Primo bridges qualitative and quantitative analysis to enhance adaptability in volatile markets. This scalable and transparent framework enhances accessibility to advanced analytical tools for retail investors and institutions, reduces dependence on proprietary systems, and optimizes risk-adjusted performance in dynamic market environments. The experimental results demonstrate the system’s effectiveness, achieving cumulative returns of up to 58.47% for individual stocks and 27.14% for a diversified portfolio, along with a Sharpe ratio of 1.70, outperforming traditional and advanced benchmarks.
2. Related Work
AI and financial trading research have grown to tackle the complexity and volatility of stock markets. This section reviews prior work in two key areas relevant to the proposed study: the application of NLP for extracting financial insights from textual data and the use of DRL for optimizing trading strategies. These fields, although distinct, have been converging in recent years, reflecting a broader trend toward integrative AI systems in quantitative finance. The following discussion synthesizes foundational contributions, state-of-the-art advancements, and open challenges, situating the current research within the evolving landscape of financial technology.
2.1. Natural Language Processing in Financial Markets
Financial markets, encompassing both monetary and capital segments, allocate resources and facilitate economic growth through transactions among individuals, corporations, and governments [1,2]. Within this ecosystem, the stock market emerges as a particularly volatile domain, influenced by a complex interplay of factors, including corporate earnings, macroeconomic policies, and public sentiment [3]. Traditional financial theories, notably the Efficient Market Hypothesis (EMH) by Fama [18,19] assert that stock prices fully incorporate all available information in a transparent and competitive market, implying that price movements are inherently unpredictable based on historical data alone. However, recent empirical studies challenge this notion, suggesting that advanced analytical methods can extract predictive signals from market data, including unstructured textual sources [6,20,21]. This section examines the role of NLP in financial markets, highlighting its evolution and application in extracting actionable insights from textual data to enhance trading strategies.
Historically, stock market analysis relied heavily on quantitative approaches, such as statistical time-series models like autoregressive conditional heteroskedasticity (ARCH) or autoregressive integrated moving average (ARIMA) [7]. While these methods provided a foundation for understanding price trends, they often struggled with financial data’s nonlinear and noisy nature [8]. The advent of machine learning introduced more robust techniques, such as decision trees [22,23] and support vector machines [24], which improved pattern recognition capabilities. However, these models primarily focused on numerical data, historical prices and trading volumes, leaving a gap in capturing the qualitative factors that drive market behavior. Financial markets are not solely governed by numbers; news articles, corporate announcements, and social media posts significantly influence investor sentiment and, consequently, stock prices [5]. This recognition spurred the integration of NLP into financial analysis, enabling the processing of vast textual corpora to uncover hidden market signals.
The transformative potential of NLP in finance became evident with the introduction of the Transformer architecture by Vaswani et al. [9], which revolutionized the field by leveraging attention mechanisms to model contextual relationships in text. This breakthrough paved the way for large language models (LLMs), such as the Generative Pre-trained Transformer (GPT) series [25], capable of understanding and generating human-like text with unprecedented accuracy. In the financial context, NLP applications center on sentiment analysis, a technique that assesses the emotional tone of textual data to predict market trends [13,26]. For example, Bollen et al. [13] demonstrated that Twitter sentiment could forecast stock market movements, while Bhardwaj et al. [26] applied similar methods to Indian stock indices, highlighting the global relevance of this approach. Beyond social media, financial news and earnings reports offer rich sources of information, with studies showing that media sentiment can significantly impact risk and returns [27,28].
The development of specialized financial LLMs has further advanced NLP’s utility in trading. Models like BloombergGPT [29], trained on proprietary financial datasets, and FinGPT [15], an open-source alternative, are tailored to the unique linguistic and contextual demands of the financial domain. These models excel at tasks such as extracting sentiment polarity, identifying key events, and summarizing complex reports, providing traders with structured insights from unstructured data. For instance, FinBERT [30] preprocesses financial texts to generate embeddings that capture domain-specific nuances, enhancing the accuracy of downstream predictions [31]. However, implementing NLP in finance poses challenges, including the need for high-quality, real-time data and the computational resources required for training large models [15]. Proprietary systems like BloombergGPT often lack transparency, prompting initiatives like AI4Finance’s open-source efforts to democratize access to financial NLP tools [15,16].
In practice, NLP enhances traditional trading strategies by offering a qualitative perspective through which to interpret market dynamics. By analyzing news headlines or earnings calls, NLP models can detect shifts in sentiment that precede price movements, offering a predictive edge over purely quantitative methods [32]. This capability is particularly valuable in volatile markets, where rapid responses to external narratives are critical. Nonetheless, the effectiveness of NLP depends on overcoming issues such as data noise, temporal relevance, and the risk of overfitting to specific textual patterns [33]. As financial markets continue to evolve, NLP stands as a cornerstone technology, bridging the gap between human intuition and algorithmic precision, and setting the stage for integration with advanced decision-making frameworks, such as DRL.
2.2. DRL in Stock Markets
The stock market, a vital subset of financial markets, facilitates long-term investments through instruments like stocks and bonds, distinguishing itself from the short-term focus of money markets [2,3]. The complexity of this domain, characterized by price fluctuations driven by economic indicators, corporate performance, and investor behavior, presents both opportunities and challenges for automated trading systems [17]. This section explores DRL as a cutting-edge methodology for financial trading, emphasizing its ability to optimize strategies in dynamic market environments adaptively.
The evolution of machine learning in finance has progressed from basic statistical models to sophisticated deep learning techniques. Early methods, such as ARMA models [7], were limited by their linear assumptions, prompting the adoption of nonlinear models like decision trees [22,23] and recurrent neural networks [34]. While these advancements improved predictive accuracy, they often operated in a supervised learning paradigm, requiring labeled data that may not fully capture the real-time decision-making demands of trading [8]. DRL, an extension of reinforcement learning principles [35], addresses this limitation by enabling an agent to learn optimal actions through interaction with an environment without predefined labels. Introduced in seminal works, such as Mnih et al.’s Deep Q-Network (DQN) [36], DRL combines neural networks with reinforcement learning to handle high-dimensional state spaces, making it well-suited for financial applications.
In the context of stock trading, DRL models an agent that navigates a market environment, selecting actions: buy, sell, or hold to maximize a reward function, typically tied to portfolio returns or risk-adjusted metrics, such as the Sharpe ratio [37]. Unlike supervised learning, which predicts static outputs, DRL balances exploration (testing new strategies) and exploitation (refining known ones), adapting to market shifts in real time [10]. Algorithms such as Q-learning, DQN [36], Double DQN (DDQN) [38], Proximal Policy Optimization (PPO) [39], and Soft Actor-Critic (SAC) [40] have been applied to financial problems, with PPO gaining prominence for its stability and sample efficiency [41]. Frameworks like FinRL [14] and TradeMaster [42] simplify DRL implementation, offering reproducible environments and benchmarks for quantitative trading. These tools enable agents to process complex inputs, including price histories, technical indicators, and portfolio states, often surpassing human traders in scalability and speed [12].
DRL’s application in financial markets offers several advantages. Its model-agnostic nature allows it to operate without assumptions about market distributions, which makes flexibility critical in volatile conditions [43]. Studies like Jiang et al. [12] and Théate and Ernst [44] demonstrate DRL’s ability to optimize trading strategies across diverse assets, while Liu et al. [14] highlight its scalability to large portfolios. For instance, FinRL integrates DRL with market simulators, enabling agents to learn from historical data and adapt to unseen scenarios [45]. Additionally, DRL’s capacity to incorporate external signals, such as sentiment derived from news or social media, enhances its decision-making power, a synergy explored in hybrid systems [11]. This adaptability is particularly valuable in addressing market anomalies and psychological factors that challenge EMH, as noted by Malkiel [21] and Lo [46].
Despite its promise, DRL in financial trading faces challenges, including high computational demands, sensitivity to hyperparameter tuning, and the risk of overfitting historical patterns [47]. The dynamic nature of markets requires continuous learning, a capability still under development in many DRL systems [11]. Nevertheless, open-source initiatives, such as those by the AI4Finance Foundation [14,16] promote accessibility and collaboration, driving innovation in this field. By simulating the strategic reasoning of expert traders, DRL offers a robust framework for automating financial decisions, laying the groundwork for integration with NLP to create comprehensive, data-driven trading systems.
3. Methodology
This section presents the methodology employed in developing a system for automated trading in stock markets. The system architecture, detailed in the following subsections, comprises three key components, as illustrated in Figure 1: data collection, which aggregates market data and financial news from external sources; PrimoGPT, an NLP-based module that extracts features from unstructured data like company news; and PrimoRL, a DRL-based module that generates trading actions to maximize returns.
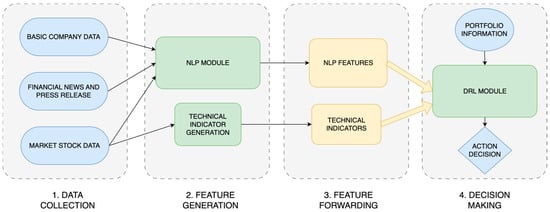
Figure 1.
System architecture illustrates the complete workflow, beginning with data collection and NLP feature extraction, which are subsequently input into the DRL module responsible for determining the following trading action.
System architecture illustrates the complete workflow, beginning with data collection and NLP feature extraction, which are subsequently input into the DRL module responsible for determining the following trading action. The modular design ensures scalability, reliability, and adaptability, which is critical for efficient trading in dynamic stock markets [11,48]. This architecture enables seamless integration of new components and adjustments to evolving market conditions, laying a solid foundation for precise trade execution.
3.1. Data Collection
The data collection phase is fundamental to the system, as the quality and quantity of data significantly influence the performance of machine learning models [49]. Data is sourced from Finnhub [50] and Yahoo Finance [51], selected for their reliability, timeliness, and cost-effectiveness, particularly for research purposes. Finnhub provides basic company information (e.g., company name, stock ticker, industry, market capitalization, employee count, closing price, and price change) and alternative data, such as financial news and press releases. Yahoo Finance provides market data, including daily opening, highest, lowest, and adjusted closing prices, as well as trading volume, which is essential for generating technical indicators.
Returns are calculated daily using the adjusted closing prices from Yahoo Finance [52]. These returns are then categorized using a mapping process that determines the direction of the return (upward “U” if positive, downward “D” if negative), computes the absolute percentage change, rounds it up, and assigns a textual label. For instance, if the absolute change is 5% or less, the label reflects the exact percentage (e.g., “U3” for a 3% increase); otherwise, it is capped at “U5+” or “D5+” for larger movements. This categorization aids in further analysis by converting numerical returns into descriptive labels.
Financial news is filtered to include only articles published outside New York Stock Exchange (NYSE) trading hours from sources such as Fintel, InvestorPlace, Seeking Alpha, Yahoo, CNBC, TipRanks, MarketWatch, The Fly, Benzinga, TalkMarkets, and Stock Options Channel [53]. These sources provide analyses, stock news, expert predictions, and market updates, often impacting prices during after-hours trading [54]. Press releases, critical for understanding company developments, include titles and descriptions, such as announcements of new products or board changes. In addition to market data and financial news, the data collection process generates technical indicators from stock market data to serve as inputs for the PrimoRL module. The definitions and mathematical formulations of the technical indicators used are provided in Section III.B.
3.2. Technical Indicator Formulations
Technical indicators, widely used in technical analysis, provide insights into price trends, momentum, volatility, and market strength, enhancing the system’s ability to predict future movements and test trading strategies [55]. The following technical indicators are computed from the collected Yahoo Finance data, specifically daily price and volume information.
3.2.1. Simple Moving Average (SMA)
The SMAs n past closing prices to smooth fluctuations and highlight trends according to (1):
where Pt−i is the closing price at time t − 1, and n = 30 or 60 days. The SMA identifies long-term price trends, aiding trend-following strategies by reducing noise in price data [56].
3.2.2. Moving Average Convergence/Divergence (MACD)
The MACD measures momentum by differencing short- and long-term EMAs as shown in (2):
where EMAm(t) represents the short-term exponential moving average and EMAn(t) is the long-term exponential moving average, typically using m = 12 and n = 26 days. The signal line is calculated using (3):
where EMAp(t) represents the exponential moving average of MACD values over p periods, typically p = 9 days. The MACD detects momentum shifts and trend reversals, enabling timely entry/exit decisions in dynamic markets [57].
3.2.3. Bollinger Bands (BBs)
Bollinger Bands measure volatility using a 20-day simple moving average (SMA) and standard deviation. The bands are constructed around the SMA, with the upper band positioned two standard deviations above the SMA and the lower band two standard deviations below it. This creates three lines that form the Bollinger Bands: the middle line corresponds to the SMA while the upper and lower lines represent resistance and support levels, respectively; n = 20 days.
Bollinger Bands gauge market volatility and signal potential reversal points when prices interact with the bands, improving trade timing and identifying overbought/oversold conditions in combination with other indicators [57].
3.2.4. Relative Strength Index (RSI)
The RSI measures price change momentum (0–100) using (4):
where RS is the ratio of exponentially smoothed average gains to exponentially smoothed average losses over a specified period, typically 14 days. Values above 70 indicate overbought conditions while values below 30 suggest oversold conditions; n = 14 days. The RSI identifies overextended price movements and potential trend reversals, supporting both momentum and mean-reversion strategies [56].
3.2.5. Commodity Channel Index (CCI)
The CCI detects cyclical trends via price deviations as defined in (5):
where pt is the typical price (average of high, low, and close), SMA(pt) is the simple moving average of typical prices, and σ(pt) represents the mean absolute deviation. The constant 0.015 ensures that most values oscillate between −100 and +100, with n = 20 days. Values beyond ±100 signal potential overbought/oversold states. The CCI identifies cyclical price patterns and momentum shifts, supporting short-term trading strategies in volatile markets [57].
3.2.6. Direction Movement Index (DX)
The DX assesses trend strength regardless of direction through (6):
where +DI and −DI are calculated using smoothed directional movement and average true range (ATR) values over a specified period, typically n = 14 days. Values above 25 generally indicate strong trends, while values below 25 suggest weak or absent trends. The DX quantifies trend direction and strength, optimizing trend-following strategies and helping distinguish strong trends from random price movements [58].
The indicators SMA, MACD, BB, RSI, CCI, and DX were chosen for their comprehensive coverage of market trends, momentum, volatility, and cyclical patterns, as validated by prior research [11,14,55,59].
3.3. Financial Text Processing Module—PrimoGPT
The PrimoGPT module is designed to process financial texts and generate features that inform trading decisions within the automated trading system. It leverages two distinct feature sets: one derived from market data and another from basic company information and financial news. Features from market data, such as technical indicators, are standard components of technical analysis, providing quantitative insights into price movements [56]. In contrast, the second set, termed NLP features shown in Table 1, innovatively transforms qualitative data from financial news and press releases into numerical values suitable for DRL models.

Table 1.
NLP features generated with PrimoGPT.
This transformation is a key contribution of this work, enabling the system to integrate unstructured textual information into its decision-making framework. Unlike general-purpose financial NLP models such as FinBERT or BloombergGPT, which focus on sentiment classification or broad financial text processing, PrimoGPT is a domain-specialized generative model fine-tuned to produce structured trading features directly compatible with reinforcement learning environments.
These expertly constructed features were selected based on established research showing that sentiment polarity, earnings-related information, investor confidence, risk indicators, and news relevance are key drivers of market movements [60,61]. They provide a comprehensive and quantifiable representation of textual data for downstream processing. The −3 to +3 scale for sentiment, [0–2] scale for trend, [−1, 1] scale for impact, and [−2, 2] scale for high-volatility events were optimized through iterative testing of various scale ranges to align with the intensity and variability of financial market signals, ensuring that PrimoRL could effectively process sentiment extremes, trend directions, and impact magnitudes. Research by Callan et al. [62] supports this approach, demonstrating GPT-4’s effectiveness in financial analysis tasks like CFA exams with well-designed prompts, validating its application to financial text analysis.
The generation of these NLP features relies on carefully crafted prompts constructed using the LangChain library [63] to ensure flexibility and efficiency. The prompt instructs PrimoGPT, positioned as a senior quantitative analyst, to analyze company news and press releases, emphasizing factors such as subtle risks, market saturation, discrepancies between tone and content, over-optimism, and short-term versus long-term implications. While the full prompt is detailed in the published code repository, it essentially directs the model to produce the features mentioned above in a structured numerical format. LangChain integrates static instructions with dynamic inputs, such as company details, stock price changes, and recent news, to create a tailored query for each analysis instance.
PrimoGPT outputs these features in a consistent, machine-readable format, enabling seamless integration with the PrimoRL module. For example, given news about Apple Inc. (AAPL), the model might output a relevance of 2, sentiment of −1, and price impact of −2, reflecting a highly relevant but negative article with a moderate downward price effect. This structured output ensures high-quality, actionable data for DRL-based trading decisions, facilitating informed and effective trading decisions.
The PrimoGPT model, built on the Llama 3 architecture [64], was fine-tuned using an instruction-based training approach with datasets generated by GPT-4 [65]. These datasets consist of instruction-input-response triplets that include company information, financial news, and contextual information about next-day stock price movements [66]. The inclusion of future price movements during the training phase enables the model to learn predictive patterns that link textual content to subsequent market behavior. Crucially, this forward-looking information is used exclusively during training to teach the model these associations; during operational deployment, PrimoGPT generates features based solely on current inputs without any access to future data. To ensure methodological rigor, the training dataset (GOOGL, META, AMD, TSLA) and the evaluation dataset (AAPL, NFLX, MSFT, CRM, AMZN) are strictly separated, with no overlap between stocks used in PrimoGPT’s training and those subsequently analyzed in the PrimoRL trading system [45]. This separation validates the model’s ability to generalize financial language understanding to previously unseen companies.
3.4. DRL Trading Framework—PrimoRL
The PrimoRL module forms the core of the automated trading system, utilizing DRL to interpret input data and generate trading actions that aim to maximize investment returns. Its architecture, depicted in Figure 2, comprises key components: an environment layer that simulates market conditions, a state-action-reward interaction framework, and an agent layer that implements DRL algorithms. These components interact dynamically, enabling the system to adapt to real-time market changes and optimize trading strategies [67].
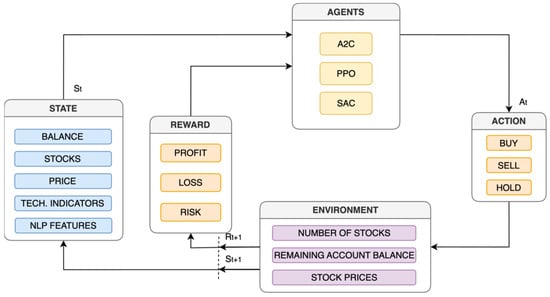
Figure 2.
Illustration of the PrimoRL trading framework. The model processes the current state, including account balance, stock holdings, client information, technical indicators, and NLP features. Rewards, based on profit, loss, and risk, guide agents (A2C, PPO, SAC) in selecting trading actions (buy, hold, sell). The environment updates based on executed actions, influencing subsequent decisions.
The model processes the current state, including account balance, stock holdings, client information, technical indicators, and NLP features. Rewards, based on profit, loss, and risk, guide agents (A2C, PPO, SAC) in selecting trading actions (buy, hold, sell). The environment updates based on executed actions, influencing subsequent decisions.
PrimoRL leverages OpenAI Gymnasium [68] to provide standardized environments for training DRL agents, ensuring a consistent and reproducible simulation framework. Building on this, FinRL [14], a specialized library for financial market simulations, is integral to constructing realistic trading environments using historical market data. FinRL’s time-driven simulation approach allows agents to observe price changes, execute actions, and receive rewards, closely mimicking real-world trading dynamics. Additionally, Stable Baselines 3 [69] enhances the implementation with robust, pre-built DRL algorithms such as A2C, SAC, and PPO. A2C combines policy and value function updates but proved sensitive to hyperparameters and unstable with complex inputs, often failing to converge effectively. SAC, designed for continuous action spaces, also exhibited instability and inconsistent performance under volatile market conditions. PPO, however, balances exploration and exploitation effectively, adapting robustly to dynamic market environments [10]. This combination enables systematic testing and refinement of trading strategies tailored to stock markets.
The state, action, reward, policy (SARP) space defines PrimoRL’s operational framework, structured as a Markov Decision Process (MDP) for sequential decision-making [10]. States include a comprehensive set of observations: account balance (available cash), shares owned (quantity per stock), share values (current worth), closing prices, technical indicators (e.g., RSI, MACD), and NLP features from PrimoGPT [14]. These technical and NLP features are combined by concatenating their feature lists into a single state vector using a Python 3.12 list concatenation operation, as in FinRL [14]. Actions are continuous values ranging from −1 (full sell) to 1 (full buy), scaled by a maximum share limit (hmax) and rounded to integers for execution [70]. Unlike FinRL’s discrete action approach, this continuous space offers greater precision and flexibility in trade adjustments.
PrimoRL’s reward function employs a dynamic approach that adjusts the reward structure based on the agent’s learning stage and the amount of historical data available. In the initial phase, when the portfolio has fewer than 30 recorded return values, the reward is based solely on expected raw portfolio returns. As the training progresses and enough history becomes available, the reward function transitions to a Sharpe ratio-based formulation [71]. This shift introduces a risk-adjusted performance measure that encourages the agent to prefer consistent and stable returns over volatile but potentially higher short-term gains. The use of the Sharpe ratio allows the reinforcement learning agent to internalize the trade-off between return and risk in a statistically grounded manner. This approach ensures numerical stability and avoids unreliable estimations that often occur when statistical metrics are computed on insufficient data.
This methodology draws on prior work that advocates for the use of the Sharpe ratio in reinforcement learning for financial applications. Specifically, we rely on the differential Sharpe ratio for online learning introduced by Moody and Saffell [71], and more recent actor-critic-based formulations that incorporate average Sharpe-based rewards [72]. These approaches have demonstrated improved learning stability and convergence when compared to return-only reward functions, particularly in non-stationary environments.
The policy, driven by one of the described DRL algorithms in Figure 2, evolves to optimize these rewards. PrimoRL distinguishes itself from FinRL by incorporating NLP features into the state space and adopting a continuous action model, enhancing its responsiveness to complex market signals.
4. Model Training and Evaluation Method
The Primo system comprises two distinct models: PrimoGPT and PrimoRL, each trained on separate datasets. For training the PrimoGPT model, a dataset consisting of financial textual data from four technology companies was utilized: Alphabet Inc. (GOOGL), Meta Platforms, Inc. (META), Advanced Micro Devices, Inc. (AMD), and Tesla, Inc. (TSLA). The experimental setup for evaluating the proposed automated stock trading system involved carefully curated datasets and a structured timeline to ensure robust training and testing phases while maintaining strict separation between the two model components to prevent data leakage.
The PrimoRL model was trained and evaluated using market data from five different technology companies known for their market volatility and liquidity: Apple Inc. (AAPL), Netflix Inc. (NFLX), Microsoft Corporation (MSFT), Salesforce, Inc. (CRM), and Amazon.com, Inc. (AMZN). These stocks were selected to assess the system’s ability to interpret complex market signals and execute trading decisions effectively [73]. The data spanned from 1 April 2022, to 28 February 2025, encompassing a range of diverse market conditions. This period was divided into two phases: the training phase, from 1 April 2022, to 31 July 2024, allowed PrimoRL to learn from a broad spectrum of market scenarios and develop robust trading strategies, while the testing (trading) phase, from 1 August 2024, to 28 February 2025, evaluated the model’s performance on unseen data, simulating real-world trading applications. This deliberate dataset separation ensures that PrimoGPT develops financial language understanding without prior exposure to the specific stocks subsequently used in PrimoRL’s training and evaluation, thereby validating both its generalization capability to unseen companies and preventing information leakage between model training phases.
4.1. Model Training
The PrimoGPT model, a specialized NLP component, was trained by fine-tuning the Llama 3 model to analyze financial texts and generate relevant trading features. This process utilized the Unsloth library [74] and was conducted on Google Colab with an A100 GPU. The Quantization-aware Low-Rank Adaptation (QLoRA) method was applied, quantizing model weights from 32 or 16 bits to 4 or 8 bits, reducing memory demands while maintaining performance, enabling efficient training of a model with billions of parameters on standard hardware [75,76]. The training dataset comprised 2973 examples formatted in the Alpaca structure, with each example including an instruction, input, and expected output tokenized to facilitate model processing [77]. Key hyperparameters included a learning rate of 2e−4, batch size of 2, gradient accumulation steps of 4, Rank (r) of 16, LoRA alpha of 16, maximum sequence length of 8192, one epoch, and the AdamW [58] 8-bit optimizer with a weight decay of 0.01, training only 42 million of the 8 billion parameters (0.5196%) for efficiency [78].
Training PrimoRL begins with initializing a trading environment using historical data configured through OpenAI Gymnasium and FinRL. The environment resets to an initial state (e.g., starting balance and portfolio) at the onset of each episode. Agents interact iteratively by observing the current state, selecting an action (buy, sell, or hold), and receiving a reward reflecting the portfolio’s financial outcome, adjusted for transaction costs and risk metrics. This cycle updates the environment state, simulating market shifts, and continues until the episode ends [45]. Over multiple episodes, agents refine their strategies across diverse market scenarios, guided by rewards that incentivize both profitability and consistency [70]. Post-training evaluation on a separate validation dataset assesses performance using metrics such as total return, Sharpe ratio, and maximum drawdown, ensuring the model’s robustness and practical applicability in real-world trading contexts.
Hyperparameter optimization used a grid search approach, testing values such as number of learning steps (1024, 2048, 4096; selected: 2048), batch size (64, 128, 256; selected: 128), and others, with the final configuration ensuring stable learning and effective generalization across market conditions [79]. The training involved integrating stock prices, technical indicators, and PrimoGPT-generated NLP features, with the model making daily decisions (buy, sell, or hold) based on current market states and past actions, monitored via metrics such as cumulative return and Sharpe ratio.
4.2. Evaluation of PrimoGPT Model Accuracy
To evaluate how well the PrimoGPT model predicts market movements, a custom method was designed focusing on its ability to generate useful features, especially sentiment and trends, which are known to influence stock prices [80]. The goal was to determine if the model’s predictions about the next day’s price direction, whether it would go up, down, or stay the same, matched what actually happened. The process starts with data that includes sentiment, trend direction, and actual price changes. For each day, the model looks at these features to guess the next day’s movement. If the news isn’t relevant or the sentiment and trend cancel each other out, it assumes the price will follow the previous day’s direction. Otherwise, it adds up the sentiment and trend values: a positive total suggests the price will rise, while a negative or zero total predicts a drop. Then, the actual price movement is determined as up if the price increases and down if it decreases. The algorithm compares these predictions with reality by lining up each day’s guess with the next day’s actual outcome, calculating how often they match.
The PrimoGPT model’s evaluation focused on transforming qualitative financial data into quantitative features, using LangChain scripts to apply the trained model to financial texts related to the target stocks. Accuracy was assessed over the testing period from August 1, 2024, to February 28, 2025, yielding the results presented in Table 2, which highlights PrimoGPT’s predictive potential.
Table 2.
PrimoGPT feature prediction accuracy.
This evaluation serves as a preliminary assessment of feature utility rather than a comprehensive standalone predictor, as the true value of PrimoGPT lies in its integration with the DRL framework. The modest accuracy ranges (45–58%) reflect the inherent difficulty of standalone directional prediction and underscore why integration with adaptive learning algorithms like DRL is necessary for superior performance.
4.3. Comparative Trading Strategies
To objectively compare the performance of the proposed system, several established trading strategies were selected as benchmarks, each with distinct methodologies widely recognized in the financial industry. The Buy and Hold (B&H) strategy involves purchasing stocks and retaining them regardless of short-term price fluctuations, capitalizing on long-term market growth while minimizing transaction costs [59]. The Momentum (MOM) strategy compares the current closing price to a previous period’s closing price, assuming that existing trends will persist; a higher current price signals a buy opportunity, while a lower price suggests a sell. The Price Minus Moving Average (P-MA) strategy uses a moving average of the stock price, assuming that in a trending market, the price will be above the average during uptrends and below during downtrends, triggering buy signals when the price crosses above and sell signals when it falls below [59]. The MACD strategy relies on the Moving Average Convergence Divergence indicator, measuring the difference between short-term and long-term exponential moving averages; a buy signal is generated when the MACD line crosses above the signal line and a sell signal when it crosses below, indicating potential trend shifts [59]. The FinRL strategy, an advanced DRL approach, adapts dynamically to market conditions using algorithms like PPO, A2C, and SAC, considering multiple factors such as price, volume, and technical indicators [45].
The Dow Jones Industrial Average (DJI) serves as a market benchmark, reflecting average performance across selected stocks [81]. The Mean-Variance strategy optimizes the risk-return tradeoff using historical data to calculate expected returns and covariances [37]. These strategies offer a comprehensive framework for assessing the proposed system’s effectiveness.
4.4. Performance Metrics
A set of standard metrics was employed to evaluate the effectiveness and risk associated with the trading strategies, as well as to assess the performance of the automated trading system comprehensively. These metrics included cumulative return, Sharpe ratio, volatility, and maximum drawdown, each providing unique insights into different aspects of the trading strategy’s performance, from overall profitability to risk exposure. Cumulative return measures the total growth or decline in the investment value over the specified period [52]. This metric is crucial for assessing the long-term success of the investment strategy by accumulating daily returns. The Sharpe ratio evaluates risk-adjusted performance by comparing the portfolio’s excess return over the risk-free rate to its volatility, defined as [82]. This ratio is beneficial for comparing different portfolios based on their ability to generate excess returns relative to risk.
Volatility, both daily and annualized, quantifies the variability or risk in portfolio returns, with annualized volatility providing a broader perspective on potential fluctuations over a yearly horizon. Daily volatility captures short-term movements in portfolio value. In contrast, annualized volatility scales these fluctuations to reflect long-term risk exposure based on the number of trading days in a year. By normalizing daily volatility, annualized volatility offers a standardized measure for comparing different portfolios and strategies in terms of risk over extended periods.
In addition to volatility, the maximum drawdown (MDD) [83] is a critical risk metric used to evaluate the resilience of a trading strategy under adverse market conditions. MDD represents the most significant observed decline in portfolio value from its peak to its subsequent lowest point over a given period. This measure provides insight into the worst-case scenario losses an investor may experience and highlights the portfolio’s vulnerability to significant downturns. Unlike volatility, which measures fluctuations around the average return, MDD quantifies explicitly the magnitude of potential losses, making it particularly valuable for risk-conscious investors. A lower MDD suggests a more stable portfolio, whereas a higher MDD indicates greater exposure to market downturns.
5. Experimental Results and Performance Analysis
This section presents a detailed analysis of the performance of the proposed automated trading system, focusing on the PrimoRL model’s effectiveness when utilizing NLP-generated features from the PrimoGPT model. The results are compared against a variety of established trading strategies, including the traditional Buy and Hold (B&H) approach, across individual stocks and at the portfolio level. The evaluation spans the testing period from 1 August 2024, to 28 February 2025, and employs standard performance metrics, including cumulative return, Sharpe ratio, annualized volatility, and maximum drawdown, to provide a comprehensive assessment.
The selected stocks represent diverse technology sector companies with varying market capitalizations and volatility profiles, from consumer electronics (AAPL) to streaming services (NFLX) and enterprise software (AMZN, CRM, MSFT). This diversity enables thorough evaluation of the system’s adaptability to different market behaviors and news sentiment patterns characteristic of each business model.
5.1. Trading Results for Individual Stocks
The PrimoRL model’s performance was evaluated across five individual stocks: AAPL, NFLX, MSFT, CRM, and AMZN. To streamline the comparison, the results are summarized in a single table, Table 3, pitting PrimoRL against the best-performing alternative strategy for each stock from B&H, MOM, P-MA, MACD, and FinRL. Full results can be found in the published code repository. The table includes key metrics highlighting the model’s effectiveness and risk management capabilities.
Table 3.
PrimoRL performance evaluation on individual stocks.
For AAPL, PrimoRL achieves a cumulative return of 20.20%, outperforming B&H (6.70%) and FinRL (3.73%), although it slightly trails the Momentum (MOM) strategy (21.20%). PrimoRL’s Sharpe Ratio (2.20) surpasses B&H (0.56), FinRL (0.43), and even MOM (2.16), indicating superior risk-adjusted returns. However, PrimoRL exhibits an annualized volatility of 15.27%, slightly lower than MOM’s 16.22%, suggesting a marginally lower risk level. Its maximum drawdown (−5.51%) is notably lower than MOM’s (−9.37%), reflecting stronger risk management. Thus, PrimoRL effectively balances returns and risk compared to B&H and FinRL, with the potential for further volatility optimization relative to MOM.
In the case of NFLX, PrimoRL delivers a cumulative return of 58.47%, slightly outperforming B&H (58.12%). Its Sharpe Ratio (2.80) exceeds B&H (2.62) and FinRL (1.93), highlighting superior returns relative to risk. Additionally, PrimoRL achieves lower annualized volatility (30.52% vs. B&H’s 32.82%) and a reduced maximum drawdown (−7.76% vs. B&H’s −10.90%). The reduced drawdown suggests improved downside protection, likely attributable to sentiment-based risk signals from financial news. These metrics demonstrate PrimoRL’s strong ability to maximize profitability while managing downside risks, as shown in cumulative return comparisons in Figure 3.
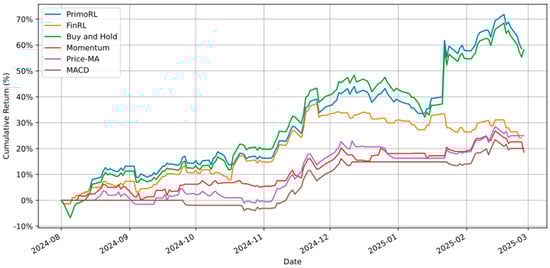
Figure 3.
Cumulative returns (%) comparison of PrimoRL, FinRL, B&H, MOM, P-MA, and MACD strategies for NFLX stock.
For MSFT, PrimoRL records a modest cumulative return of 0.53%, slightly outperforming FinRL (0.24%) but performing worse than B&H (−4.63%). Its Sharpe Ratio (0.14) is higher than FinRL (0.12), indicating better risk-adjusted returns despite challenging conditions. PrimoRL’s annualized volatility (19.35%) and maximum drawdown (−13.39%) are slightly higher than FinRL’s (21.03% volatility, −9.48% drawdown), suggesting a trade-off in stability. These results reflect PrimoRL’s ability to maintain slight profitability in uncertain markets, though the higher drawdown indicates room for improvement in volatile conditions.
With CRM, PrimoRL surpasses all other strategies, achieving a cumulative return of 33.64%, higher than P-MA (22.36%). Its Sharpe Ratio (2.29), though trailing P-MA’s (1.77), indicates strong risk-adjusted performance. However, PrimoRL’s annualized volatility (23.53% vs. P-MA’s 21.27%) and maximum drawdown (−7.56% vs. −11.53%) reflect greater risk acceptance for enhanced returns. The superior cumulative return compensates for the moderately higher volatility, as demonstrated in the trading signal analysis shown in Figure 4.
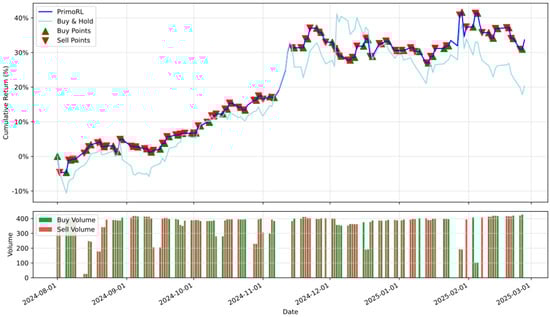
Figure 4.
Buy/sell signal visualization and trading volume of PrimoRL trading strategy for CRM stock.
Finally, for AMZN, PrimoRL achieves a cumulative return of 25.45%, surpassing FinRL (20.30%) and B&H (15.35%). Its Sharpe Ratio (1.64) exceeds FinRL (1.35) and B&H (0.96), indicating superior risk-adjusted returns. PrimoRL’s annualized volatility (26.49%) and maximum drawdown (−11.90%) align with those of FinRL, suggesting comparable risk exposure.
To statistically validate the observed performance differences, the Diebold-Mariano (DM) test [61] with the Harvey-Leybourne-Newbold (HLN) correction [84] was applied to compare PrimoRL against the best-performing alternative strategy for each stock. The DM test evaluates the null hypothesis that two forecasting methods exhibit equal predictive accuracy by comparing their loss differentials, while the HLN modification improves finite-sample performance through an adjusted test statistic. As shown in Table 4, PrimoRL significantly outperforms the competing strategies for AAPL (p = 0.017, DM = −2.41) and CRM (p < 0.001, DM = −5.69), demonstrating superior risk-adjusted returns with statistical confidence at α = 0.05. For NFLX and AMZN, the differences were not statistically significant (p = 0.062 and p = 0.869, respectively), suggesting comparable performance to Buy & Hold and FinRL in these cases. Notably, for MSFT, FinRL significantly outperformed PrimoRL (p < 0.001, DM = 3.66), reflecting challenges in adapting to this stock’s specific market conditions during the testing period. For NFLX, the marginal p-value reflects nearly identical cumulative returns (58.47% vs. 58.12%), though PrimoRL demonstrates superior risk metrics. For AMZN, while PrimoRL achieves higher returns (25.45% vs. 20.30%), similar day-to-day trading patterns limit statistical power. These cases illustrate that non-significant test results can coexist with meaningful differences in risk-adjusted performance.
Table 4.
Diebold-Mariano test with HLN correction for individual stocks.
In summary, PrimoRL consistently achieves competitive or superior performance across stocks and metrics. It excels in cumulative returns and Sharpe Ratios, optimizing risk-adjusted outcomes while generally managing volatility and drawdowns effectively. Further refinement in volatility and drawdown for MSFT and CRM could enhance its robustness, but PrimoRL establishes itself as a valuable framework for automated financial trading.
5.2. Portfolio Trading Results
The portfolio-level analysis evaluated the PrimoRL model’s performance across a diversified set of five stocks (AAPL, NFLX, MSFT, CRM, and AMZN), comparing it against multiple strategies, including traditional benchmarks and variants of the FinRL model that employ different reinforcement learning agents: A2C, SAC, and PPO. The comparative strategies included the Mean-Variance method, which optimizes the risk-return tradeoff based on historical data [37], and the Dow Jones Industrial Average (DJI), a passive market benchmark that reflects average stock performance [81]. The FinRL variants represent advanced DRL approaches that adapt dynamically to market conditions using price, volume, and technical indicators [45].
The portfolio-level results summarized in Table 5 identify PrimoRL (PPO) as the top-performing strategy, achieving the highest cumulative return (23.10%) along with the strongest Sharpe ratio (1.45), outperforming all other evaluated methods. PrimoRL (PPO) notably outperformed the best FinRL variant (SAC), which yielded slightly lower returns (20.30%) and a significantly lower Sharpe ratio (1.05), accompanied by higher annualized volatility (32.10% vs. PrimoRL PPO’s 25.75%) and a more pronounced maximum drawdown (−14.75% vs. PrimoRL PPO’s −10.10%). In contrast, PrimoRL (SAC) achieved a lower cumulative return (8.75%) and a modest Sharpe ratio (0.65), suggesting SAC was less effective in combination with NLP-generated features for the evaluated market conditions. The Mean-Variance approach provided stable yet lower cumulative returns (18.45%) with a solid Sharpe ratio (1.32), while the passive DJI strategy achieved modest returns (5.20%) and a lower Sharpe ratio (0.78), underscoring the limitations inherent to passive investment strategies.
Table 5.
PrimoRL performance evaluation on portfolio trading.
The temporal performance trends depicted in Figure 5 provides additional insights into the strategies’ dynamics over time. PrimoRL (PPO) achieves the highest cumulative return of 27.14% with a Sharpe ratio of 1.70, outperforming FinRL (SAC) which achieved 24.50% return with a Sharpe ratio of 1.28. This represents a notable improvement over traditional approaches, with Mean-Variance reaching 22.24% and the passive DJI benchmark reaching only 6.35%.
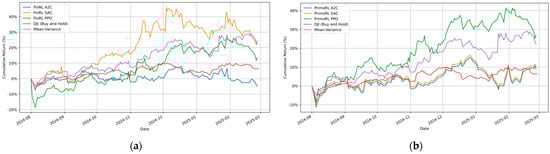
Figure 5.
Cumulative returns (%) of FinRL and PrimoRL variants (A2C, SAC, PPO) compared to Mean-Variance and DJI benchmarks. (a) FinRL variants showing superior adaptability of RL-based strategies; (b) PrimoRL variants highlighting PrimoRL (SAC) as the optimal strategy with superior returns and controlled risk exposure.
Interestingly, the performance of DRL agents varies significantly between the PrimoRL and FinRL frameworks. While SAC performs strongly within FinRL (24.50% return), its performance degrades when integrated with NLP features in PrimoRL (10.01% return). Conversely, PPO shows improved performance when combined with NLP features, suggesting different agents respond differently to the inclusion of textual features in their state space.
The volatility patterns reveal important distinctions among the models. PrimoRL (PPO) maintains controlled volatility at 27.01% with a maximum drawdown of −11.44%, demonstrating effective risk management. In contrast, FinRL (SAC), despite strong returns, exhibits higher volatility (34.53%) and drawdown (−16.50%), indicating a more aggressive trading strategy. Both A2C variants show poor performance, with FinRL (A2C) generating negative returns (−4.83%) and PrimoRL (A2C) achieving only modest gains (8.94%).
Statistical validation through the Diebold-Mariano test with HLN correction [61,84] confirms PrimoRL (PPO)’s superior performance at the portfolio level. As presented in Table 6, PrimoRL (PPO) significantly outperforms FinRL (SAC) with p = 0.021 (DM = −2.33), providing statistical evidence that the integration of NLP-derived features enhances trading performance beyond traditional DRL approaches. However, when compared to the Mean-Variance strategy, the relationship reverses, with Mean-Variance demonstrating statistically significant superior performance (p < 0.001, DM = 4.79). This finding suggests that while PrimoRL (PPO) excels among DRL-based approaches and outperforms passive benchmarks, classical portfolio optimization methods retain competitive advantages in certain market conditions, particularly in terms of risk-adjusted consistency across diversified holdings.
Table 6.
Diebold-Mariano test with HLN correction for portfolio trading.
The results suggest that the integration of NLP features within PrimoRL particularly benefits the PPO algorithm, enabling it to interpret market signals better and execute more informed trading decisions. The improved Sharpe ratio of PrimoRL (PPO) compared to all other strategies indicates superior risk-adjusted returns, making it suitable for portfolio-level optimization where balancing returns with risk management is crucial.
These findings underscore the importance of selecting algorithms carefully when implementing NLP-enhanced reinforcement learning for portfolio management. While PPO emerges as the most effective agent when combined with textual features, the varying performance across different agent-framework combinations demonstrates that no single approach universally dominates across all configurations. This validates Primo’s design philosophy of tightly integrating instruction-tuned NLP features with continuous action spaces, offering practical advantages beyond FinRL’s discrete actions or FinGPT’s general-purpose text processing.
6. Conclusions and Future Work
This paper introduces a novel automated stock trading system that integrates DRL and advanced NLP to enhance decision-making in stock markets. The proposed system addresses key challenges such as market volatility and information complexity by combining PrimoGPT, a Transformer-based NLP model for extracting actionable features from financial texts, with PrimoRL, a DRL framework for adaptive trading strategies. The experimental results obtained over a rigorous testing period from August 1, 2024, to February 28, 2025, across stocks of leading technology firms, AAPL, NFLX, MSFT, CRM, and AMZN, clearly demonstrate the system’s capability to achieve superior performance. Notably, PrimoRL delivered cumulative returns of 20.20%, 58.47%, 0.53%, 33.64%, and 25.45%, respectively, consistently outperforming conventional benchmarks such as Buy and Hold (B&H) and frequently surpassing other advanced DRL strategies like FinRL.
At the portfolio level, PrimoRL combined with the Proximal Policy Optimization (PPO) agent exhibited exceptional performance, achieving the highest cumulative return of 23.10% alongside the strongest risk-adjusted metric, a Sharpe ratio of 1.45. This result surpasses traditional strategies, such as the Mean-Variance approach (18.45%) and the passive DJI benchmark (5.20%), and outperforms FinRL’s SAC variant (20.30%). PrimoRL (PPO) also maintained controlled volatility (25.75%) and demonstrated effective risk mitigation, as evidenced by its moderate maximum drawdown (−10.10%).
Interestingly, PrimoRL using the Soft Actor-Critic (SAC) agent achieved a lower cumulative return (8.75%) and a modest Sharpe ratio (0.65) at the portfolio level, suggesting that SAC was less effective in combination with NLP-generated features for the evaluated market conditions. These observations highlight the importance of selecting agents that align with specific trading contexts and objectives.
The integration of NLP-derived features into PrimoRL’s state space significantly enhanced the model’s predictive and decision-making capabilities, enabling it to interpret qualitative market signals beyond traditional numerical indicators. This hybrid approach not only bridges textual analysis and strategic action, but also aligns closely with broader goals to democratize financial strategies through transparent and scalable methodologies. Although the PrimoRL system generally exhibited strong adaptability and risk-adjusted returns, specific scenarios, such as increased volatility and larger drawdowns observed with certain stocks (e.g., CRM and MSFT), suggest areas for further refinement. However, the system’s sensitivity to noisy financial news, limited interpretability of LLM-generated features, and untested robustness against rare market events represent important limitations that warrant further investigation.
Looking ahead, future work will focus on further enhancing the system’s architecture by incorporating NLP features directly into the reward function rather than limiting their role to the state space. This shift aims to more explicitly guide the DRL agent’s learning process by embedding qualitative insights, such as sentiment, investor confidence, and potential price impacts, into the optimization objective. By integrating these features into the reward mechanism, the system could better prioritize actions aligned with market narratives, potentially improving its responsiveness to real-time events and long-term trends. This approach will require designing a nuanced reward structure that balances immediate financial outcomes with the predictive signals derived from financial texts while avoiding overfitting to specific patterns.
Additional avenues for exploration include expanding the range of asset classes beyond stocks, such as exchange-traded funds (ETFs), bonds or cryptocurrencies, and refining PrimoGPT’s feature generation to capture more granular or sector-specific insights. These advancements promise to elevate the system’s performance further, solidifying its role as a cutting-edge tool in AI-driven financial innovation and opening new pathways for research in hybrid trading systems. Furthermore, we recognize that transitioning PrimoRL from a research prototype to a live trading system involves addressing practical deployment challenges such as latency, risk management, slippage, and regulatory compliance. These aspects are critical for real-world adoption but are beyond the scope of the current study. Future research will aim to incorporate robust mechanisms for managing these factors to ensure the system’s safety, reliability, and compliance in live market environments.
Author Contributions
Conceptualization, I.B. and T.P.; methodology, J.B.; software, I.B.; validation, I.B., T.P. and J.B.; formal analysis, I.B.; investigation, I.B.; resources, I.B. and T.P.; data curation, J.B.; writing—original draft preparation, I.B., T.P. and J.B.; writing—review and editing, I.B., T.P. and J.B.; visualization, I.B.; supervision, J.B. All authors have read and agreed to the published version of the manuscript.
Funding
This research received no external funding.
Institutional Review Board Statement
Not applicable.
Informed Consent Statement
Not applicable.
Data Availability Statement
The raw data supporting the conclusions of this article will be made available by the authors on request.
Conflicts of Interest
The authors declare no conflicts of interest.
References
- Orsag, S. Investment Analysis; Ekonomski fakultet–Zagreb: Zagreb, Croatia, 2015. [Google Scholar]
- Mishkin, F.S.; Eakins, S. Financial Markets and Institutions; PEARSON: London, UK, 2018. [Google Scholar]
- Saunders, A.; Cornett, M.M.; Erhemjamts, O. Financial Markets and Institutions; McGraw Hill: Columbus, OH, USA, 2022. [Google Scholar]
- Lam, M. Neural Network Techniques for Financial Performance Prediction: Integrating Fundamental and Technical Analysis. Decis. Support. Syst. 2004, 37, 567–581. [Google Scholar] [CrossRef]
- Shah, D.; Isah, H.; Zulkernine, F. Stock Market Analysis: A Review and Taxonomy of Prediction Techniques. Int. J. Financ. Stud. 2019, 7, 26. [Google Scholar] [CrossRef]
- Sahu, S.K.; Mokhade, A.; Bokde, N.D. An Overview of Machine Learning, Deep Learning, and Reinforcement Learning-Based Techniques in Quantitative Finance: Recent Progress and Challenges. Appl. Sci. 2023, 13, 1956. [Google Scholar] [CrossRef]
- Chen, M.-Y.; Chen, B.-T. A Hybrid Fuzzy Time Series Model Based on Granular Computing for Stock Price Forecasting. Inf. Sci. 2015, 294, 227–241. [Google Scholar] [CrossRef]
- Chen, Y.; Hao, Y. A Feature Weighted Support Vector Machine and K-Nearest Neighbor Algorithm for Stock Market Indices Prediction. Expert Syst. Appl. 2017, 80, 340–355. [Google Scholar] [CrossRef]
- Vaswani, A.; Shazeer, N.; Parmar, N.; Uszkoreit, J.; Jones, L.; Gomez, A.N.; Kaiser, L.; Polosukhin, I. Attention Is All You Need. In Proceedings of the 31st International Conference on Neural Information Processing Systems, Long Beach, CA, USA, 4–9 December 2017. [Google Scholar]
- Hambly, B.; Xu, R.; Yang, H. Recent Advances in Reinforcement Learning in Finance. Math. Financ. 2023, 33, 437–503. [Google Scholar] [CrossRef]
- Liu, X.-Y.; Xia, Z.; Yang, H.; Gao, J.; Zha, D.; Zhu, M.; Wang, C.D.; Wang, Z.; Guo, J. Dynamic Datasets and Market Environments for Financial Reinforcement Learning. Mach. Learn. 2024, 113, 2795–2839. [Google Scholar] [CrossRef]
- Jiang, Z.; Xu, D.; Liang, J. A Deep Reinforcement Learning Framework for the Financial Portfolio Management Problem. In Proceedings of the 2017 Intelligent Systems Conference, London, UK, 7–8 September 2017. [Google Scholar]
- Bollen, J.; Mao, H.; Zeng, X. Twitter Mood Predicts the Stock Market. J. Comput. Sci. 2011, 2, 1–8. [Google Scholar] [CrossRef]
- Liu, X.-Y.; Yang, H.; Chen, Q.; Zhang, R.; Yang, L.; Xiao, B.; Wang, C.D. FinRL: A Deep Reinforcement Learning Library for Automated Stock Trading in Quantitative Finance. arXiv 2020, arXiv:2011.09607. [Google Scholar] [CrossRef]
- Yang, H.; Liu, X.-Y.; Wang, C.D. FinGPT: Open-Source Financial Large Language Models. arXiv 2023, arXiv:2307.10485. [Google Scholar] [CrossRef]
- Wang, N.; Yang, H.; Wang, C.D. FinGPT: Instruction Tuning Benchmark for Open-Source Large Language Models in Financial Datasets. arXiv 2023, arXiv:2310.04793. [Google Scholar]
- Mohan, R. Stock Markets: An Overview and A Literature Review. MPRA Pap. 2019, 101855. [Google Scholar] [CrossRef]
- Fama, E.F. Efficient Capital Markets A Review of Theory and Empirical Work. J. Financ. 1970, 25, 383–417. [Google Scholar] [CrossRef]
- Fama, E.F. The Behavior of Stock-Market Prices. J. Bus. 1965, 38, 34–105. [Google Scholar] [CrossRef]
- Fama, E.F. Efficient Capital Markets: II. J. Financ. 1991, 46, 1575–1617. [Google Scholar] [CrossRef]
- Malkiel, B.G. The Efficient Market Hypothesis and Its Critics. J. Econ. Perspect. 2003, 17, 59–82. [Google Scholar] [CrossRef]
- Nugroho, F.X.S.D.; Adji, T.B.; Fauziati, S. Decision Support System for Stock Trading Using Multiple Indicators Decision Tree. In Proceedings of the 2014 The 1st International Conference on Information Technology, Computer, and Electrical Engineering, Semarang, Indonesia, 7–8 November 2014; pp. 291–296. [Google Scholar]
- Kamble, R.A. Short and Long Term Stock Trend Prediction Using Decision Tree. In Proceedings of the 2017 IEEE International Conference on Intelligent Computing and Control Systems (ICICCS), Madurai, India, 15–16 June 2017; pp. 1371–1375. [Google Scholar]
- Xie, B.; Passonneau, R.J.; Wu, L.; Creamer, G.G. Semantic Frames to Predict Stock Price Movement. In Proceedings of the 51st Annual Meeting of the Association for Computational Linguistics, Sofia, Bulgaria, 4–9 August 2013. [Google Scholar]
- Radford, A.; Narasimhan, K.; Salimans, T.; Sutskever, I. Improving Language Understanding by Generative Pre-Training. 2018. Available online: https://www.semanticscholar.org/paper/Improving-Language-Understanding-by-Generative-Radford-Narasimhan/cd18800a0fe0b668a1cc19f2ec95b5003d0a5035 (accessed on 24 November 2025).
- Bhardwaj, A.; Narayan, Y.; Dutta, M. Sentiment Analysis for Indian Stock Market Prediction Using Sensex and Nifty. Procedia Comput. Sci. 2015, 70, 85–91. [Google Scholar] [CrossRef]
- Calomiris, C.W.; Mamaysky, H. How News and Its Context Drive Risk and Returns around the World. J. Financ. Econ. 2019, 133, 299–336. [Google Scholar] [CrossRef]
- Tetlock, P.C. Giving Content to Investor Sentiment: The Role of Media in the Stock Market. J. Financ. 2007, 62, 1139–1168. [Google Scholar] [CrossRef]
- Wu, S.; Irsoy, O.; Lu, S.; Dabravolski, V.; Dredze, M.; Gehrmann, S.; Kambadur, P.; Rosenberg, D.; Mann, G. BloombergGPT: A Large Language Model for Finance. arXiv 2023, arXiv:2303.17564. [Google Scholar] [CrossRef]
- Liu, Z.; Huang, D.; Huang, K.; Li, Z.; Zhao, J. FinBERT: A Pre-Trained Financial Language Representation Model for Financial Text Mining. In Proceedings of the Twenty-Ninth International Conference on International Joint Conferences on Artificial Intelligence, Yokohama, Japan, 11–17 July 2020. [Google Scholar]
- Huang, A.H.; Wang, H.; Yang, Y. FinBERT: A Large Language Model for Extracting Information from Financial Text. Contemp. Account. Res. 2023, 40, 806–841. [Google Scholar] [CrossRef]
- Lopez-Lira, A.; Tang, Y. Can ChatGPT Forecast Stock Price Movements? Return Predictability and Large Language Models. arXiv 2023, arXiv:2304.07619. [Google Scholar] [CrossRef]
- Glasserman, P.; Lin, C. Assessing Look-Ahead Bias in Stock Return Predictions Generated By GPT Sentiment Analysis. J. Financial Data Sci. 2023, 6, 25–42. [Google Scholar] [CrossRef]
- Zou, J.; Zhao, Q.; Jiao, Y.; Cao, H.; Liu, Y.; Yan, Q.; Abbasnejad, E.; Liu, L.; Shi, J.Q. Stock Market Prediction via Deep Learning Techniques: A Survey. arXiv 2022, arXiv:2212.12717. [Google Scholar]
- Sutton, R.S.; Barto, A.G. Reinforcement Learning: An Introduction; MIT Press: Cambridge, MA, USA, 2018; ISBN 9780262039246. [Google Scholar]
- Mnih, V.; Kavukcuoglu, K.; Silver, D.; Rusu, A.A.; Veness, J.; Bellemare, M.G.; Graves, A.; Riedmiller, M.; Fidjeland, A.K.; Ostrovski, G.; et al. Human-Level Control through Deep Reinforcement Learning. Nature 2015, 518, 529–533. [Google Scholar] [CrossRef]
- Markowitz, H. Portfolio Selection. J. Financ. 1952, 7, 7791. [Google Scholar]
- Van Hasselt, H.; Guez, A.; Silver, D. Deep Reinforcement Learning with Double Q-Learning. Proc. AAAI Conf. Artif. Intell. 2016, 30. [Google Scholar]
- Schulman, J.; Wolski, F.; Dhariwal, P.; Radford, A.; Klimov, O. Proximal Policy Optimization Algorithms. arXiv 2017, arXiv:1707.06347. [Google Scholar] [CrossRef]
- Haarnoja, T.; Zhou, A.; Abbeel, P.; Levine, S. Soft Actor-Critic: Off-Policy Maximum Entropy Deep Reinforcement Learning with a Stochastic Actor. In Proceedings of the International Conference on Machine Learning, Stockholm, Sweden, 10–15 July 2018. [Google Scholar]
- Kozlica, R.; Wegenkittl, S.; Hirländer, S. Deep Q-Learning versus Proximal Policy Optimization: Performance Comparison in a Material Sorting Task. In Proceedings of the 2023 IEEE 32nd International Symposium on Industrial Electronics, Helsinki, Finland, 19–21 June 2023. [Google Scholar]
- Sun, S.; Qin, M.; Zhang, W.; Xia, H.; Zong, C.; Ying, J.; Xie, Y.; Zhao, L.; Wang, X.; An, B. TradeMaster: A Holistic Quantitative Trading Platform Empowered by Reinforcement Learning. Adv. Neural Inf. Process. Syst. 2023, 36, 59047–59061. [Google Scholar]
- Buehler, H.; Gonon, L.; Teichmann, J.; Wood, B.; Mohan, B.; Kochems, J. Deep Hedging: Hedging Derivatives Under Generic Market Frictions Using Reinforcement Learning. SSRN Electron. J. 2019, 19–80. [Google Scholar] [CrossRef]
- Théate, T.; Ernst, D. An Application of Deep Reinforcement Learning to Algorithmic Trading. Expert Syst. Appl. 2021, 173, 114632. [Google Scholar] [CrossRef]
- Liu, X.-Y.; Xia, Z.; Rui, J.; Gao, J.; Yang, H.; Zhu, M.; Wang, C.D.; Wang, Z.; Guo, J. FinRL-Meta: Market Environments and Benchmarks for Data-Driven Financial Reinforcement Learning. Adv. Neural Inf. Process. Syst. 2022, 1835–1849. [Google Scholar] [CrossRef]
- Lo, A.W. The Adaptive Markets Hypothesis. J. Portf. Manag. Forthcom. 2004. [Google Scholar]
- Pricope, T.-V. Deep Reinforcement Learning in Quantitative Algorithmic Trading: A Review. arXiv 2021, arXiv:2106.00123. [Google Scholar] [CrossRef]
- Li, Z.; Liu, X.-Y.; Zheng, J.; Wang, Z.; Walid, A.; Guo, J. FinRL-Podracer: High Performance and Scalable Deep Reinforcement Learning for Quantitative Finance. In Proceedings of the Second ACM International Conference on AI in Finance, New York, NY, USA, 3–5 November 2021. [Google Scholar] [CrossRef]
- De Prado, L. Advances in Financial Machine Learning; John Wiley and Sons: Hoboken, NJ, USA, 2018. [Google Scholar]
- Finnhub Free Stock API and Financial Data. Available online: https://finnhub.io/ (accessed on 10 July 2024).
- Pack, T. New Features Enhance Yahoo Finance for Everyday Investors; Information Today: Medford, NJ, USA, 2024; pp. 7–9. [Google Scholar]
- Olorunnimbe, K.; Viktor, H. Deep Learning in the Stock Market—A Systematic Survey of Practice, Backtesting, and Applications. Artif. Intell. Rev. 2023, 56, 2057–2109. [Google Scholar] [CrossRef] [PubMed]
- New York Stock Exchange (NYSE). Available online: https://www.nyse.com/ (accessed on 10 July 2024).
- Cui, B.; Gozluklu, A.E. News and Trading After Hours. Soc. Sci. Res. Netw. 2021. [Google Scholar] [CrossRef]
- Botunac, I.; Panjkota, A.; Matetic, M. The Effect of Feature Selection on the Performance of Long Short-Term Memory Neural Network in Stock Market Predictions. In Proceedings of the Annals of DAAAM and Proceedings of the International DAAAM Symposium, Mostar, Bosnia and Herzegovina, 21–24 October 2020; pp. 592–598. [Google Scholar]
- Murphy, J.J. Technical Analysis of the Financial Markets; Penguin: London, UK, 1999. [Google Scholar]
- Colby, R.W. The Encyclopedia of Technical Market Indicators; McGraw-Hill: Columbus, OH, USA, 2003; ISBN 9780071711623. [Google Scholar]
- Loshchilov, I.; Hutter, F. Decoupled Weight Decay Regularization. arXiv 2017, arXiv:1711.05101. [Google Scholar]
- Botunac, I.; Bosna, J.; Matetić, M. Optimization of Traditional Stock Market Strategies Using the LSTM Hybrid Approach. Information 2024, 15, 136. [Google Scholar] [CrossRef]
- Li, F. The Information Content of Forward-Looking Statements in Corporate Filings -A Naïve Bayesian Machine Learning Approach. J. Account. Res. 2010, 48, 1049–1102. [Google Scholar] [CrossRef]
- Diebold, F.X.; Mariano, R.S. Comparing Predictive Accuracy. J. Bus. Econ. Stat. 2002, 20, 134–144. [Google Scholar] [CrossRef]
- Callanan, E.; Mbakwe, A.; Papadimitriou, A.; Pei, Y.; Sibue, M.; Zhu, X.; Ma, Z.; Liu, X.; Shah, S. Can GPT Models Be Financial Analysts? An Evaluation of ChatGPT and GPT-4 on Mock CFA Exams. In Proceedings of the Eighth Financial Technology and Natural Language Processing and the 1st Agent AI for Scenario Planning, Jeju, Republic of Korea, 3 August 2023. [Google Scholar]
- LangChain LangChain. Available online: https://www.langchain.com/ (accessed on 12 July 2024).
- Dubey, A.; Jauhri, A.; Pandey, A.; Kadian, A.; Al-Dahle, A.; Letman, A.; Mathur, A.; Schelten, A.; Yang, A.; Fan, A.; et al. The Llama 3 Herd of Models. arXiv 2024, arXiv:2407.21783. [Google Scholar] [CrossRef]
- Peng, B.; Li, C.; He, P.; Galley, M.; Gao, J. Instruction Tuning with GPT-4. arXiv 2023, arXiv:2304.03277. [Google Scholar] [CrossRef]
- Huerta-Enochian, M. Instruction Fine-Tuning: Does Prompt Loss Matter? arXiv 2024, arXiv:2401.13586. [Google Scholar] [CrossRef]
- FinRL Three-Layer Architecture. Available online: https://finrl.readthedocs.io/en/latest/start/three_layer.html (accessed on 21 September 2024).
- OpenAI Gymnasium: A Toolkit for Developing and Comparing Reinforcement Learning Algorithms. Available online: https://gymnasium.farama.org/ (accessed on 10 July 2024).
- Stable-Baselines3 Reliable Reinforcement Learning Implementations. Available online: https://stable-baselines3.readthedocs.io/ (accessed on 10 July 2024).
- Liu, X.-Y.; Xiong, Z.; Zhong, S.; Yang, H.; Walid, A. Practical Deep Reinforcement Learning Approach for Stock Trading. arXiv 2018, arXiv:1811.07522. [Google Scholar]
- Moody, J.; Saffell, M. Reinforcement Learning for Trading Systems and Portfolios. J. Forecast. 1998, 17, 441–470. [Google Scholar] [CrossRef]
- Huang, Y.; Zhou, C.; Zhang, L.; Lu, X. A Self-Rewarding Mechanism in Deep Reinforcement Learning for Trading Strategy Optimization. Mathematics 2024, 12, 4020. [Google Scholar] [CrossRef]
- Zhang, W.; Zhao, L.; Xia, H.; Sun, S.; Sun, J.; Qin, M.; Li, X.; Zhao, Y.; Zhao, Y.; Cai, X.; et al. A Multimodal Foundation Agent for Financial Trading: Tool-Augmented, Diversified, and Generalist. In Proceedings of the 30th ACM SIGKDD Conference on Knowledge Discovery and Data Mining, Barcelona, Spain, 25–29 August 2024. [Google Scholar]
- Unsloth Unsloth AI. Available online: https://unsloth.ai/ (accessed on 22 August 2024).
- Dettmers, T.; Pagnoni, A.; Holtzman, A.; Zettlemoyer, L. QLoRA: Efficient Finetuning of Quantized LLMs. Adv. Neural Inf. Process. Syst. 2023, 36, 10088–10115. [Google Scholar]
- Ni, H.; Meng, S.; Chen, X.; Zhao, Z.; Chen, A.; Li, P.; Zhang, S.; Yin, Q.; Wang, Y.; Chan, Y. Harnessing Earnings Reports for Stock Predictions: A QLoRA-Enhanced LLM Approach. In Proceedings of the 2024 6th International Conference on Data-driven Optimization of Complex Systems (DOCS), Hangzhou, China, 16–18 August 2024. [Google Scholar]
- Taori, R.; Gulrajani, I.; Zhang, T.; Dubois, Y.; Li, X.; Guestrin, C.; Hashimoto, T.B. Alpaca—A Strong, Replicable Instruction-Following Model. Stanf. Cent. Res. Found. Models 2023, 3, 7. [Google Scholar]
- Labonne, M. Fine-Tune Llama 3.1 Ultra-Efficiently with Unsloth. Available online: https://towardsdatascience.com/fine-tune-llama-3-1-ultra-efficiently-with-unsloth-7196c7165bab (accessed on 22 August 2024).
- Eimer, T.; Lindauer, M.; Raileanu, R. Hyperparameters in Reinforcement Learning and How to Tune Them. In Proceedings of the International Conference on Machine Learning, Honolulu, HI, USA, 23–29 July 2023. [Google Scholar]
- Zhang, B.; Yang, H.; Zhou, T.; Babar, A.; Liu, X.-Y. Enhancing Financial Sentiment Analysis via Retrieval Augmented Large Language Models. In Proceedings of the Fourth ACM International Conference on AI In Finance, New York, NY, USA, 27–29 November 2023. [Google Scholar]
- S&P Global S&P Dow Jones Indices. Available online: https://www.spglobal.com/en (accessed on 22 August 2024).
- Ye, A.; Xu, J.; Wang, Y.; Yu, Y.; Yan, D.; Chen, R.; Dong, B.; Chaudhary, V.; Xu, S. Learning the Market: Sentiment-Based Ensemble Trading Agents. arXiv 2024, arXiv:2402.01441. [Google Scholar] [CrossRef]
- Yu, Y.; Li, H.; Chen, Z.; Jiang, Y.; Li, Y.; Zhang, D.; Liu, R.; Suchow, J.W.; Khashanah, K. FinMem: A Performance-Enhanced LLM Trading Agent with Layered Memory and Character Design. arXiv 2023, arXiv:2309.03736. [Google Scholar]
- Harvey, D.; Leybourne, S.; Newbold, P. Testing the Equality of Prediction Mean Squared Errors. Int. J. Forecast. 1997, 13, 281–291. [Google Scholar] [CrossRef]
Disclaimer/Publisher’s Note: The statements, opinions and data contained in all publications are solely those of the individual author(s) and contributor(s) and not of MDPI and/or the editor(s). MDPI and/or the editor(s) disclaim responsibility for any injury to people or property resulting from any ideas, methods, instructions or products referred to in the content. |
© 2025 by the authors. Licensee MDPI, Basel, Switzerland. This article is an open access article distributed under the terms and conditions of the Creative Commons Attribution (CC BY) license (https://creativecommons.org/licenses/by/4.0/).