Abstract
High-bypass ratio engines are currently among the most investigated solutions to achieve efficiency benefits and noise reduction in gas turbine engines. When equipped with a gearbox, these engines enable an optimized operation of the fan and of the low-pressure core, resulting in reduced weight and fuel consumption. The higher spool speed allows higher pressure ratios per stage, and consequently a reduced stage count. However, all this contributes to an enhanced sensitivity of the engine components to the development of secondary flow structures and separations, with a consequent impact on the aerodynamic performance and stability. In this context, an experimental campaign was conducted at the von Karman Institute for Fluid Dynamics on a highly loaded axial compressor representative of the first stage of a modern booster. The aim was to identify the flow features responsible of the performance loss at the operating points and speeds considered more critical in terms of rotor inlet incidence. To this end, time-averaged instrumentation was employed to characterize the performance and to retrieve the distribution of flow quantities at different axial positions within the stage, while fast-response probes allowed for the detailed characterization of the rotor outlet flow field. Unsteady 3D simulations complemented the experimental results and supported this interpretation, especially in regions with limited instrumentation access. The experimental and numerical results emphasized the role of the secondary flow structures developing near the hub wall as the main drivers for aerodynamic stall, due to the enhanced loading in this blade region.
1. Introduction
High-bypass (HB) turbofans are designed to bypass a larger mass flow at a lower pressure ratio, achieving equivalent thrust with improved propulsive efficiency [1]. The Geared Turbofan (GT) technology enhances this design by using a gearbox to separate the fan from the low-pressure core, enabling larger fan diameters, reduced fan speeds, and improved noise reduction. In this configuration, the core operates at higher speeds with fewer stages and reduced size, thereby reducing the overall engine weight [1,2,3]. Together with this, the improvement of the gas turbine cycle efficiency demands a higher overall engine pressure ratio. This can be achieved by either increasing the blade count up to a certain extent (increase in profile losses and weight) or by adopting higher speeds and higher stage loading, which enable a higher pressure rise per stage or a reduction in the number of stages [4]. As a result, modern axial compressors are designed with highly loaded blade geometries and rotors running at higher speeds to handle a larger portion of the overall engine pressure ratio.
However, as the blade loading increases, secondary flows can become more significant, potentially impacting the aerodynamic performance and stability of the compressor. The role of loading in the definition of the compressor performance has been a topic of extensive study in recent years. In a recent work conducted by [5], different stage designs were compared with different loading and pressure rise coefficients. The authors highlighted that at higher loading levels, the stages exhibited reduced overall efficiency due to increased losses occurring within the rotor passage. In [6], the authors conducted a design space exploration to rank the variables having the greatest impact on the loss items of an axial compressor stage. Solidity and loading coefficient were identified as primary parameters influencing the total pressure loss in the rotor, demonstrating a clear relevance over other design parameters.
The relationship between loading and development of secondary flows in compressors, such as corner separations, has been widely investigated both experimentally and numerically [7,8,9,10,11]. However, most contributions available in the literature utilized simplified configurations, such as compressor cascades, to effectively characterize these flow structures and their link with the blade loading, which are only partially representative of real engine environments. In [12], the authors examined the role of the hub corner separation in a more complex compressor configuration featuring a single-row low-speed stage. They highlighted how disturbances caused by the hub corner separation were transferred to the tip-leakage flow, leading to the growth of disturbances and the initiation of a rotating stall process. Currently, few contributions exist in the literature regarding the role of secondary flows on the performance and stability in more complex stage configurations that are representative of modern engines. The onset of rotating stall in a multi-stage high-speed machine was investigated both experimentally and numerically in [13,14]. Different hub and tip flow structures were originated depending on the activated stall family, which grew and merged into distinct stall cells. A strong correlation was found between the predicted aerodynamic loading and the intensity of the rotating stall within each stall family.
This summary underscores how the interaction between secondary flows and their effects in complex stage environments can hinder the identification of the flow mechanisms responsible for reduced stage operation and stability.
To contribute to the advancement of the existing state of the art on the topic, this paper presents an experimental investigation conducted on a highly loaded axial compressor, representative of the first stage of a modern engine booster. The experimental campaign is complemented by 3D URANS simulations, which provide insight into regions where instrumentation access was not possible. The objective is to provide a clear characterization of the critical flow mechanisms considered responsible for the development of aerodynamic stall, along with their contribution in the performance and stability deterioration. Specifically, the analysis is conducted within the stable operating range of the machine and at operating points located near the stall boundary, where critical flow features are activated and observable.
This manuscript corresponds to an extended version of the paper published in the proceedings of the 16th European Turbomachinery Conference [15].
2. Experimental Apparatus
2.1. Compressor Test-Article and VKI-R4 Facility
The compressor considered is a 1.5-stage, consisting of an Inlet Guide Vane (IGV) row with 100 blades, a rotor with 76 blades, and a stator with 100 blades. The fixed-stagger IGV is positioned to replicate the span-wise distribution of flow quantities at the outlet of a fan. The rotor blades have a hub-to-tip ratio of 0.82 and an inlet relative Mach number of approximately 0.75 at the tip. The nominal rotational speed is 8748 rpm. Table 1 and Figure 1 report, respectively, the main design and flow features of the stage and its sectional view, where the axial measurement planes (0, 1, 2, 3 and 4) are visible. The aerodynamic design of the rotor, characterized by a large rotor hub loading and a high Degree of Reaction (DOR), as reported in Table 1, makes this compressor representative of the first stage of a modern engine booster.

Table 1.
Compressor design and flow features.
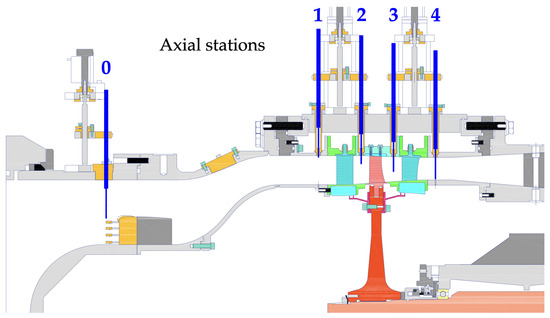
Figure 1.
DREAM compressor test-section.
The DREAM compressor stage is installed in the von Karman Institute high-speed compressor test rig R4 (Figure 2). This facility consists of (1) a tank, (2) the compressor test article, (3) a discharge collector, (4) a return duct to drive the air back to the reservoir, and (5) a throttling valve for precise adjustment of the compressor operating point. The rotor is driven by a 700 kW DC motor whose rotational speed can be controlled continuously. The closed-loop configuration allows the pressure adjustment within 0.3 and 3 bars, while the heat exchanger located in the settling chamber regulates the total temperature at the test section inlet with an accuracy of ±1 °C. Such operation of the facility enables an independent variation in Reynolds and Mach numbers to accurately replicate specific aircraft flight conditions, such as cruise (CR) or take-off (TO).
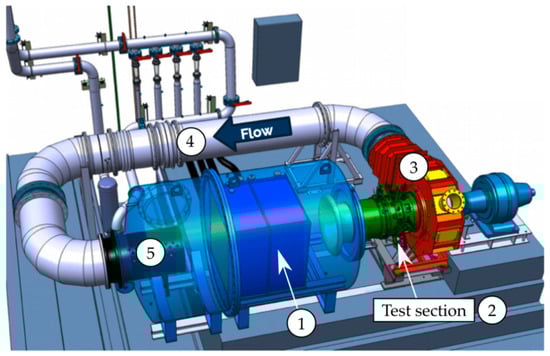
Figure 2.
von Karman Institute R4 facility: closed-loop high-speed compressor test rig.
2.2. Operating Conditions of Interest
For the present investigation, the set of speeds corresponding to 60%, 70%, 80%, 85%, 90%, 96%, and 100% of the nominal speed were tested to characterize the performance and identify the operating range of the stage. However, a detailed characterization of the machine is provided only at 100% speed, as it represents the condition resulting in higher sensitivity to variations in rotor incidence and therefore more critical for the development of secondary flow structures. Specifically, two operating points will be analyzed in detail: design (DE) and near-stall (NS). The DE condition does not represent the point of maximum efficiency of the stage but is characterized by a mass flow located at the center of the operating range at maximum speed. The NS condition, instead, corresponds to the operating point acquired just before the onset of aerodynamic stall. For this work, the Reynolds number was set to atmospheric conditions.
2.3. Instrumentation Layout and Measurement Devices
In Figure 1, the axial measurement planes are defined as follows: Plane 0 (stage inlet), Plane 1 (IGV inlet), Plane 2 (IGV outlet/rotor inlet), Plane 3 (rotor outlet/stator inlet), and Plane 4 (stage outlet). The instrumentation employed in this study can be categorized into (a) fixed instrumentation, which includes rakes positioned in Plane 0 and Plane 4 to measure the whole stage performance, static pressure taps for the measurement of wall-averaged static pressures, and fast-response wall casing sensors; and (b) movable instrumentation, consisting of probes that traverse radially across all axial planes and at four azimuthal positions per plane (0°, 90°, 180°, 270°).
2.3.1. Fixed Instrumentation
In Plane 0, where the flow is uniform, 4 rakes are equally distributed across the annulus. At the outlet, 4 rakes are arranged circumferentially to span one stator pitch, ensuring a representative average of the outlet quantities. Each rake is equipped with 6 total pressure/total temperature Kiel heads positioned at radii corresponding to the centers of equivalent areas.
For the present work, 8 static pressure taps uniformly installed around the annulus at the stage inlet on the hub and tip walls, were employed. A linear interpolation of the hub and tip wall static pressures, together with the measurement of the inlet total pressure and temperature at the location of the Kiel heads, enabled the computation of the mass flow. The stage characteristic and the performance were recorded at a sampling rate of 2 Hz.
A total of 15 flush-mounted Kulite sensors (K1–K15) are installed on the rotor casing to detect unsteady pressure signals and reconstruct the tip flow in the rotor relative frame of reference. Among these, the K14 and K15 sensors (Figure 3), located axially in Plane 2 and Plane 3, were employed for the present measurement campaign and used to validate the CFD results at the rotor casing (Section 4.3.2).
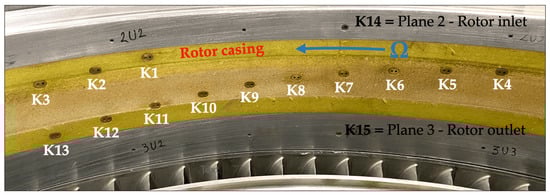
Figure 3.
Fast-response casing sensors: distribution on the rotor casing.
The uncertainties computed with the ASME method [16] for the corrected mass flow, pressure ratio, temperature ratio, and efficiency, expanded to a 95% confidence interval, are, respectively, equal to ±0.078 kg/s, ±0.00071, ±0.00245, and ±2.0% at DE conditions. Instead, the uncertainty computed for the static pressure acquired by the fast-response casing sensors is ±0.11% of the inlet total pressure.
2.3.2. Movable Instrumentation
Three types of traversing probes were employed for the measurement campaign: (1) 3-hole virtual fast-response pressure probe for the acquisition of unsteady pressure signals; (2) 3-hole virtual pneumatic pressure probe; and (3) thermocouple probe.
The first two probes were operated in virtual mode, meaning that a single-hole probe was rotated around its axis to virtually simulate the presence of three holes, as in a multi-hole probe but with the assumption of steady periodic flow. This probe operation followed the methodology described in [17] to compute total pressure, Mach number, and absolute flow angle. The thermocouple was, instead, positioned in the direction of the average flow at mid-span to measure the total temperature. Moreover, the pneumatic probe was traversed among all the axial measurements planes, while the fast-response pressure probe and the thermocouple were employed in Plane 3 for the measurement of the rotor outlet flow field. All probes were traversed from 2.5% up to 97.5% span to avoid the probe heads colliding with the end-walls.
In this study, the fast-response pressure probe was used to reconstruct the Phase-Locked-Average (PLA) flow field in the rotor reference frame and the corresponding Root-Mean-Square (RMS) for the unsteady fluctuation. Rotor outlet span-wise distributions from the fast-response probe were obtained by arithmetically averaging the PLA in the pitch-wise direction. Time-resolved data were acquired at 500 kHz over a 1 s interval. The pneumatic and thermocouple probes, instead, were employed to obtain span-wise distributions and maps in the absolute frame of reference. Specifically, multiple traverses were performed at pitch-wise intervals of 5% of the pitch, covering one full pitch. The resulting span-wise distributions were then arithmetically averaged in the pitch-wise direction to have the final span-wise distributions. Tangential traversing was obtained by rotating the IGV and the outlet stator rows. The design of the test section allows for the synchronized rotation of both the inlet and outlet guide vanes without altering their relative positions, ensuring that the clocking between these components remains unaffected.
In terms of geometrical features, the fast-response and the pneumatic probes follow the same design, with a cylindrical head of 2 mm to reduce intrusiveness, while the thermocouple junction was shielded to limit the flow angle sensitivity. Figure 4 reports the pneumatic and the thermocouple probes employed for the present measurement campaign.
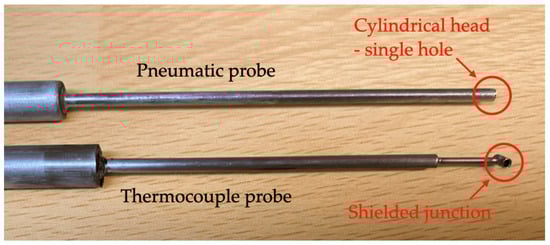
Figure 4.
The 3H-virtual pneumatic pressure probe and thermocouple probe.
To conclude, the final uncertainties for the fast-response probe, computed within the 95% confidence interval, are ±0.27% of the inlet total pressure, ±0.016, and ±0.8°, for the total pressure, Mach number, and flow angle. For the pneumatic probe, the uncertainties are ±0.33% of the inlet total pressure, ±0.013, and ±0.8°, for the total pressure, Mach number and flow angle, respectively. The uncertainty for the thermocouple probe is ±0.25% of the inlet total temperature. For other quantities, the propagated uncertainty was determined using the ASME method [16].
3. Numerical Method
3.1. Numerical Setup
Cadence Fine/Turbo was used to solve the fully turbulent compressible Reynolds-averaged Navier–Stokes (RANS) equations. These were spatially discretized using a cell-centered finite volume formulation on a multi-block structured grid. The Chien turbulence model was adopted for the turbulence closure, based on the turbulence model sensitivity analysis reported in [18]. At the inlet, experimental total pressure and temperature were imposed. The inlet turbulence intensity was set to 0.35% (experimentally measured and reported in [19]), while the inlet viscosity ratio was set to 50 due to the lack of experimental data, as this is considered a reasonable value for internal flows. This low value of inlet turbulence intensity was measured due to the presence of the heat exchanger at the stage inlet, which dampens both large- and small-scale turbulent structures. The experimental mass flow was imposed at the outlet. Air was modeled as a calorically perfect gas, with the walls of the numerical domain treated as adiabatic. Time integration to achieve a steady-state solution utilized an explicit multi-stage Runge–Kutta method with an implicit residual smoothing technique. Mixing planes were used at the rotor/stator interfaces for the steady numerical setup.
Unsteady simulations were employed for the present work with a domain scaling approach with 4/3/4 blades for IGV, rotor and stator rows, respectively. A total of 120 time-steps per rotor passage were used to solve accurately up to the fourth harmonic of the rotor BPF. In the present paper, only averaged quantities will be reported, obtained by averaging with a time-mean the URANS solution. The numerical span-wise distributions presented in this paper were computed by applying a mass-average in the pitch-wise direction. Even though this averaging method differs from that used for the experiments, it was verified that it had a negligible impact on the final results. Further details about the numerical setup employed for the present simulations can be found in [20].
3.2. Numerical Domain and Mesh
The inlet section was positioned at the measurement Plane 1, where experimental boundary conditions were available, while the outlet section was located downstream of the exit measurement plane to prevent any potential impact of the outlet boundary condition on the results at the location of experimental Plane 4. Technological features, such as filets, were included within the numerical domain, while cavities were excluded as their influence on the passage flow was found to be minimal. Moreover, the cavity geometry is closed in the real stage, and hence believed to have minimal impact on the results [21,22].
To ensure a better control of the grid quality, a multi-block structured mesh was generated using Autogrid5 and IGG software. An O4H symmetric B2B topology was employed for each blade row, with matching conditions applied at the periodic boundaries. The OH topology was used in the rotor tip gap region. A total of 73, 85, and 73 cells were allocated in the span-wise direction for the IGV, rotor, and stator, respectively, with 45%, 35%, and 40% of these being mid-flow cells to facilitate a smooth variation in the mesh across the span. Given the importance of flow structures near the hub wall, particularly at the corner with the blade suction side, filets were generated using 21 span-wise cells and a minimum dihedral angle of 25° with the B2B section offset method. To avoid cell clustering at the inlet and outlet blocks while ensuring accurate flow-field representation, 17 cells were employed around the leading and trailing edges of all blade rows. The same approach was applied to the tip clearance, utilizing 21 span-wise cells with 20% mid-flow cells. On the B2B plane, 45, 57, and 53 chord-wise cells were selected for the suction side of the IGV, rotor, and stator, respectively, while 45 cells were used for the pressure side of all three rows. In the skin block, 37 cells were employed to ensure a smooth transition from the wall cell into the main channel. The cell size at the wall was carefully chosen to maintain a y+ lower than 1.2. This mesh is the result of a slight coarsening of the grid reported in [20], which was proven to have no relevant impact on the results while reducing the computational cost of the simulations.
Figure 5 presents the B2B view at 50% of the span (Figure 5a) and the meridional view (Figure 5b) of the mesh (noting that the view in Figure 5a does not extend to the inlet and outlet of the domain to enhance the visibility of the grid resolution).
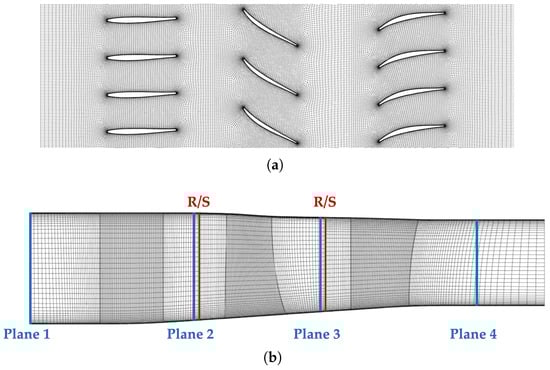
Figure 5.
Mesh employed for the simulations: (a) B2B view at 50% of the span; (b) meridional view.
For the present work, simulations were only employed to support the interpretation of the experimental results and to provide a detail insight of the flow field in regions with limited instrumentation access.
4. Results
This section aims to identify the critical flow features of the machine. The performance is first analyzed to characterize the operability of the stage.
4.1. Performance
Figure 6, Figure 7 and Figure 8 present the total-to-total pressure ratio (), isentropic efficiency (), and total-to-total temperature ratio (), normalized with respect to the DE condition. The figures include both experimental data and performance resulting from time-averaged URANS simulations. Additionally, the pressure ratio (Figure 6) is complemented by the efficiency contour map. The instrumentation uncertainty, calculated within 95% confidence interval, is also reported.
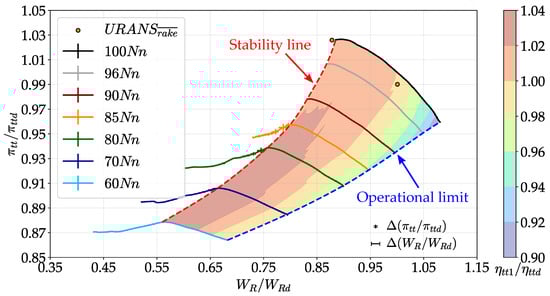
Figure 6.
Compressor map of the stage.
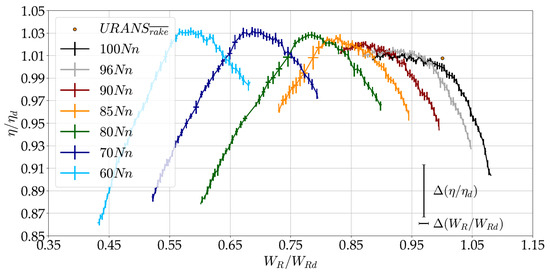
Figure 7.
Isentropic efficiency of the stage.
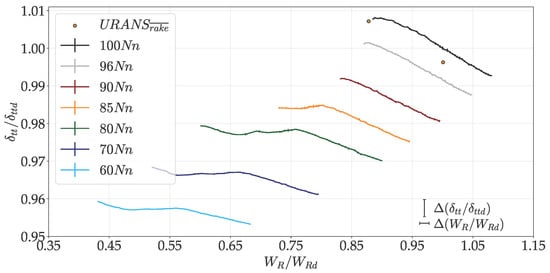
Figure 8.
Total-to-total temperature ratio of the stage.
Figure 6 reports the stable operating range of the machine as the portion of the map enclosed between the stability and operational limit lines. The stability line is defined by two distinct regions: (1) higher speeds (90%, 96% and 100%), where the characteristic drops suddenly beyond the stability line due to the onset of rotating stall; and (2) lower speeds (60%, 70%, 80%, 85%), where a modification of the stage operability is observed beyond the stability line. In the latter, the decrease in efficiency is attributed to the generation of significant losses and not to the development of aerodynamic stall, as evidenced by the total pressure reduction and the overall stable total temperature. However, in both cases, the machine is considered “unstable”: in the first case due to the occurrence of rotating stall, and in the second because the performance is severely degraded. Therefore, beyond the stability line, the machine enters its unstable operating range. The operational limit line, instead, connects the points of maximum mass flow that the facility can deliver with the throttle valve fully open.
Overall, the reduction in mass flow induced by throttling the machine leads to a higher pressure and temperature ratios of the stage due to the increased rotor work. However, at higher speeds, the rapid increase in the total temperature ratio relative to the pressure ratio emphasize the presence of enhanced losses, leading to reduced efficiency. Consequently, the stage achieves maximum efficiency within the speed range [60%, 80%].
The operating points derived from time-averaged URANS were calculated using the same post-processing of the experiments: as an average obtained from numerical probes positioned at the same location of the experimental Kiel heads (). At the DE point, 0.96%, 0.85%, and 0.37% difference is detected between experiments and CFD for the pressure ratio, efficiency and total temperature ratio, while at NS, simulations closely align with experiments, reaching 0.04%, 0.98%, and 0.09% difference.
4.2. Inlet and Outlet Conditions of the Stage
Before delving into the detail characterization of the flow field, the results observed for the stage performance are supported by the analysis of the inlet and outlet flow conditions. Figure 9 reports the span-wise distributions of total pressure and temperature measured with the inlet rakes in experimental Plane 0, along with the associated instrumentation uncertainty computed within the 95% confidence interval. Only the DE operating point is reported as the same observations are valid for the NS condition.
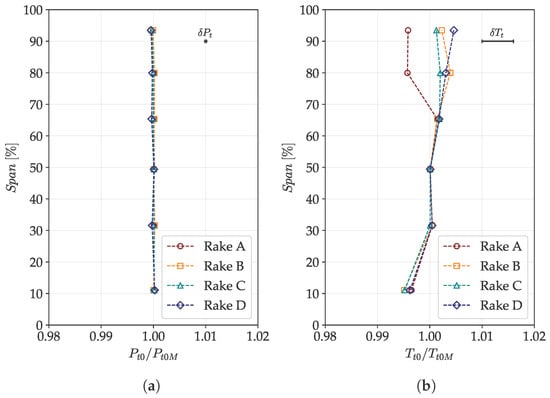
Figure 9.
Distributions retrieved from the inlet rakes at DE condition: (a) total pressure (b); total temperature.
The figure indicates that all rakes measure total pressure and total temperature within the calculated uncertainty range, suggesting the existence of a uniform inlet flow. Any non-uniformity observed in the outlet section should therefore not be attributed to the inlet conditions. The slight temperature variation near the casing is due to different heat transfer with the external environment around the annulus: Rake A, located in the upper region of the machine, exhibits higher heat exchange. In contrast, Rakes B and C are positioned in the lower region near the floor, leading to reduced heat exchange with the environment.
Figure 10 and Figure 11 report, respectively, the total pressure and temperature retrieved at the stage outlet (Plane 4). In dashed black line, the circumferential average across the rakes is reported. The pitch-wise averaged distributions, obtained from the traversing of the pneumatic and thermocouple probes, are shown with a dashed red line. Additionally, results from numerical probes placed at the same locations of the experimental Kiel heads are reported with solid markers.
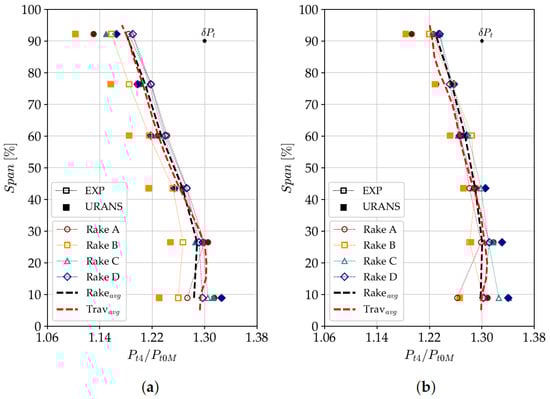
Figure 10.
Total pressure span-wise distributions retrieved at the stage outlet (Plane 4): (a) DE condition; (b) NS condition.
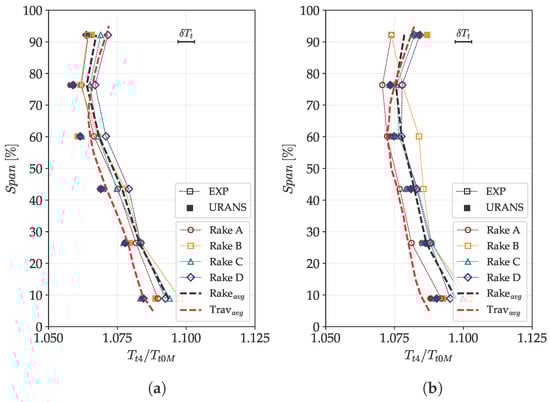
Figure 11.
Total temperature span-wise distributions retrieved at the stage outlet (Plane 4): (a) DE condition; (b) NS condition.
Both the numerical and experimental stage outlet distributions indicate that more work is performed at lower spans, which is consistent with the rotor design, characterized by higher loading near the hub wall. However, the rake- and pneumatic-probe-averaged data show that at reduced mass flow, the pressure and temperature increase primarily affects the upper portion of the span, with minimal influence below 30% span. The total pressure obtained from the pneumatic probe closely matches the rake data, with a maximum pressure difference of 1.28% and 0.65% observed at low span at DE and NS conditions, respectively. This difference is attributed to the higher spatial resolution of the pneumatic probe, which allows for better characterization of the flow field within the bottom 30% of the span. The total temperature measured by the thermocouple probe is, on average, 0.26% and 0.46% lower for DE and NS conditions, compared to the rake data. Despite these differences, the temperature values remain within the computed uncertainty range across most of the span.
Figure 10 also highlights that, particularly at DE condition, the simulations predict lower total pressure compared to the experimental results, especially at the location of Rake B (Figure 10a). The source of this discrepancy can be identified in Figure 12, where the pitch-wise outlet total pressure at DE and NS conditions is presented. The legend indicates the span-wise location of the corresponding Kiel head.
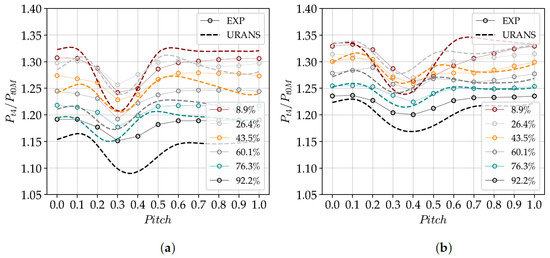
Figure 12.
Total pressure pitch-wise distributions of the outlet rakes: (a) DE; (b) NS condition.
The difference between the span-wise distributions in the experiments and simulations (observable in Figure 10) is primarily due to the predicted absolute pressure values and deviation angles, the latter causing a maximum pitch-wise shift in the outlet stator wake of 7.7% relative to the experimental data. Additionally, the simulated wake is 3.5% of the pitch larger than in the experiments.
While the difference between experiments and CFD increases toward the tip section at DE condition, it becomes more pronounced near the hub as the stability limit is approached. This is likely due to the increased blockage caused by rotor hub corner separation at the NS operating point, which is particularly enhanced in the experiments, as discussed later in the paper. This separation alters the stator inlet conditions and, consequently, the wake propagation, amplifying the discrepancies between experiments and CFD at this operating point. However, in terms of absolute pressure values, simulations and experiments exhibit better agreement at NS than at DE. This is reflected in the performance shown in Figure 6, Figure 7 and Figure 8, where the numerical operating point nearly coincides with the experimental curve. However, the discrepancy increases at the DE operating point, causing a slight deviation from the measured performance.
4.3. Detail Flow Survey of the Stage
4.3.1. Description of the IGV Flow Field
Figure 13 presents the pitch-wise averaged total pressure in Planes 1 and 2 at DE and NS conditions. The experimental uncertainty is also reported. Moreover, it is important to recall that the simulations do not account for the stage inlet duct. Instead, the inlet boundary conditions are applied at the location of experimental Plane 1.
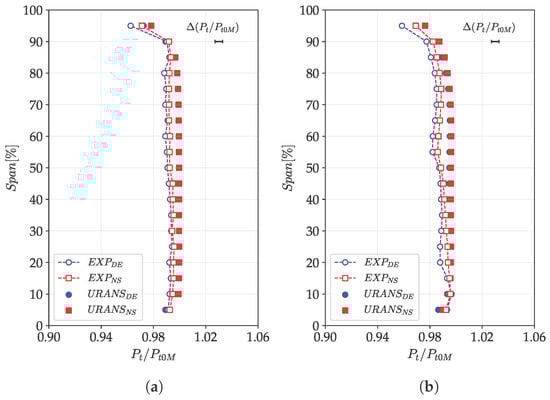
Figure 13.
Numerical and experimental span-wise total pressure distributions at DE and NS conditions in (a) Plane 1; (b) Plane 2.
The total pressure measured in Plane 1 at both DE and NS conditions closely aligns with the averaged total pressure measured in Plane 0, although a slight reduction is observed due to mixing losses. Over 90% of the span, a further reduction in total pressure is present, which is attributed to a separation occurring on the tip wall of the stage within the s-shape convergent section upstream of Plane 1. Evidence of such separation on the same machine is also reported in [23]. As shown in Figure 13b, the total pressure decreases with respect to Plane 1, primarily due to losses generated within the IGV row. These losses are concentrated in the upper 50% of the span, with a peak observed at the 55% span position.
The skin friction lines on the suction and pressure sides of the IGV (Figure 14), obtained from time-averaged URANS, indicate that the flow moves axially through the passage without significant perturbation. Consequently, the pressure reduction observed in Figure 13 is primarily attributed to profile losses and mixing, with no critical secondary flows.
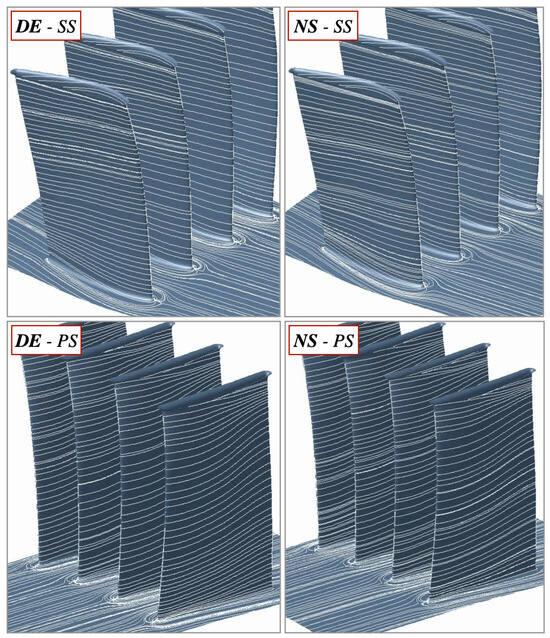
Figure 14.
Averaged skin friction lines on the IGV surface, retrieved from URANS simulation, at DE and NS conditions on suction and pressure sides.
The measured flow fields at the IGV outlet (Plane 2) is reported in Figure 15.
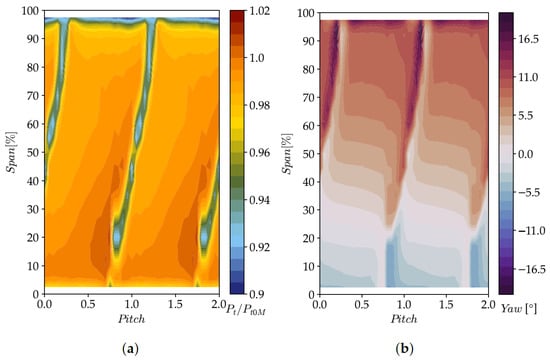
Figure 15.
Experimental IGV outlet (Plane 2) at DE operating point: (a) total pressure; (b) absolute flow angle.
The primary feature observed is the IGV wake, identified as a region of reduced pressure. The outlet flow angle varies from −7.4° near the hub to 21.7° near the tip wall, reflecting the blade geometry. Near the tip, the reduction in total pressure and the increase in flow angle over 95% of the span suggest the presence of the boundary layer. However, only minimal cross-flow is detected on the tip wall, with a slight accumulation of low-momentum flow at the junction with the blade surface. This observation aligns with a minor increase in the IGV loading at higher spans.
To clarify the flow behavior at the IGV outlet, and thus the conditions at the rotor inlet, Figure 16 presents the axial velocity, normalized with the mid-span value at DE condition, and the relative flow angle, both obtained from averaged URANS simulations.
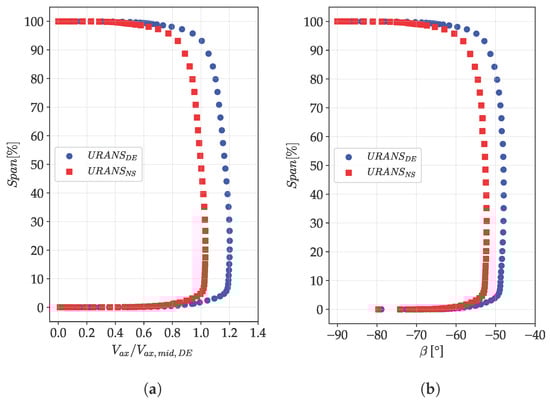
Figure 16.
Numerical distributions at DE and NS conditions at the rotor inlet: (a) axial velocity; (b) relative flow angle.
Figure 16 shows that, outside the boundary layers, the distributions remain nearly constant in the span-wise direction. However, at higher span-wise positions, a slight reduction in axial velocity is observed as a consequence of the blade action on the flow, which leads to an increase in the relative flow angle, as illustrated in Figure 16b. Additionally, moving from DE to NS, the relative flow angle at the rotor inlet increases, while the axial velocity decreases due to the change in operating conditions.
In conclusion, the IGV row does not exhibit any significant flow structure and ensures a smooth flow to the rotor. This result aligns with the IGV design, which was installed upstream of the rotor only to replicate the flow field downstream of a fan, without the intention to generate loading.
4.3.2. Description of the Rotor Flow Field
To evaluate the rotor flow field, the outlet conditions are first analyzed, followed by the characterization of the flow features observed within the passage.
Figure 17, Figure 18 and Figure 19 present the numerical and experimental span-wise distributions of total pressure, total temperature, velocity components, and flow angles at the rotor outlet. The latter was computed within the absolute and relative frame of reference. Moreover, the velocity was decomposed into tangential () and axial () components, and normalized relative to the experimental absolute velocity measured at mid-span at the DE condition (. The highest uncertainty, computed within the 95% confidence interval across the span, is also reported.
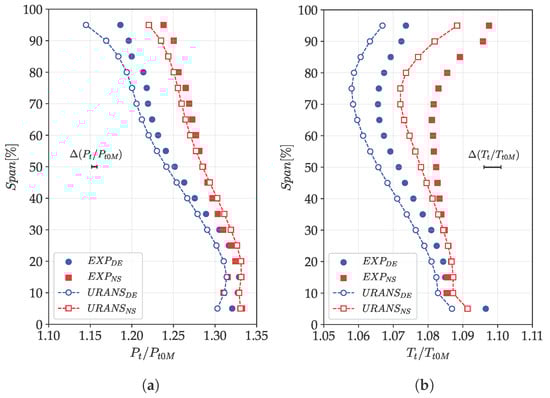
Figure 17.
Span-wise distribution at the rotor outlet: (a) total pressure; (b) total temperature.
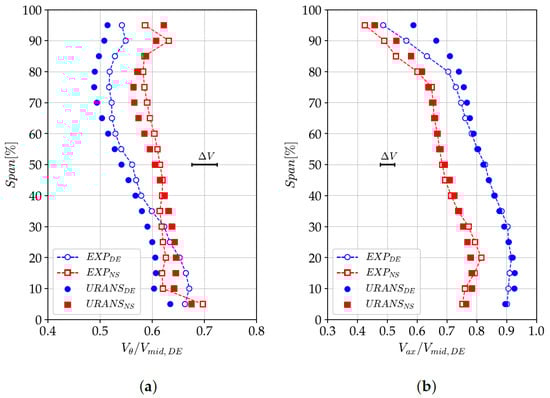
Figure 18.
Span-wise distribution at the rotor outlet: (a) tangential velocity; (b) axial velocity.
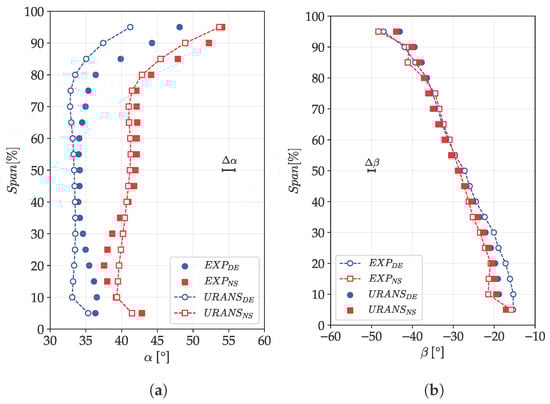
Figure 19.
Span-wise distribution at the rotor outlet: (a) absolute flow angle; (b) relative flow angle.
These data reveal higher total pressure and temperature near the hub, which can be attributed to the increased loading and work performed by the rotor in this region. At higher spans, both total pressure and temperature decrease, accompanied by a reduction in both tangential and axial velocity components. The tangential velocity decreases as a result of the combined effect of blade stagger and increased speed at higher spans. The simultaneous reduction in tangential and axial velocities leads to a near-constant absolute flow angle across the span, while the relative flow angle follows a single slope determined by the variation in blade stagger.
However, especially near the end-walls, the flow begins to deviate from the previously described distributions due to the presence of secondary flows. At higher spans, the blockage caused by the tip-leakage flow reduces the axial velocity in the upper 80% of the span, while both tangential velocity and the absolute flow angle increase. The relative flow angle remains relatively unchanged over 80% of the span, but a slight change in slope is observed, caused by the different deviation generated by the rotor blade near the tip wall. As a result of the increased absolute flow angle, work in the upper portion of the span rises, as indicated by the increase in total temperature. A similar trend is observed at span lower than 20%, where the blockage caused by hub corner separation leads to a reduction in axial velocity, followed by an increase in tangential velocity and absolute flow angle. At NS conditions, a general increase in pressure and temperature is observed, particularly in the upper portion of the span. This is because the blade is unable to pressurize the flow at lower radii due to the development of the hub corner flow. All the effects detected at DE conditions are observed near the end-walls when moving close to the stability limit. Specifically, the experiments show a 1.1% reduction in total pressure and a 5.5° increase in flow angle in the lower 20% of the span, indicating a more pronounced hub corner flow.
It is important to notice that the trend predicted by the CFD is overall in agreement with the experiments, despite mismatches appear near the end-walls where secondary flows take place. For instance, although the absolute increase in flow angle observed at low span in the simulations is smaller than in the experiments, the CFD still captures a similar trend in the flow angle distribution near the end-walls. This difference originates from how RANS simulations model secondary flow structures, which is strongly influenced by the choice of the turbulence model. However, at mid-span, where secondary flows are expected to play a minor role, the numerical prediction aligns more closely with the experiments, falling nearly within the computed uncertainty range of the instrumentation for all the computed quantities. Higher discrepancies between experiments and CFD are noticed in the upper portion of the span for the total temperature, which are believed to originate from the rotor casing in the test rig warming up during operation, a factor that the CFD cannot capture due to the adiabatic wall boundary condition applied at the rotor casing. Nevertheless, it should be noted that the overall total temperature difference between experiments and CFD is only slightly above the systematic uncertainty of the instrumentation.
To aid in the interpretation of the span-wise distributions at the rotor outlet, Figure 20 and Figure 21 present the PLA of the total pressure and the corresponding RMS at DE and NS conditions. To account for variations in the operating conditions, the averaged value at mid-span has been subtracted from the PLA map.
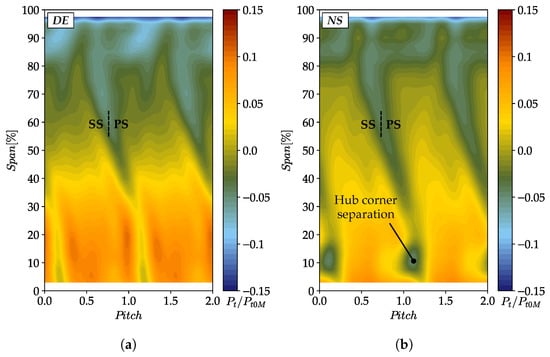
Figure 20.
Experimental PLA of the total pressure at the rotor outlet: (a) DE condition; (b) NS condition.
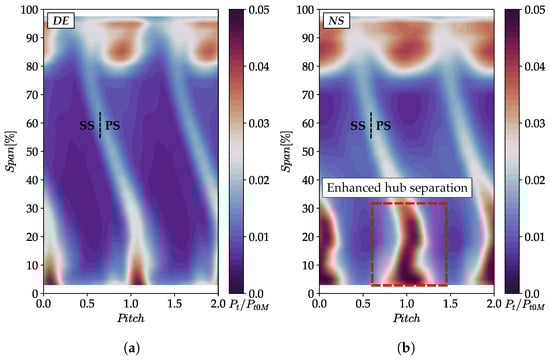
Figure 21.
Experimental RMS of the total pressure at the rotor outlet: (a) DE condition; (b) NS condition.
At DE condition, the PLA reveals that the tip flow occupies a significant portion of the passage, extending radially down to 80% of the span. This is corroborated by elevated pressure fluctuations in the same region. Near the hub wall, the corner flow appears relatively narrow, contributing only partially to an increase in wake thickness. However, the pressure fluctuation in this area is notable, indicating the development of an enhanced corner flow. At reduced mass flow, both the hub corner flow and the tip flow experience a sudden increase in size and intensity, accompanied by increased pressure fluctuations within the separation core, while both flow structures are amplified, the tip flow remains relatively stable at the NS condition. In contrast, the hub corner separation emerges as a dominant phenomenon, evolving rapidly near the stability limit. The core of the hub separation shows the maximum pressure fluctuation within the passage, extending up to 30% of the blade span.
To support the interpretation of the experimental results within the rotor passage, averaged URANS simulations are here employed to analyze the impact of the operating point modification on the flow field. The variation in incidence at the rotor inlet observed in the simulations, resulting from a reduction in mass flow, leads to a shift in the stagnation point around the rotor leading edge and to an increase in loading. This is evident from the averaged skin friction lines on the hub wall (Figure 22), which appear more inclined within the passage as the stability limit is approached.
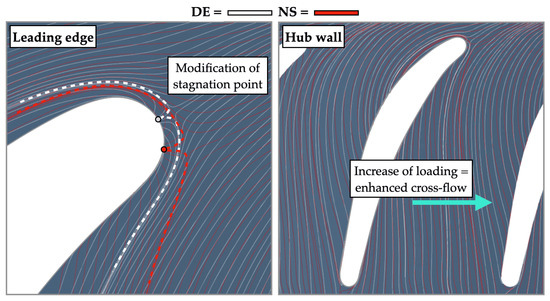
Figure 22.
Numerical averaged skin friction lines on the hub wall at DE (white) and NS (red) conditions.
As a result, stronger cross-flow is generated on the hub wall, causing increased interaction between low-momentum flow and the rear portion of the rotor suction side. However, as shown in Figure 22, the horseshoe vortex legs formed around the leading edge (reported with dashed lines) do not seem to directly affect the rotor suction side of the adjacent blade. Figure 22 also supports the interpretation of the experimental observations at the rotor outlet (Figure 20 and Figure 21). Indeed, the horseshoe vortex legs appear to contribute, on one side of the rotor blade, to the accumulation of low-momentum flow on the rotor suction side, which could enhance the development of the hub corner separation observed experimentally at the rotor outlet. On the other side of the blade, the vortex leg does not appear to interact with the suction side of the adjacent blade. However, it is important to note that the CFD may not predict the exact direction of the vortex propagation, and in reality the horseshoe vortex could contribute to the accumulation of low-momentum flow in the rear part of the rotor suction side of the adjacent blade. Therefore, it is plausible that the interaction of the horseshoe vortex contributes to enhancing the hub corner separation. Additionally, it is excluded that the high pressure fluctuation observed in Figure 21 originates from the passage vortex, as it was detected numerically to be located in the middle of the rotor passage rather than at the wake root.
The numerical analysis of the skin friction lines on the rotor suction side enables a detailed characterization of the interaction between the end-wall flow and the rotor surface, as shown in Figure 23 for both DE and NS conditions, retrieved from averaged URANS simulations. Alongside the skin friction lines, the isentropic Mach number is reported.
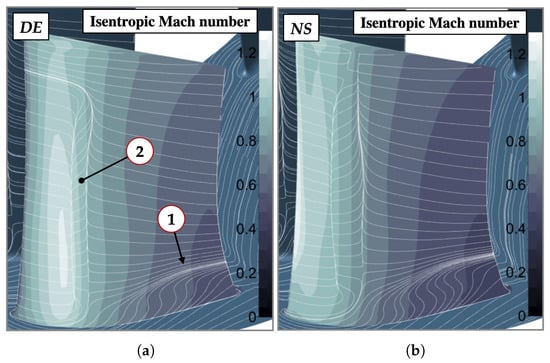
Figure 23.
Numerical skin friction lines and isentropic Mach number on the rotor surface at: (a) DE condition; (b) NS condition.
The figure highlights the presence of the hub corner separation in the rear part of the rotor suction side near the hub wall (marker 1) at DE condition, with its span-wise extension increasing as mass flow decreases. The increased curvature of the surface streamlines in this region at NS condition indicates enhanced reverse flow and heightened criticality of the hub corner separation. Additionally, separation and reattachment of the boundary layer is evident in the front part of the blade, covering nearly the entire blade span (marker 2). This separation coincides with a shock generated at the end of a sonic pocket, induced by the relative increase in Mach number on the rotor suction side. At NS condition, the edge of the separation shifts closer to the rotor leading edge, and the separation length increases due to the stronger shock and the enhanced adverse pressure gradient. The span-wise extent of this separation reaches 80% of the span at DE condition and nearly extends to the rotor tip at NS condition. However, it should be noted that the absolute size of separations and secondary flow structures predicted in the simulations is highly dependent on the turbulence model employed, as it influences both extent and intensity of the shock-boundary layer separation on the rotor suction side and the hub corner separation. Further details on the impact of the turbulence model on the prediction of secondary flow structures and separations in this machine can be found in [18].
Since casing sensors were only available at the locations of experimental Planes 2 and 3, simulations were used to explore the evolution of the tip flow. To verify the validity of the numerical simulations, the pitch-wise distribution of the static pressure was therefore compared with the experimental results in Plane 2 and 3, as reported by Figure 24. Specifically, in Figure 24, experimental PLA distributions corresponding to three rotor pitches are compared with the time-mean of the URANS, computed over the full time length periodicity of the simulations.
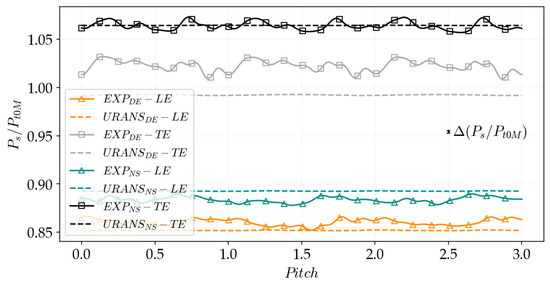
Figure 24.
Comparison of the experimental and numerical casing static pressure in Plane 2 and 3 over three rotor pitches.
The figure shows that the simulations accurately predict the absolute value of the static pressure on the tip wall, with maximum difference of 2.95% at the trailing edge at DE condition. This observation aligns with the measured performance of the stage, where a maximum difference between experiments and simulations was detected at DE condition. Based on these results, the simulations appear to be quantitatively consistent with the experimental data.
Figure 25 presents the casing static pressure field obtained from averaged URANS simulations at DE and NS conditions.
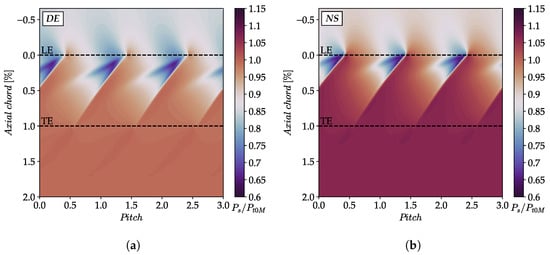
Figure 25.
Numerical casing static pressure field at (a) DE condition; (b) NS condition.
This figure highlights a reduced-pressure region within the core of the tip-leakage flow and an increased streamwise static pressure gradient at reduced mass flow. However, although the inclination of the tip-leakage flow increases as the stability limit is approached, due to the enhanced rotor inlet incidence, no evidence of critical flow features is observed. This conclusion is further supported by the findings reported in [18,20], where the steady and unsteady entropy distributions highlighted the absence of critical secondary flow features, particularly when approaching the machine stability limit. However, in the present work, static pressure is discussed to remain consistent with the quantities measured by the experimental casing sensors.
4.3.3. Description of the Stator Flow Field
Figure 26 presents the numerical and experimental span-wise distributions of total pressure and flow angle at the stator outlet, while Figure 27 shows the tangential and axial velocity distributions. The latter is normalized through the absolute velocity computed experimentally in Plane 4 at mid-span. The Mach number and total temperature distributions are omitted as the Mach number closely resembles the total pressure distribution, and the averaged total temperature remains unchanged across the stator row. Experimental data were obtained by averaging the results retrieved from the pneumatic probe in the pitch-wise direction. The highest uncertainty, calculated over the entire span, is reported.
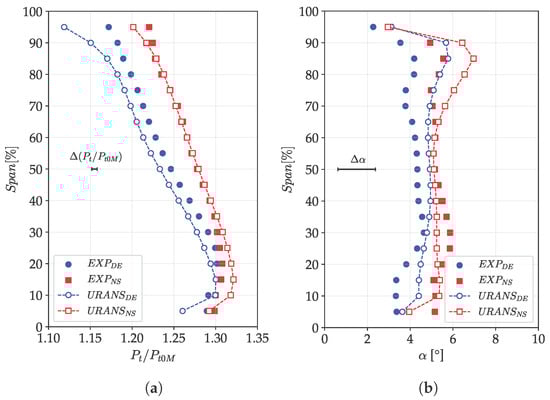
Figure 26.
Span-wise distributions at the stator outlet: (a) total pressure; (b) absolute flow angle.
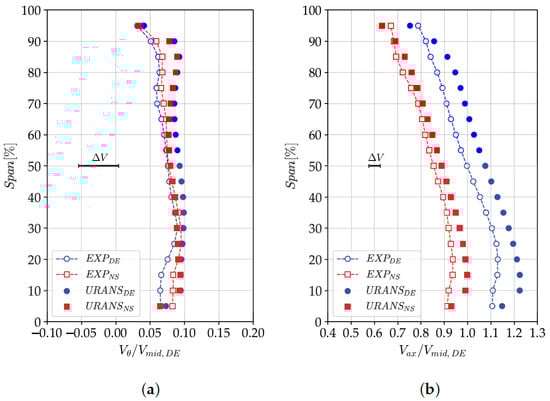
Figure 27.
Span-wise distributions at the stator outlet: (a) tangential velocity; (b) axial velocity.
The total pressure at both DE and NS conditions decreases compared to Plane 3. Moreover, the tangential velocity component and the absolute flow angle at the stator outlet are lower than in Plane 3 due to the flow straightening induced by the stator blade. However, near the end-walls, the distributions deviate from the general trend. In these regions, a local increase in flow angle and tangential velocity suggests the presence of flow structures causing local flow blockage, as indicated by the reduction in axial velocity. This observation is further supported by the decrease in total pressure at both hub and tip, highlighting the generation of losses. These enhanced flow features observed near the end-walls are likely induced by the blockage introduced by the upstream rotor flow features, such as the hub corner separation and tip-leakage flow, which develop at the hub and tip, respectively. Moving from DE to NS conditions, experiments show an average change in flow angle of 1.26°.
The simulations generally align well with the experimental results. However, as indicated by the performance data, the total pressure at DE condition is slightly lower than the experimental values, while showing a closer match at NS condition. Additionally, the flow angle at mid-span is accurately predicted by the URANS simulations, though a larger discrepancy is observed near the end-walls, especially close to the tip, where a maximum difference of 1.6° is found compared to the experimental results. However, it should be noted that, despite the good agreement of the simulations with the experiments, the computed uncertainty on the flow angle was found to be ±0.8°, which could hide a larger discrepancy between experiments and CFD.
The stator flow field can be examined more in detail by means of Figure 28, which presents the experimental distribution of total pressure in Plane 4 at DE and NS conditions. To prevent the absolute pressure value from scaling with the operating point, the pitch-wise average at mid-span was subtracted from the measured pressure. In addition to the total pressure maps, Figure 29 and Figure 30 report the averaged skin friction lines retrieved from the URANS simulations on the suction and pressure side, respectively.
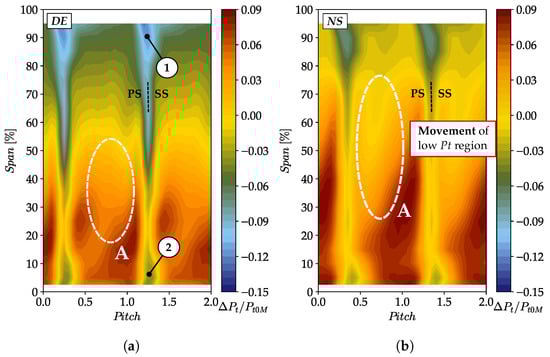
Figure 28.
Experimental stage outlet total pressure at (a) DE condition; (b) NS condition.
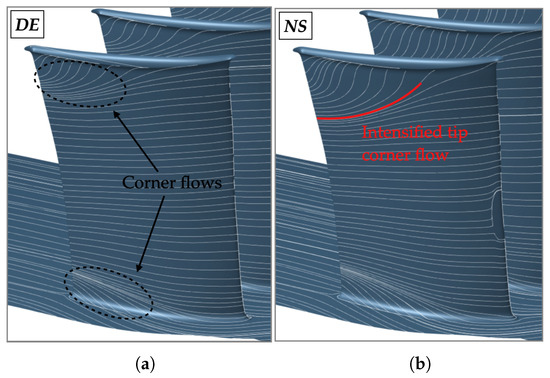
Figure 29.
Numerical averaged skin friction lines on the stator suction side at (a) DE condition; (b) NS condition.
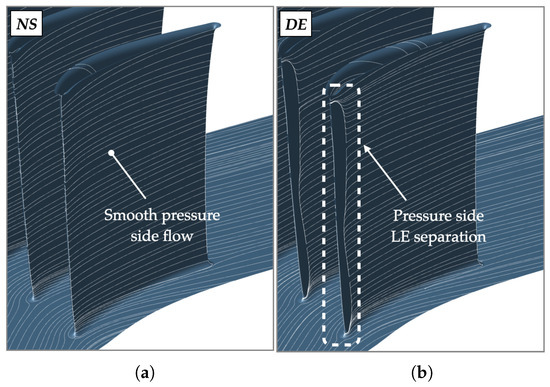
Figure 30.
Numerical averaged skin friction lines on the stator pressure side at (a) DE condition; (b) NS condition.
Markers 1 and 2 in Figure 28 indicate the development of corner flows at the tip and hub corners on the suction side of the stator blade, which are caused by the blockage introduced by the tip-leakage flow and the hub corner separation and the consequent variation in incidence. These flow structures become more pronounced as the stability limit is approached, due to the larger absolute incidence value. Additionally, a region of reduced total pressure appears in the middle of the stator passage, particularly below 50% span at DE condition (marker A). As the stability limit is approached, this low-pressure region shifts closer to the stator suction side and intensifies within the 20% to 70% span range. Its interaction with the stator wake causes the wake to thicken, especially around 25% span at NS condition. The underlying cause of this reduced total pressure in the middle of the stator passage was previously investigated by [20], where the effects of clocking and the upstream IGV on the development of flow features within the stator passage were analyzed.
A similar outcome is predicted by the URANS simulations (Figure 29), which reveal localized flow structures near the end-walls, consistent with the experimental results. At the NS operating point, the corner flow intensifies, especially in the tip region. This is evident from the increased corner flow observed at the tip in both the experiments and simulations, as well as the enhanced span-wise curvature of the skin friction lines on the stator suction side near the tip. On the pressure side (Figure 30), a small separation occurs near the leading edge at DE condition. The flow becomes smooth, with no separation observed around the leading edge at reduced mass flow, due to the higher absolute value of the incidence.
5. Conclusions
In this paper, a highly loaded axial compressor was tested in the VKI R4 facility. Performance measurements were conducted across the entire operating range, while a detailed flow survey was performed at the maximum speed, focusing on two operating points: mid mass flow (design) and near the stall boundary (near-stall). To support the interpretation of the experimental results in regions with reduced instrumentation access, averaged URANS simulations were employed.
Performance measurements indicated the existence of two regions: (1) at higher speeds, where the compressor characteristic drops suddenly at reduced mass flow, and (2) at lower speeds, where the stage operability decreases prior to the onset of aerodynamic stall. This paper investigated the underlying flow mechanisms activated at the higher speeds and considered responsible for the observed performance drop. Future works will be conducted, at the lower speeds, on the identification of the flow drivers responsible for such a different behavior beyond the stability line at a reduced speed range.
The analysis of the near-stall condition reveals the development of two flow structures within the rotor passage: the tip-leakage flow and the hub corner separation, while the tip-leakage flow remains relatively stable across most of the stage operating range, the hub corner separation rapidly increases in size and intensity near the stability limit, suggesting a hub-critical response of the stage. These conclusions aligns with the rotor design, which features a highly loaded hub section. However, it is important to note that the present analysis aims to offer insights into the possible flow structures observable from the stable operating range of the stage causing aerodynamic stall and does not intend to explore stall inception mechanisms or aerodynamic stall itself. From this perspective, the rapid growth of the hub corner separation suggests its role in the activation of aerodynamic stall at the higher speeds, as well as contributing to the sudden performance drop observed in this regime.
Although the tip-corner flow emerged as an enhanced flow mechanism within the stator passage, no critical development of this structure was detected. Thus, none of the flow features observed in the stator row were considered responsible for the activation of aerodynamic stall in the present stage.
From a general perspective, this paper aims to contribute to the current understanding of highly loaded compressors, which are representative of modern engine boosters. The findings from this study hold valuable insights for compressor designers, as understanding the critical flow mechanisms responsible for the onset of aerodynamic stall is a key step in defining refined design strategies. This knowledge is also fundamental for understanding the behavior of these machines operating under distorted conditions, which will be a condition relevant to the use of highly loaded axial compressors for forthcoming propulsive applications.
Author Contributions
Conceptualization, R.T., F.F. and K.H.; methodology, R.T., F.F. and K.H.; software, R.T.; validation, R.T.; formal analysis, R.T.; investigation, R.T., F.F. and K.H.; resources, F.F.; data curation, R.T.; writing—original draft preparation, R.T.; writing—review and editing, R.T.; visualization, R.T.; supervision, F.F. and K.H.; project administration, F.F. and K.H.; funding acquisition, R.T. and F.F. All authors have read and agreed to the published version of the manuscript.
Funding
This research received no external funding.
Institutional Review Board Statement
Not applicable.
Informed Consent Statement
Not applicable.
Data Availability Statement
The design of the considered test article is the property of Safran Aero Boosters. As such, the sharing of geometrical data and absolute performance parameters is either restricted or not allowed.
Acknowledgments
The authors extend their gratitude to Safran Aero Boosters to make the DREAM compressor stage available for this study, and to Cadence to grant the use of the simulation software. The consortium CÉCI is also acknowledged for providing access to the Tier-1 Zenobe and Lucia clusters. Additionally, the authors thank the F.R.S.-FNRS for funding the FRIA scholarship of Riccardo Toracchio.
Conflicts of Interest
The authors declare no conflicts of interest.
Abbreviations
The following abbreviations are used in this manuscript:
| Acronyms | |
| HB | High-bypass |
| GT | Geared turbofan |
| IGV | Inlet guide vane |
| DE | Design condition |
| NS | Near-stall condition |
| PLA | Phase-locked average |
| RMS | Root mean square |
| BPF | Blade passing frequency |
| B2B | Blade-to-blade |
| R/S | Rotor/stator interface |
| LE | Leading-edge |
| TE | Trailing-edge |
| Greek symbols | |
| Pressure ratio | |
| Isentropic efficiency | |
| Temperature ratio | |
| Uncertainty, difference | |
| Absolute flow angle | |
| Relative flow angle | |
| Roman symbols | |
| Corrected mass flow | |
| Subscripts | |
| Total-to-total | |
| d | Design condition |
| Average at rake location | |
| t | Total quantity |
| 0 | Plane 0 |
| 4 | Plane 4 |
| M | Area-averaged quantity |
| Axial | |
| Tangential | |
| Mid-span | |
| s | Static quantity |
References
- Hughes, C.; Van Zante, D.; Heidmann, J. Aircraft engine technology for green aviation to reduce fuel burn. In Proceedings of the 3rd AIAA Atmospheric Space Environments Conference, Honolulu, HI, USA, 27–30 June 2011; p. 3531. [Google Scholar]
- Owens, R.; Hasel, K.; Mapes, D. Ultra high bypass turbofan technologies for the twenty-first century. In Proceedings of the 26th Joint Propulsion Conference, Orlando, FL, USA, 16–18 July 1990; p. 2397. [Google Scholar]
- Grönstedt, T.; Xisto, C.; Sethi, V.; Rolt, A.; García Rosa, N.; Seitz, A.; Yakinthos, K.; Donnerhack, S.; Newton, P.; Tantot, N.; et al. Ultra low emission technology innovations for mid-century aircraft turbine engines. In Proceedings of the Turbo Expo: Turbomachinery Technical Conference and Exposition, American Society of Mechanical Engineers, Seoul, Republic of Korea, 13–17 June 2016; Volume 49743, p. V003T06A001. [Google Scholar]
- Dickens, T.; Day, I. The design of highly loaded axial compressors. In Proceedings of the Turbo Expo: Power for Land, Sea, and Air, Orlando, FL, USA, 8–12 June 2009; Volume 48883, pp. 57–67. [Google Scholar]
- Wang, R.; Yu, X.; Liu, B.; An, G. Effects of loading level on the variation of flow losses in subsonic axial compressors. Energies 2022, 15, 6251. [Google Scholar] [CrossRef]
- Cruz, G.G.; Babin, C.; Fontaneto, F. Axial Compressor Loss Sensitivity Analysis to Blade Row Design Parameters. In Proceedings of the Turbo Expo: Turbomachinery Technical Conference and Exposition, American Society of Mechanical Engineers, Boston, MA, USA, 26–30 June 2023; Volume 87080, p. V13AT29A012. [Google Scholar]
- Lewin, E.; Kožulović, D.; Stark, U. Experimental and numerical analysis of hub-corner stall in compressor cascades. In Proceedings of the Turbo Expo: Power for Land, Sea, and Air, Glasgow, UK, 14–18 June 2010; Volume 44021, pp. 289–299. [Google Scholar]
- Yocum, A.M.; O’Brien, W.F. Separated Flow in a Low Speed Two-Dimensional Cascade: Part I—Flow Visualization and Time-Mean Velocity Measurements. In Proceedings of the ASME International Gas Turbine and Aeroengine Congress and Exposition, American Society of Mechanical Engineers, Cologne, Germany, 1–4 June 1992; Volume 78934, p. V001T01A121. [Google Scholar]
- Ma, W.; Ottavy, X.; Lu, L.; Leboeuf, F.; Gao, F. Experimental Investigations of Corner Stall in a Linear Compressor Cascade. In Proceedings of the Turbo Expo: Turbomachinery Technical Conference and Exposition, American Society of Mechanical Engineers, Vancouver, BC, Canada, 6–10 June 2011; Volume 54679. [Google Scholar]
- Gao, F.; Ma, W.; Zambonini, G.; Boudet, J.; Ottavy, X.; Lu, L.; Shao, L. Large-eddy simulation of 3-D corner separation in a linear compressor cascade. Phys. Fluids 2015, 27, 085105. [Google Scholar] [CrossRef]
- Zambonini, G.; Ottavy, X.; Kriegseis, J. Corner separation dynamics in a linear compressor cascade. J. Fluids Eng. 2017, 139, 061101. [Google Scholar] [CrossRef]
- Choi, M.; Baek, J.H.; Oh, S.H.; Ki, D.J. Role of hub-corner-separation on rotating stall in an axial compressor. Trans. Jpn. Soc. Aeronaut. Space Sci. 2008, 51, 93–100. [Google Scholar] [CrossRef]
- Dodds, J.; Vahdati, M. Rotating stall observations in a high speed compressor—Part I: Experimental study. J. Turbomach. 2015, 137, 051002. [Google Scholar] [CrossRef]
- Dodds, J.; Vahdati, M. Rotating stall observations in a high speed compressor—Part II: Numerical study. J. Turbomach. 2015, 137, 051003. [Google Scholar] [CrossRef]
- Toracchio, R.; Hillewaert, K.; Fontaneto, F. Experimental and numerical characterization of the stable operating range of a highly-loaded axial compressor stage. In Proceedings of the 16th European Turbomachinery Conference, ETC2025-288, Hannover, Germany, 24–28 March 2025; Available online: https://www.euroturbo.eu/publications/conference-proceedings-repository/ (accessed on 3 July 2025).
- ANSI/ASME PTC 19.1-2005; Measurement Uncertainty. American Society of Mechanical Engineers: New York, NY, USA, 2006.
- Gaetani, P.; Persico, G. Technology development of fast-response aerodynamic pressure probes. Int. J. Turbomach. Propuls. Power 2020, 5, 6. [Google Scholar] [CrossRef]
- Toracchio, R.; Fontaneto, F.; Hillewaert, K. On the Impact of the Turbulence Model on the Secondary Flow Structure of a Highly-Loaded Compressor Stage. In Proceedings of the Turbo Expo: Turbomachinery Technical Conference and Exposition, American Society of Mechanical Engineers, Rotterdam, The Netherlands, 13–17 June 2022; Volume 86113, p. V10CT32A041. [Google Scholar]
- Hadavandi, R. Experimental Investigation of the Inlet Flow Field on a Highly Loaded Single Stage Low Pressure Axial Compressor. VKI Project Report. 2016. [Google Scholar]
- Toracchio, R.; Fontaneto, F.; Hillewaert, K. Steady and Unsteady Numerical Characterization of the Secondary Flow Structures of a Highly Loaded Low-Pressure Compressor Stage. Int. J. Turbomach. Propuls. Power 2023, 8, 44. [Google Scholar] [CrossRef]
- Babin, C.; Dumas, M.; Ottavy, X.; Fontaneto, F. Numerical characterization of a HP compressor stage equipped with a closed shrouded stator cavity. In Proceedings of the Turbo Expo: Turbomachinery Technical Conference and Exposition, American Society of Mechanical Engineers, Virtual Event, 21–25 September 2020; Volume 84065, p. V02AT32A036. [Google Scholar]
- Babin, C.; Ottavy, X.; Fontaneto, F. Leakage flow impact on shrouded stator cavity flow topology and associated high-speed axial compressor stage performance. J. Turbomach. 2023, 145, 051016. [Google Scholar] [CrossRef]
- Hadavandi, R.; Fontaneto, F.; Desset, J. Complete characterization of a highly loaded low pressure compressor at different reynolds numbers for computational fluid dynamics simulations. J. Turbomach. 2018, 140, 061008. [Google Scholar] [CrossRef]


Disclaimer/Publisher’s Note: The statements, opinions and data contained in all publications are solely those of the individual author(s) and contributor(s) and not of MDPI and/or the editor(s). MDPI and/or the editor(s) disclaim responsibility for any injury to people or property resulting from any ideas, methods, instructions or products referred to in the content. |
© 2026 by the authors. Published by MDPI on behalf of the EUROTURBO. Licensee MDPI, Basel, Switzerland. This article is an open access article distributed under the terms and conditions of the Creative Commons Attribution (CC BY-NC-ND) license.