Abstract
This study examines the evolution of the Yellow River Basin’s urban corporate network from 2003 to 2023, aiming to understand how intercity connectivity and decision-making authority have developed. Using headquarters–subsidiary linkages of listed firms, we measure connectivity and control of cities within the urban system and employ spatial error models to identify their main determinants. The results show that the network has become denser and more geographically inclusive, especially in the middle and lower reaches. However, a clear hierarchy remains, and upstream integration stays limited. Community structures are anchored by capitals, and multi-core patterns strengthen over time. Coastal hubs in Shandong handle the most significant volumes of ties, while interior capitals such as Zhengzhou, Lanzhou, Xi’an, and Taiyuan concentrate authority—a contrast that has intensified since 2013. Connectivity and control often diverge, and disparities in both have increased. Administrative rank remains the strongest predictor of a city’s position, although its influence has decreased as factors such as openness, development, producer services, and innovation have gained importance. Transportation accessibility and human capital consistently support both connectivity and control, while government intervention initially restricts network roles but becomes less influential over time. These findings suggest that intercity corporate linkages have expanded, yet decision-making authority has not dispersed and remains concentrated in a small set of capitals. Governance that coordinates across provinces is necessary to ensure that increasing linkages translate into shared economic opportunities while protecting the basin’s fragile ecological environment.
1. Introduction
Urban systems research has long debated how cities and towns are organized, connected, and distinguished within regional and global structures [,,]. Classical approaches emphasized hierarchical organization based on settlement size and service functions []. More recent relational perspectives view cities as interdependent nodes through which flows of capital, services, and information circulate [,,]. These perspectives indicate that hierarchical order and networked interaction coexist, and that some cities gain prominence through extensive linkages while others remain dependent even when highly connected [].
China’s rapid urbanization provides an important context for examining how hierarchical and relational forces shape the organization of intercity linkages. Over the past four decades, intercity linkages have intensified, while administrative hierarchies and governance arrangements have continued to concentrate authority in key political and economic centers [,]. These patterns suggest that the expansion of relational connections does not necessarily produce a more balanced distribution of control.
The Yellow River Basin (YRB) represents a region of national importance that has received limited empirical attention. Although it occupies a central role in China’s development strategy that combines ecological protection, industrial upgrading, and regional coordination, systematic analysis of how its cities are connected in the process of regional development, especially through corporate linkages, remains scarce. The basin’s cities differ markedly in administrative status, industrial capacity, and external integration, creating an uneven landscape of opportunity and influence. These conditions make the region an instructive case for examining how corporate control and firm networks shape the spatial hierarchy and functional organization of cities within a regional system.
This study addresses that gap by examining the evolving characteristics of the urban network in the YRB using data on headquarters and subsidiaries of listed firms. The goals are twofold. First, the study measures the structural characteristics of the urban network and identifies its power hierarchy using directed alter-based centrality and directed alter-based power. These measures distinguish between connectivity and authority and trace changes in cities’ positions over the past two decades [,,]. Second, it evaluates the factors that influence the centrality or power of cities in the network. Spatial error models are used to examine how administrative rank, openness, economic development, producer services, innovation, transportation infrastructure, digital infrastructure, human capital, and government intervention explain differences in connectivity and control.
The study provides three main contributions. First, it situates the YRB within broader discussions on hierarchy and relationships, demonstrating how both factors influence uneven growth in a rapidly changing region. Second, it offers the first long-term analysis of the basin’s corporate network, clarifying whether increased participation has expanded or strengthened authority. Third, it identifies the factors that explain why some cities have advanced to more influential roles while others remain dependent. The findings contribute to comparative research on urban networks and inform policy debates on coordinated development and governance across China’s major regions.
2. Literature Review
Urban network research has shifted from models based on size and hierarchy to relational approaches emphasizing intercity flows, organizational infrastructures, and institutions [,,,,]. Classic frameworks clarified settlement patterns but saw cities as isolated units, while relational views consider them as nodes within complex, multi-scale networks involving people, capital, services, and information, where flows drive both integration and inequality. Corporate ownership ties are particularly insightful because they reveal where authority resides and how control shifts. In China, evidence suggests that administrative rank, producer services, transportation, digital infrastructure, and governance arrangements influence the lasting impact of connectivity. The YRB is a key example where national strategy and scholarship meet in this debate.
2.1. Relational Urban Systems: Theory and Organization
Early research on urban systems focused on hierarchical structure. Central Place Theory formalized relationships between city size, service areas, and hinterland reach, providing lasting insights into spatial order but minimizing the connections that support interdependence []. As global and national economies grew more networked, scholars argued that understanding city systems required examining the flows linking them. Rooted in monocentricity, Central Place Theory emphasized vertical dependence of smaller places on larger ones, with little attention to horizontal ties among peers [,].
Built upon the momentum of the world city network (WCN) research of the 1980s, the notion of “urban networks” emerged as a new research paradigm in the 1990s [,,,]. In contrast to hierarchy-based models such as Central Place Theory, network perspectives emphasize polycentric forms in which cities of similar size are linked, arguing that hierarchy captures only part of interurban dynamics and must be complemented by horizontal relations []. This approach recasts “centrality” as a relational dimension rather than a mere function of size. To be sure, network analysis does not dismiss hierarchy; the WCN literature, for example, has revealed different levels of hierarchy and power within the world city system [,,].
The WCN framework positions advanced producer services (APS) at its core, highlighting how finance, law, accounting, and consulting facilitate corporate coordination across borders and concentrate decision-making in a few key cities [,]. This approach facilitates cross-national comparisons, highlights globalization hubs, and maps intercity hierarchies. Studies using flows (e.g., population flows, air traffic) demonstrate how different operationalizations reveal connectivity and hierarchy, while also highlighting methodological limitations [,,,,]. Sector-specific analyses (e.g., media industries) further indicate how specialization concentrates nodal importance [].
Corporate networks expand this discussion by showing how companies assign higher-level functions and coordinate activities across different locations. Headquarters–subsidiary relationships reflect decisions about where control is centralized and how dispersed operations are managed, distinguishing sites that mainly host activities from those that oversee them [,]. Because these relationships are organizational, they provide more direct evidence of command and dependence than mobility or infrastructure flows, which often only indicate participation.
The WCN framework has sparked debate. While it uncovers patterns of connectivity, it can blur the distinction between centrality and influence, as some highly connected nodes primarily serve as conduits rather than command centers, as observed in studies of airline flows and global media networks. Critiques of early WCN applications argue that connectivity does not necessarily mean authority and that degree-based measures can overestimate the importance of cities that primarily host offices for client markets. In response, scholars have developed measures that weigh ties by partner characteristics and, importantly, incorporate directionality, distinguishing between access and control, as well as throughput and command [,]. Recent research on intercity ties has found that as connections grow stronger, participation can increase. At the same time, decision-making authority remains concentrated in a few key cities [,,].
2.2. China’s Urban Networks: Flows and Institutions
China, a country that has experienced unprecedented social and economic transformations over the past few decades, features a large and rapidly expanding urban system that has garnered significant research interest. Studies on cross-regional investment by enterprises have found that investments across cities have increased significantly over time. While capital flows have shown a trend toward greater dispersion and diversification, first-tier cities in China’s urban system, such as Beijing, Shanghai, Shenzhen, Chongqing, and Guangzhou, still maintain the highest level of centrality and attractiveness [,].
Recently, more studies have explored urban networks in China through the lens of corporate networks (especially office networks of producer services). Some research employing the WCN method has positioned Chinese cities within office networks, highlighting the dominance of a few cities (e.g., Beijing, Shanghai, and Shenzhen), while also noting the growth of some second-tier nodes [,,]. However, APS-only views risk overstating control when offices primarily serve local clients. To address this, researchers have diversified data sources to better capture the different dynamics underlying intercity relationships. Researchers have used high-frequency mobility datasets from Tencent, Baidu, and Weibo to analyze urban networks in China. These data highlight labor-market ties and household strategies more than organizational control [,,]. Transportation studies indicate that high-speed rail (HSR) and aviation reduce time–space distances but can also reinforce hub dominance, as accessibility improvements primarily benefit established centers [,,,].
Digital and information flows introduce another organizing logic for urban networks. Analyses of social media and platform data reveal emerging communities and unexpected hubs, indicating evolving forms of integration that may precede or differ from physical infrastructure [,]. Innovation and knowledge networks show selective inland strengthening, most notably in Xi’an, where universities and research institutes support collaborations, although national concentration remains strongest in coastal regions [,].
Corporate and financial ties reinforce organizational structures. Ownership links, intercity investments, and headquarters–subsidiary relationships clarify where coordination occurs and how capital flows contribute to uneven development [,,]. Registration-based datasets help trace corporate relationships over longer periods and, when directionality is included, better distinguish between initiating and hosting roles. Overall, these elements lead to two key points relevant to this study. First, connectivity has increased significantly across China’s urban system, but authority remains highly unequal. Second, institutional factors, especially administrative rank and governance structures, affect how flows translate into lasting positional advantages.
2.3. The YRB as a Research Focus
In recent years, the YRB has gained importance in both policy and scholarship, especially since the 2019 designation of “ecological protection and high-quality development” as a national strategy. The basin covers upstream, midstream, and downstream segments, each with different resource endowments, industrial structures, and ecological challenges. Compared to coastal areas, the YRB has historically been less integrated in terms of flow density, service intensity, and international reach. Recent research suggests that integration has improved but remains uneven.
Studies on mobility, tourism, and information flows reveal increased cross-provincial connections alongside ongoing reliance on capitals such as Zhengzhou, Xi’an, and Jinan [,,,]. These studies consistently show that communities often conform to administrative boundaries, and corridor effects tend to gather around gateway cities. Transport analyses emphasize accessibility improvements from high-speed rail and highway routes but also warn that enhanced connectivity alone does not eliminate disparities in influence [,,]. Innovation and knowledge networks are demonstrating selective strengthening in inland areas, such as Xi’an and Zhengzhou, although many prefectures still lack robust research and advanced services [].
Although such studies remain limited, firm- and service-related linkages offer a valuable lens for analyzing how intercity functions are organized in the basin. Research on producer-service networks, tourism under high-speed rail, and composite multi-flow measures indicates that provincial capitals serve as anchors and coordinators of relations. At the same time, many secondary prefectures primarily participate as connectors rather than hosts of higher-order functions [,]. Multi-core patterns are emerging with Zhengzhou and Xi’an extending midstream reach, and Jinan and Qingdao strengthening Shandong’s outward connections through denser corridors and more cross-provincial ties. Yet a hub’s scale of connections does not always match its coordinative role. Some cities primarily channel large numbers of links due to their industrial depth, logistics assets, and market access, whereas provincial capitals more often provide the institutional settings where decisions are made and resources are allocated [,].
2.4. Insights and Research Focus
The literature highlights three main points that guide this study. First, participation and power must be distinguished from each other. Cities can accumulate many ties yet remain structurally dependent, so greater connectivity does not automatically imply local command [,,]. This distinction can be operationalized using alter-based metrics. Second, institutional conditions shape how connectivity translates into advantage. Factors such as administrative rank, the strength of producer services, and governance arrangements often determine whether intercity linkages turn into durable advantages. Infrastructure and human capital help create the conditions for upgrading, but on their own, they are not enough to guarantee it [,,]. Third, different flows illuminate different facets of intercity relations, and most indicators capture participation or accessibility rather than control. Corporate headquarters–subsidiary linkages add value because they encode decision rights and indicate where authority is rooted [,,,]. In this study, these connections are used to evaluate cities’ connectivity and power within the YRB corporate network.
Building on these insights, the study analyzes the YRB’s corporate network from 2003 to 2023 by examining headquarters–subsidiary relationships among A-share listed firms. Spatial error models are used to test how city attributes, such as administrative rank, openness, economic development, producer services, innovation, transportation infrastructure, information infrastructure, human capital, and government expenditure, explain the outcomes. The analysis examines how the YRB’s corporate network has evolved, whether highly connected cities also hold significant power, how communities align with administrative and upstream–downstream divisions, and which attributes influence this variation.
3. Materials and Methods
3.1. Study Area and Data Source
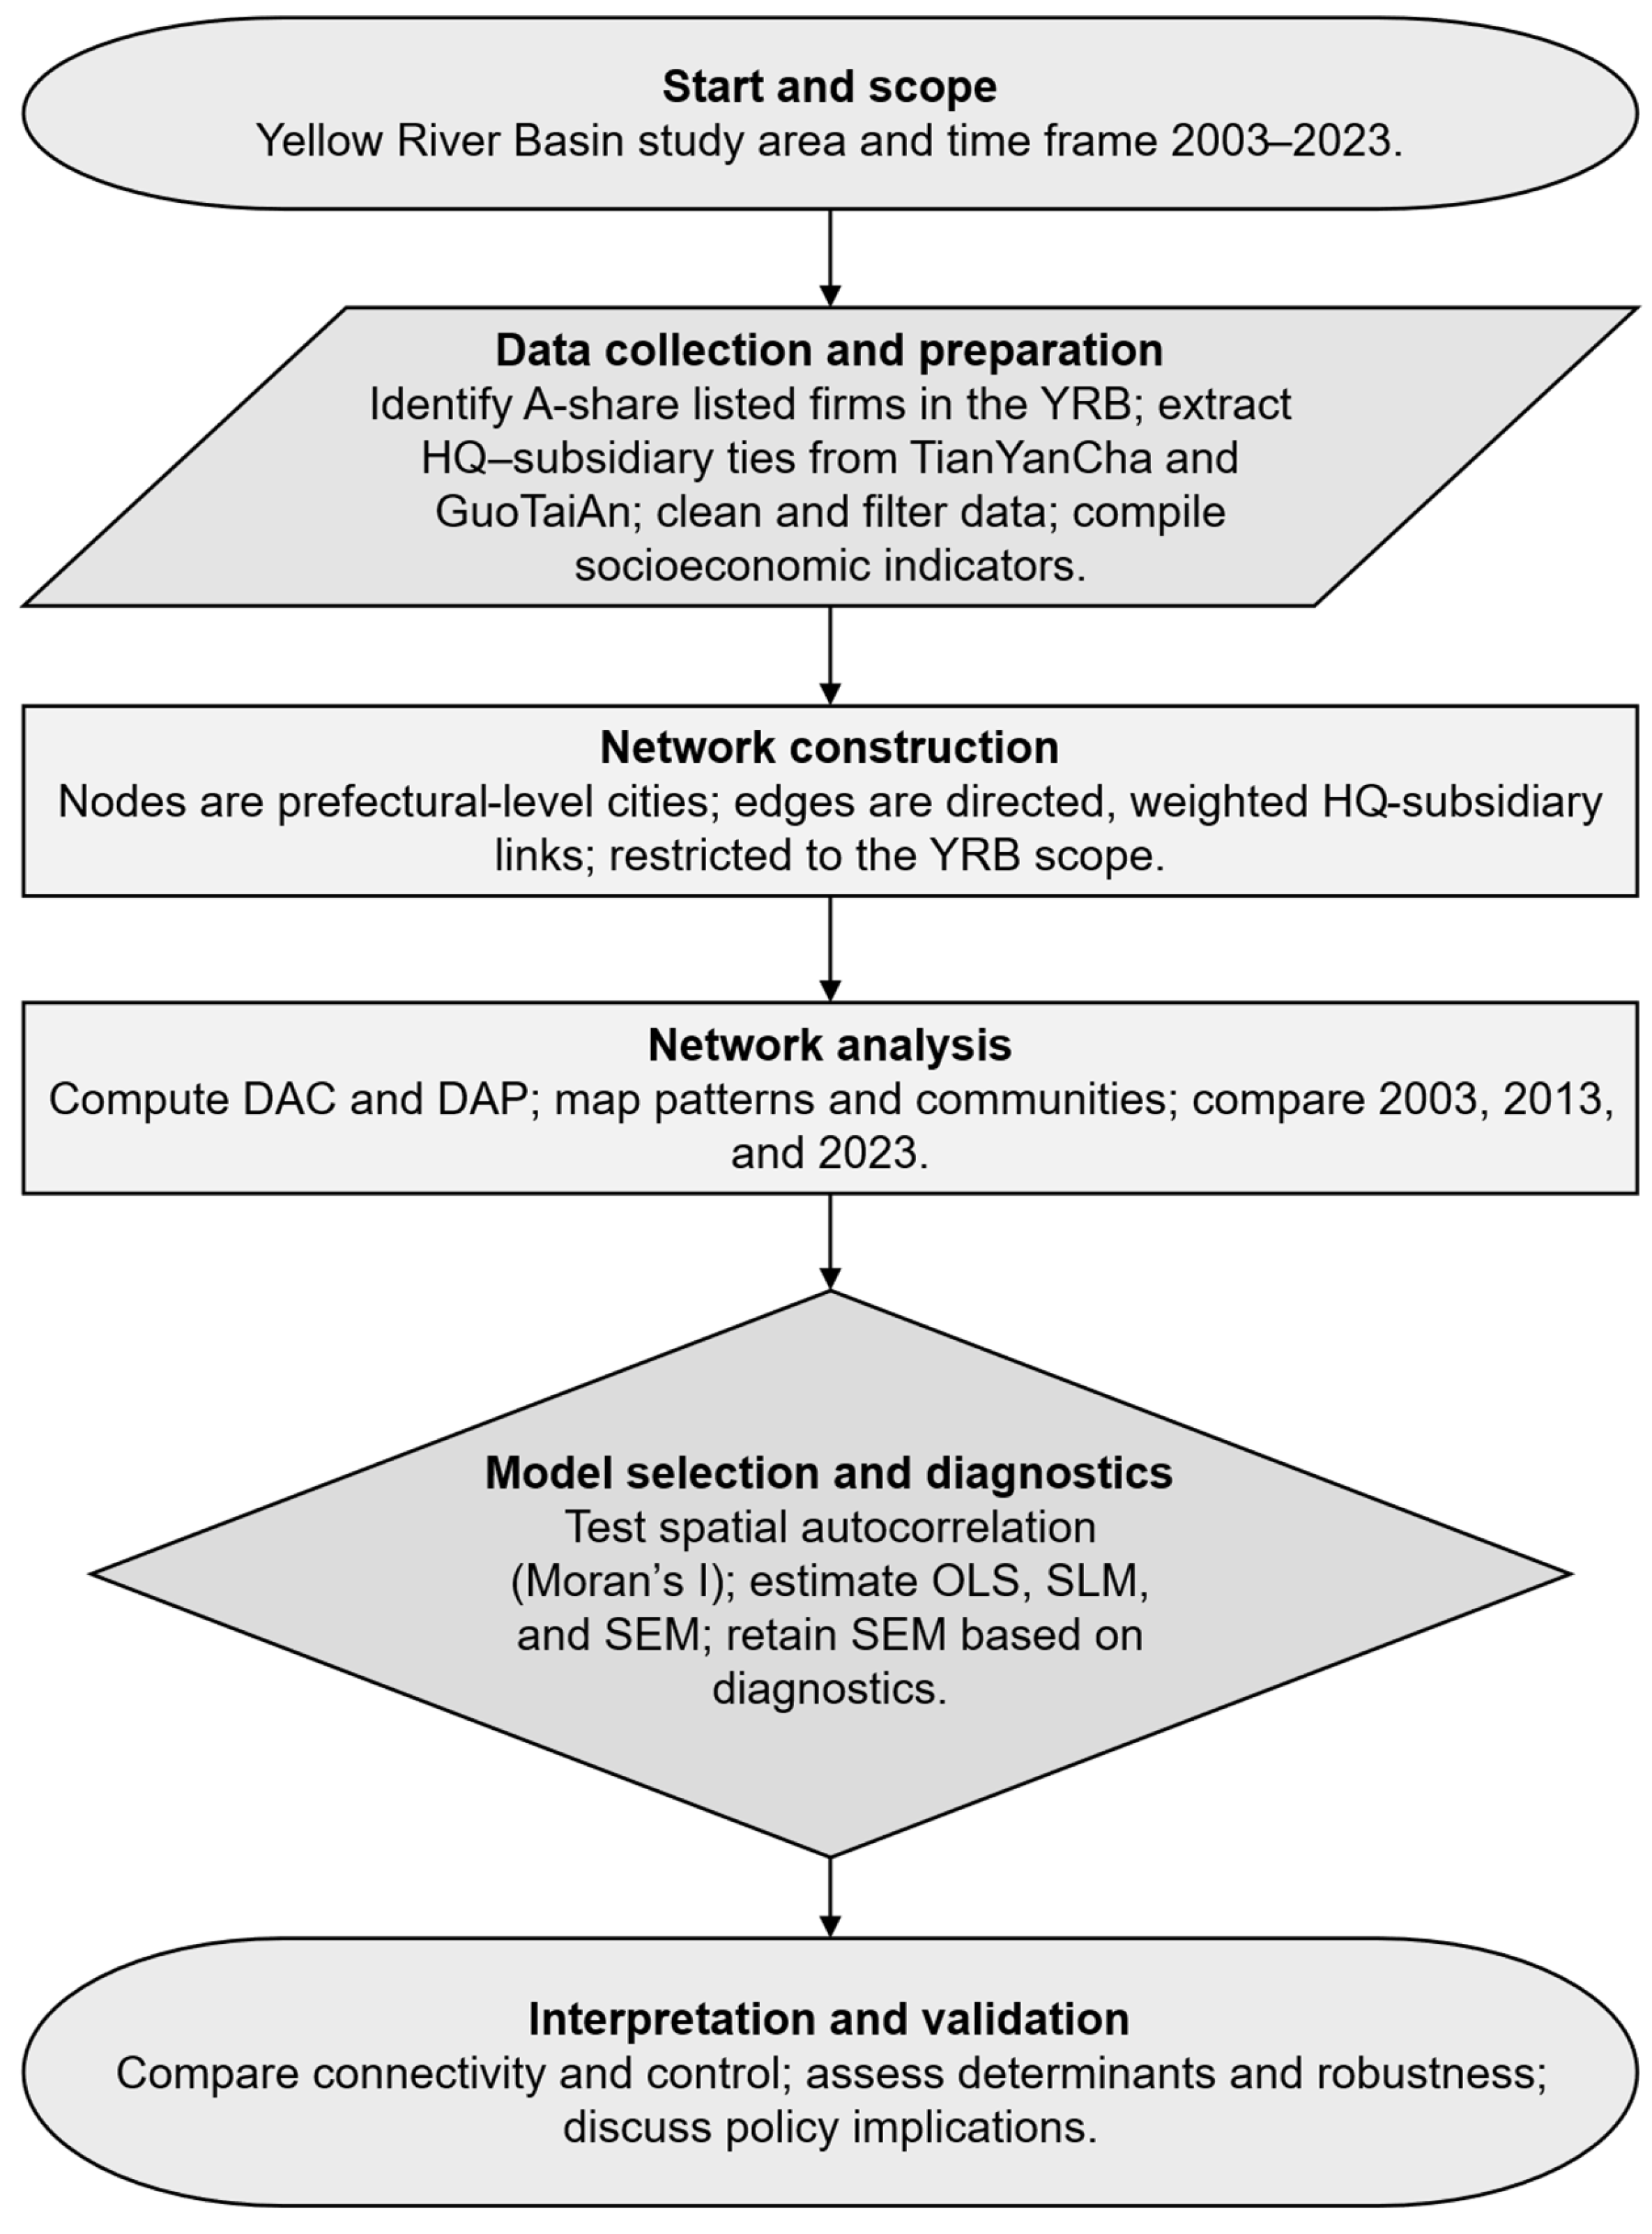
To provide an overview of the methodological process, Figure 1 summarizes the study’s workflow from data collection to analysis.
Figure 1.
Workflow of the study from data collection to analysis.
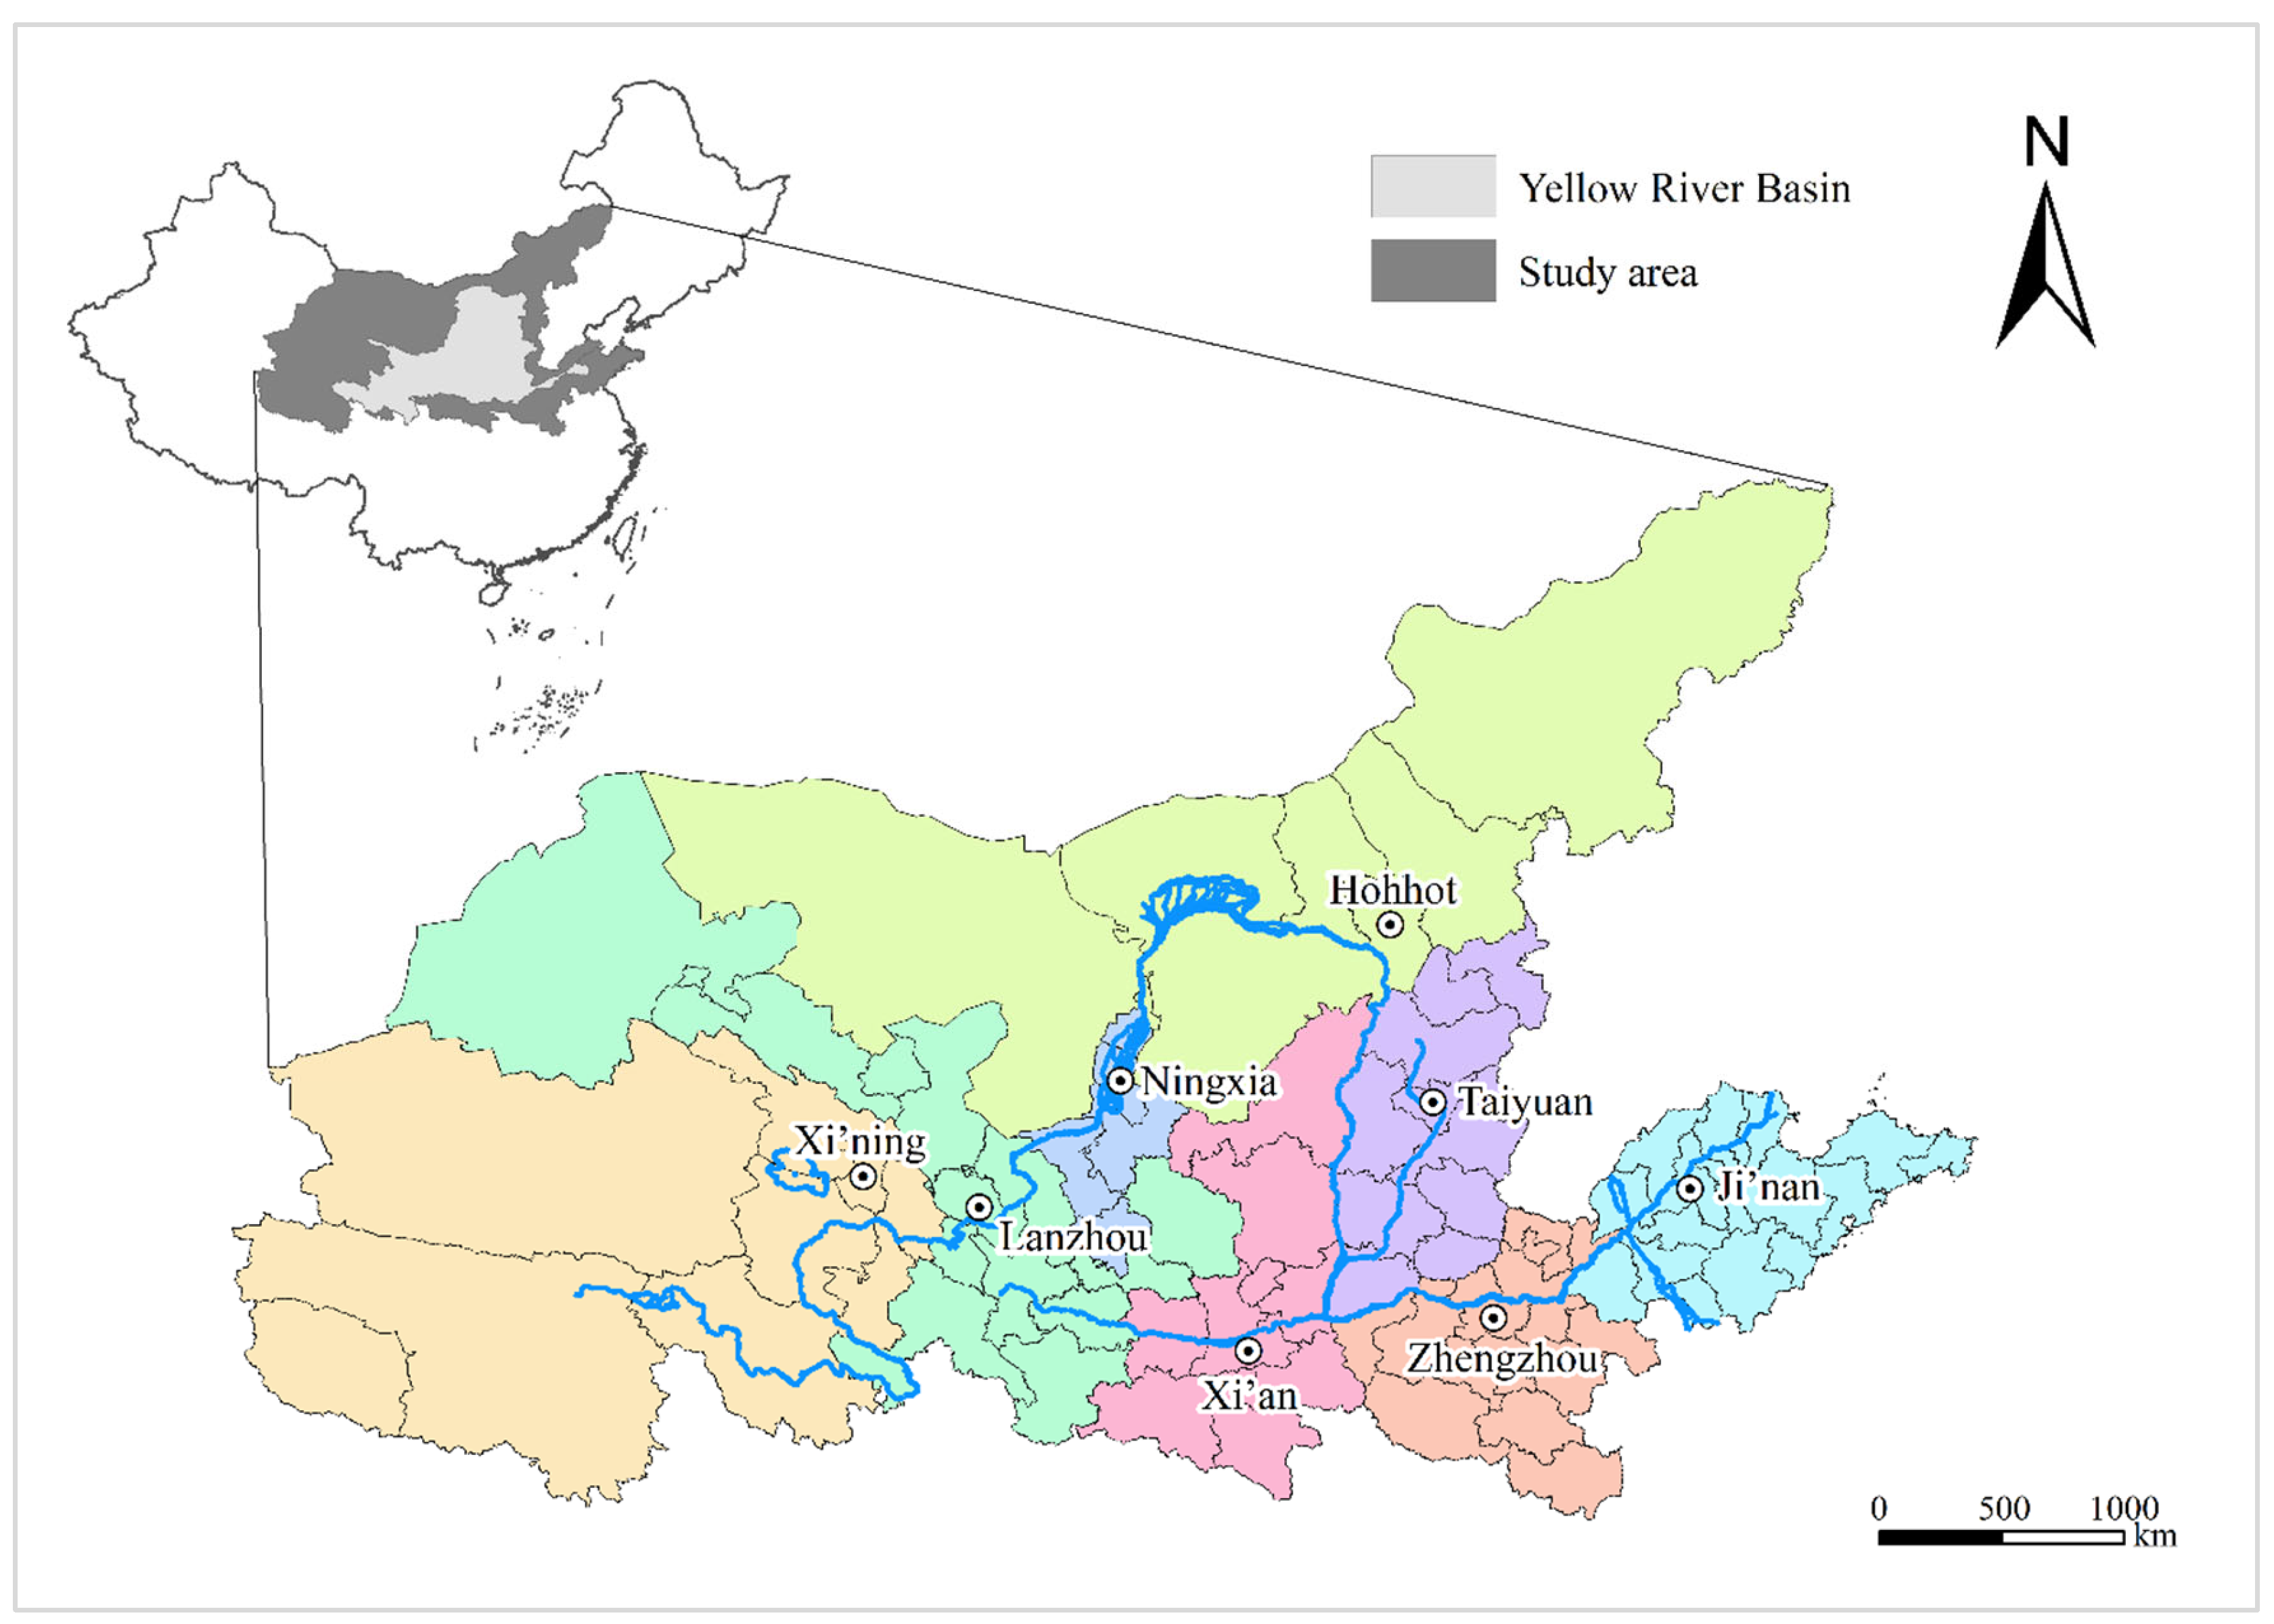
The Yellow River originates from the Qinghai-Tibetan Plateau and flows into the Gulf of Bohai north of the Shandong Peninsula. It traverses nine provinces (specifically, seven provinces and two autonomous regions), including Qinghai, Sichuan, Gansu, Ningxia, Inner Mongolia, Shaanxi, Shanxi, Henan, and Shandong. In this study, the term “Yellow River Basin” is used broadly to refer to this large region comprising these nine provincial units. The analysis concentrates on prefectural-level cities. Sichuan Province is excluded because it is already part of the Yangtze River Economic Belt, a major growth hub and development axis in China’s T-shaped development strategy []. Additionally, the two prefectural regions within Sichuan through which the Yellow River flows—the Aba Tibetan and Qiang and Garzê Tibetan autonomous regions—make up only 0.7% of the population and 0.3% of the GDP of the nine provincial units. For similar reasons, the four prefectural-level divisions in eastern Inner Mongolia, including Hulunbuir, Hinggan League, Tongliao, and Chifeng, are excluded since they are traditionally considered part of Northeast China and are included in the country’s Northeast Revitalization Strategy. Overall, the study area encompasses 89 prefectural cities across eight provinces: Qinghai, Gansu, Ningxia, and Inner Mongolia in the upper reaches; Shaanxi and Shanxi in the middle; and Henan and Shandong in the lower reaches of the Yellow River Basin (see Figure 2).
Figure 2.
The Yellow River Basin.
To analyze corporate networks in the YRB region, we used data on companies listed on the A-share of the Shanghai and Shenzhen stock exchanges. These firms are either headquartered in or have subsidiaries within the YRB. As of 2023, there were a total of 5968 companies listed on China’s A-share market. We first identified the firms headquartered in the YRB using TianYanCha, a popular business data and enterprise information platform. Python (version 3.11.3) scripts were then used to extract data on their affiliated subsidiaries. Firms were excluded from the analysis if they lacked subsidiaries in the YRB or if their subsidiaries were located in the same city as the parent company. After applying these criteria, we identified 375 firms with a total of 1143 subsidiaries. Information on entity relationships and attributes, such as affiliation data (e.g., parent companies versus subsidiaries) and ownership details, was obtained from the GuoTaiAn Database, one of China’s largest financial and economic platforms.
We conducted a regression analysis to examine the factors that affect a city’s centrality and network power. The socioeconomic variables used in the study were sourced from the China City Statistical Yearbook (various years) [,,] and the annual statistical bulletins published by individual cities.
3.2. Network Centrality Analysis
Social network analysis (SNA) is frequently used to study urban networks. In SNA, network centrality is an essential concept that determines a node or actor’s position within the entire network. In urban networks, a city’s centrality reflects its intermediary role and connection with other cities. High centrality indicates that a city is well-connected within the network, allowing it to access resources, information, and influence through its links.
There are three types of centralities: degree centrality, betweenness centrality, and closeness centrality. Degree centrality is the simplest and most commonly used measure of node centrality in network analysis. It has two aspects: in-degree centrality and out-degree centrality, which measure the incoming and outgoing links of a node, respectively. In urban network studies, besides centrality, power is also often used to describe a city’s position within the network. To distinguish centrality from power (or authority), Neal [] argued that centrality is generally viewed as a force that concentrates resources or enables their efficient distribution. In contrast, power is seen as the ability to control the flow of resources between cities. To account for the influence of indirect connections on node centrality, Neal [] introduced the concepts of recursive centrality and recursive power to consider the effects of indirect links between cities on a city’s centrality and power. In a later publication, Neal [] renamed recursive centrality and recursive power as alter-based centrality and alter-based power, respectively, where “alter” refers to the other cities to which a focal city is connected. Building on Neal’s work [,], Zhao et al. [] proposed methods for calculating directed alternative centrality (DAC) and directed alternative power (DAP) in a directed weighted network by incorporating the directionality of edges into the analysis. To determine the DAC and DAP of a city, the in-degree and out-degree of the city are first considered and calculated as follows [,]:
where represents the number of subsidiaries established in city j by companies headquartered in city k. LIj represents the in-degree of city j, measured as the total number of subsidiaries set up in city j by companies headquartered in all other cities in the network (i.e., the total number of links coming into city j). represents the number of subsidiaries set up in City k by companies headquartered in City j. LEj stands for the out-degree of city j, measured by the total number of subsidiaries set up in all other cities in the network by companies headquartered in city j (i.e., the total number of links emanating from city j). The DAC and DAP are calculated using the following formulas:
3.3. Influencing Factor Analysis of Centrality and Power
After calculating DAC and DAP, we used regression models to examine the factors influencing the positioning of cities in the YRB urban network across three time points: 2003, 2013, and 2023. Spatial data often show spatial dependence, meaning that values observed in one location are correlated with those in nearby areas. When spatial autocorrelation exists, applying Ordinary Least Squares (OLS) regression may lead to biased or invalid estimates []. To check for spatial autocorrelation, we tested the two dependent variables, including log-transformed DAC and DAP. The results indicated that the global Moran’s I statistics were significant at the 1% level for all variables, except for lnDAC in 2003, which was statistically significant at the 10% level.
Two commonly used spatial regression models, including the spatial lag model (SLM) and the spatial error model (SEM), are used to account for spatial autocorrelation. In this study, we estimated three models: OLS, SLM, and SEM. Comparisons of model fit indicators, including log likelihood ratio statistic (LogL), Akaike information criterion (AIC), and Schwarz information criterion (SIC), along with the results from the Lagrange multiplier (LM) and robust Lagrange multiplier (RLM) tests, indicated that the SEM provided the best fit among the models evaluated. Accordingly, we selected the SEM as the preferred specification.
Following Anselin and Bera [], the spatial error model is specified as:
where X is the matrix of explanatory variables, β is the regression coefficients, λ is the spatial autoregressive coefficient, W is the spatial weight matrix, ε is the spatially autoregressive error term, and is the vector of independent disturbance terms representing a normal distribution.
We selected explanatory variables that represent several key dimensions: administrative hierarchy, government intervention, economic openness, population size, level of economic development, industrial structure, and other relevant factors. Definitions and descriptions of these variables are presented in Table 1.
Table 1.
Influencing Factors of Centrality and Power: Variables and Definitions.
The selection of these twelve influencing factors was based on three main considerations, including insights from prior research, the socioeconomic and institutional characteristics of the Yellow River Basin, and data availability. Existing studies on China’s urban and corporate networks have repeatedly shown that administrative hierarchy, government intervention, openness, industrial structure, innovation, and human capital are key determinants of intercity network positions. Additionally, transportation, information infrastructure, and urbanization reflect conditions particularly relevant to the basin’s development context, where accessibility, digital capacity, and demographic structure influence how cities participate in regional linkages. Finally, these indicators were chosen because consistent, comparable data were available for all prefectural cities and time points analyzed, ensuring the robustness of the spatial regression models.
While various socioeconomic factors influence a city’s position within the urban network, changes in that position (the dependent variable) may, in turn, impact the city’s socioeconomic development. To address the potential endogeneity caused by reverse causality, all explanatory variables were lagged by one period. To correct heteroscedasticity, we applied logarithmic transformations to the data where appropriate.
To address heteroscedasticity, we applied logarithmic transformations to the data where necessary. Pearson correlation coefficients were calculated to examine the relationships between independent and dependent variables. Additionally, we computed variance inflation factors (VIFs) to evaluate multicollinearity among the explanatory variables. The results revealed significant correlations between the selected indicators and the dependent variable. All VIF values were below 10, and tolerance values exceeded 0.1, indicating that multicollinearity was not a significant concern in the analysis.
4. Results
4.1. Evolution of Urban Network Structures in the YRB
4.1.1. Changing Spatial Distribution of Headquarters–Subsidiary Ties (2003–2023)
The past twenty years have seen a notable increase in the size and geographic range of the Yellow River Basin’s (YRB) corporate network, as measured by headquarters–subsidiary connections of publicly traded companies. The overall trend shows steady growth in the number of firms, diversification of their geographic locations, and stronger links between cities. However, disparities still exist among upstream, midstream, and downstream regions.
In 2003, there were 151 firm headquarters located in 35 prefectural cities across the basin, along with 310 subsidiaries in 52 cities. By 2013, these numbers had nearly doubled, with 273 headquarters in 47 cities and 662 subsidiaries in 73 cities. By 2023, the growth was even more remarkable, with 375 headquarters in 54 cities and 1143 subsidiaries in 85 cities. The increase in both headquarters and subsidiaries indicates that corporate networks have become denser, more interconnected, and more geographically spread out, although the upper reaches still lag in integration compared to the middle and lower reaches.
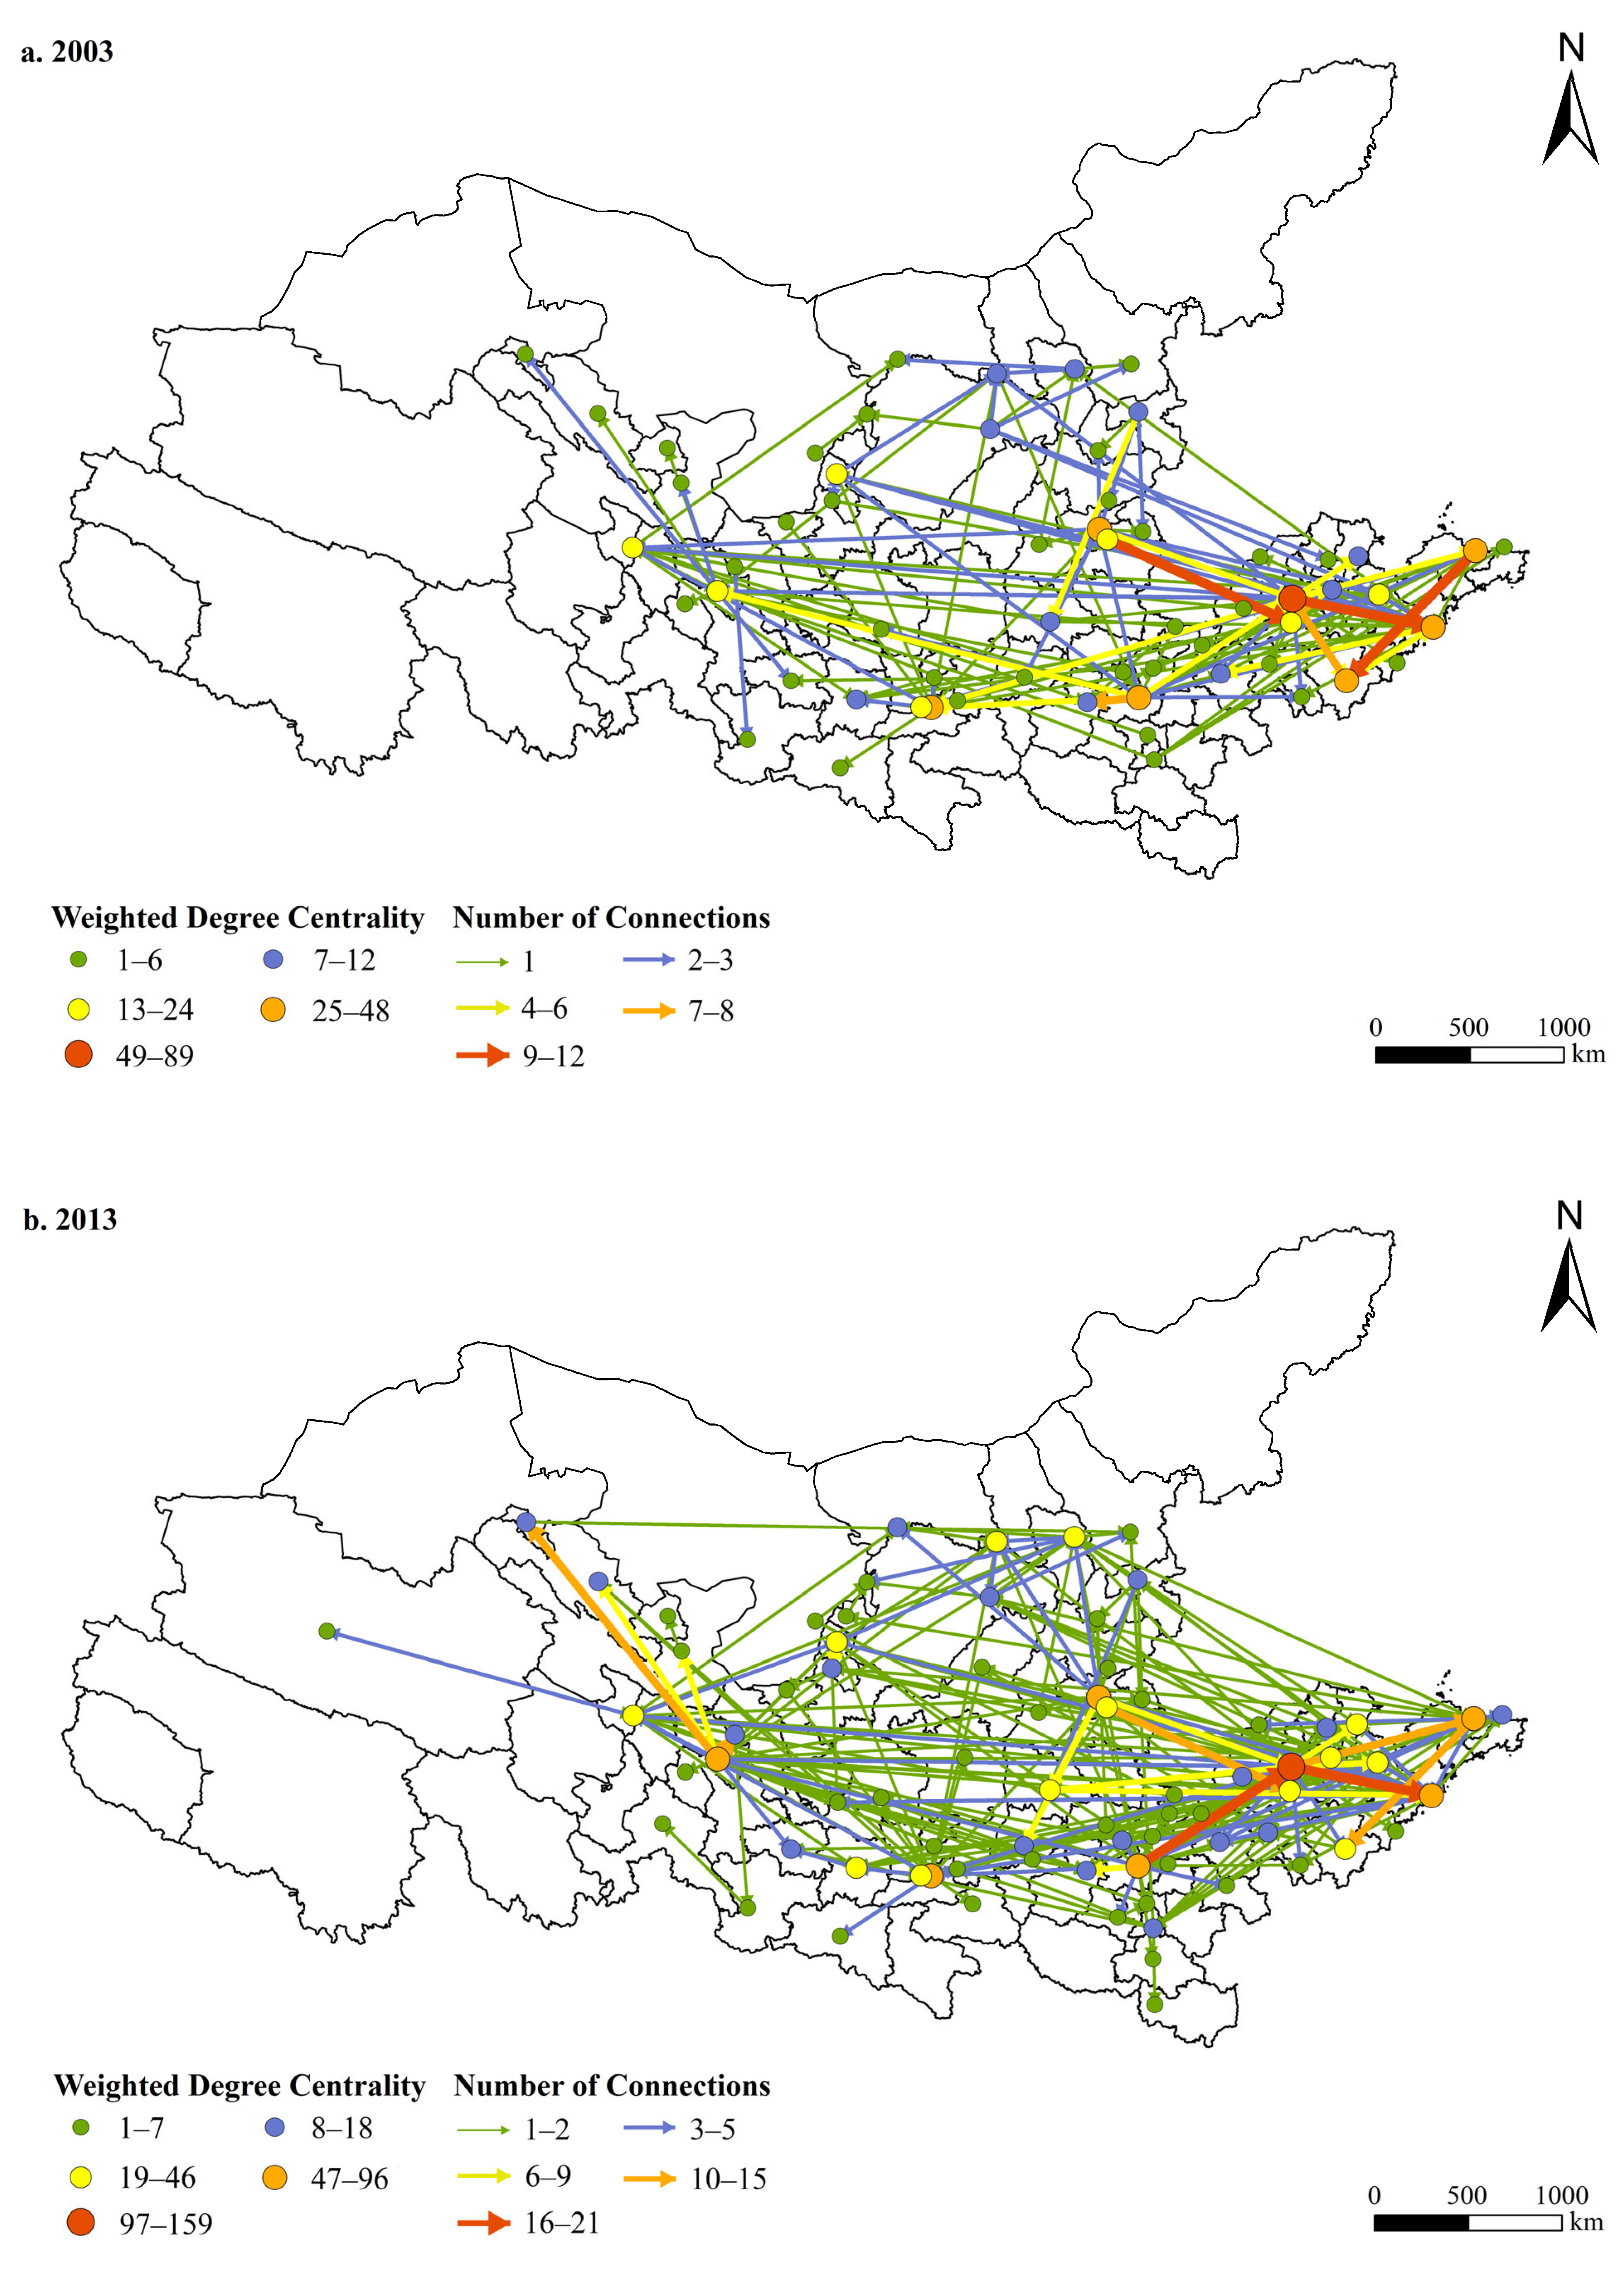
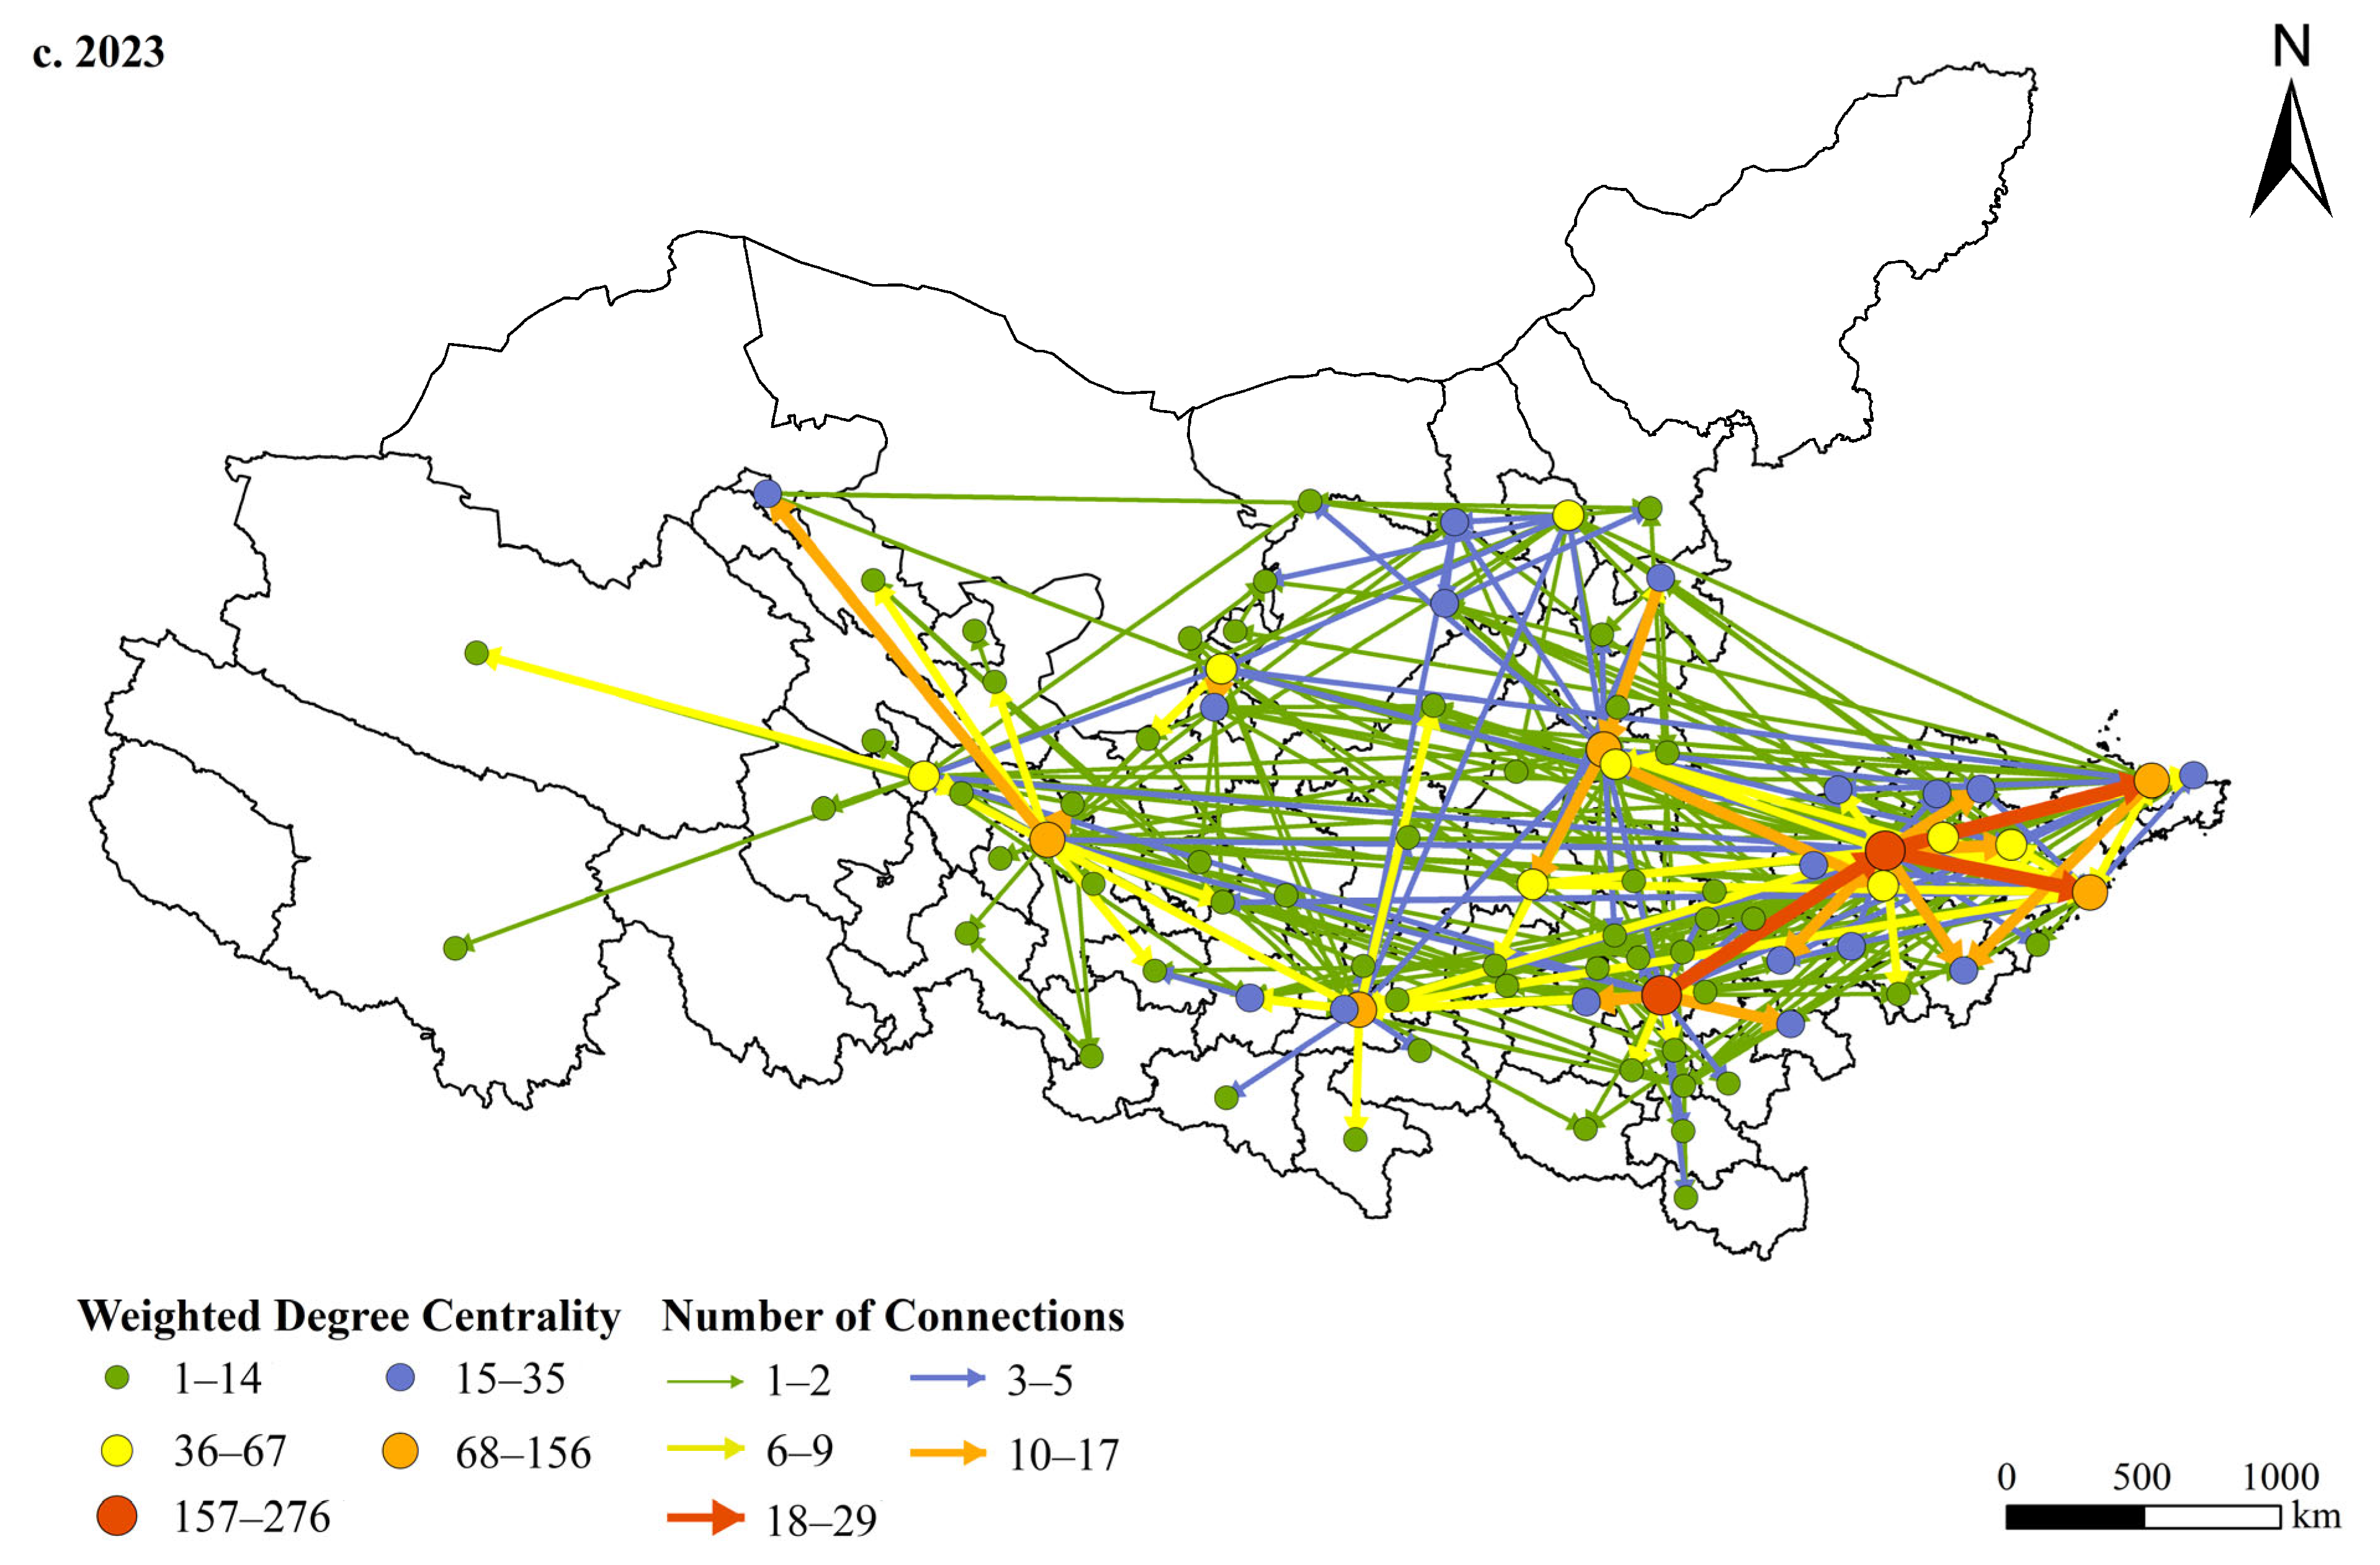
Spatial concentration remains strong, especially in Shandong Province. Ji’nan, Qingdao, and Yantai repeatedly hosted the most headquarters, highlighting the continued dominance of Shandong’s coastal hubs. However, other cities outside Shandong experienced the fastest growth, notably Zhengzhou, Xi’an, and Yinchuan. These gains reflect improvements in transportation infrastructure, demographic momentum, and stronger institutional capacity, making these cities more attractive as command locations. Subsidiary expansion was most significant in Qingdao, Ji’nan, and Xi’an, showing their dual roles as command centers and outward corporate hubs. Meanwhile, subsidiaries became more widely distributed across the basin, with notable growth in midstream and upstream cities, indicating a gradual spatial spread.
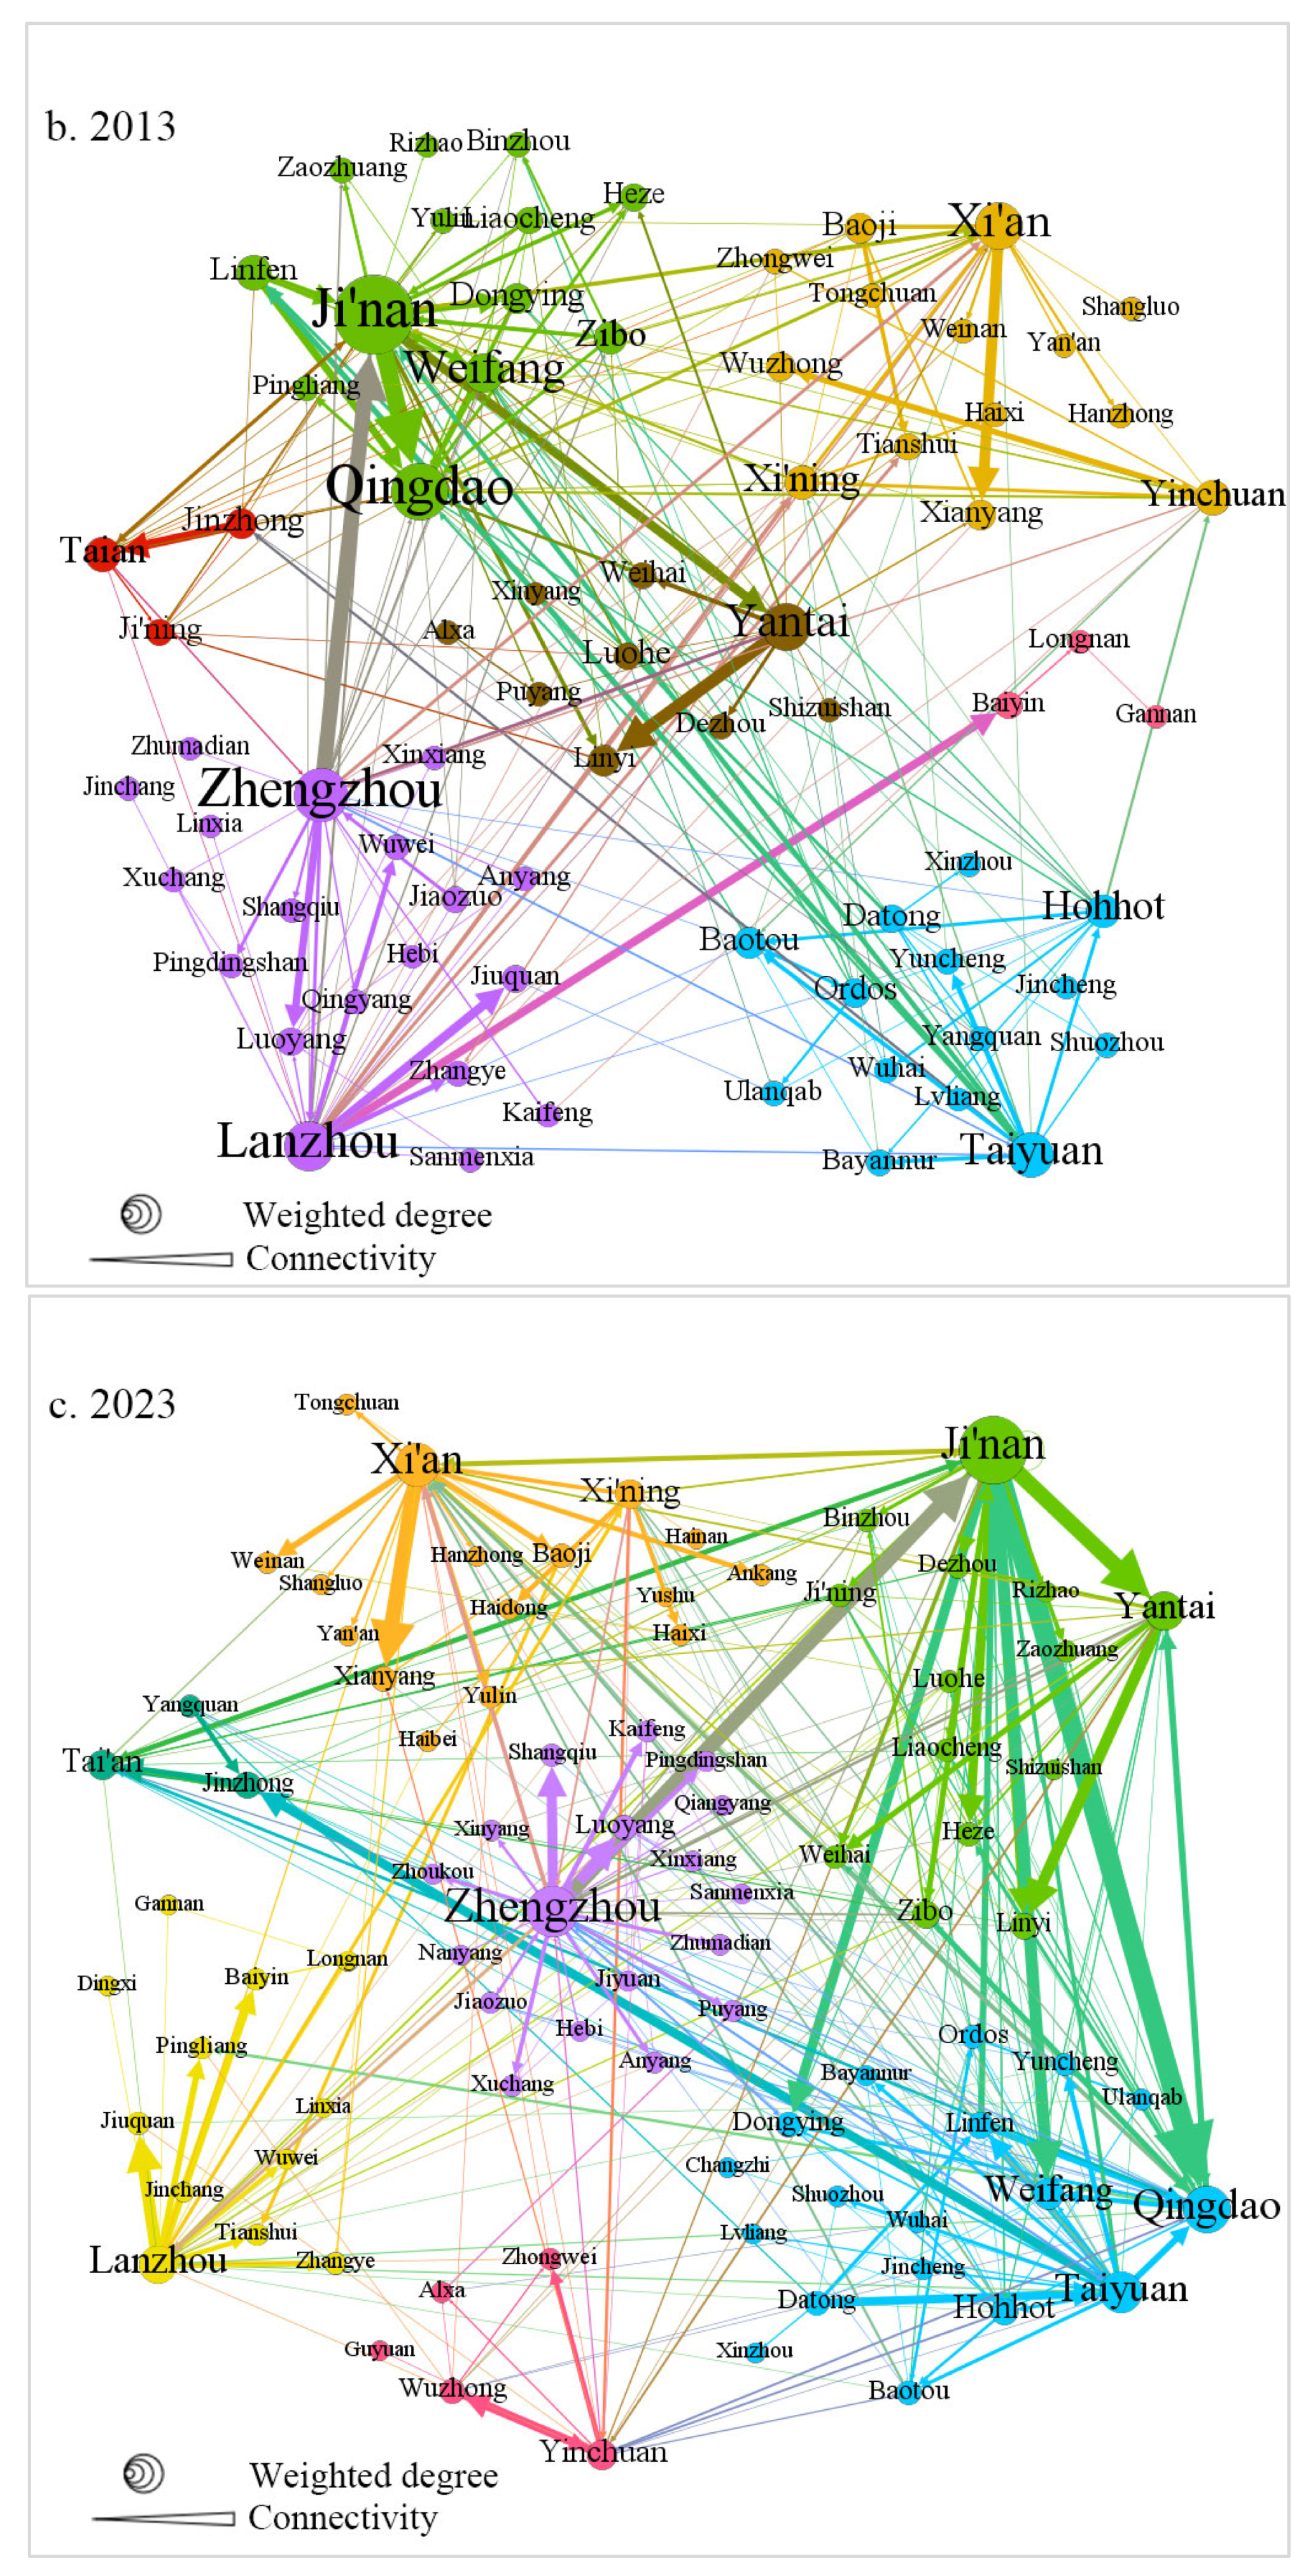
Figure 3a–c illustrate the development of connections across five levels of linkage strength. Over time, stronger ties become more common, but spatial differences stay. In the lower-reach provinces of Shandong and Henan, most connections are of mid-strength (levels 3–4), although some major cities still keep level 5 ties with weaker links. In Shaanxi and Shanxi, weaker ties are more common, but key links between capitals and large prefectures tend to be stronger (levels 2–3). The upstream area remains characterized by sparse, weak ties, with peripheral nodes such as Hanzhong, Ankang, Haixi, and Yushu maintaining limited connections to the larger network. Overall, the findings indicate that although participation has increased, structural imbalances persist, with dense clusters in the middle and lower reaches, and only moderate connectivity upstream.

Figure 3.
(a) Weighted Degree Centrality of Cities in 2003; (b) Weighted Degree Centrality of Cities in 2013; (c) Weighted Degree Centrality of Cities in 2023.
This evolving pattern aligns with both hierarchical and relational perspectives discussed earlier. On one hand, the dominance of Shandong coastal nodes indicates a hierarchical concentration of command functions in a few key regional capitals. On the other hand, the increasing involvement of upstream and border cities reflects relational diffusion, where connectivity extends beyond traditional cores, though unevenly. The coexistence of these dynamics demonstrates how the basin’s urban system has become more inclusive yet remains asymmetrically structured.
4.1.2. Community Structures and Cross-Provincial Linkages
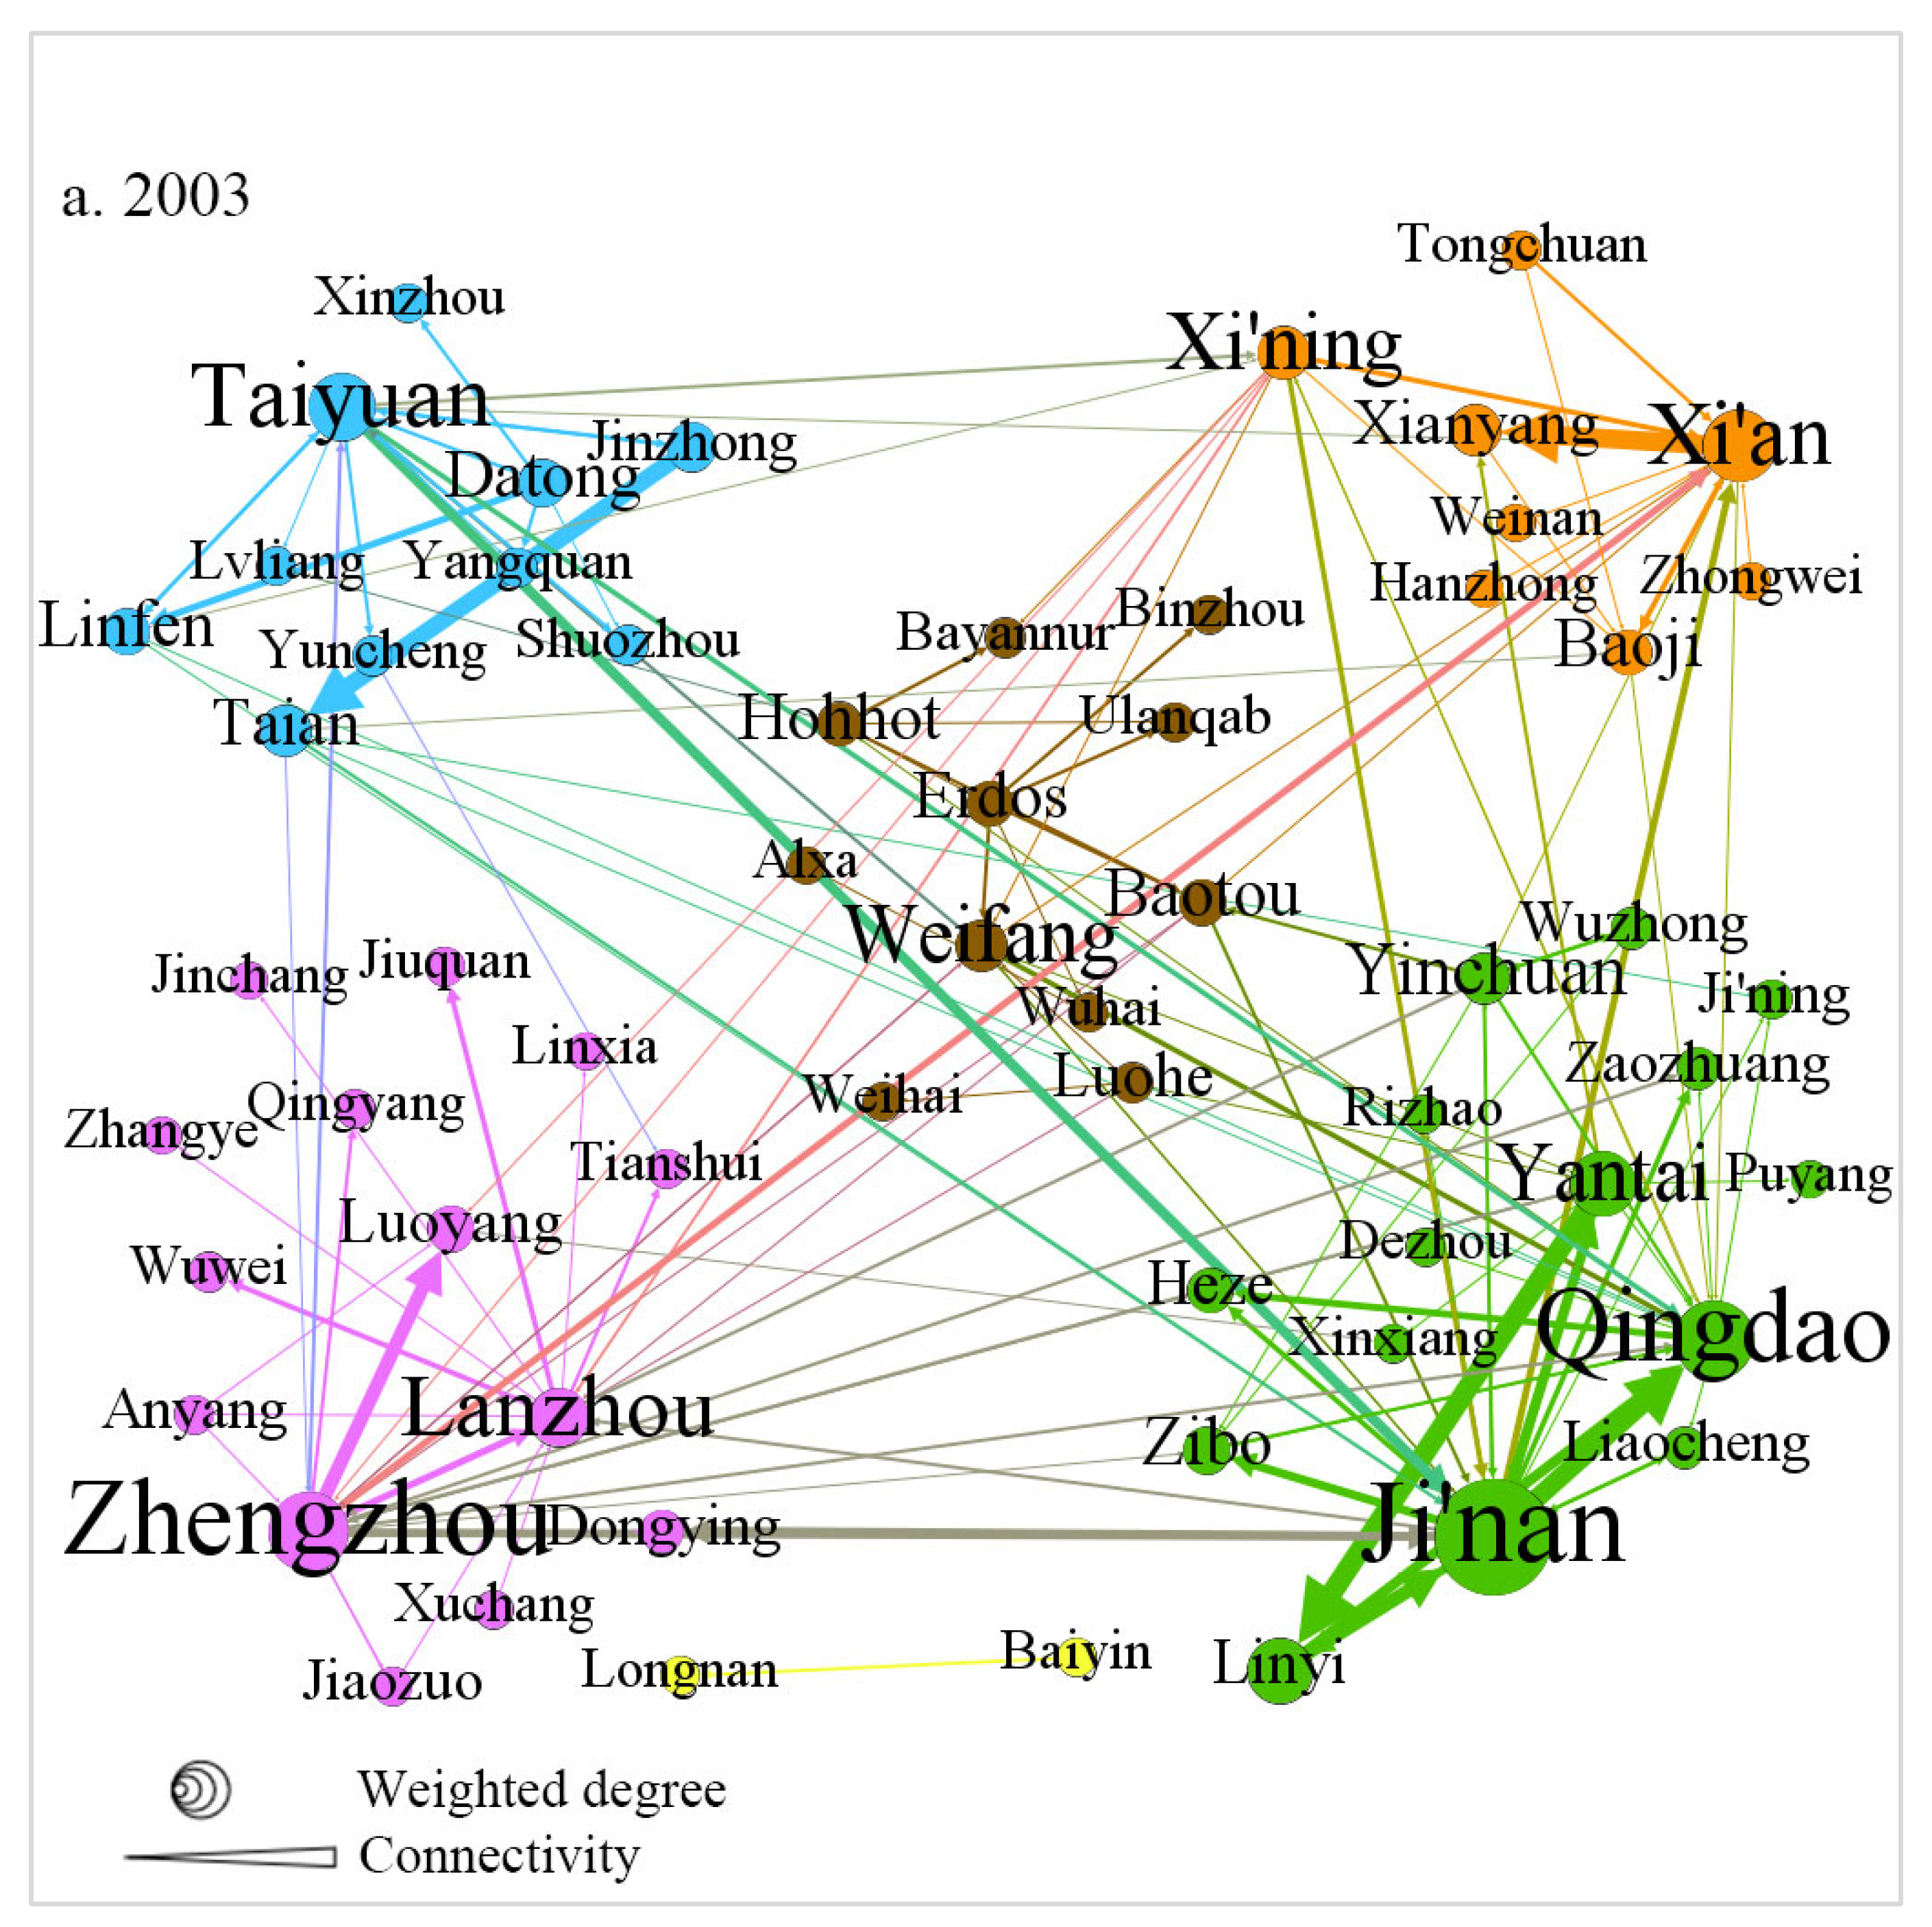
Community detection analysis using the Gephi 0.10 program offers an additional perspective on the network’s organizational structure. Figure 4a shows that in 2003, six communities could be identified, three of which displayed clear core–periphery structures centered on Ji’nan, Zhengzhou, and Xi’an. These communities crossed provincial borders, indicating that corporate connections increasingly went beyond administrative boundaries. However, in each case, the central city was a provincial capital, highlighting the persistent influence of administrative hierarchy in shaping intercity relationships. This pattern supports the idea that relational connectivity does not replace but rather overlays institutional and hierarchical structures.

Figure 4.
(a) Communities in the YRB Urban Network in 2003; (b) Communities in the YRB Urban Network in 2013; (c) Communities in the YRB Urban Network in 2023.
By 2013, the number of communities had grown to seven (Figure 4b). Three communities maintained strong core–periphery features, including a Ji’nan-centered group, a Zhengzhou–Lanzhou dual-core group, and a Xi’an-centered group. These communities increased in size and internal density, exhibiting stronger organizational ties. However, their structure showed that, although relational flows crossed provincial borders, they remained organized around administratively strong anchor nodes.
In 2023, seven communities were identified once again (Figure 4c). The three most prominent core–periphery communities are centered on Ji’nan, Zhengzhou, and a dual core of Taiyuan and Qingdao. The rise in Taiyuan–Qingdao as a dual hub underscores the increasing significance of Shanxi and the coastal Shandong Peninsula, demonstrating that multi-core structures can coexist alongside traditional capital-centered ones. These communities not only span multiple provinces but also present greater internal diversity, indicating that relational connections across the basin are well-established. Meanwhile, communities centered around weaker cities mostly remain within a single province, reflecting the ongoing influence of administrative boundaries.
The evidence from community detection confirms that both hierarchy and relationality influence the YRB’s corporate geography. Strong capitals expand cross-provincial reach and coordinate extensive connections, while weaker nodes rely on within-province clustering. This dual pattern supports the idea that urban integration in the YRB is organized by both hierarchical order and relational flows, a conclusion that aligns closely with the theoretical concepts discussed in the literature review.
4.2. Power Structure of Cities in the YRB Urban Network
The distinction between connectivity and control is crucial for understanding how cities position themselves within the YRB corporate network. As noted earlier, DAC measures a city’s outward organizational links, while DAP shows the influence a city has over connected units. Both metrics increased from 2003 to 2023, but they did so in different ways, illustrating that being well-connected does not automatically mean having control.
At the start of the study period, Ji’nan was the main connector and controller (see Table 2). It was the only city with a DAC over 2000 in 2003 and also ranked first in DAP, a dual leadership that combined both throughput and authority in one location. Lanzhou served as an illustrative counterexample: despite having more limited connectivity, it held the second-highest DAP, demonstrating that hierarchical and institutional capacities can support authority even when relational reach is limited.
Table 2.
TOP 20 Cities with Highest Centrality and Power, 2003, 2013, and 2023.
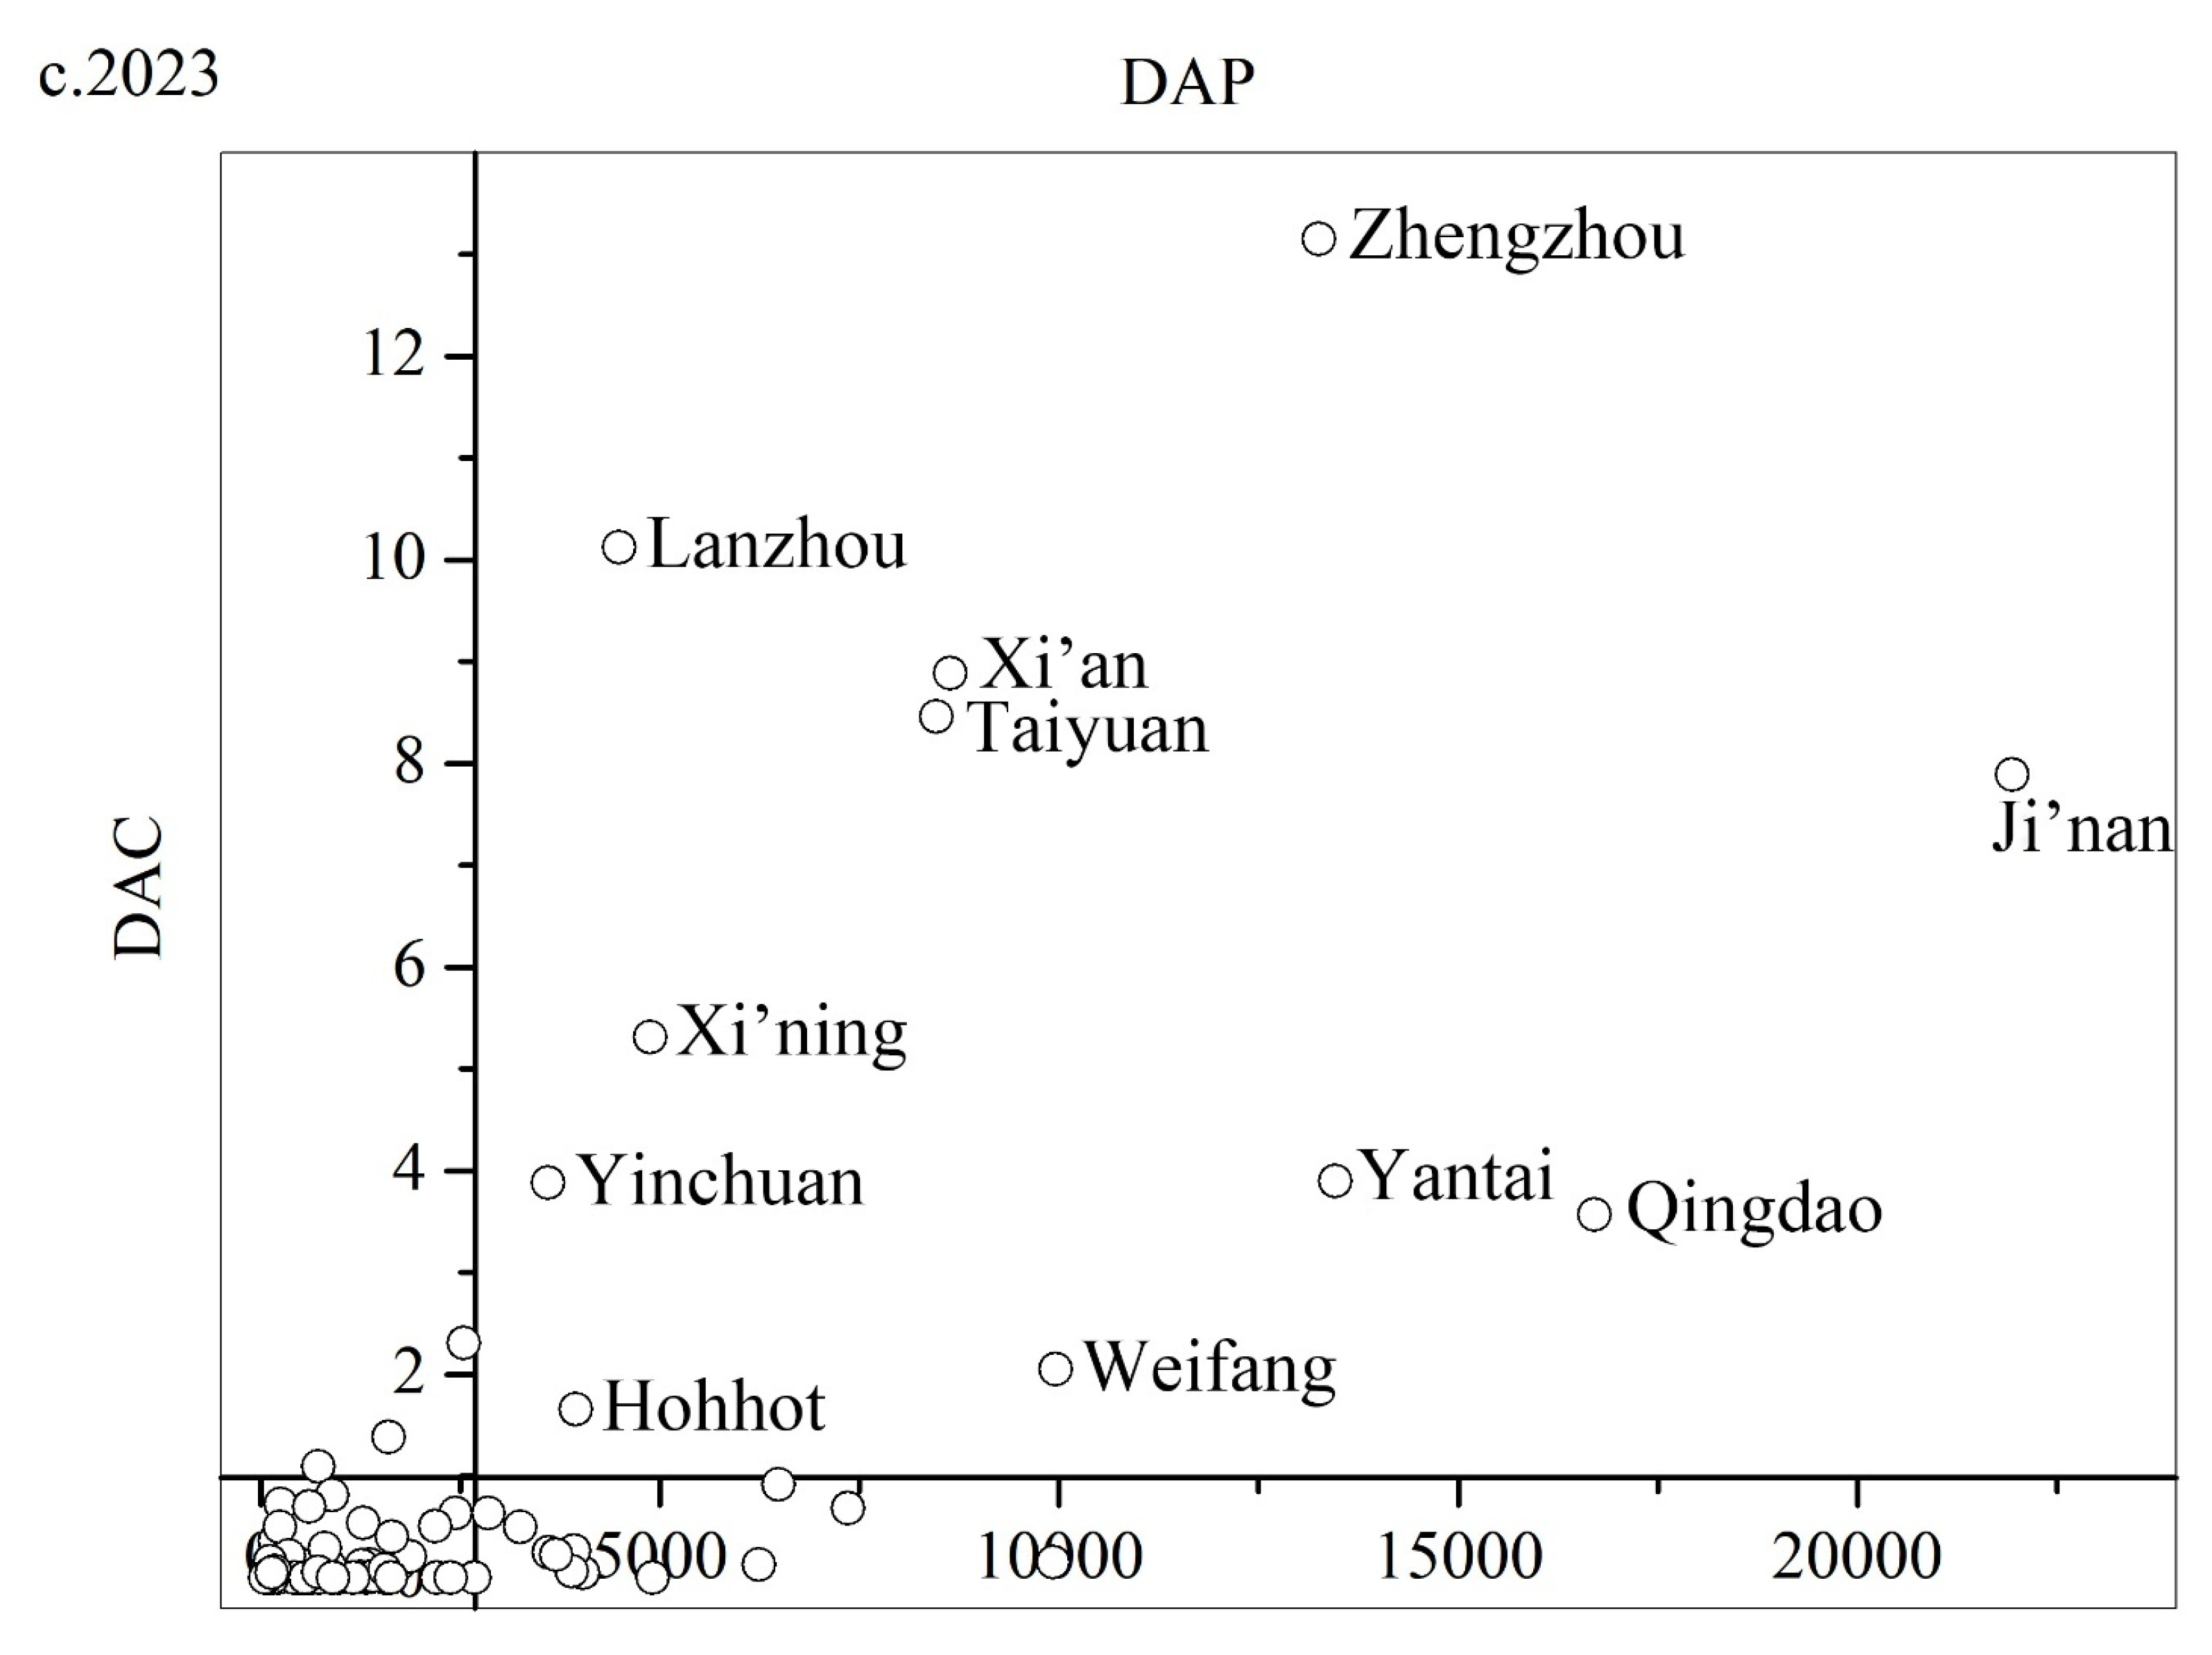
By 2013, the landscape of centrality had undergone significant changes. Ji’nan’s DAC surpassed 8000, while Qingdao, Yantai, and Zhengzhou reached the top tier of connectors. However, control shifted to become more inward-focused with Zhengzhou overtaking Ji’nan at the top of the DAP rankings, followed closely by Lanzhou, Xi’an, and Taiyuan. This decoupling persisted and strengthened through 2023. Ji’nan’s DAC grew to nearly 22,000, and Zhengzhou, Yantai, and Qingdao each exceeded 13,000, yet authority remained concentrated in Zhengzhou, Lanzhou, Xi’an, and Taiyuan. Ji’nan’s DAP increased more gradually compared to 2013. The stability of this control hierarchy, despite increased connectivity, indicates that administrative status and institutional strength determine how effectively cities convert links into authority.
This pattern, where connectivity exceeds authority on the coast and authority surpasses connectivity in the interior, aligns with theoretical expectations when relational expansion occurs within long-standing hierarchical structures [,]. It reflects a stable division of roles. Coastal hubs, such as Ji’nan, Qingdao, and Yantai, develop extensive ties due to their industrial strength, port logistics, and outward orientation, which attract operating units and supplier linkages. These connections increase throughput and relational reach but do not necessarily signal local command. Interior provincial capitals, such as Zhengzhou, Xi’an, Lanzhou, and Taiyuan, concentrate higher-order functions because administrative rank, institutional resources, and dense producer services reduce coordination costs for multi-location firms. In short, the network distinguishes cities that move flows from those where decision-making remains anchored. This contrast has sharpened over time. As corridors thickened and participation widened, coastal nodes expanded their connector roles, while capitals deepened their command roles. Community patterns are consistent with this division. Capitals continue to anchor cross-provincial clusters even where coastal hubs register the highest levels of connectivity. The system is therefore more connected overall yet remains stratified by function, with throughput and authority concentrated in different places.
Variations in both DAC and DAP increased over the course of twenty years, indicating that inequality in connectivity and control has grown in tandem with overall network densification. The standard deviations of both measures have increased, and the upper end of the distribution has shifted further away from the median. In essence, this suggests that although more cities are now part of corporate networks than before, a smaller group of locations holds a disproportionately large share of command functions. The increase in participants has not led to a proportional distribution of authority. Instead, control over resources and decision-making has become more concentrated, particularly among provincial capitals, which retain advantages related to administrative rank and policy influence.
Urban positionality provides an additional perspective on how connectivity and control intersect or fail to do so within specific cities. By analyzing the combined distribution of DAC and DAP, the analysis categorizes YRB cities into four roles: leading, hub, gateway, and peripheral. The overall shares are revealing, as leading and hub cities together account for about one-third of the system, with leading cities comprising roughly 13–15 percent and hubs 15–17 percent. Gateway cities are rare, making up only 3.5–10 percent, while most cities remain peripheral at 58–86 percent. The rarity of gateway positions—that is, cities that hold significant power despite limited connectivity—highlights how uncommon it is to find places where institutional influence or unique location advantages can replace extensive ties. Figure 5a–c illustrate the distribution of leading cities across space, highlighting their location. These cities are deeply involved in intercity economic flows and have the capacity to direct and redistribute resources, thereby shaping regional circulation.

Figure 5.
(a) Categorization of Cities Based on DAC and DAP in 2003; (b) Categorization of Cities Based on DAC and DAP in 2013; (c) Categorization of Cities Based on DAC and DAP in 2023.
Changes in positionality over time were selective rather than systemic. A few previously peripheral cities, such as Linfen, Baotou, Jining, Luoyang, and Dezhou, had risen to hub status by 2023, typically following improvements in transportation, market access, and integration with nearby cores. Wuzhong became a gateway, an example where administrative or strategic advantages allowed influence to grow faster than connectivity. Even so, the dominant pattern was persistence: most peripheral cities remained peripheral, and the leading group stayed small. This stickiness characterizes hierarchical systems where institutional and infrastructural resources accumulate and cannot be quickly built.
Interpreting these patterns through the lens of hierarchy–relationality reveals three interconnected dynamics. Relational expansion has clearly increased participation, with more headquarters, subsidiaries, and intercity connections bringing in previously marginal areas. However, hierarchy still influences who benefits most, as interior capitals strengthen control while coastal hubs often serve as transit points. This divergence reflects a functional division of labor, with some cities focusing on facilitating flows and others on exercising authority, depending on whether their advantages lie in logistics and openness or in administrative and institutional strength.
The implications for basin integration are mixed. The rise in additional hubs indicates broader participation, but the persistent dominance of a narrow DAP elite highlights the limits of relational strengthening without more substantial institutional change. Community structures also remain centered in capitals, whose administrative status and service networks facilitate cross-provincial coordination, while smaller, weaker cities stay confined to isolated clusters.
Overall, the evidence shows that connectivity does not guarantee influence. The list of highly connected cities has grown, but control still mainly remains with a few capitals that hold clear advantages. The YRB urban network is now both more connected and more complex, with flows moving across the basin, yet power remains concentrated in key nodes. This duality affects the region’s power structure and sets the stage for examining the factors that influence power in the next section.
4.3. Influence Factors of Urban Network Structure in the YRB
This section explores the factors that determine cities’ positions within the YRB corporate network, focusing on how institutional hierarchy, market openness, infrastructure, and factor endowments influence both connectivity (DAC) and control power (DAP).
Administrative hierarchy (POL) remains the most consistent and significant determinant of network position, usually at the 1 percent level (5 percent for DAP in 2023) (Table 3). Provincial capitals and vice-provincial cities have better access to policy tools, infrastructure investment, and coordination mechanisms that lower firms’ transaction and compliance costs. Higher administrative rank facilitates the establishment of subsidiaries, combines fiscal and land incentives, and reduces regulatory barriers. These advantages expand outward linkages (DAC) and attract command functions (DAP). The persistent influence of POL shows that hierarchical institutions continue to determine how cities benefit from growing connectivity rather than being replaced by it.
Table 3.
SEM Estimation Results for DAC and DAP.
Government intervention (GOV), measured as government expenditure as a share of GDP, initially has a negative impact on DAC and DAP, but this effect diminishes over time. Cities with higher government spending initially attracted fewer multi-site connections and had less corporate control, suggesting higher coordination costs or weaker private-sector incentives. As the regional economy diversified and fiscal systems became more stable, this limitation lessened, indicating that an initially strong government presence became less restrictive as market conditions improved.
Economic openness (TRA), measured by utilized FDI, becomes increasingly important over time. In 2003, its impact was weak, but by 2013 and 2023, it emerged as a significant positive predictor. Early openness mainly increased the number and diversity of intercity exchanges, boosting DAC. As cross-border activities matured, openness also supported advanced producer services and managerial expertise, helping turn participation into authority, as reflected in higher DAP values.
Economic development (GDP) follows a similar pattern. In 2003, the coefficients were weak or inconsistent because some lower-GDP cities hosted historically embedded listed firms within an early, sparse network. As the corporate system grew, per capita GDP became a strong positive predictor of both DAC and DAP. Higher development levels signify larger markets, better infrastructure, and a more efficient business environment, all of which lower coordination costs and encourage both connection and control.
Industrial structure (IND), measured by the share of the tertiary sector in GDP, also changes over time. In 2003, service orientation was positively related to DAC but weakly or negatively related to DAP, indicating that early tertiarization was driven by routine services that created linkages without enhancing command functions. By 2013 and 2023, the coefficients become positive and significant for both, reflecting the growth of finance, legal, IT, and logistics services that support multi-establishment management and corporate coordination.
Innovation capacity (INN), measured by patent grants, shifts from negative to positive. The negative coefficient in 2003 reflects the limited distribution of inventive activity and its weak link to firms’ organizational networks. By 2013 and 2023, innovation becomes a significant positive factor for both DAC and DAP, demonstrating that stronger local knowledge ecosystems foster participation in intercity flows and higher-order coordination. Innovation thus evolves from a symbolic indicator to a substantial capability supporting both connectivity and authority.
Transportation (TRF) and human capital (CAP) consistently remain strong and positive. Road-freight volume reflects logistics capacity and integration into regional supply chains. Higher freight volumes indicate denser logistics networks that enhance operational efficiency and support multi-establishment growth. Similarly, human capital, measured by college students per ten thousand residents, captures the availability of skilled labor supporting managerial, analytical, and technical roles. Together, these two variables enable cities to act as both connectors and controllers rather than passive nodes in the corporate system.
Employment size (PRA) does not significantly impact either DAC or DAP. Although employment typically correlates with city size, China’s administrative definition of cities includes large rural areas, so high employment figures often reflect dispersed or low-wage labor rather than producer services or headquarters functions. For example, Linyi and Heze have large populations but low urbanization levels and are not major hubs for listed-firm headquarters. Therefore, size alone does not determine network importance.
Urbanization level (URB) yields mixed results. It is insignificant for DAC in 2003 and turns negatively related in 2013 and 2023, aligning with the basin’s relatively low urbanization and uneven industrial structure, which may limit intercity connectivity even in more urbanized prefectures. In contrast, URB is positively and significantly connected to DAP, suggesting that stronger urban services and administrative capacity improve local coordination and resource concentration. This finding supports the study’s distinction between connectivity and control, showing that urbanization contributes more to authority than to outward reach.
Information infrastructure (INT), measured by the number of households with internet access, correlates more strongly with DAP than with DAC. Broader internet penetration reduces communication costs and enhances real-time coordination and monitoring. These capabilities mainly strengthen managerial oversight rather than expand intercity links, indicating that digital infrastructure reinforces control functions more than relational reach.
Overall, the SEM results demonstrate that hierarchical institutions form the foundation of network advantage, while openness, development, services, innovation, infrastructure, and human capital shape how cities translate participation into influence. The changing coefficients from 2003 to 2023 show a gradual shift: administrative status was the primary factor early on, but market-oriented and capability-based factors gained significance later, although they never replaced institutional advantages.
Robustness checks verify these interpretations. Re-estimating the models with different spatial-weight matrices based on geographic distance yields similar coefficient signs and significance levels, indicating that the results are not tied to a specific neighborhood structure. The consistency across different specifications strengthens confidence that the observed relationships between hierarchy, openness, capabilities, and network outcomes are stable features of the YRB system rather than artifacts of model selection.
Taken together, the findings show that hierarchy and relational growth develop simultaneously in the YRB. Administrative institutions continue to influence the conditions under which cities benefit from connectivity, while openness, innovation, infrastructure, and human capital determine which cities are best able to turn participation into authority. This pattern highlights how institutional and market forces together maintain uneven development even as intercity linkages expand.
5. Discussion and Conclusion
This study analyzed the corporate network of the Yellow River Basin from 2003 to 2023, focusing on the headquarters–subsidiary relationships of listed companies and employing spatial error models. The network became denser and more geographically varied, although some gaps still exist. Connectivity grew most rapidly in the middle and lower reaches, while upstream areas integrated at a slower pace.
A clear hierarchy persists. Many cities serve secondary roles, with provincial capitals and important prefectural centers supporting communities, while decision-making power remains concentrated in a few central interior locations. Connectivity and influence are not always aligned. Coastal hubs in Shandong have established extensive networks and managed throughput, while Zhengzhou, Xi’an, Lanzhou, and Taiyuan have strengthened their command functions.
Although coastal hubs register the highest volumes of ties, while interior capitals hold more authority, this is not a contradiction but a division of roles. Coastal cities excel at moving flows due to their industrial depth, logistics assets, and outward orientation, which attract operating units and supplier links. Capitals concentrate control because administrative rank and denser producer services lower coordination costs for multi-location firms. As participation widened after 2013, these roles became more distinct rather than converging.
These community patterns are consistent with the division between connectors and command centers. Capitals continue to anchor the most stable communities, even in areas where coastal hubs boast the highest connectivity. Evaluation should therefore track both the spread of ties and the location of higher-order functions, since broader participation can coexist with concentrated control.
Results from the explanatory models show that administrative rank is a strong predictor of position, although its influence gradually decreases. Openness, economic development, producer services, and innovation become more important as the network matures. Transportation infrastructure and human capital support both connectivity and authority throughout all years. Employment size has limited explanatory power once the administrative classification of prefectural cities is taken into account, and urbanization exhibits mixed effects. Information infrastructure is more closely linked to authority than to connectivity. Government intervention, measured as government expenditure as a share of GDP, is negatively related to network position during the early period, and this impact lessens as economies grow and fiscal structures stabilize. Overall, institutions form the foundation for advantage, while capabilities and market conditions determine whether cities convert connectivity into authority.
Two limitations highlight areas for future research. First, the analysis grouped industries, potentially masking sector-specific differences in how intercity connections influence authority. Second, focusing on headquarters–subsidiary relationships captures vertical links within firms but overlooks lateral connections like partnerships, supply chains, and co-investments. Future research can differentiate by sector and include both vertical and horizontal corporate relationships, such as supply chain linkages, to gain a more complete understanding of how corporate linkages affect intercity connectivity and the distribution of control within the regional urban system. Additionally, future studies could use eigenvector or eigenvalue centrality to analyze how authority is distributed across interconnected cities and employ longitudinal methods to track changes in corporate organization as data coverage improves. Addressing these limitations would enhance the empirical foundation for policy development and clarify the evolving spatial hierarchies within the basin.
Policy design should distinguish between expanding intercity connectivity and enhancing local control functions. Cities that already manage large networks require support to transform connectivity into stronger decision-making capabilities. Key priorities include developing advanced producer services, strengthening managerial and legal capacities, and upgrading digital systems for real-time coordination. Cities with established authority but limited connectivity need assistance to expand their outward reach. Corridor-focused logistics improvements, stronger intercity freight and data connections, and programs linking local headquarters with a broader network of affiliates are essential.
Human capital and infrastructure are the most effective levers. Investments should strengthen universities and vocational pipelines aligned with regional industries, expand freight capacity and intermodal connections, and upgrade digital connectivity that supports monitoring and planning. When innovation systems are weak, partnerships with leading universities and national laboratories in Xi’an and Zhengzhou can accelerate knowledge spillovers. When advanced services are lacking, targeted support for finance, legal, and information services can help firms develop higher-level functions locally.
Taken together, these findings demonstrate that the Yellow River Basin’s corporate network has become more connected and geographically inclusive, whereas decision-making power remains concentrated in a few interior capitals. Administrative hierarchy still shapes advantages, and openness, development, producer services, innovation, transportation, information infrastructure, and human capital influence how cities turn participation into authority. Connectivity and control do not always align, which explains how broader participation can exist alongside concentrated power.
Regional coordination remains crucial. A polycentric structure anchored by Zhengzhou, Jinan, Xi’an, Lanzhou, and Taiyuan, supported by sub-centers such as Qingdao, Yinchuan, Xining, Hohhot, and Yantai, better fits the cross-provincial network. Coordinated corridor planning reduces effective distances and prevents duplication, while shared data platforms lower uncertainty for firms operating across jurisdictions. Basin governance should align ecological protection with high-quality development. Joint monitoring and early warning systems, clear upstream and downstream responsibilities, and compensation mechanisms for ecological services can balance environmental aims with functional integration. A basin plan endorsed at the national level would formalize these arrangements and offer predictability for multi-site operations.
Author Contributions
Conceptualization, X.C., X.G. and E.W.; methodology, X.C. and X.G.; software, X.G.; validation, X.C. and E.W.; formal analysis, X.G.; investigation, X.G. and Y.H.; resources, X.C.; data curation, X.G. and Y.H.; writing—original draft preparation, X.G. and X.C.; writing—review and editing, E.W.; visualization, X.G. and Y.H.; supervision, X.C.; project administration, X.G.; funding acquisition, X.C. and E.W. All authors have read and agreed to the published version of the manuscript.
Funding
This research was funded by the following grants and awards: National Natural Science Foundation of China, No. 42371187. Excellent Youth Project of Natural Science Foundation of Henan Province, No.242300421142. Philosophy and Social Science Innovation Talent Support Program of Henan Province, No.2024-CXRC-09. Itterman Faculty Professional Development Award, University of North Dakota.
Institutional Review Board Statement
Not applicable.
Informed Consent Statement
Not applicable.
Data Availability Statement
The raw data supporting the conclusions of this article will be made available by the authors on request.
Acknowledgments
During the preparation of this manuscript, the authors used ChatGPT-5 and Grammarly (v1.2.209.1783) solely for language editing and for refining the workflow figure. The authors have reviewed and edited the output and take full responsibility for the content of this publication.
Conflicts of Interest
The authors declare that they have no conflicts of interest.
References
- Christaller, W. Central Places in Southern Germany; Carlisle, W.B., Translator; Prentice-Hall: Englewood Cliffs, NJ, USA, 1966. [Google Scholar]
- Castells, M. The Rise of the Network Society; Blackwell Publishers: Oxford, UK, 1996. [Google Scholar]
- Sassen, S. The Global City: New York, London, Tokyo, 2nd ed.; Princeton University Press: Princeton, NJ, USA, 2001. [Google Scholar]
- Beaverstock, J.V.; Smith, R.G.; Taylor, P.J. World-City Network: A New Metageography? Ann. Assoc. Am. Geogr. 2000, 90, 123–134. [Google Scholar] [CrossRef]
- Neal, Z.P. Differentiating Centrality and Power in the World City Network. Urban Stud. 2011, 48, 2733–2748. [Google Scholar] [CrossRef]
- Liu, X.; Derudder, B. Analyzing Urban Networks through the Lens of Corporate Networks: A Critical Review. Cities 2013, 31, 430–437. [Google Scholar] [CrossRef]
- Zhang, H.; Jiang, L.; Zhou, J.; Chu, N.; Li, F. The Characteristics and Influencing Factors of the Spatial Network of City-Based Innovation Correlation in China: From the Perspective of High Tech Zones. Sci. Rep. 2023, 13, 16289. [Google Scholar] [CrossRef] [PubMed]
- Neal, Z.P. Does World City Network Research Need Eigenvectors? Urban Stud. 2013, 50, 1648–1659. [Google Scholar] [CrossRef]
- Zhao, Z.; Wei, Y.; Pang, R.; Wang, S.; Feng, Z. Measurement of Directed Alternative Centricity and Power of a Directed Weighted Urban Network: A Case of the Population Flow Network of China during ‘Chunyun’. Geogr. Res. 2017, 36, 647–660. (In Chinese) [Google Scholar]
- Taylor, P.J. Specification of the World City Network. Geogr. Anal. 2001, 33, 181–194. [Google Scholar] [CrossRef]
- Meijers, E. From Central Place to Network Place: The Shift to Polycentric Development in the Randstad Holland. Environ. Plan. B 2007, 34, 795–810. [Google Scholar]
- Derudder, B.; Taylor, P.; Ni, P.; De Vos, A.; Hoyler, M.; Hanssens, H.; Bassens, D.; Huang, J.; Witlox, F.; Shen, W.; et al. Pathways of Change: Shifting Connectivities in the World City Network, 2000–2008. Urban Stud. 2010, 47, 1861–1877. [Google Scholar] [CrossRef]
- Taylor, P.J.; Hoyler, M.; Verbruggen, R. External Urban Relational Process: Introducing Central Flow Theory to Complement Central Place Theory. Urban Stud. 2010, 47, 2803–2818. [Google Scholar] [CrossRef]
- De Goei, B.; Meijers, E.; Kapoen, P.-J.; Priemus, H. The Polycentric Metropolis Unpacked: Concepts, Trends and Policy in the Randstad Holland. Built Environ. 2010, 36, 31–47. [Google Scholar]
- Alderson, A.S.; Beckfield, J. Power and Position in the World City System. Am. J. Sociol. 2004, 109, 811–851. [Google Scholar] [CrossRef]
- Peris, A.; Meijers, E.; van Ham, M. The Evolution of the Systems of Cities Literature since 1995: Schools of Thought and Their Interaction. Netw. Spat. Econ. 2018, 18, 533–554. [Google Scholar] [CrossRef]
- Peris, A.; Meijers, E.; van Ham, M. Information Diffusion between Dutch Cities: Revisiting Zipf and Pred Using a Computational Social Science Approach. Comput. Environ. Urban Syst. 2021, 85, 101565. [Google Scholar] [CrossRef]
- Taylor, P.J.; Derudder, B.; Faulconbridge, J.; Hoyler, M.; Ni, P. Advanced Producer Service Firms as Strategic Networks, Global Cities as Strategic Places. Econ. Geogr. 2014, 90, 267–291. [Google Scholar] [CrossRef]
- de Carvalho, R.C.; Charles-Edwards, E. The evolution of spatial networks of migration in Brazil between 1980 and 2010. Popul. Space Place 2020, 26, e2332. [Google Scholar] [CrossRef]
- Derudder, B.; Van Nuffel, N. Connecting the world: Analyzing global city networks through airline flows. In Aeromobilities; Saulo, C., Sven, K., John, U., Eds.; Routledge: London, UK, 2009; pp. 88–107. [Google Scholar]
- Derudder, B.; Witlox, F. Mapping World City Networks Through Airline Flows: Context, Relevance, and Problems. J. Transp. Geogr. 2008, 16, 305–314. [Google Scholar] [CrossRef]
- Dessemontet, P.; Kaufmann, V.; Jemelin, C. Switzerland as a single metropolitan area? A study of its commuting network. Urban Stud. 2010, 47, 2785–2802. [Google Scholar] [CrossRef]
- Krätke, S. Global Media Cities in a Worldwide Urban Network. Eur. Plan. Stud. 2003, 11, 605–628. [Google Scholar] [CrossRef]
- Sigler, T.J.; Martinus, K. Extending beyond ‘World Cities’ in World City Network (WCN) Research: Urban Positionality and Economic Linkages through the Australia-Based Corporate Network. Environ. Plan. A Econ. Space 2017, 49, 2916–2937. [Google Scholar] [CrossRef]
- Derudder, B.; Taylor, P. Change in the World City Network, 2000–2012. Reg. Stud. 2016, 50, 263–275. [Google Scholar] [CrossRef]
- Derudder, B.; Van Nuffel, N. Analyzing the Changing Connectivity of World Cities. Tijdschr. Voor Econ. En Soc. Geogr. 2009, 100, 437–448. [Google Scholar]
- Xiao, S.; Sun, B. How Has the Inter-City Corporate Network Spatio-Temporally Evolved in China? Evidence from Chinese Investment in Newly Established Enterprises from 1980–2017. Land 2023, 12, 204. [Google Scholar] [CrossRef]
- Zhang, R.; Lin, J.; Sun, D. The Role of Institutions and Markets in Shaping Intercity Investment Networks in China. Cities 2024, 153, 105221. [Google Scholar] [CrossRef]
- Sun, B.; Liu, P.; Zhang, W.; Zhang, T.; Li, W. Unpacking Urban Network as Formed by Client Service Relationships of Law Firms in China. Cities 2022, 122, 103546. [Google Scholar] [CrossRef]
- Pan, F.; Bi, W.; Lenzer, J.; Zhao, S. Mapping Urban Networks through Interfirm Service Relationships: The Case of China. Urban Stud. 2017, 54, 3639–3654. [Google Scholar] [CrossRef]
- Pan, F.; Bi, W.; Liu, X.; Sigler, T. Exploring Financial Centre Networks through Inter-Urban Collaboration in High-End Financial Transactions in China. Reg. Stud. 2020, 54, 1379–1391. [Google Scholar] [CrossRef]
- Liu, W.; Hou, Q.; Xie, Z.; Mai, X. Urban Network and Regions in China: An Analysis of Daily Migration with Complex Networks Model. Sustainability 2020, 12, 3208. [Google Scholar] [CrossRef]
- Li, J.; Lin, W.; Chu, J. Exploring the Spatiotemporal Dynamics and Resilience Assessment of Urban Networks from the Perspective of Population Flow. PLoS ONE 2025, 20, e0325908. [Google Scholar] [CrossRef]
- Li, A.; Mou, N.; Zhang, L.; Yang, T.; Liu, W.; Liu, F. Tourism flow between major cities during China’s National Day holiday: A social network analysis using Weibo check-in data. IEEE Access 2020, 8, 225675–225691. [Google Scholar] [CrossRef]
- Yang, H.; Dobruszkes, F.; Wang, J.; Dijst, M.; White, P. Comparing China’s Urban Systems in High-Speed Railway and Airline Networks. J. Transp. Geogr. 2018, 68, 233–244. [Google Scholar] [CrossRef]
- Wang, L.; Xue, X.; Zhou, X.; Wang, Z.; Liu, R. Analyzing the Topology Characteristics and Effectiveness of the China City Network. Environ. Plan. B Urban Anal. City Sci. 2021, 48, 2554–2573. [Google Scholar] [CrossRef]
- Li, M.; Guo, W.; Guo, R.; He, B.; Li, Z.; Li, X.; Liu, W.; Fan, Y. Urban Network Spatial Connection and Structure in China Based on Railway Passenger Flow Big Data. Land 2022, 11, 225. [Google Scholar] [CrossRef]
- Wang, Z.; Liu, X.; Li, W.; Li, L. High-Speed Rail and Aviation in China: Impacts on Intercity Network Connectivity. J. Transp. Geogr. 2021, 92, 103030. [Google Scholar]
- Xiao, C.; Liu, C.; Li, Y. Directional and weighted urban network analysis in the Chengdu-Chongqing economic circle from the perspective of new media information flow. ISPRS Int. J. Geo-Inf. 2022, 12, 1. [Google Scholar] [CrossRef]
- Liu, L.; Sun, Y.; Li, W. Characteristics and Prediction of Urban Interaction Networks from the Perspective of Traffic Flow and Text Information Flow. Environ. Plan. B Urban Anal. City Sci. 2025, 52, 430–456. [Google Scholar] [CrossRef]
- Cao, X.; Chen, B.; Guo, Y.; Yi, Z. The impact of intra-city and inter-city innovation networks on city economic growth: A case study of the Yangtze River Delta in China. Land 2023, 12, 1463. [Google Scholar] [CrossRef]
- Cao, X.; Zeng, G.; Lin, L.; Zou, L. Hierarchical characteristics and proximity mechanism of intercity innovation networks: A case of 290 cities in China. Complexity 2021, 2021, 5538872. [Google Scholar] [CrossRef]
- Li, L.; Derudder, B.; Shen, W.; Kong, X. Exploring the Dynamics of the Disaggregated Intercity Corporate Network in the Yangtze River Delta, China: A Relational Event Approach. J. Geogr. Syst. 2022, 24, 115–140. [Google Scholar] [CrossRef]
- Zhang, Z.; Tang, Z. Exploring the Imprint of the Institutional Context on the Urban Network in China: Comparative Analyses Between Corporate-Based Networks with Different Ownership Structures. Glob. Netw. 2024, 24, e12478. [Google Scholar] [CrossRef]
- Zhao, M.; Derudder, B.; Huang, J. Examining the Transition Processes in the Pearl River Delta Polycentric Mega-City Region Through the Lens of Corporate Networks. Cities 2017, 60, 147–155. [Google Scholar] [CrossRef]
- Haiyang, L.; Lucang, W.; Qianguo, L.; Cuixia, Y.A. Spatial and Temporal Patterns of City Connection Networks in the Yellow River Basin Based on Tencent’s Big Data of Population Migration. Econ. Geogr. 2020, 40, 28–37. (In Chinese) [Google Scholar]
- Wu, S.; Wang, L.; Liu, H. Urban Network Structure and Its Dynamics in the Yellow River Basin. Acta Geogr. Sin. 2020, 75, 202–212. (In Chinese) [Google Scholar]
- Zhang, H.; Han, Z.; Qiao, G.; Wang, H.; Wang, H.Y.; Duan, Y. The Spatial Connection Pattern and Influencing Factors of Tourism Economy among Cities in the Yellow River Basin. Arid Land Geogr. 2023, 46, 1344–1354. (In Chinese) [Google Scholar]
- Hang, S.U.; Jiao, G.U.; Jinli, Z.H. Spatial Structure Evolution of Urban Information Network in the Yellow River Basin from Multi Scale Perspective. Arid Land Geogr. 2023, 46, 1206–1216. (In Chinese) [Google Scholar]
- Wang, X.; Liu, X. Evolution and Organization of Urban Tourism Linkages under HSR in the Yellow River Basin. Econ. Geogr. 2022, 42, 211–218. (In Chinese) [Google Scholar]
- Chai, D.; Zhang, D.; Sun, Y.; Yang, S. Research on the City Network Structure in the Yellow River Basin in China Based on Two-Way Time Distance Gravity Model and Social Network Analysis Method. Complexity 2020, 2020, 6680954. [Google Scholar] [CrossRef]
- Zhang, Y.; Yang, Y.; Wei, S.; Ma, Z.; Tian, M.; Sun, M.; Nie, J. Research on Spatial Structure and Resilience of Complex Urban Network: A Case Study of Jing–Jin–Ji Urban Agglomeration. Front. Environ. Sci. 2022, 10, 999124. [Google Scholar] [CrossRef]
- Zhao, J.; Zhang, X.; Ren, J.; Chen, X. Spatial Structure and Influencing Factors of Urban Network in the Yellow River Basin from a Multi-Flow Perspective. Sci. Geogr. Sin. 2022, 42, 1778–1787. (In Chinese) [Google Scholar]
- Gong, W.; Zhang, Z.; Chen, L.; Ma, X.; Zhao, X.; Guo, Y. Evolution of an Urban Network in the Yellow River Basin Based on Producer Services. Complexity 2022, 2022, 3667745. [Google Scholar] [CrossRef]
- Ma, H.; Wei, Y.D.; Huang, X.; Zhang, W. The Innovation Networks Shaped by Large Innovative Enterprises in Urban China. J. Geogr. Sci. 2023, 33, 599–617. [Google Scholar] [CrossRef]
- Lu, D. Regional Development and Its Spatial Structure; Springer: Singapore, 2024. [Google Scholar]
- National Bureau of Statistics of China. China City Statistical Yearbook; China Statistics Press: Beijing, China, 2003. [Google Scholar]
- National Bureau of Statistics of China. China City Statistical Yearbook; China Statistics Press: Beijing, China, 2013. [Google Scholar]
- National Bureau of Statistics of China. China City Statistical Yearbook; China Statistics Press: Beijing, China, 2023. [Google Scholar]
- Anselin, L.; Bera, A.K. Spatial Dependence in Linear Regression Models with an Introduction to Spatial Econometrics. In Handbook of Applied Economic Statistics; Ullah, A., Ed.; Marcel Dekker: New York, NY, USA, 1998; pp. 237–289. [Google Scholar]
Disclaimer/Publisher’s Note: The statements, opinions and data contained in all publications are solely those of the individual author(s) and contributor(s) and not of MDPI and/or the editor(s). MDPI and/or the editor(s) disclaim responsibility for any injury to people or property resulting from any ideas, methods, instructions or products referred to in the content. |
© 2025 by the authors. Licensee MDPI, Basel, Switzerland. This article is an open access article distributed under the terms and conditions of the Creative Commons Attribution (CC BY) license (https://creativecommons.org/licenses/by/4.0/).