Abstract
Concentrations of oxides of nitrogen (NOx), as the sum total of nitric oxide (NO) and nitrogen dioxide (NO2), the individual parts, i.e., NO and NO2, (NOx = NO + NO2), and wind speed and direction measurements were gathered over a thirteen-year period (2011–2023) at the Giordan Lighthouse Geosciences Observatory, located on the Island of Gozo, forming part of the Maltese Archipelago (Central Mediterranean). The atmospheric concentration measurements were recorded with a Thermo Scientific Model 42i NOx analyser, which employs the chemiluminescence technique to detect atmospheric traces of NOx concentrations. In this case study, an investigation was conducted to understand the wind and seasonal variabilities of the measured concentrations. The highest NOx concentrations occurred when the prevailing wind originated from the SE, while a broad minimum was observed when the wind blew from the S–W sector. The maxima were primarily associated with land-based sources, predominantly vehicular emissions on the main island, i.e., Malta. The amplitudes for NO, NO2, and NOx in relation to wind direction were 63%, 125%, and 121%, respectively. Significant variabilities were observed during the autumn season. Regarding wind speed, the NOx concentrations reached their peak during high-wind-speed events, which are associated with transboundary pollution. A secondary broad maximum was observed for wind forces between 2 and 4, while the lowest concentrations were recorded at wind force 9. The NOx concentrations exhibited a seasonal maximum in spring and a minimum in winter, which contrasts with the findings from the Monte Cimone station in Italy. The seasonal amplitudes for NO, NO2, and NOx were 46%, 15%, and 17%, respectively. It is evident that NO concentrations exhibited a greater seasonal variability, whereas NO2 concentrations demonstrated significant variability in relation to wind direction.
1. Introduction
In recent decades, the increased levels of oxides of nitrogen (NOx) in the lower atmosphere have raised significant concerns within the scientific community due to their effect on both the environment and human health [1]. NOx comprises nitric oxide (NO) and nitrogen dioxide (NO2). These nitrogen compounds are crucial in atmospheric chemistry, greatly influencing air quality, climate, and ecosystems. The presence of NOx in the atmosphere regulates the production of ground-level ozone (O3) and the concentrations of hydroxyl (OH) in the lower troposphere [2]. Furthermore, NOx is a contributor to acid rain, when it forms nitric acid, and the generation of particulate matter (PM), when it gives rise to nitrate particles following neutralisation of the respective acid form.
Essentially, NOx enters the atmosphere primarily as NO from both natural and anthropogenic sources. Natural sources include soil microbial activities, wildfires and biomass combustion, lightning, volcanic eruptions, and stratospheric intrusion. In contrast, human activities are predominantly linked to fossil fuel burning, transportation, industrial operations, agricultural practices, and waste management.
The Health Effects Institute [3] estimated that, globally, 8.1 million premature deaths in 2021 were caused by ambient air pollution. In Continental Europe, exposure to pollutant levels exceeding WHO recommended values resulted in a significant number of premature deaths in 2022, including 239,000 due to PM2.5, 48,000 due to NOx, and 70,000 due to acute ozone exposure [4]. Over the past decades, the European Union (EU) has implemented various legislation to regulate different aspects of air pollution, particularly concerning NOx levels. Specifically, the EU has established NOx emissions criteria for both large combustion plants [5] and medium combustion plants [6]. In 2007, the EU enacted regulations, commonly referred to as Euro 6 regulations, aimed at reducing NOx emissions from light passenger and commercial vehicles [7]. Essentially, these regulations impose a limit on NOx emissions, specifically set at 80 mg km−1 for newly sold diesel passenger vehicles within the EU. Throughout the past decades, NOx emissions in Continental Europe have demonstrated a notable downward trend, indicative of the success of various environmental policies and technological innovations. Indeed, in 2022, NOx emissions from energy production decreased by 75%, while reductions from the transportation sector exceeded 51% compared to 1990 [8].
On a regional level, the Mediterranean has faced and continues to face distinct air pollution issues stemming from shipping, tourism, industrial activities, and climatic conditions. Within the Mediterranean region, NOx emissions are mainly linked to extensive maritime operations and urban development along the coast. Research shows that in 2011, NOx emissions from maritime traffic in the Mediterranean represented 41% of all ship emissions in the European sea areas [9]. This is largely due to international cargo traffic, which plays a crucial role in ship emissions along the key Mediterranean route stretching from the Suez Canal to Gibraltar. To mitigate emissions originating from ship activities in the Mediterranean, the International Maritime Organisation (IMO) has classified the region as a Sulphur Emission Control Area (SECA) under MARPOL Annex VI Regulation 14 [10], which came into effect on 1 May 2025. Following this achievement, various environmental organisations are pushing for the creation of a NOx Emission Control Area (NECA) in the Mediterranean to tackle NOx emissions from shipping. The establishment of an NECA could bring about a notable reduction in NOx emissions, thus enhancing air quality and mitigating the associated health risks. The success of SECA could be replicated and augmented by NECA.
NOx concentration measurements were reported at several stations in the Mediterranean region [11,12]. At the Lamezia Terme station in Southern Italy, nine years of continuous measurements (2015–2023) [13] reveal diurnal and seasonal patterns similar to those observed elsewhere in the Central Mediterranean [14]. However, the maxima and minima associated with wind speed and wind direction are specific to each station, depending on its location and proximity to local and regional emission sources. Therefore, the aim of this case study is to provide a detailed analysis of NOx variability in relation to wind speed and wind direction, specifically pertaining to the Island of Gozo (Maltese Archipelago).
There is intrinsic value in the work being presented, as a case study. Meanwhile, there is a scarcity of datasets similar to the ones analysed here for the region. A proper comparative statistical analysis that takes into account datasets from various monitoring stations that adequately cover the region of investigation would extend the current case study, and would lead to robust conclusions for the Central Mediterranean that would benefit further understanding of the relevant scientific processes and policy makers alike. In some way, this paper is a call for further work and regional collaboration, highlighting the importance of the subject matter.
2. Materials and Methods
This section includes a brief overview of the monitoring site, with particular attention to the climatic conditions of the area. This is followed with a description of the instrumentation used and the dataset that formed the basis of this work.
2.1. Monitoring Site
NOx atmospheric concentrations and pertinent meteorological factors, including wind speed and wind direction, are the basis for this work. The associated dataset covers a period of over 13 years, making it the most extensive of its kind in the Central Mediterranean. It was recorded at the Giordan Lighthouse Geosciences Observatory (GLGO), situated on the NW side of the Island of Gozo, part of the Maltese Archipelago, with geographic coordinates, 36°04′24″ N and 14°13′08″ E, as illustrated in Figure 1. The Giordan Lighthouse stands at 163 m above sea level, approximately 800 m from the coastline, and faces the sea in the direction of the sector, 260–60°.
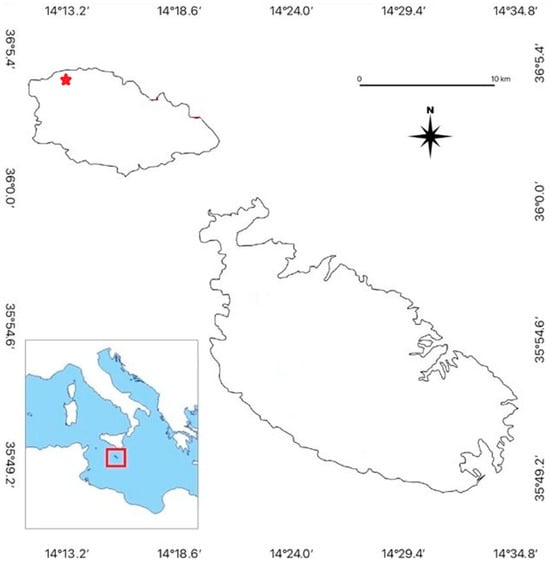
Figure 1.
The Giordan Lighthouse Atmospheric Observatory (indicated with a red star) is located on the Island of Gozo (forming part of the Maltese Archipelago) situated in the Central Mediterranean, as shown in the inset map (and encapsulated by a red-bordered square). Its geographical coordinates are 36°04′24″ N and 14°13′08″ E, and lies at an altitude of 167 m above sea level.
The Giordan Lighthouse was constructed during the time when the Maltese Archipelago was part of the British Empire. It commenced operations on 15 March 1853, serving as a reference point for vessels navigating the Straits of Sicily [15]. However, with the advent of transponders and navigation devices on vessels, the role of lighthouses has diminished in terms of navigation significance. Notwithstanding this stance, over the past thirty years, the Giordan Lighthouse has played an essential role for both local and international scientific communities. A collaborative Maltese–German scientific research initiative was officially initiated on 7 December 1996, aimed at monitoring atmospheric pollution in the Central Mediterranean. Since the inception of this research programme, the atmospheric observatory (now with a wider scope as a geosciences observatory) has been equipped to measure various meteorological parameters and trace gas concentrations, as detailed by [15]. In the year 2000, the GLGO (then, Giordan Lighthouse Atmospheric Observatory) received Global Atmospheric Watch status from the World Meteorological Organisation [16].
2.2. Climatic Conditions at the Monitoring Site
The climate in the neighbourhood of the Giordan Lighthouse is typically Mediterranean, as expected, dominated by hot, dry summers and mild, wet winters. A long-term analysis indicates that the temperature at the Giordan Lighthouse exhibits a bimodal distribution, with peaks at 10 °C and 25 °C. This suggests that the climate in the area primarily oscillates between two states: a cool period and a warm phase [17], which typically correspond to the winter and summer seasons, respectively.
The relative humidity at the monitoring site fluctuates between 70% and 80%, with a significant decrease during the summer months [17]. The prevailing wind originates from the WNW sector, with a total frequency of occurrence of 41.42%. In terms of wind speed, 33.75% of the observations are essentially gentle to moderate breezes, while 15.66% of the recorded wind speeds are associated with stagnant atmospheric conditions. During the summer, the monitoring site is influenced by high-pressure zones, intense solar radiation, and sea-breeze circulations, which are driven by land–sea thermal contrasts [18].
2.3. Instrumentation
At the GLGO, various atmospheric parameters are monitored. In [15], a comprehensive description of the equipment installed and the atmospheric variables measured at the observatory are provided. In this study, NOx measurements were recorded using a Thermo Scientific Model 42i NOx analyser, which employs the chemiluminescence technique to detect trace levels of nitrogen oxide concentrations in ambient air. The measurement technique involves the reaction of ambient nitric oxide (NO) with ozone (O3) generated by the instrument, yielding a characteristic luminescence whose intensity correlates with the NO concentration. This technique also incorporates a molybdenum NO2-to-NO converter, heated approximately at 325 °C, which transforms atmospheric NO2 into NO in order to measure the NO2 concentration in ambient air. A major drawback of this technique is associated with the molybdenum catalyst, which also transforms other chemical compounds such as nitric acid (HNO3) and peroxyacetyl nitrate (PAN) into NO. Indeed, the resulting artefact leads to over estimation of the NO2 concentration, particularly in rural air quality networks [19]. A comprehensive account of the calibration process of the NOx analyser at the monitoring site has been documented elsewhere [14].
Wind speed and direction data have been collected at the apex of the lighthouse lantern using a cup and vane anemometer (Lambrecht, Model 14512) since the inception of the atmospheric research programme. On 28 July 2021, the wind anemometer was replaced with a smart weather sensor (Lufft, Model WS200) that uses ultrasonic technology and remains operational to this day.
2.4. Dataset
The atmospheric research programme at the GLGO was launched in 1997 but NOx measurements commenced several years later, specifically on 20 January 2011, and continued until 31 July 2023. As far as is known, the resulting NOx dataset represents the longest of its kind in the Central Mediterranean, covering over 13 years of (quasi) uninterrupted measurements. An extensive description of the minor data gaps, data processing, and quality assurance checks is given by [14]. It is worth noting that practically all the data that is collected at the GLGO is uploaded to online databases maintained by well-recognised international organisations. For this current study, the dataset was downloaded on 1 November 2024, from the EBAS repository, which is available online at https://ebas.nilu.no/ (accessed on 1 November 2024). Nevertheless, to conform to the Malta time zone, the time series has been modified to GMT + 1.
2.5. Objective
The objective of this case study was to analyse the concentration variabilities of oxides of nitrogen in relation to wind speed and wind direction, specifically for the Island of Gozo (Maltese Archipelago), making use of a substantial dataset.
The findings should provide a comprehensive overview of the variabilities in NOx concentrations at the specific location. This information contributes to the scientific understanding of the underlying processes and may assist policymakers in their work.
Apart from the intrinsic value of the case study presented here, the work is an open call for long-term background air quality data collection in the region. A comparative statistical analysis utilising datasets from various monitoring stations that give adequate coverage of the region will enable more generic, robust conclusions.
3. Results
The subsequent sub-sections provide a comprehensive discussion of the results and outcomes of this study. Initially, a concise overview of the wind measurements is presented. Furthermore, an evaluation of how wind direction and seasonal variability affect NOx concentrations is discussed. All data analyses were performed utilising the Statistical Package for the Social Sciences (SPSS) software (Version: 29.0.0.0 (241)) by the International Business Machines (IBM) Corporation.
3.1. Wind Measurements
Wind significantly influences air quality as it has the capacity to carry and distribute pollutants from emission sources into the atmosphere over considerable distances. A comprehensive analysis of wind measurements at the GLGO for the study period reveals that the prevailing wind predominantly originated from the W–NW sector, with a total frequency of occurrence of 41.42%. Winds from the NE are notable since they comprise 6.25% of the overall wind direction data. N winds were infrequent, representing only 0.43% of the hourly average values for wind direction. WNW winds were consistently dominant across all seasons, while winds from the ENE–SE sector were more prominent during spring and autumn. The examination of wind speed data indicates that 33.75% of observations correspond to gentle to moderate breezes, whereas 15.66% of the wind speed records are associated with stagnant atmospheric conditions. During the summer, low wind speeds ranging from forces 0 to 4 (on the Beaufort Scale) were prevalent, while higher wind forces from 5 to 12 were more common in winter.
3.2. NOx Concentrations in Relation to Wind Direction
Figure 2 depicts the dependence of the trace gas concentrations under consideration on wind direction. The analysis indicates that the concentrations of oxides of nitrogen correlate for all wind sectors, with the exception of the NW–NNW sector. A significant correlation can be observed when the wind is originating from the ESE–SE sector, which corresponds with air masses traversing the Island of Malta. Malta’s population density stands at 1393 people km−2, making it the most densely populated nation in Europe [20]. As of the end of March 2025, the number of registered motor vehicles reached 447,455 [21]. Given its total land area of 316 km2, this results in a vehicle density of 1416 vehicles km−2. The entire vehicle fleet is predominantly powered by petrol (58.1%), diesel (34.9%), and electric/plugin hybrid vehicles (4.1%) [20]. The average age of vehicles in Malta is 15.73 years, indicating that most vehicles do not comply with Euro 6 emissions standards [22]. Consequently, it can be concluded that vehicular emissions are the main source of anthropogenic NOx emissions in Malta, which explains the peak in NOx concentration when the wind was from the SE, where Malta is located with respect to Gozo. A secondary peak occurred with winds from the NNE–NE sector, attributed to anthropogenic emissions from Sicily. In the NW–NE sector, measurements were affected by emissions from shipping, as the monitoring station is situated near the main shipping route in the Central Mediterranean [23]. The lowest concentrations were recorded when the wind was from the S–W sector, where there is minimal influence from major anthropogenic sources, aside from transboundary pollution. The average NOx concentration for the S–W sector was 0.99 ± 0.92 ppbv, which can be regarded as the background concentration for the Maltese Islands.
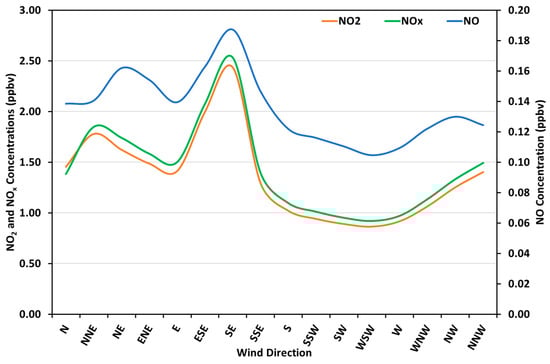
Figure 2.
Average nitric oxide, nitrogen dioxide, and oxides of nitrogen concentrations in relation to wind direction, for the period 2012–2023.
The maxima and minima of pollutant concentrations observed at a given background monitoring station are intrinsic characteristics of the specific monitoring site, reflecting the combined influence of meteorological parameters—such as wind speed and wind direction—and emissions from nearby sources. At the Liossia background monitoring station in Greece [24], both NO and NO2 exhibit distinct concentration maxima as a function of wind direction. Specifically, elevated NO levels are associated with northeasterly winds, whereas NO2 concentrations reach their highest values during westerly wind conditions.
The amplitudes for NO, NO2, and NOx are 63%, 125%, and 121%, respectively. It is evident that the amplitude of NO2 is double that of NO. This significant difference may be attributed to the quenching effect of O3 when the wind originated from the SE. It is worth recalling that the Central Mediterranean is recognised as a high-O3 regime characterised by intense photochemical activity [25].
3.3. NOx Concentrations in Relation to Wind Speed on the Beaufort Scale
Wind speed is a crucial factor in the distribution and concentration of air pollutants. Under calm and low-wind conditions, pollutants tend to remain close to the ground, leading to their accumulation in localised areas. This phenomenon can result in severe pollution episodes and a marked decline in air quality, particularly in urban or industrial settings. In contrast, during periods of high wind speeds, the dispersion of air pollutants is enhanced, thereby reducing their concentration near the emission source. Nevertheless, high winds can transport pollutants, such as dust, smoke, and chemicals, over considerable distances, impacting air quality across regions. Consequently, high-wind events are instrumental in transboundary air pollution, where emissions from one nation can adversely affect the air quality of another.
In this study, the Beaufort Scale is used as proxy for wind speed. The usefulness of the Beaufort Scale is that it discretises the parameter by creating categories, which simplifies matters. Figure 3 shows how the average concentrations of the oxides of nitrogen vary with wind speed. The analysis indicates that there is correlation amongst the compounds over the entire scale, except at very high wind speeds. NOx reached a peak concentration during extreme high wind speed events. It is evident that, under these conditions, the Central Mediterranean acts as a receptor for transboundary pollution from Continental Europe. Several modelling analyses confirm the impact of transboundary pollution on the Mediterranean region [26,27,28]. Furthermore, a secondary peak in NOx levels can be noted for the Beaufort Scale range, 2 to 4, which corresponds to the highest frequency of wind speed occurrences. Conversely, the lowest NOx concentrations corresponded to wind force 9. It should also be noted that the source–receptor orientation plays an important role in this matter.
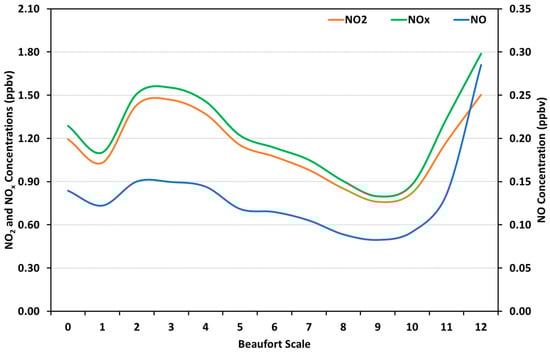
Figure 3.
Average nitric oxide, nitrogen dioxide, and oxides of nitrogen concentrations in relation to the Beaufort Scale, for the period 2012–2023.
3.4. NOx Concentrations in Relation to Wind Direction Categorised by the Beaufort Scale
The wind direction was first categorised according to the associated wind speed, utilising three distinct wind speed categories defined on the Beaufort Scale. The Recode function in SPSS was employed to categorise wind speed on the Beaufort Scale, into the following three groups: WS-Cat 1, which includes forces ranging from 0 to 3 (inclusive), WS-Cat 2, corresponding to forces from 4 to 7 (inclusive), and WS-Cat 3, designated for forces between 8 and 12 (inclusive). Essentially, these categories correspond to light breezes, strong breezes, and gale forces, respectively. The frequency of occurrence, expressed as a percentage, was calculated using the Crosstabs function in SPSS. The findings are shown in Table 1. Light winds (51.8%) are the most prevalent, followed by strong winds (44.1%) and gale forces (4.1%). The WNW is notably prominent across all three categories, whereas gale force winds are the least frequently observed from the N and S.

Table 1.
Frequency of occurrence (in percent) of the Beaufort Scale wind forces (categorised into three categories, namely, WS-Cat 1, WS-Cat 2, and WS-Cat 3), for each of the 16 cardinal (compass) wind directions, for the period 2011–2023.
The average concentrations of NOx in relation to wind direction, categorised in terms of the wind speed on the Beaufort Scale (using three broad categories), were computed using SPSS. The Select Cases function was employed to isolate the wind speed data relevant to the first category. Subsequently, the average NOx concentrations were determined using the Mean function, treating the nitrogen compounds as dependent variables (separately) and the wind direction as the independent variable. This process was replicated for the other two wind speed categories. Following processing in this manner, the data were exported to Excel, and organised separately for each of the nitrogen compounds to facilitate the plotting of graphs shown in Figure 4, Figure 5 and Figure 6.
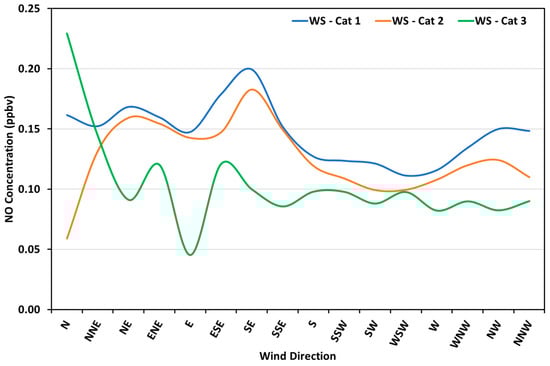
Figure 4.
Average nitric oxide concentration in relation to wind direction, categorised by the Beaufort Scale, for the period 2012–2023.
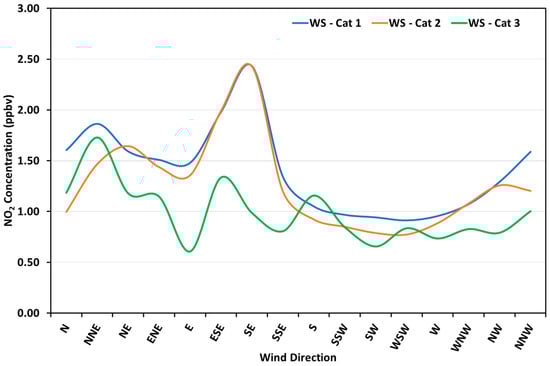
Figure 5.
Average nitrogen dioxide concentration in relation to wind direction, categorised by the Beaufort Scale, for the period 2012–2023.
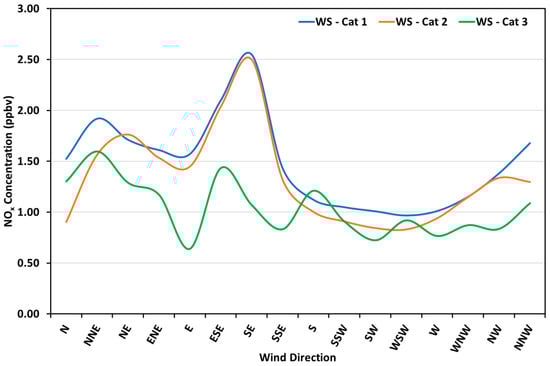
Figure 6.
Average oxides of nitrogen concentration in relation to wind direction, categorised by the Beaufort Scale, for the period 2012–2023.
The plots indicate that the NO concentration is inversely correlated with that of NO2 in the case of winds from the N. The nitrogen compounds exhibit a similar pattern for wind speed categories, WS-Cat 1 and WS-Cat 2. However, they display a distinct profile for category, WS-Cat 3. At gale force winds, the nitrogen compounds show a minimum concentration when the wind blew from the E and a maximum concentration when the prevailing wind originated from the N; the latter attributed to the influence of transboundary pollution from Central Europe. In the cases of low and strong breeze categories, the nitrogen compounds reveal a notable maximum in the case of the S–E sector and a broad minimum for the S–W sector.
3.5. Seasonal Variabilities
Seasonal trends of the nitrogen compounds under consideration are the main topic of discussion in this sub-section. The seasonal average concentrations of the oxides of nitrogen were calculated based on hourly measurements. The Recode function in SPSS was employed to accurately assign the correct season for each day throughout the year. For the purpose of this analysis, the seasons were defined as follows: spring, from 21 March to 20 June, summer, from 21 June to 20 September, autumn, from 21 September to 20 December, and winter, from 21 December to 20 March. In this manner, the dates of the calendar seasons correspond with the astronomical seasons.
The seasonal average concentration for each of the nitrogen compounds is shown in Figure 7. It is evident that a clear seasonal cycle exists for the nitrogen compounds, with maximum concentrations recorded in spring and gradually decreasing in the subsequent seasons to reach the minimum in winter. The NOx maximum in the spring season correlates with the ozone maximum at the same monitoring site [29]. Although the nitrogen compounds under consideration are mainly derived from anthropogenic activities, the NOx spring maximum in the Central Mediterranean is mainly associated with the planetary boundary layer (PBL) and transboundary pollution.
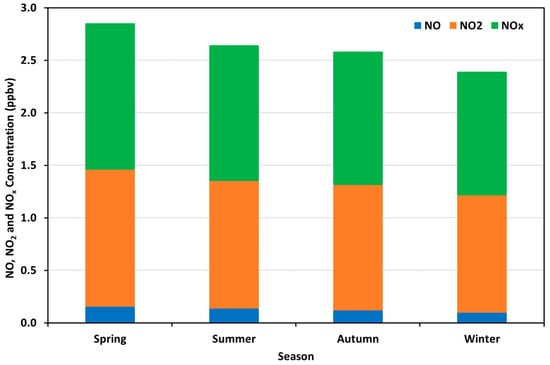
Figure 7.
Average seasonal variability in nitric oxide, nitrogen dioxide, and oxides of nitrogen concentrations, for the period 2011–2023.
The PBL plays an important role in the Earth’s climate system as it controls the transfer of heat, momentum, moisture, and chemical constituents across the Earth’s surface [30]. The height of the PBL exhibits seasonal changes within the range 120 m to 2 km [31]. The structure of the PBL can be complex, influenced by local terrain and land surface features, and varies substantially diurnally and as a function of weather conditions [32]. The Mediterranean region is characterised by complex orography that significantly influences atmospheric dynamics across various scales, resulting in a highly intricate PBL in the coastal regions [33]. To date, no study has reported on the dynamics of the PBL in the vicinity of the GLGO, which is located on a hill at an altitude of 163 m above mean sea level. It is probable that during the winter months, the top level of the PBL is situated just below the monitoring station, as the PBL tends to contract and become shallower in cooler conditions. Conversely, in spring, with the onset of higher temperatures, the height of the PBL increases due to rising thermals from the ground surface, facilitating pollutant transport to the monitoring site. In the summer and autumn, the surface temperature reaches its peak, leading to strong vertical mixing within the PBL, which dilutes the concentrations of the primary pollutants that are confined within it. To evaluate this hypothesis, in the near future, the authors plan to conduct a high-resolution model analysis using the Weather Research and Forecasting (WRF) model to explore the seasonal characteristics of the PBL near the monitoring station.
The Mediterranean region has emerged as a prominent hotspot with regard to climate change [34]. Modelling studies further suggest that air pollutants generated by anthropogenic activities in Europe can be carried over considerable distances, affecting areas such as Africa, the Atlantic Ocean, and North America, particularly during the warmer months [35]. Recent improvements in air pollution monitoring and modelling techniques have shown that the Mediterranean region, particularly the regional background monitoring stations at Finokalia and the GLGO, are impacted by pollution originating from both Eastern and Western Europe [27].
It is worth noting that the percentage seasonal variability for NO, NO2, and NOx are 46%, 15%, and 17%, respectively. NO exhibits the greatest variability, being three times greater than that of NO2.
3.6. Seasonal Variabilities in Relation to Wind Direction Categorised by Season
The concentrations of NOx were examined in relation to wind direction, categorised by season. The Select Cases function was utilised to isolate the NOx data pertinent to each season. Subsequently, the average NOx concentrations were calculated using the Mean function, considering the nitrogen compounds as dependent variables (separately) and the wind direction as the independent variable. This procedure was repeated for each season. Once the data was processed, it was exported to Excel, where the data averages for the four seasons was arranged according to the nitrogen compounds to facilitate the plotting of graphs shown in Figure 8, Figure 9 and Figure 10.
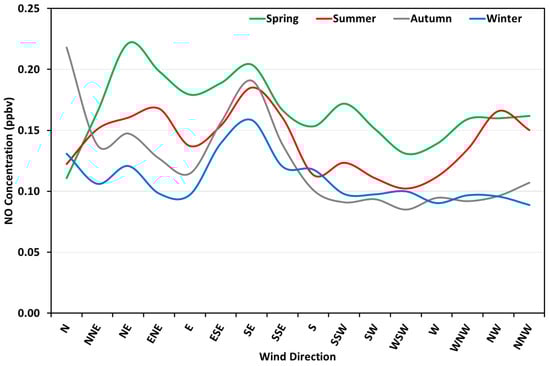
Figure 8.
Average seasonal variability in nitric oxide concentration, for the period 2011–2023.
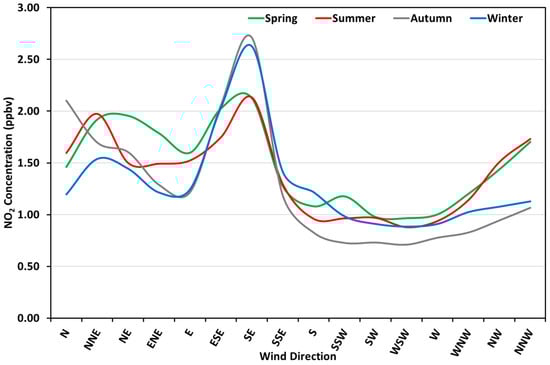
Figure 9.
Average seasonal variability in nitrogen dioxide concentration, for the period 2011–2023.
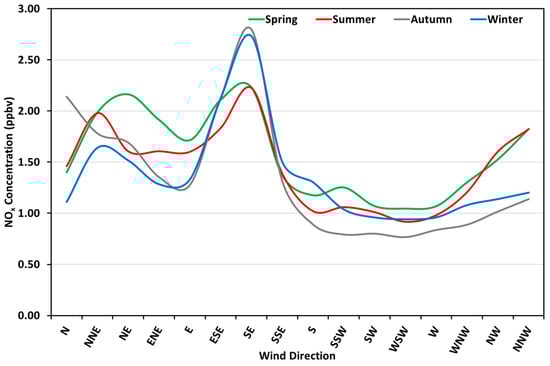
Figure 10.
Average seasonal variability in oxides of nitrogen concentration, for the period 2011–2023.
The concentration of NO during the spring and summer seasons was predominant for all wind sectors, with the exception of those cases when the wind originated from the N. In spring, the highest NO concentrations were recorded for winds from the NE, while a secondary peak can be noted in the case of SE winds. Conversely, the lowest NO levels during spring occurred when the wind originated from the N. In the case of the other three seasons, the peak NO concentration is associated with the SE, whereas a significant minimum occurred when the wind blew from the S–W sector.
NO2 and NOx concentrations exhibit a clear maximum when the wind originated from the SE throughout all the seasons. Nevertheless, during the autumn and winter months, these concentrations are more pronounced in comparison to spring and summer. Although spring is recognised as a period of high ozone levels in the Mediterranean, the quenching effect of ozone did not increase the concentrations of NO2 when the wind originated from the SE. In summer, the Maltese Islands experience a surge in tourism, but this does not lead to elevated NO2 concentrations. It was observed that the frequency percentage of SE wind occurrences for each season was as follows: 1.25% (spring), 0.84% (summer), 1.55% (autumn), and 0.85% (winter). Despite the fact that SE winds were more prevalent in summer than in winter, NOx concentrations were significantly higher in winter than in summer. Both pollutants demonstrate a broad minimum when the prevailing wind was from the S–W sector for all seasons.
A comparable study conducted in Lamezia Terme [13] indicates that the highest seasonal NOx concentrations are strongly associated with wind direction. In this region, NOx concentrations reach maximum values when the prevailing winds originate from the northeastern sectors during autumn and winter, whereas during summer, elevated NOx levels are primarily observed for westerly wind conditions. These findings suggest that the influence of wind direction on NOx concentration peaks is more pronounced during the autumn and winter.
The amplitudes of the nitrogen compounds were calculated for each season in relation to the wind direction. The results are shown in Table 2. Evidently, the nitrogen compounds have the largest amplitude in autumn. The smallest amplitude occurs in spring, except for NO, which has the smallest amplitude in summer. It was also determined that the amplitude of NOx in autumn is twice that of spring.
Table 2.
Seasonal amplitudes for nitric oxide, nitrogen dioxide, and oxides of nitrogen concentrations in relation to wind direction, for the period 2011–2023.
4. Conclusions
This case study discusses the wind and seasonal variability of the concentrations of oxides of nitrogen measured at the GLGO on the Island of Gozo (Maltese Archipelago). The measurements were made quasi-continuously from 4 January 2011 to 31 July 2023. Indeed, the dataset spans over 13 years and is most likely the longest of its kind in this region. The data analysis was performed using SPSS, and the plots and tables were created with Microsoft Excel.
The concentrations of the said oxides were examined in relation to wind direction, wind speed, and season. The analysis indicates that the nitrogen compounds exhibit a distinct peak when the prevailing wind originated from the SE. This phenomenon coincides with air parcels traversing over the Island of Malta, thereby transporting pollutants primarily from vehicular emissions towards the monitoring station. A secondary peak in concentrations is observed when the wind comes from the NE, which is linked to pollution that has originated from Sicily. The nitrogen compounds show a broad minimum for winds coming from the S–W sector. The average concentrations of NO, NO2, and NOx for the S–W sector were 0.11 ± 0.14 ppbv, 0.92 ± 0.86 ppbv, and 0.99 ± 0.92 ppbv, respectively. Indeed, these concentrations can be regarded as background values for the Maltese Islands, considering that the air parcels from these wind sectors are not influenced by nearby significant anthropogenic activities.
The concentrations were also examined for seasonal variations, keeping in mind wind direction. The concentrations of NO reached a peak in spring across all wind sectors, with the exception when the wind originated from the N. In contrast, both NO2 and NOx demonstrated a clear peak in autumn and winter when the dominant wind was from the SE. The nitrogen compounds exhibited their lowest levels for winds that originated from the S–W sector throughout all seasons.
Regarding wind speed (on the Beaufort Scale), it was established that concentrations reached their highest values during extreme high wind speed events. This occurrence is linked to transboundary pollution. Furthermore, a secondary broad peak was observed for wind forces between 2 and 4 on the Beaufort Scale. The lowest concentration was noted at wind force 9. The concentrations were further examined in relation to wind direction, categorised into three wind speed classes (using the Beaufort Scale). These categories essentially represent light breezes, strong breezes and gales, respectively. The investigation indicates that during gale force events, the nitrogen compounds exhibit minimum concentrations when the wind originated from the E and maximum concentrations from the N. For the light and strong breeze categories, the nitrogen compounds show maximum concentrations for SE winds and a broad minimum for the S–W sector. It is important to highlight that the light and strong breeze categories together account for 96% of all wind speed observations. Furthermore, this study indicates a significant seasonal variability, with the nitrogen compounds reaching their maximum levels in spring and their minimum levels in winter. This contrasts with findings at the Monte Cimone station, where NO and NO2 concentrations show minimum and maximum levels in summer and winter, respectively [36]. The spring maximum of NOx corresponds with the O3 maximum reported for the same area [29]. This phenomenon is thought to be related to the seasonal characteristics of the PBL or transboundary pollution. Indeed, the observed elevated NOx concentrations in spring at the monitoring station warrant further investigation through modelling analysis (e.g., using the WRF model) to ascertain the seasonal variability of the PBL height.
The amplitudes for NO, NO2, and NOx in relation to wind direction were 63%, 125%, and 121%, respectively, indicating strong variability. This phenomenon arises from increased concentrations when the wind originated from the SE. When both wind direction and seasonality were considered, significant variability was observed in autumn, which is associated with elevated concentrations from the SE. The overall seasonal amplitudes for NO, NO2, and NOx were 46%, 15%, and 17%, respectively. These results suggest that NO exhibits greater seasonal variability, while NO2 shows stronger variability with respect to wind direction.
The analysis of NOx concentrations at GLGO warrants further investigation. Future research will therefore focus on the characteristics and variabilities of oxidation (OX) levels, as sufficient scientific investigation in this respect is lacking for the Maltese Archipelago.
Furthermore, and in conclusion, this case study can be seen as an open call for further similar work concerning the entire region and not just the Maltese Archipelago. Long-term background air quality datasets from multiple monitoring stations located in the Central Mediterranean are sorely needed for a proper comparative statistical analysis that may lead to robust, generic conclusions.
Author Contributions
Conceptualisation, M.S. and A.M.; methodology, M.S. and A.M.; software, M.S. and A.M.; validation, M.S. and A.M.; formal analysis, M.S. and A.M.; investigation, M.S. and A.M.; resources, M.S. and A.M.; data curation, M.S. and A.M.; writing—original draft preparation, M.S.; writing—review and editing, A.M.; visualisation, M.S. and A.M.; supervision, A.M.; project administration, A.M.; funding acquisition, M.S. and A.M. All authors have read and agreed to the published version of the manuscript.
Funding
All funding was provided by the University of Malta.
Data Availability Statement
The data are available for download from the EBAS database, which is located at https://ebas-data.nilu.no/ (accessed on 1 November 2024).
Acknowledgments
This research work was financed by the University of Malta. It forms an integral part of the research effort at the Geosciences Observatory (Gozo), under the auspices of the Department of Geosciences, Faculty of Science, University of Malta.
Conflicts of Interest
The authors declare no conflicts of interest.
References
- Boningari, T.; Smirniotis, P.G. Impact of nitrogen oxides on the environment and human health: Mn-based materials for the NOx abatement. Curr. Opin. Chem. Eng. 2016, 13, 133–141. [Google Scholar] [CrossRef]
- Houghton, J.T.; Ding, Y.; Griggs, D.J.; Noguer, M.; van der Linden, P.J.; Dai, X.; Maskell, K.; Johnson, C.A. Climate Change 2001: The Scientific Basis. In Contribution of Working Group I to the Third Assessment Report of the Intergovernmental Panel on Climate Change; Cambridge University Press: Cambridge, UK, 2001. [Google Scholar]
- Health Effects Institute. State of Global Air 2024—Special Report; Health Effects Institute: Boston, MA, USA, 2024. [Google Scholar]
- European Environment Agency. Harm to Human Health from Air Pollution in Europe: Burden of Disease Status, 2024; European Environment Agency Briefing Number 21/2024; Publications Office of the European Union: Luxembourg, 2024. [Google Scholar]
- European Union. Directive 2010/75/EU of the European Parliament and of the Council of 24 November 2010 on Industrial Emissions (Integrated Pollution Prevention and Control); European Union: Bruxelles, Belgium, 2010. [Google Scholar]
- European Union. Directive (EU) 2015/2193 of the European Parliament and of the Council of 25 November 2015 on the Limitation of Emissions of Certain Pollutants into the air from Medium Combustion Plants; European Union: Bruxelles, Belgium, 2015. [Google Scholar]
- European Union. Regulation (EC) Number 715/2009 of the European Parliament and of the Council of 13 July 2009 on Conditions for Access to the Natural Gas Transmission Networks and Repealing Regulation (EC) Number 1775/2005; European Union: Bruxelles, Belgium, 2009. [Google Scholar]
- European Environment Agency. Europe’s Air Quality Status 2022; EEA Briefing Number 4/2022; Publications Office of the European Union: Luxembourg, 2022. [Google Scholar]
- Jalkanen, J.P.; Johansson, L.; Kukkonen, J.A. Comprehensive inventory of ship traffic exhaust emissions in the European Sea Areas in 2011. Atmos. Chem. Phys. 2016, 16, 71–84. [Google Scholar] [CrossRef]
- International Maritime Organisation. Resolution MEPC.361(79) (Adopted on 16 December 2022); Amendments to the Annex of the Protocol of 1997 to Amend the International Convention for the Prevention of Pollution from Ships, 1973, as Modified by the Protocol of 1978 Relating Thereto, Mediterranean Sea Emission Control Area for Sulphur Oxides and Particulate Matter; International Maritime Organisation: London, UK, 2022. [Google Scholar]
- Notario, A.; Bravo, I.; Adame, J.A.; Díaz-de-Mera, Y.; Aranda, A.; Rodríguez, A.; Rodríguez, D. Analysis of NO, NO2, NOx, O3 and Oxidant (OX = O3 + NO2) levels measured in a metropolitan area in the Southwest of Iberian Peninsula. Atmos. Res. 2012, 104–105, 217–226. [Google Scholar] [CrossRef]
- Cyrys, J.; Eeftens, M.; Heinrich, J.; Ampe, C.; Armengaud, A.; Beelen, R.; Bellander, T.; Beregszaszi, T.; Birk, M.; Cesaroni, G.; et al. Variation of NO2 and NOx concentrations between and within 36 European study areas: Results from the ESCAPE study. Atmos. Environ. 2012, 62, 374–390. [Google Scholar] [CrossRef]
- D’Amico, F.; Lo Feudo, T.; Ammoscato, I.; De Benedetto, G.; Sinopoli, S.; Malacaria, L.; Busetto, M.; Putero, D.; Calidonna, C.R. Analysis of nitric oxide and nitrogen dioxide variability at a Central Mediterranean WMO/GAW station. Nitrogen 2025, 6, 84. [Google Scholar] [CrossRef]
- Saliba, M.; Micallef, A. Analysis and observations concerning concentrations of nitrogen oxides at the Giordan Lighthouse Atmospheric Observatory, Gozo (Maltese Islands). Sci 2025, 7, 34. [Google Scholar] [CrossRef]
- D’Amico, S.; Micallef, A.; Gauci, A.; Deidun, A.; Colica, E.; Agius, M.; Galea, A.; Saliba, M.; Caruana, R.; Grima, M.; et al. Science meets cultural heritage at the Giordan Lighthouse, Gozo: Interweaving science and history, for the citizen. In Proceedings of the 2024 IEEE International Conference on Metrology for Archaeology and Cultural Heritage (MetroArchaeo2024), Valletta, Malta, 7–9 October 2024. [Google Scholar]
- Ellul, R.; Saliba, M. The University of Malta Giordan Lighthouse—Background trace gas monitoring station on Gozo. Gozo Obs. 2005, 13, 14–23. [Google Scholar]
- Ciarlo’, J.; Vella, R.; Saliba, M.; Ellul, R.; Micallef, A.; Coppola, E.; Micallef, A.; Mifsud, D. Insights into climate variability of the meteorological records from a background monitoring station: The Giordan Lighthouse, Gozo. Open Res. Eur. 2025, 5, 37. [Google Scholar] [CrossRef]
- Drobinski, P.; Bastin, S.; Arsouze, T.; Béranger, K.; Flaounas, E.; Stéfanon, M. North-Western Mediterranean sea-breeze circulation in a regional climate system model. Clim. Dyn. 2018, 51, 1077–1093. [Google Scholar] [CrossRef]
- Cowan, N.; Twigg, M.M.; Leeson, S.R.; Jones, M.R.; Harvey, D.; Simmons, I.; Coyle, M.; Kentisbeer, J.; Walker, H.; Braban, C.F. Assessing the bias of molybdenum catalytic conversion in the measurement of NO2 in rural air quality networks. Atmos. Environ. 2024, 322, 120375. [Google Scholar] [CrossRef]
- Jahan, S.; Cauchi, J.P.; Galdies, C.; England, K.; Wraith, D. The adverse effect of ambient temperature on respiratory deaths in a high population density area: The case of Malta. Respir. Res. 2022, 23, 299. [Google Scholar] [CrossRef]
- National Statistics Office. Motor Vehicles: Q1/2025; NR 079/2025; National Statistics Office: Valletta, Malta, 5 May 2025. [Google Scholar]
- National Statistics Office. Transport Statistics 2023 (Reference Year 2022); National Statistics Office: Valletta, Malta, 12 March 2024. [Google Scholar]
- Saliba, M.; Azzopardi, F.; Muscat, R.; Grima, M.; Smyth, A.; Jalkanen, J.-P.; Johansson, L.; Deidun, A.; Gauci, A.; Galdies, C.; et al. Trends in vessel atmospheric emissions in the Central Mediterranean over the last 10 years and during the COVID-19 outbreak. J. Mar. Sci. Eng. 2021, 9, 762. [Google Scholar] [CrossRef]
- Mavroidis, I.; Ilia, M. Trends of NOx, NO2 and O3 concentrations at three different types of air quality monitoring stations in Athens, Greece. Atmos. Environ. 2012, 63, 135–147. [Google Scholar] [CrossRef]
- Ribas, À.; Peñuelas, J. Temporal patterns of surface ozone levels in different habitats of the North Western Mediterranean Basin. Atmos. Environ. 2004, 38, 985–992. [Google Scholar] [CrossRef]
- Vivanco, M.G.; Palomino, I.; Garrido, J.L.; González, M.Á.; Alonso, G.; Martín, F. Impact of the transboundary transport of air pollutants on air quality in Spain. J. Environ. Prot. 2012, 3, 1167–1175. [Google Scholar] [CrossRef]
- Lelieveld, J.; Berresheim, H.; Borrmann, S.; Crutzen, P.J.; Dentener, F.J.; Fischer, H.; Feichter, J.; Flatau, P.J.; Heland, J.; Holzinger, R.; et al. Global air pollution crossroads over the Mediterranean. Science 2002, 298, 794–799. [Google Scholar] [CrossRef]
- Dayan, U.; Ricaud, P.; Zbinden, R.; Dulac, F. Atmospheric pollution over the eastern Mediterranean during Summer—A review. Atmos. Chem. Phys. 2017, 17, 13233–13263. [Google Scholar] [CrossRef]
- Saliba, M.; Ellul, R.; Camilleri, L.; Güsten, H. A 10-year study of background surface ozone concentrations on the Island of Gozo in the Central Mediterranean. J. Atmos. Chem. 2008, 60, 117–135. [Google Scholar] [CrossRef]
- Chan, K.M.; Wood, R. The seasonal cycle of planetary boundary layer depth determined using COSMIC radio occultation data. J. Geophys. Res. 2013, 118, 12422–12434. [Google Scholar] [CrossRef]
- Li, Y.; Li, J.; Zhao, Y.; Lei, M.; Zhao, Y.; Jian, B.; Zhang, M.; Huang, J. Long-term variation of boundary layer height and possible contribution factors: A global analysis. Sci. Total Environ. 2021, 796, 148950. [Google Scholar] [CrossRef] [PubMed]
- Zhang, Y.; Seidel, D.J.; Zhang, S. Trends in planetary boundary layer height over Europe. J. Clim. 2013, 26, 10071–10076. [Google Scholar] [CrossRef]
- Pace, G.; Junkermann, W.; Vitali, L.; Di Sarra, A.; Meloni, D.; Cacciani, M.; Cremona, G.; Iannarelli, A.M.; Zanini, G. On the complexity of the boundary layer structure and aerosol vertical distribution in the coastal Mediterranean regions: A case study. Tellus B 2015, 67, 27721. [Google Scholar] [CrossRef]
- Giorgi, F. Climate change hot-spots. Geophys. Res. Lett. 2006, 33, L08707. [Google Scholar] [CrossRef]
- Kallos, G.; Astitha, M.; Katsafados, P.; Spyrou, C. Long-range transport of anthropogenically and naturally produced particulate matter in the Mediterranean and North Atlantic: Current state of knowledge. J. Appl. Meteorol. Climatol. 2007, 46, 1230–1251. [Google Scholar] [CrossRef]
- Cristofanelli, P.; Gutiérrez, I.; Adame, J.A.; Bonasoni, P.; Busetto, M.; Calzolari, F.; Putero, D.; Roccato, F. Interannual and seasonal variability of NOx observed at the Mt. Cimone GAW/WMO global station (2165 m a.s.l., Italy). Atmos. Environ. 2021, 249, 118245. [Google Scholar] [CrossRef]
Disclaimer/Publisher’s Note: The statements, opinions and data contained in all publications are solely those of the individual author(s) and contributor(s) and not of MDPI and/or the editor(s). MDPI and/or the editor(s) disclaim responsibility for any injury to people or property resulting from any ideas, methods, instructions or products referred to in the content. |
© 2025 by the authors. Licensee MDPI, Basel, Switzerland. This article is an open access article distributed under the terms and conditions of the Creative Commons Attribution (CC BY) license (https://creativecommons.org/licenses/by/4.0/).