Abstract
The increasing demand for industrial resource optimization has driven the creation of integrated methodologies for the technical assessment of complex operations such as gas oil hydrocracking. This study examines the technical performance of a mass and energy-integrated gas oil hydrocracking process using the Extended Water–Energy–Product (E-WEP) methodology, which enables the quantification of 12 key indicators related to water, energy, and raw material usage. The research addresses the challenge of high demineralized water consumption in conventional hydrocracking processes. The findings show a production yield of 95.77% and a recycled hydrogen reuse rate of 67.99%, expressed as the Index of Reused Unconverted Material (IRUM). In terms of water use, fresh water demand decreased to 26.99 m3/h and wastewater discharge to 21 m3/h, although 77.79% of the total water processed is released as effluent, corresponding to the Wastewater Production Ratio (WPR). From the energy standpoint, total energy consumption increased to 2966.57 MMBTU/h, primarily due to the use of additional electrical equipment for mass integration. The Total Cost of Energy (TCE) reached 3,563,840.10 USD/day, with electricity (1630.82 kWh/t) as the dominant source, negatively influencing the process’s economic efficiency. Despite this energy drawback, the evaluated configuration achieves the most sustainable water use compared to conventional and integrated PVC production schemes, underscoring the importance of adopting holistic evaluations that jointly address technical efficiency, environmental impact, and economic feasibility.
1. Introduction
The global economy is highly dependent on petroleum-derived fuels, which, despite their economic importance, are limited, environmentally harmful, and potentially unstable resources []. In the petroleum industry, gas oil hydrocracking is an essential process that converts heavy hydrocarbons into more valuable products []. This technique offers more advantages over other fuel production methods, such as transesterification and pyrolysis, because it produces higher-quality and more valuable products with higher yields [], thus increasing the demand for middle distillates such as kerosene and diesel, the main products of this process []. For this reason, in recent years, the gas oil hydrocracking process has received increasing attention from the petroleum refining industries [].
The conventional hydrocracking process is a combination of desulfurization and cracking operations [] with the capacity to convert heavy and/or rich in sulfur and aromatics feedstocks into high-quality middle distillate products, i.e., with low sulfur and aromatics content, and with excellent combustion properties []. The main objective of the process is to convert long and heavy carbon chains, such as gas oils (Medium Vacuum Gas Oil–MVGO, Heavy Gas Oil–HKGO, and Light Cycle Oil–LCO) into components with high commercial value, such as Liquefied Petroleum Gas (LPG), Heavy and Light Naphtha, Kerosene, and Diesel []. Hydrocracking is a process by which heavy petroleum products are converted into lighter chemicals with lower boiling points in the presence of hydrogen and a suitable catalyst, such as metal-supported catalysts, bifunctional catalysts, and zeolites [].
However, this process requires large amounts of industrial resources, particularly water. For example, a conventional hydrocracking plant consumes 36.24 m3 per hour (26,092.8 m3/month) of demineralized water for washing, stripping, and fractionation processes []. This value is considered high and contributes to both the scarcity of drinking water in surrounding residential areas and the unsustainable use of water resources []. To illustrate, Resolution 750 of 2016 of the Commission for the Regulation of Drinking Water and Basic Sanitation (CRA) establishes that the basic subsistence consumption per subscriber for warm municipalities in Colombia is 16 m3 per month []. This implies that the water requirement in a conventional gas oil hydrocracking plant could supply approximately 1631 homes in rural areas. This scenario highlights the urgent need to develop methodologies for assessing sustainability and optimizing gas oil hydrocracking processes using computational tools in process engineering.
Several studies have addressed water and energy optimization in industrial processes. For instance, Mughees and Al-Ahmad (2015) applied pinch technology to a refinery consuming 505 m3/h of water, achieving significant reductions in consumption and wastewater generation []. More recently, González-Delgado et al. (2023) studied the industrial-scale production of bioadsorbents from chitosan modified with iron nanoparticles and functionalized with thiourea as a chelating agent, where it was concluded that mass integration managed to reduce up to 51% of the fresh water used in the processes []. While these advances are promising, there is still limited research on the technical implications of integrating mass and energy optimization into hydrocracking processes. It is therefore essential to assess not only the potential resource savings but also the overall technical performance compared to conventional configurations.
In this regard, the present study aims to conduct a technical evaluation of a mass and energy-integrated gas oil hydrocracking process to determine the technical benefits of the optimization. For this purpose, the E-WEP (Extended Water-Energy-Products) methodology was selected, proposed by García-Maza and González-Delgado (2024), recognized as a novel method to develop technical evaluations adapted to the gas oil hydrocracking process, in which 12 technical indicators are calculated that determine the process performance related to the use of water and energy, and the products []. This approach is based on the WEP (Water-Energy-Product) methodology, proposed by Aguilar-Vásquez et al. (2023) for a PVC suspension production process, where it was shown that, although the PVC production process reaches a 99% yield, it has a high wastewater production (80%) and high energy consumption (4682 MJ/t of PVC), concluding that the application of process optimization techniques such as mass integration of water effluents and energy integration of process streams is required [].
Finally, there is a significant knowledge gap regarding the implementation of this methodology in mass and energy-integrated gas oil hydrocracking processes. Since this approach represents a novel framework, the existing literature lacks detailed documentation or case studies describing the behavior and evaluation of each specific technical indicator for this type of process. In fact, Table 1 presents various processes from the refining and petrochemical sectors, demonstrating that, while integrated processes exist in terms of mass and energy, only the present study includes technical analysis using the E-WEP methodology, marked by an X. Therefore, further research and application are required to validate and expand the understanding of how these indicators work in these integrated systems.

Table 1.
Comparison of studies based on mass and energy integration and technical analysis using E-WEP methodology for processes in refining and petrochemical processes.
2. Materials and Methods
2.1. Process Description
The mass and energy-integrated gas oil hydrocracking process begins with the preheating and heating of 1,937,245.28 t/yr of feed gas oil (stream 1) to 385 K and 3 bar. The gas oil first passes through a series of heat exchangers integrated into the preheating system before entering a heater (stream 13). It then flows to the first hydrocracker (stream 14) at 652 K and 164 bar, where it reacts with recycled hydrogen (stream 15) introduced at 339 K and 167 bar. Simultaneously, unconverted oil (UCO), a byproduct of the process, is removed from the bottom of the fractionator. A portion of this UCO is sent to the fluidized catalytic cracking (FCC) unit (stream 120), while the remainder is recirculated (stream 21) within the system, conditioned in an air cooler, and enters the second hydrocracker (stream 22) at 655 K and 154 bar, where it reacts with two recycle hydrogen streams (streams 23 and 24) at 167 bar, one at 339 K and the other at 391 K. Finally, the outlet streams from both reactors are combined (stream 31), forming a mixture at 566 K and 146 bar, which then enters the hot separator (stream 33) []. Figure 1 shows the process flow diagram for the reaction stage of the integrated mass and energy gas oil hydrocracking process, which was extracted from the simulation.
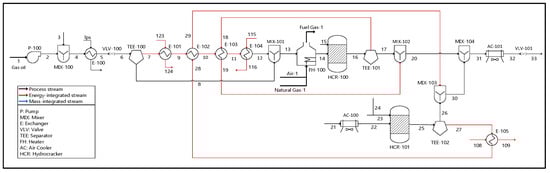
Figure 1.
Process flow diagram of the reaction stage of the mass and energy-integrated gas oil hydrocracking process.
In this context, within hydrocracking units, hydrotreating reactions are typically the first to occur and are generally carried out at a faster rate than hydrocracking reactions []. Hydrotreating primarily focuses on the removal of compounds such as sulfur and nitrogen, as well as the saturation of olefins. Secondarily, it also removes oxygen, metals, halogens such as chlorine and bromine, and other non-metallic elements, and saturates aromatic compounds []. In contrast, hydrocracking is characterized by the fragmentation of large molecules—similar to fluidized catalytic cracking (FCC)—along with the addition of hydrogen. Its main reactions include the cleavage of aromatic, naphthenic, and paraffinic structures [].
The process involves several separation stages. Initially, the stream is divided into high-pressure (top) and low-pressure (bottom) sections in a hot separator (flash evaporator). The high-pressure stream (stream 34) is cooled through an energy-integrated heat exchanger, washed with water (stream 39) at 316 K and 145 bar from the makeup and recycle water section, passes through an air cooler, and then enters (stream 41) a cold separator (three-phase separator). In the cold separator, the stream is separated into a gas phase and two liquid phases: light and heavy. The gas phase (stream 42) is further cooled in a heat exchanger before entering (stream 45) a recycled gas separator drum (flash evaporator), where it is divided into upper (stream 46) and lower (stream 47) streams []. Figure 2 shows the process flow diagram for the preliminary separation stage of the mass and energy-integrated gas oil hydrocracking process, which was extracted from the simulation.
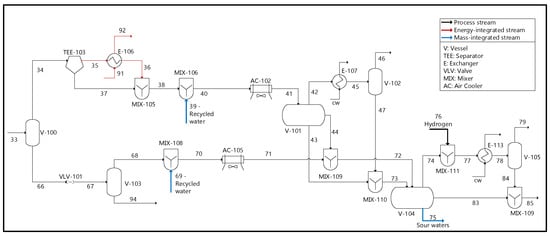
Figure 2.
Process flow diagram of the preliminary separation stage of the mass and energy-integrated gas oil hydrocracking process.
The hydrogen-rich overhead stream (stream 46) is scrubbed in an absorption tower using lean amine (stream 48) at 322 K and 145 bar to remove contaminants such as hydrogen sulfide and ammonia, generating a rich amine (stream 49) that is sent to the amine regeneration unit. Meanwhile, the underflow stream from the recycle gas separator (stream 47) is combined with the heavy liquid phase from the cold separator (stream 43) and moved to a cold flash drum (three-phase separator) for further separation (stream 73). At the same time, the low-pressure stream from the hot separator (stream 66) flows to a hot flash drum, separating into overflow (stream 68) and underflow (stream 94) streams. The overhead stream (stream 68) is washed with water (stream 69) at 316 K and 145 bar from the makeup and recycle water section, cooled by an air cooler, and mixed with the light liquid phase from the cold separator (stream 44) before entering the cold flash drum (stream 72), where it separates into a gas phase and two liquid phases (heavy and light). The underflow from the hot flash drum (stream 94) is directed through a valve to the stripping tower for further treatment [].
The gas phase from the cold flash drum (stream 74) is mixed with a hydrogen-rich stream (stream 76) at 327 K and 24 bar, cooled in a heat exchanger, and directed to a residual gas separator drum (stream 78), where it is split into two streams. The overhead stream (stream 79), with its high hydrogen content, is sent to a residual gas scrubber for the removal of contaminants such as hydrogen sulfide and ammonia using lean amine (stream 80) at 322 K and 25 bar, and the resulting rich amine (stream 81) is processed in the amine regeneration unit. The purified hydrogen stream (stream 82) then moves to the pressure swing adsorption (PSA) unit, where remaining impurities are removed, producing high-purity hydrogen, which is blended with streams from the hydrogen makeup and recycle sections, producing a hydrogen byproduct at 337 K and 24 bar. The make-up hydrogen (stream 54) is processed using compressors, air coolers, and heat exchangers at 298 K and 20 bar and blended with treated recycled hydrogen (stream 53) for use in an energy integration system before entering the reaction stage [].
At the same time, the underflow from the residual gas separator (stream 84) merges with the light liquid phase from the cold flash drum (stream 83), is used in an energy-integrated heat exchanger system, and flows to the stripping tower (stream 92). The heavy liquid phase from the cold flash drum (stream 75) represents a portion of the sour waters directed to the makeup and recycle water section []. Figure 3 shows the process flow diagram for the makeup and recycle hydrogen stage, absorption towers, and PSA of the mass and energy-integrated gas oil hydrocracking process, which was extracted from the simulation.
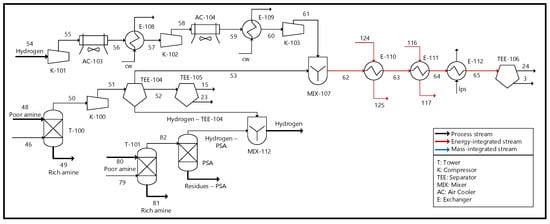
Figure 3.
Process flow diagram of the make-up and recycled hydrogen stage, absorption towers, and PSA of the mass and energy-integrated gas oil hydrocracking process.
Next, in the stripping stage, two streams (one at 514 K and 24 bar, and the other at 570 K and 9 bar) are introduced (streams 93 and 95) into a distillation column along with medium-pressure vapor (stream 96) at 462 K and 10 bar. Here, lighter components such as liquefied petroleum gas (LPG), light naphtha, and some heavy naphtha are separated at the top (stream 99), while heavier fractions such as the remaining heavy naphtha, kerosene, diesel, and UCO exit at the bottom (stream 107). The top stream (stream 99) is pumped, heated in a heat exchanger, and sent to the debutanizer (stream 102), while the bottom stream is pumped, preheated in a heat-integrating heat exchanger, heated in a heater, and transferred to the fractionation tower (stream 111). Waste emissions, including sour waters (stream 97) and sour gases (stream 98), are generated in the stripper top drum, where the sour waters are directed to the makeup and recycle water section. In the debutanization stage, the stream from the top of the stripper enters (stream 102) at 407 K and 11 bar, separating the LPG at the top (stream 105) from the light naphtha and some of the heavy naphtha at the bottom (stream 146). This results in an LPG product stream (stream 106) of 33,099.37 t/yr at 316 K and 10 bar, along with sour waters (stream 103) and sour gases (stream 104) emitted from the top drum, where the sour waters are directed to the makeup and recycle water section []. Figure 4 shows the process flow diagram of the stripping and debutanization stage of the mass and energy-integrated gas oil hydrocracking process, which was extracted from the simulation.
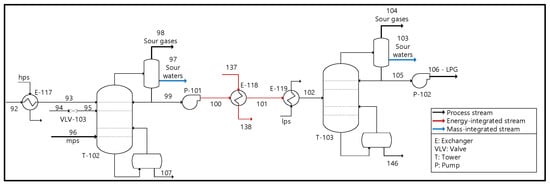
Figure 4.
Process flow diagram of the stripping and debutanization stage of the mass and energy-integrated gas oil hydrocracking process.
Now, the fractionation stage comprises three distillation columns in series. The process begins with an inlet stream (stream 111) at 652 K and 1 bar entering the first column, along with a low-pressure vapor stream (stream 112) at 440 K and 4 bar. Here, diesel, kerosene, and a portion of the heavy naphtha are separated at the top (stream 121), while the UCO exits at the bottom (stream 113). After pumping, 4.7% of the UCO (79,837.69 t/yr) is sent to the FCC (stream 120) at 729 K and 155 bar, while the remainder (1,623,969.44 t/yr) is conditioned in an air cooler and recycled to the reaction stage (stream 21). In the second column, an inlet stream (stream 121) at 555 K and 0.34 bar separates the kerosene and some of the heavy naphtha at the top (stream 130), and the diesel exits at the bottom (stream 122). This diesel stream, cooled and processed through a system of energy-integrated heat exchangers and an air cooler, produces a product (stream 129) of 933,685.06 t/yr at 316 K and 1 bar [].
The third column processes an inlet stream (stream 130) at 463 K and 0.76 bar, separating heavy naphtha at the top (stream 144) and kerosene at the bottom (stream 131), producing 530,346.69 t/yr of kerosene (stream 140) at 316 K and 1 bar after a system of energy-integrated heat exchangers and an air cooler. Secondary emissions, including recycled water (stream 142) and small amounts of fuel gas, considered a byproduct (stream 143), are released from the fractionator top drum, where the recycled water is directed to the makeup and recycle water section. The heavy naphtha from the top drum is pumped (stream 145) and combined with the debutanizer bottom stream (stream 146), rich in light and heavy naphtha, before entering the naphtha stripper tower (stream 148) []. Figure 5 shows the process flow diagram of the fractionation stage in the mass and energy-integrated gas oil hydrocracking process, as extracted from the simulation.
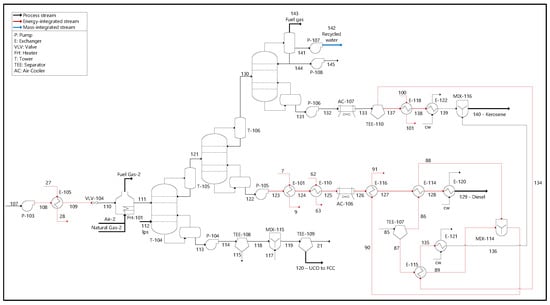
Figure 5.
Process flow diagram of the fractionation stage of the mass and energy-integrated gas oil hydrocracking process.
The process then moves to the naphtha separation stage, where the incoming stream (stream 148) enters at 371 K and 1 bar. In this stage, light naphtha is separated from heavy naphtha, with light naphtha at the top (stream 151) and heavy naphtha at the bottom (stream 153). Secondary emissions, such as recycled water (stream 150), are produced in the top drum of the naphtha separator and are directed to the makeup and recycle water section. The light naphtha-rich stream exits the top drum and is pumped out, resulting in a product stream (stream 152) of 85,845.64 t/yr at 311 K and 10 bar. Meanwhile, the underflow is pumped, cooled using an air cooler and heat exchanger, and produces a heavy naphtha product stream (stream 156) of 272,374.36 t/yr at 316 K and 9 bar []. The process flow diagram for the naphtha separation stage of the mass and energy-integrated gas oil hydrocracking process, which was extracted from the simulation, is shown in Figure 6.
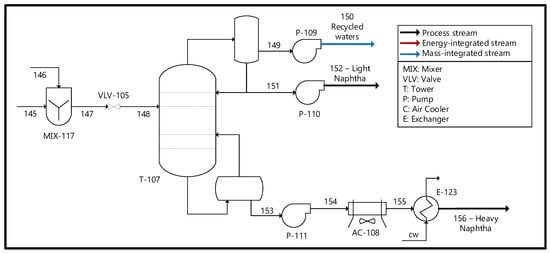
Figure 6.
Process flow diagram of the naphtha separation stage of the mass and energy-integrated gas oil hydrocracking process.
Finally, the makeup and recycling water section identifies the mass integration with direct recycling of wastewater and process recycling effluents []. The wastewater comes from the cold flash evaporation drum (stream 75), the stripping column (stream 87), and the debutanizing tower (stream 103), while the recycled water comes from the fractionation column system (stream 142) and the naphtha separation tower (stream 150). This section identifies the amount of freshwater (166,734.68 t/year) required by the process (streams 162 and 163), as well as the amount of wastewater (239,097.51 t/year) generated (stream 157), which contains ammonia (NH3) and hydrogen sulfide (H2S) as impurities. In addition, separators and mixers are used to achieve, through direct recycling, the minimum contaminant load (NH3 and H2S) allowed in the wash water. Pumps and air coolers are used to condition the two water streams before re-entering the process in the washing stages. Figure 7 shows the process flow diagram for the makeup and recycling water stage of the mass and energy-integrated gas oil hydrocracking process, which was extracted from the simulation. Additionally, after mass and energy integration, the process presents an energy consumption of 3129.95 GJ/h.
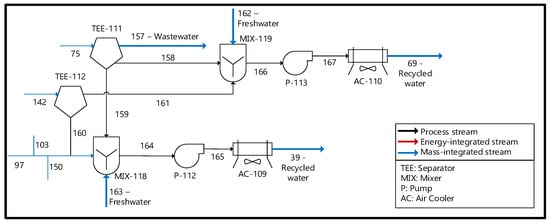
Figure 7.
Process flow diagram of the makeup and recycling water stage of the mass and energy-integrated gas oil hydrocracking process.
2.2. Technical Evaluation of the Mass and Energy-Integrated Gas Oil Hydrocracking Process Using the E-WEP (Extended Water-Energy-Product) Methodology
Figure 8 presents a flowchart of the E-WEP (Extended Water–Energy–Product) methodology, which was implemented to develop the technical evaluation of the mass and energy-integrated case of the gas oil hydrocracking process with the help of the Microsoft Excel office tool.
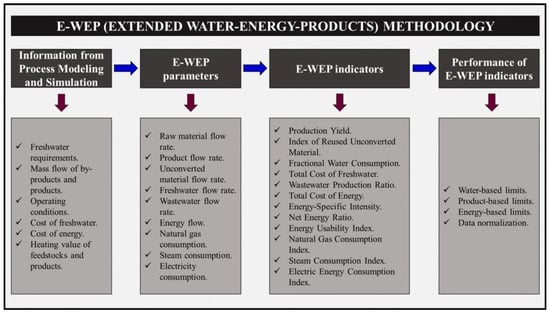
Figure 8.
Stages of the E-WEP methodology for the mass and energy-integrated gas oil hydrocracking process.
This methodology was initially proposed by García-Maza and González-Delgado (2024) to analyze a conventional gas oil hydrocracking process [], and is an adaptation of the WEP (Water-Energy-Product) methodology, developed by Aguilar-Vásquez et al. (2023), to analyze a PVC suspension production process []. The first stage of the E-WEP methodology for the technical evaluation of the mass and energy-integrated gas oil hydrocracking process is the robust modeling and simulation of the process using specialized software. This simulation is based on a preliminary material balance, preliminary information on water and energy consumption, and the properties of the chemical species involved in the process []. The simulation of the mass and energy-integrated gas oil hydrocracking process was performed using Aspen HYSYS® V14.0 software, and the validation was made with real plant data. This simulation resulted in detailed information on the feedstock and fresh water requirements, product and by-product mass flow rates, operating conditions (temperature and pressure), and the energy requirements of all plant streams and equipment; that is, the extended material and energy balances [].
Additionally, at this stage, economic information is required on the industrial services used, including the cost of fresh water and the cost of energy; in the first case, a cost of 1.2 USD/m3 was considered for fresh water, while in the second case, a cost of 0.41 USD/kWh was considered for electricity, 10 USD/MMBTU for natural gas and 6.15 USD/klb for steam []. In addition, the calorific value or higher heating value (HHV) of the raw material and products needs to be determined; In the first case, the HHV of gas oil is 18,495 BTU/lb, and in the second case, the HHV of LPG is 21,195 BTU/lb, the HHV of diesel is 19,604 BTU/lb, the HHV of kerosene is 19,862 BTU/lb, the HHV of light gasoline is 18,917 BTU/lb and the HHV of heavy gasoline is 17,971 BTU/lb [].
In the second stage, after collecting process information related to water, energy, and product use in the first stage, nine process parameters are calculated. For raw materials, the feed flow rate is considered; for products, the final product and unconverted material flow rates are evaluated; for water, the freshwater flow rate and the volume of wastewater generated are measured; and for energy, the total energy flow rate, natural gas consumption, steam consumption, and electricity consumption are taken into account. Based on these parameters, the third stage determines twelve technical indicators that allow diagnosis of the process’s performance. These indicators are described in Table 2. Of these, two are linked to the product (production efficiency and reuse rate of unconverted material), three to water use (fractional consumption, wastewater generation ratio, and total cost of freshwater), and the remaining seven to energy consumption (total energy cost, specific energy intensity, net energy balance, energy efficiency index, and natural gas, steam, and electricity consumption rates). It should be noted that the reuse rate of unconverted material was calculated using hydrogen as a reference, since it is recirculated in the process [].
Table 2.
Description of the technical indicators of the E-WEP methodology for the mass and energy-integrated gas oil hydrocracking process.
Thus, by applying the E-WEP methodology, these 12 indicators are quantified to evaluate the technical performance of the mass and energy-integrated gas oil hydrocracking process, which were calculated using Equations (1)–(12).
In the fourth stage, maximum and minimum technical limits were established for each indicator, considering the characteristics of the mass and energy-integrated gas oil hydrocracking process. Based on these limits, a percentage evaluation of the performance of each indicator was carried out. In this way, the technical indicators calculated in the third stage are compared to offer a first approximation of the process behavior against the defined goals, whose values are detailed in Table 3. The analysis is performed by normalizing the technical indicators using Equation (13) and reference values that represent the most favorable and least favorable scenarios, which are determined by simulations that model optimistic and pessimistic conditions. It should be noted that, due to the nature and method of calculating the NER and the EUI, these indicators do not have clear reference values to identify better or worse performance, so they cannot be normalized as a percentage and, consequently, were excluded from the efficiency analysis of the technical indicators [].
where is the value of indicator i, is the reference value for the pessimistic case and is the reference value for the optimistic case.
Table 3.
Upper and lower limits of the technical indicators of the E-WEP methodology for the mass and energy-integrated gas oil hydrocracking process.
3. Results and Discussion
3.1. E-WEP Technical Parameters and Indicators for the Mass and Energy-Integrated Gas Oil Hydrocracking Process
The E-WEP technical assessment was conducted to identify the resource management and efficiency of the mass and energy-integrated gas oil hydrocracking process to produce products. Table 4 shows the nine Water-Energy-Product parameters used for the technical analysis of the integrated process case.
Table 4.
E-WEP technical parameters for the mass and energy-integrated gas oil hydrocracking process.
According to the results obtained for the technical parameters, a key aspect to highlight is that, after the mass integration of the wastewater effluents, the gas oil hydrocracking process goes from a fresh water requirement of 36.24 m3/h [] to one of 26.99 m3/h, that is, almost 10 m3/h are being saved in the process and can be directed to the basic sanitation of the residential communities surrounding the industrial zone, generating a positive social impact while reducing the water footprint of the process. Additionally, a reduction in the volumetric flow of wastewater is highlighted, going from 28.13 m3/h [] to 21.00 m3/h, minimizing the environmental impact of the process due to sour waters with ammonia and hydrogen sulfide content, which present high levels of toxicity []. However, from the point of view of energy requirements, the total energy consumed increased from 2549.85 MMBTU/h [] to 2966.57 MMBTU/h, mainly due to an increase in the use of electricity; this increase is mainly due to the need to incorporate new equipment that requires electrical energy when developing mass integration systems. According to the above, the advantages and disadvantages of the mass and energy-integrated gas oil hydrocracking process are observed from a technical perspective, according to the use of industrial resources.
In this regard, the performance assessment of the mass and energy-integrated gas oil hydrocracking process was obtained based on the technical analysis related to the use of materials, products, water, and energy in the process, based on the technical parameters obtained. This was compared with the results obtained in similar processes in the petrochemical industry. Table 5 summarizes the E-WEP technical indicators obtained for the mass and energy-integrated gas oil hydrocracking process.
Table 5.
E-WEP technical indicators for the mass and energy-integrated gas oil hydrocracking process.
Based on the results obtained in Table 5, a comparative evaluation was established using the technical indicators in question between the mass and energy-integrated gas oil hydrocracking process and the conventional [] and mass and energy-integrated PVC suspension production processes []. This analysis reveals significant differences in production efficiency, water and raw material consumption, energy costs, and energy efficiency. To describe the use of raw materials and products, the Production Yield and the IRUM were considered. In this sense, the mass and energy-integrated gas oil hydrocracking process is characterized by a high Production Yield of 95.77%, being the lowest efficiency among the three industrial processes, with an acceptable IRUM of 67.99%, which was mainly applied to hydrogen, which is the secondary raw material of the process that is recycled.
On the other hand, regarding fresh water, which enters the process as demineralized water (for 1.2 USD/m3) only in the stages of makeup and recycling, stripping and fractionation, indicators were established to describe how the process uses this water resource, obtaining a low FWC (0.13 m3/t), along with a reduced TCF (777.28 USD/day) compared to the conventional and integrated PVC processes. Despite these benefits, the mass and energy-integrated gas oil hydrocracking process has a WPR of 77.79%, which is considered high; that is, of the 26.99 m3/h of demineralized water, 77.79% ends up as wastewater. This value is considered high compared to the result of WPR obtained for a PVC production process by suspension integrated in mass and energy (45%) [], which means that, although the amount of fresh water required and wastewater effluents have decreased, the relationship between the two has not increased.
Furthermore, the mass and energy-integrated gas oil hydrocracking process has an excessive TCE due to the increase in the implementation of electricity (in the equipment added for mass integration), reaching 3,563,840.10 USD/day, with ESI of 14,777.99 MJ/t of refined products, which is higher than the other two processes, indicating that the process studied has a higher energy demand to obtain refined products, which is not expected and is reflected in the unsatisfactory economic results in the energy approach. The NGCI is 84.25 m3/t of refined products, the SCI is 304.75 m3/t of refined products, and the EECI amounts to 1630.82 kWh/t of refined products, the latter being the highest value, indicating that in the mass and energy-integrated gas hydrocracking process, electricity is the main source of energy, negatively affecting the energy indicators and, therefore, the economic efficiency of the process, because electricity is more expensive (0.41 USD/kWh) compared to the other two energy sources (natural gas and steam). The NER is 0.76, and the EUI is 3.06, indicating moderate energy efficiency.
In contrast, the conventional suspension PVC production process shows a higher Production Yield (98.8%) and significantly higher IRUM (99%). However, the FWC (1.8 m3/t) and WPR (80%) are considerably higher. The ESI (4681.8 MJ/t) is much lower than in the case of gas oil hydrocracking, reflecting lower energy demand. Likewise, the NGCI (59.4 m3/t) and the EECI (1.01 kWh/t) are also lower. Furthermore, the TCF is USD 693,080/year (approximately USD 1898.85/day), which is higher than that of a mass and energy-integrated gas oil hydrocracking plant. Furthermore, the TCE is USD 13,552,846/year, with a NER of 0.7 and an EUI of 7.4, indicating greater efficiency in the use of available energy [].
The mass and energy-integrated suspension PVC process exhibits even higher Production Yield (99.8%) and an optimal IRUM (100%). The FWC (2.2 m3/t) is the highest among the three processes; however, the TCF is lower than a conventional PVC process (584,285 USD/year or 1600.78 USD/day), possibly due to recirculation strategies. The TCE is reduced to 12,707,134 USD/year compared to the conventional PVC production case, with the lowest ESI (3359 MJ/t) among the three processes, presenting the lowest NGCI (52.5 m3/t) and an EECI of 1.6 kWh/t. These values indicate an optimized process in terms of energy requirements. Additionally, an improvement in energy efficiency is observed with a NER of 0.9 and an EUI of 5.4, higher than that of the hydrocracking process, but lower than that of the conventional PVC process [].
To put it briefly, the comparison suggests that integrating mass and energy in industrial processes can improve certain indicators, such as yield and material reuse, while also reducing freshwater consumption. Specifically, the gas oil hydrocracking process, even with mass and energy integration, maintains high energy requirements, while PVC processes show better overall energy efficiency, especially when mass and energy integration strategies are implemented []. Despite this significant energy disadvantage, the mass and energy-integrated gas oil hydrocracking process represents the most sustainable use of water resources, demonstrating that sustainability is not limited solely to the energy aspect. This underlines the need to weigh both advantages and disadvantages, emphasizing a comprehensive evaluation where efficiency, costs, and environmental responsibility are jointly considered to foster truly sustainable industrial innovation.
3.2. Performance of the E-WEP Technical Indicators for the Mass and Energy-Integrated Gas Oil Hydrocracking Process
Figure 9 shows the performance of ten of the indicators evaluated for the mass and energy-integrated gas oil hydrocracking process in the best-worst case scenario.
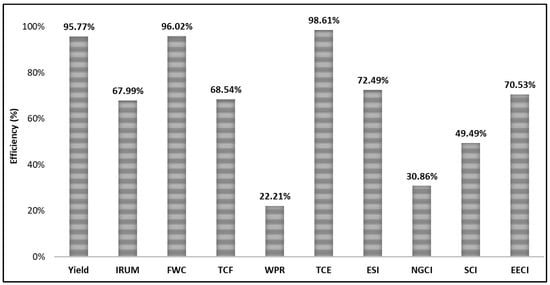
Figure 9.
Performance of ten of the E-WEP technical indicators for the mass and energy-integrated gas oil hydrocracking process.
This figure allows for a diagnosis of process performance in terms of mass and energy. Indicators associated with raw material management show excellent performance for Production Yield, above 95%, but moderately acceptable performance for IRUM, below 70%, which is related to the reuse of unreacted hydrogen. On the other hand, indicators associated with water management show excellent performance for FWC, greater than 96%; but deplorable performance for WPR, less than 25%, and moderately acceptable performance for TCF, less than 70%. The above indicates that, although the volumetric flows of fresh water and wastewater were reduced, the relationship between both flows is not favorable from a technical perspective, affecting the WPR indicator.
Energy-related indicators show that the process has advantages and disadvantages. The advantages focus on aspects such as the TCE, with an efficiency greater than 98%. However, electricity (EECI-Efficiency of 70.53%) is the most widely used energy source, accounting for 39.74% of total energy consumption, followed by steam (SCI-Efficiency of 49.49%) with 37.12% of total energy consumption, and natural gas (NGCI-Efficiency of 30.86%) with 23.14% of total energy consumption. This represents a disadvantage, and it is possible to improve efficiency results by reducing electricity use and opting for energy sources such as natural gas or steam. On the other hand, the ESI indicator showed a high performance, greater than 70%, indicating that the process has an optimal relationship between energy consumption and the production of high-value products.
4. Conclusions
In the context of the growing need to optimize industrial processes to ensure their sustainability, this research presents a comprehensive technical evaluation of the mass and energy-integrated gas oil hydrocracking process, applying the E-WEP methodology. This tool allowed diagnosing the technical behavior of the system through twelve key indicators, focused on the efficient use of water, energy, and raw materials. The study revealed that, despite the increase in total energy consumption after implementing mass integration, water efficiency reached notable levels. The FWC was reduced to 0.13 m3/t of product, and the TCF was limited to 777.28 USD/day, results that demonstrate a rational and responsible use of this resource. Furthermore, a Production Yield of 95.77% was achieved, with an IRUM of 67.99% for the unconverted hydrogen, which positively contributes to the sustainability of the process from the perspective of input utilization.
However, an increase in ESI was observed, reaching 14,777.99 MJ/t, and a TCE of USD 3,563,840.10/day, mainly attributable to increased electricity consumption due to the incorporation of new equipment associated with the integration. This situation negatively impacts energy indicators, with electricity being the most expensive source compared to steam and natural gas. The EUI was 3.06, while the NER was 0.76, reflecting moderate energy efficiency and suggesting opportunities for improvement in energy source selection and management. For these two indicators, since they cannot be normalized, it is proposed to use them in comparisons of conventional processes with their optimized versions. Compared with conventional and integrated suspension PVC production processes, the hydrocracking process showed lower energy efficiency but was superior in terms of water consumption and cost, demonstrating that each type of integration poses specific benefits and challenges.
In this sense, the integration of mass and energy, while presenting technical and economic challenges, has demonstrated its potential to improve the water sustainability of the process, which is especially valuable in contexts where water scarcity represents a critical constraint. This duality between energy efficiency and water conservation highlights the need to approach the design and optimization of industrial processes from a multidimensional perspective, simultaneously considering technical, economic, and environmental aspects. Thus, this work not only provides relevant quantitative data for future research but also invites us to rethink traditional efficiency evaluation criteria, proposing a more holistic view that allows us to move toward truly sustainable industrial models. Ultimately, it sets a precedent for how technical innovation can and should be oriented toward harmonizing productivity and environmental responsibility, projecting a horizon where industrial processes are not only more profitable but also more respectful of the planet’s resources.
Author Contributions
Conceptualization, Á.D.G.-D.; methodology, S.G.-M.; software, S.G.-M.; validation, Á.D.G.-D.; formal analysis, S.G.-M. and S.R.-F.; investigation, S.G.-M.; resources, Á.D.G.-D.; data curation, S.G.-M.; writing—original draft preparation, S.G.-M.; writing—review and editing, Á.D.G.-D.; visualization, Á.D.G.-D.; supervision, Á.D.G.-D.; project administration, Á.D.G.-D.; funding acquisition, S.R.-F. All authors have read and agreed to the published version of the manuscript.
Funding
This research was funded by the project approved by Resolution 01880 of 2022 and commitment act No. 027 of 2022.
Institutional Review Board Statement
Not applicable.
Informed Consent Statement
Not applicable.
Data Availability Statement
The original contributions presented in this study are included in the article. Further inquiries can be directed to the corresponding author.
Acknowledgments
The authors thank the Universidad de Cartagena for technical support.
Conflicts of Interest
The authors declare no conflicts of interest.
Abbreviations
| Production Yield | |
| IRUM | Index of Reused Unconverted Material |
| FWC | Fractional Water Consumption |
| TCF | Total Cost of Freshwater |
| WPR | Wastewater Production Ratio |
| TCE | Total Cost of Energy |
| ESI | Energy Specific Intensity |
| NGCI | Natural Gas Consumption Index |
| SCI | Steam Consumption Index |
| EECI | Electric Energy Consumption Index |
| NER | Net Energy Ratio |
| EUI | Energy Usability Index |
References
- Shishkova, I.; Stratiev, D.; Kolev, I.V.; Nenov, S.; Nedanovski, D.; Atanassov, K.; Ivanov, V.; Ribagin, S. Challenges in Petroleum Characterization—A Review. Energies 2022, 15, 7765. [Google Scholar] [CrossRef]
- Žula, M.; Grilc, M.; Likozar, B. Hydrocracking, Hydrogenation and Hydro-Deoxygenation of Fatty Acids, Esters and Glycerides: Mechanisms, Kinetics and Transport Phenomena. Chem. Eng. J. 2022, 444, 136564. [Google Scholar] [CrossRef]
- Ratshoshi, S.; Mukaya, H.E.; Nkazi, D. Hydrocracking of Non-edible Vegetable Oil and Waste Cooking Oils for the Production of Light Hydrocarbon Fuels: A Review. Can. J. Chem. Eng. 2024, 102, 3014–3028. [Google Scholar] [CrossRef]
- Bhan, C.; Verma, L.; Singh, J. Alternative Fuels for Sustainable Development. In Environmental Concerns and Sustainable Development; Springer: Singapore, 2020; pp. 317–331. [Google Scholar]
- Iplik, E.; Aslanidou, I.; Kyprianidis, K. Hydrocracking: A Perspective towards Digitalization. Sustainability 2020, 12, 7058. [Google Scholar] [CrossRef]
- Qin, X.; Yu, W.; Ye, L.; Shen, H.; Liu, J.; Murad, A.; Xie, J.; Hou, L.; Pu, X.; Han, X.; et al. Reaction Laws of Polycyclic Aromatic Hydrocarbons and Heteroatomic Compounds in Hydrocracking Process. Fuel 2023, 332, 126242. [Google Scholar] [CrossRef]
- Tiwari, R.; Rana, B.S.; Kumar, R.; Verma, D.; Kumar, R.; Joshi, R.K.; Garg, M.O.; Sinha, A.K. Hydrotreating and Hydrocracking Catalysts for Processing of Waste Soya-Oil and Refinery-Oil Mixtures. Catal. Commun. 2011, 12, 559–562. [Google Scholar] [CrossRef]
- Jones, D.S.J.; Pujadó, P.R. Handbook of Petroleum Processing; Scholars Portal: Toronto, ON, Canada, 2019; ISBN 9781402028199. [Google Scholar]
- Saab, R.; Polychronopoulou, K.; Zheng, L.; Kumar, S.; Schiffer, A. Synthesis and Performance Evaluation of Hydrocracking Catalysts: A Review. J. Ind. Eng. Chem. 2020, 89, 83–103. [Google Scholar] [CrossRef]
- García-Maza, S.; González-Delgado, Á.D. Robust Simulation and Technical Evaluation of Large-Scale Gas Oil Hydrocracking Process via Extended Water-Energy-Product (E-WEP) Analysis. Digit. Chem. Eng. 2024, 13, 100193. [Google Scholar] [CrossRef]
- Nieto, N. La Gestión Del Agua: Tensiones Globales y Latinoamericanas. Política Cult. 2011, 36, 157–176. [Google Scholar]
- Comisión de Regulación de Agua Potable y Saneamiento Básico. Resolución 750 de 2016 CRA; Avance Jurídico Casa Editorial Ltda: Bogotá, Colombia, 2016; ISBN 978-628-95145-1-3. [Google Scholar]
- Mughees, W.; Al-Ahmad, M. Application of Water Pinch Technology in Minimization of Water Consumption at a Refinery. Comput. Chem. Eng. 2015, 73, 34–42. [Google Scholar] [CrossRef]
- González-Delgado, Á.D.; Cogollo-Cárcamo, G.; Bertel-Pérez, F. Mass-Integration and Environmental Evaluation of Chitosan Microbeads Production Modified with of Thiourea and Magnetite Nanoparticles. Processes 2023, 11, 2208. [Google Scholar] [CrossRef]
- Aguilar-Vásquez, E.; Ramos-Olmos, M.; González-Delgado, Á.D. A Joint Computer-Aided Simulation and Water-Energy-Product (WEP) Approach for Technical Evaluation of PVC Production. Sustainability 2023, 15, 8096. [Google Scholar] [CrossRef]
- Mohammadnejad, S.; Bidhendi, G.R.N.; Mehrdadi, N. Water Pinch Analysis in Oil Refinery Using Regeneration Reuse and Recycling Consideration. Desalination 2011, 265, 255–265. [Google Scholar] [CrossRef]
- Bayomie, O.S.; Abdelaziz, O.Y.; Gadalla, M.A. Exceeding Pinch Limits by Process Configuration of an Existing Modern Crude Oil Distillation Unit—A Case Study from Refining Industry. J. Clean. Prod. 2019, 231, 1050–1058. [Google Scholar] [CrossRef]
- Balla, W.H.; Rabah, A.A.; Abdallah, B.K. Pinch Analysis of Sugarcane Refinery Water Integration. Sugar Technol. 2018, 20, 122–134. [Google Scholar] [CrossRef]
- Timothy, V.; El-Nafaty, U.A.; Giwa, S.O. Energy Integration of Atmospheric Distillation and Fluid Catalytic Cracking Units of Kaduna Refining and Petrochemical Company Using Pinch Method. Int. J. Sci. Res. 2019, 10, 367–387. [Google Scholar]
- Yoro, K.O.; Sekoai, P.T.; Isafiade, A.J.; Daramola, M.O. A Review on Heat and Mass Integration Techniques for Energy and Material Minimization during CO2 Capture. Int. J. Energy Environ. Eng. 2019, 10, 367–387. [Google Scholar] [CrossRef]
- Gruia, A. Recent Advances in Hydrocracking; Springer: New York, NY, USA, 2006; pp. 219–255. [Google Scholar]
- Pham, H.H.; Kim, K.H.; Go, K.S.; Nho, N.S.; Kim, W.; Kwon, E.H.; Jung, R.H.; Lim, Y.I.; Lim, S.H.; Pham, D.A. Hydrocracking and Hydrotreating Reaction Kinetics of Heavy Oil in CSTR Using a Dispersed Catalyst. J. Pet. Sci. Eng. 2021, 197, 107997. [Google Scholar] [CrossRef]
- Bandyopadhyay, R.; Upadhyayula, S. Thermodynamic Analysis of Diesel Hydrotreating Reactions. Fuel 2018, 214, 314–321. [Google Scholar] [CrossRef]
- Valavarasu, G.; Bhaskar, M.; Balaraman, K.S. Mild Hydrocracking—A Review of the Process, Catalysts, Reactions, Kinetics, and Advantages. Pet. Sci. Technol. 2003, 21, 1185–1205. [Google Scholar] [CrossRef]
- García-Maza, S.; González-Delgado, Á.D. Technical–Economic Assessment and FP2O Technical–Economic Resilience Analysis of the Gas Oil Hydrocracking Process at Large Scale. Sci 2025, 7, 17. [Google Scholar] [CrossRef]
- El-Halwagi, M.M. Sustainable Design through Process Integration: Fundamentals and Applications to Industrial Pollution Prevention, Resource Conservation, and Profitability Enhancement; Elsevier: Amsterdam, The Netherlands, 2025. [Google Scholar]
- Nekrasov, I.; Tynchenko, V.; Bukhtoyarov, V.; Panfilova, T.; Sokolnikov, A.; Gorodov, A.; Panfilov, I. Simulation of the Hydrocracking Process to Produce Diesel Fuel in the Aspen HYSYS System. In AIP Conference Proceedings; American Institute of Physics Inc.: College Park, MD, USA, 2023; Volume 2700. [Google Scholar]
- The Engineering ToolBox. Higher Calorific Values of Common Fuels: Reference & Data; 2003. Available online: https://www.engineeringtoolbox.com/fuels-higher-calorific-values-d_169.html (accessed on 14 August 2025).
- Kinsman-Costello, L.E.; O’Brien, J.M.; Hamilton, S.K. Natural Stressors in Uncontaminated Sediments of Shallow Freshwaters: The Prevalence of Sulfide, Ammonia, and Reduced Iron. Environ. Toxicol. Chem. 2015, 34, 467–479. [Google Scholar] [CrossRef] [PubMed]
- Guardo-Ruiz, R.M.; Puello-Castellón, L.M.; Ortega-Toro, R.; Aguilar-Vásquez, E.A.; González-Delgado, Á.D. Enhancing Technical Performance of PVC Production: A WEP-Based Energy and Water Assessment. Polymers 2025, 17, 1561. [Google Scholar] [CrossRef] [PubMed]
Disclaimer/Publisher’s Note: The statements, opinions and data contained in all publications are solely those of the individual author(s) and contributor(s) and not of MDPI and/or the editor(s). MDPI and/or the editor(s) disclaim responsibility for any injury to people or property resulting from any ideas, methods, instructions or products referred to in the content. |
© 2025 by the authors. Licensee MDPI, Basel, Switzerland. This article is an open access article distributed under the terms and conditions of the Creative Commons Attribution (CC BY) license (https://creativecommons.org/licenses/by/4.0/).