


Validation of Solid-State LiDAR Measurement System for Ballast Geometry Monitoring in Rail Tracks

 ,
,  , ,
, ,  and
and 
Abstract
1. Introduction
2. Materials and Methods
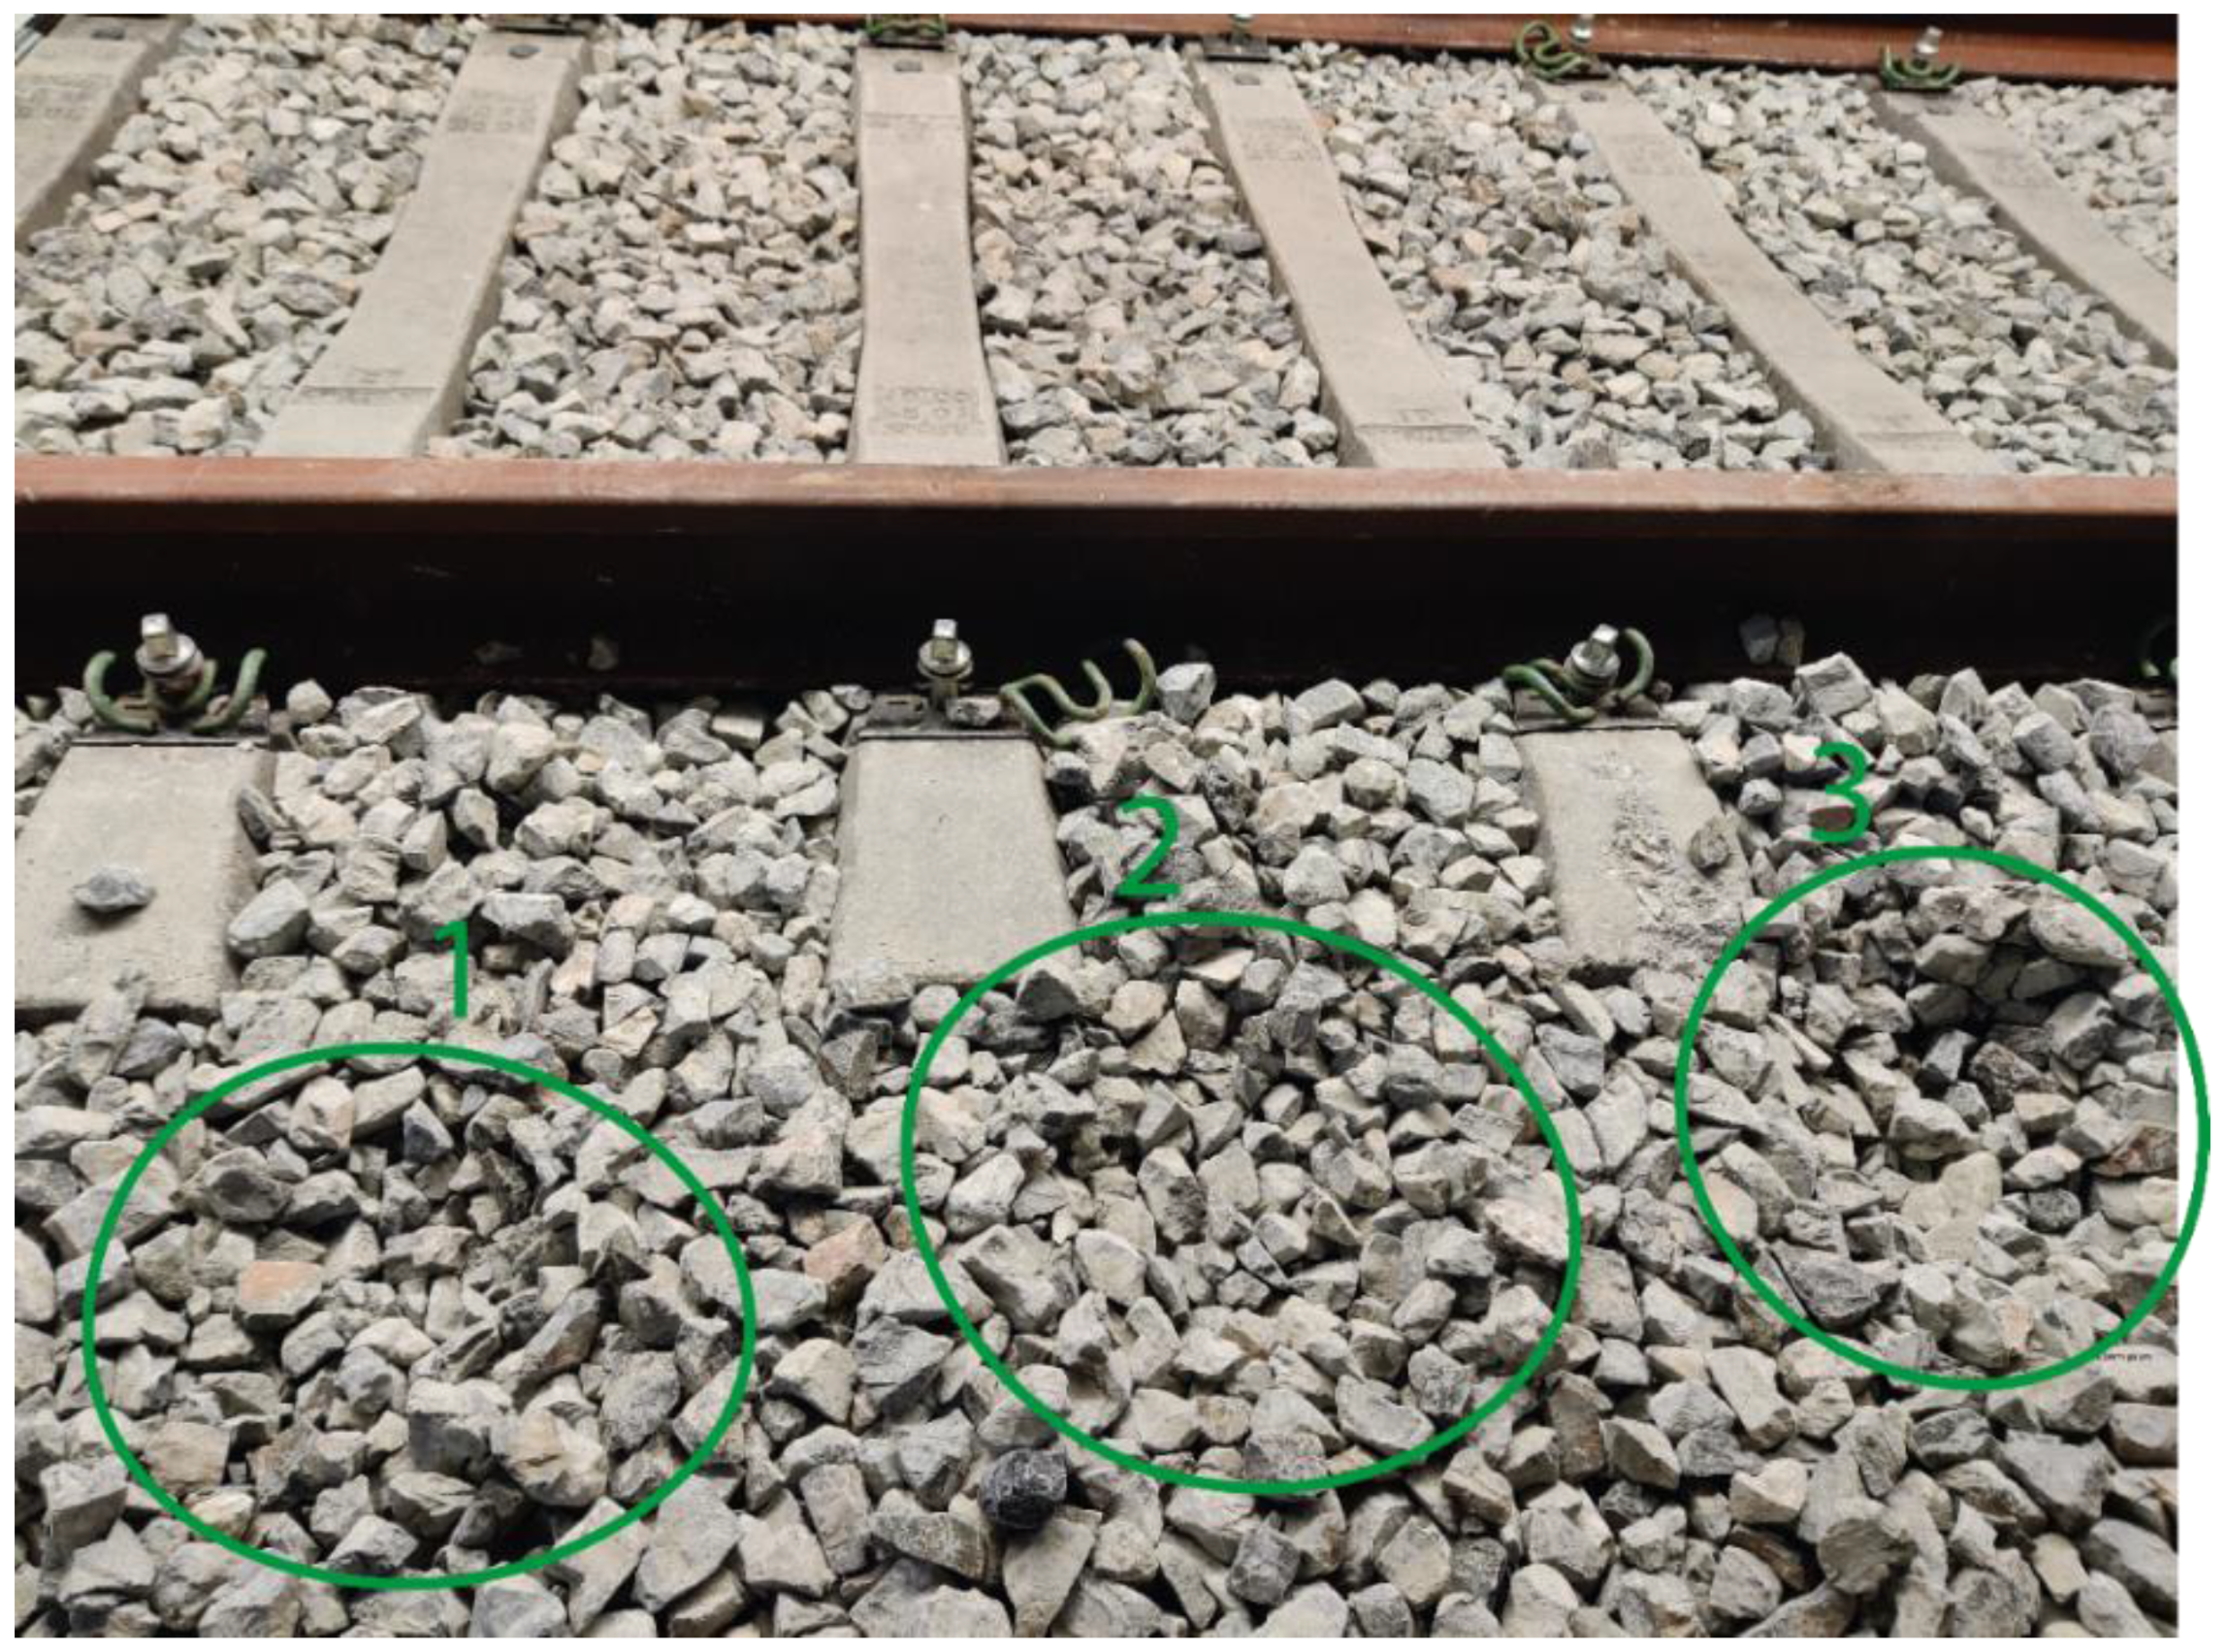
2.1. Materials
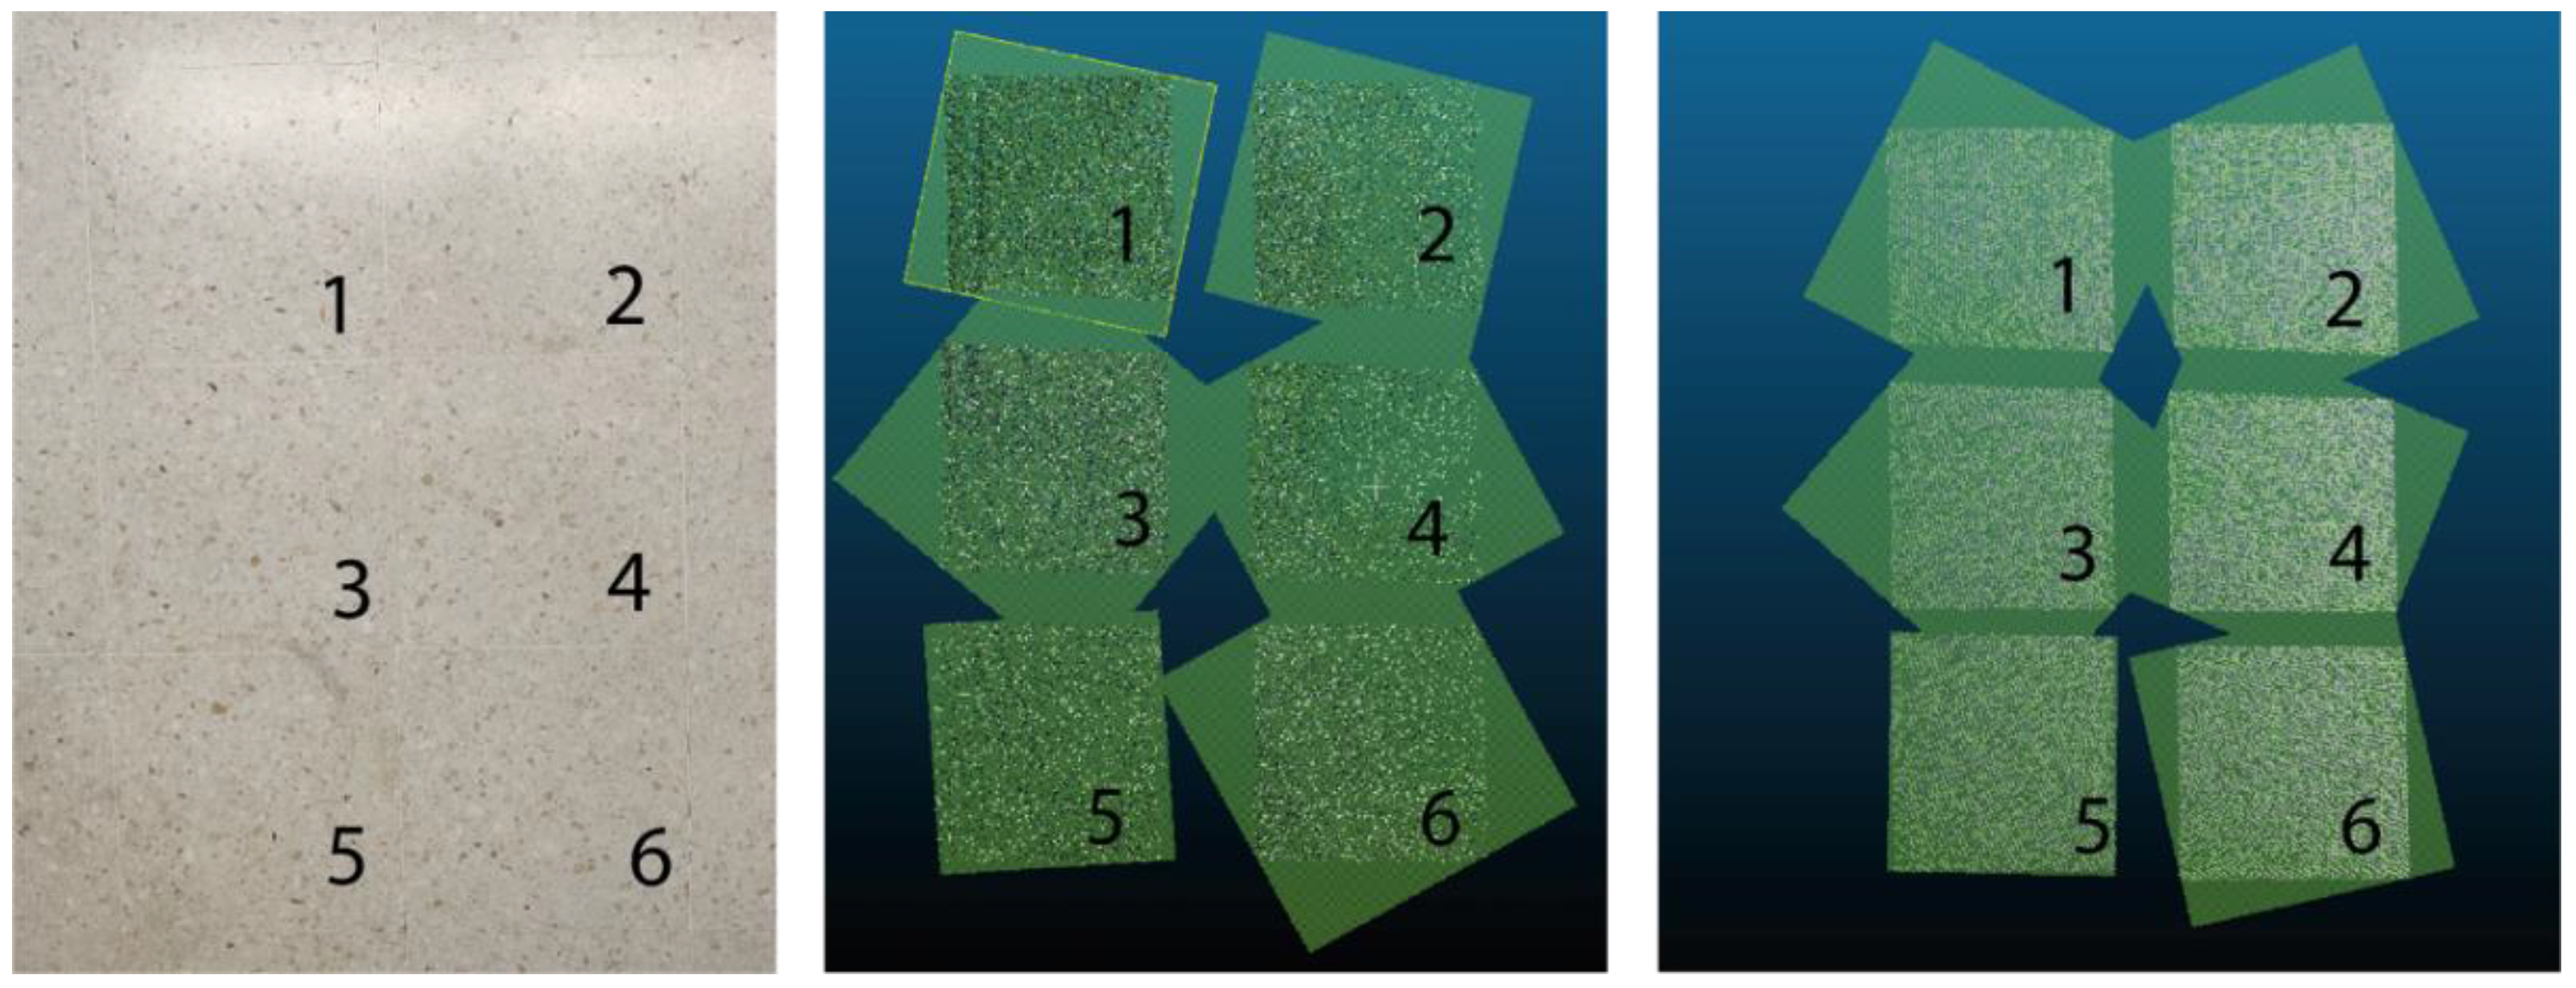
2.2. Methods
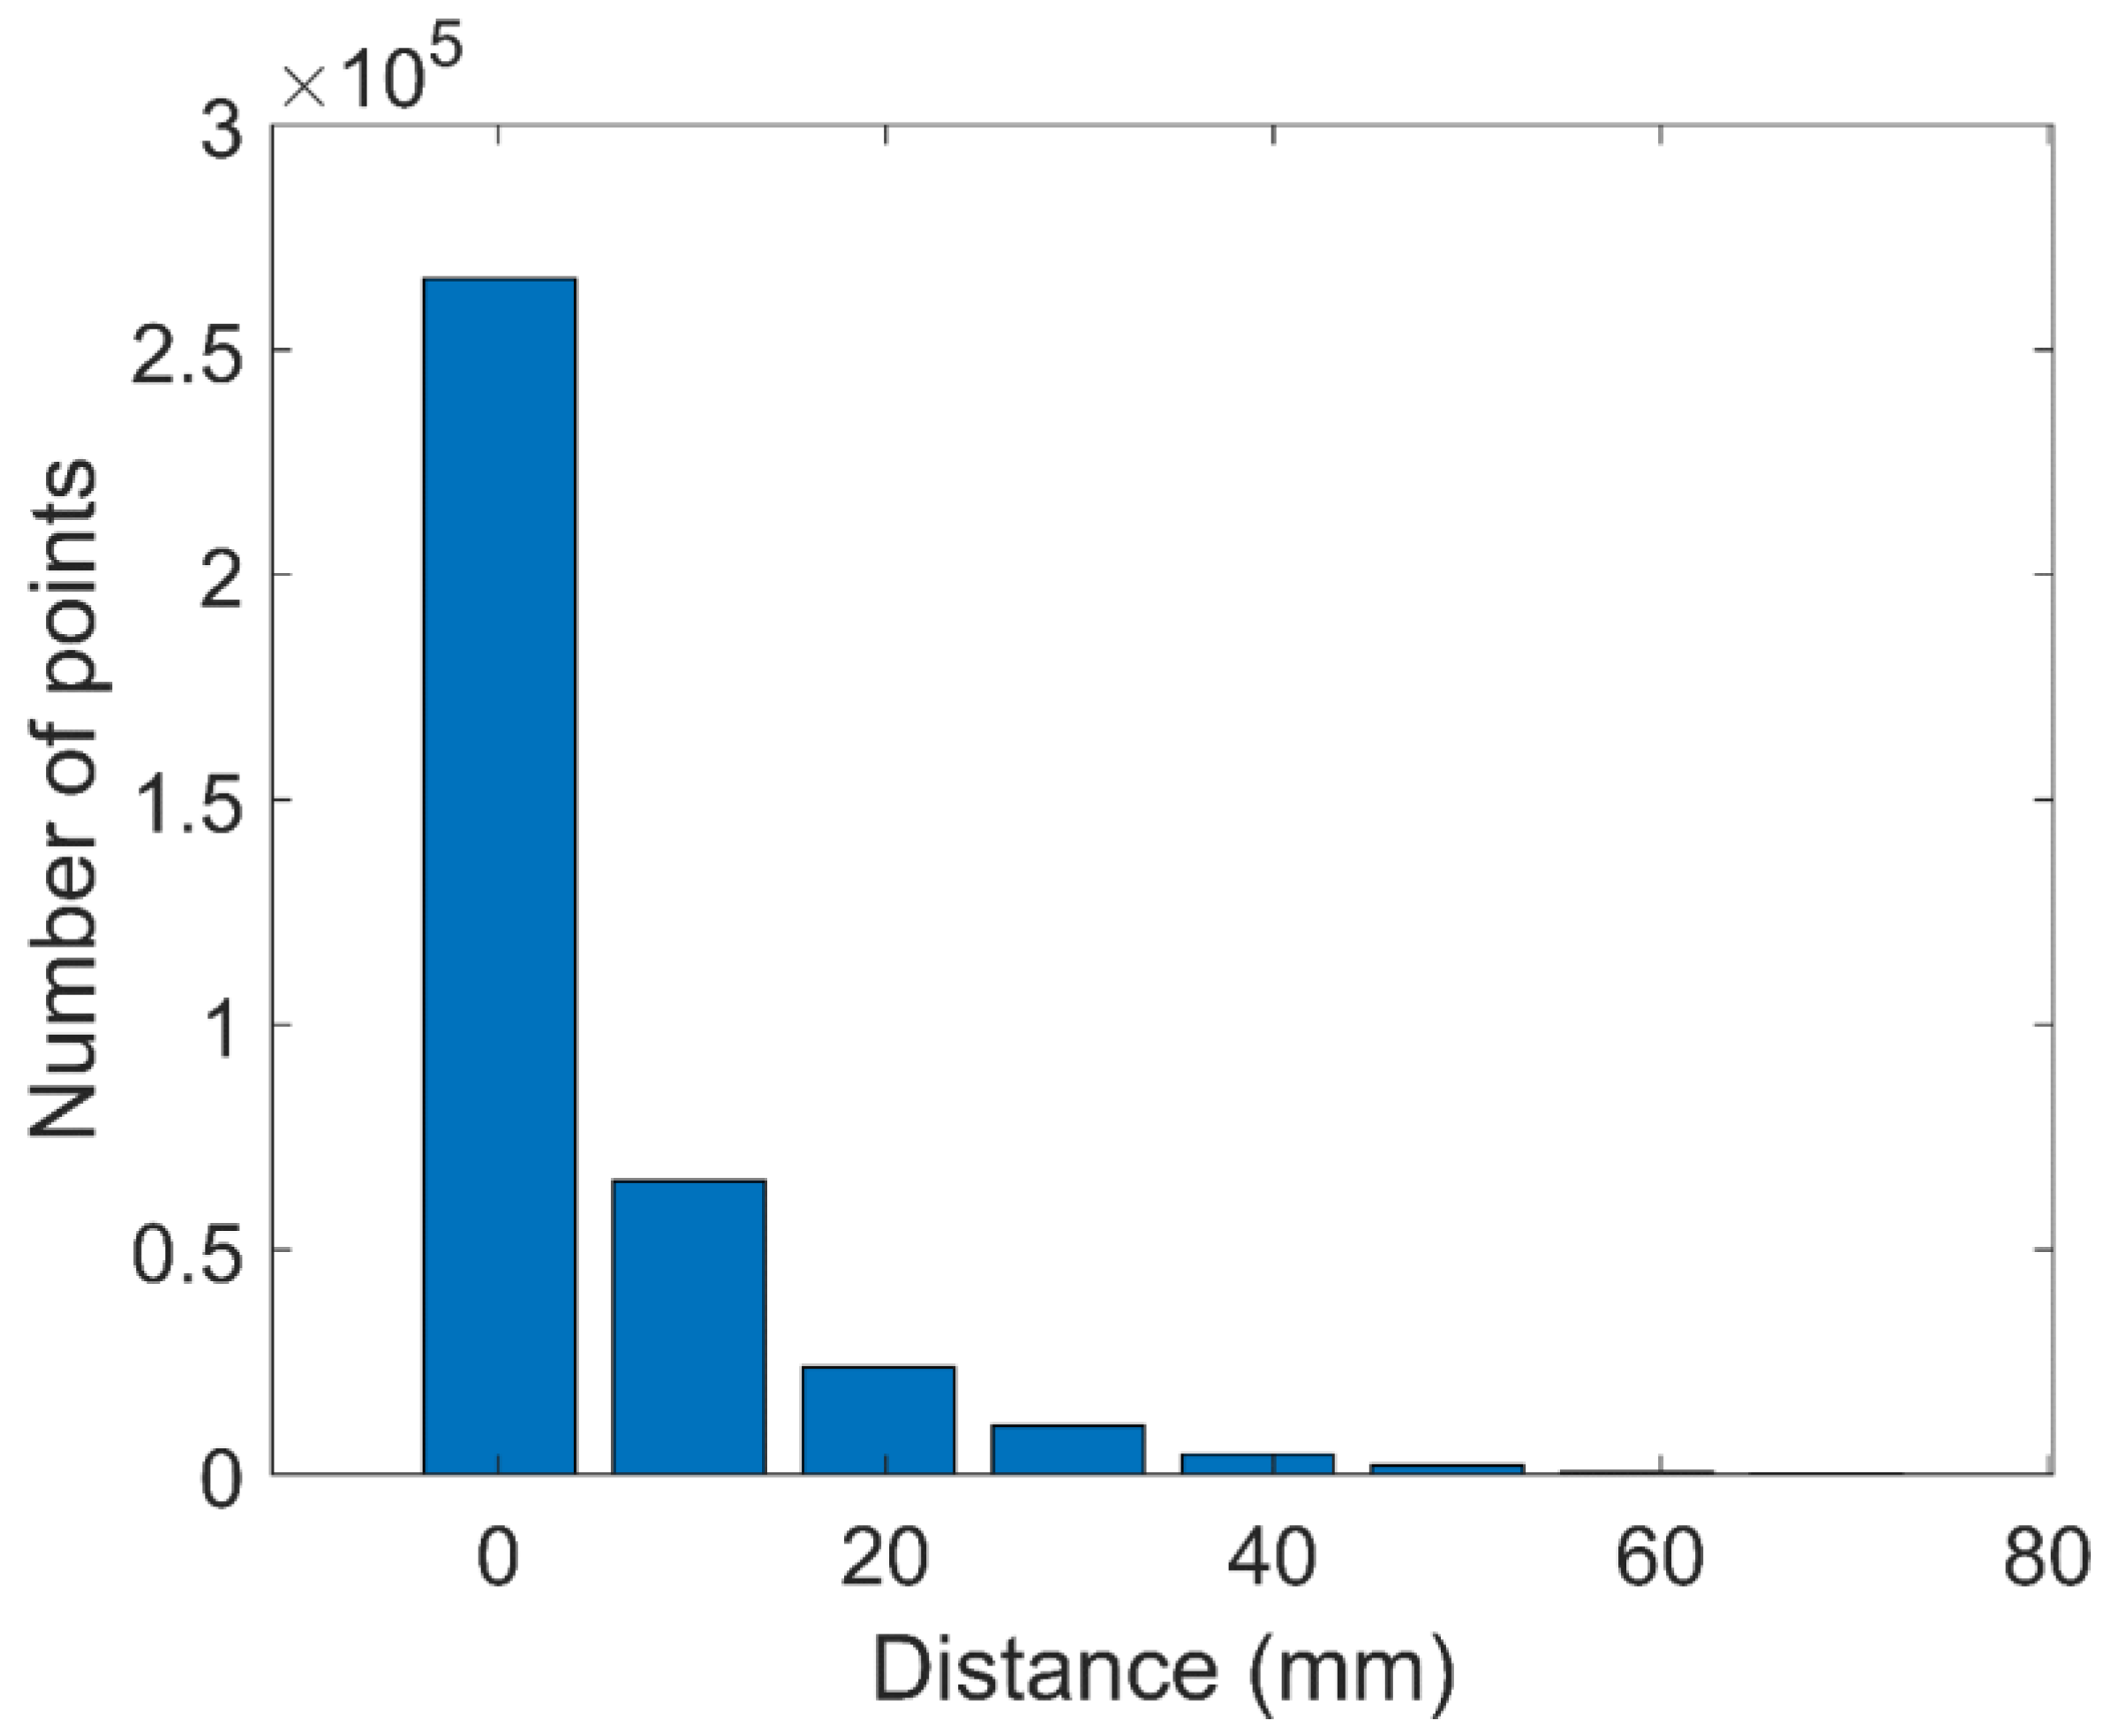
2.2.1. Standard Deviation of Measurements
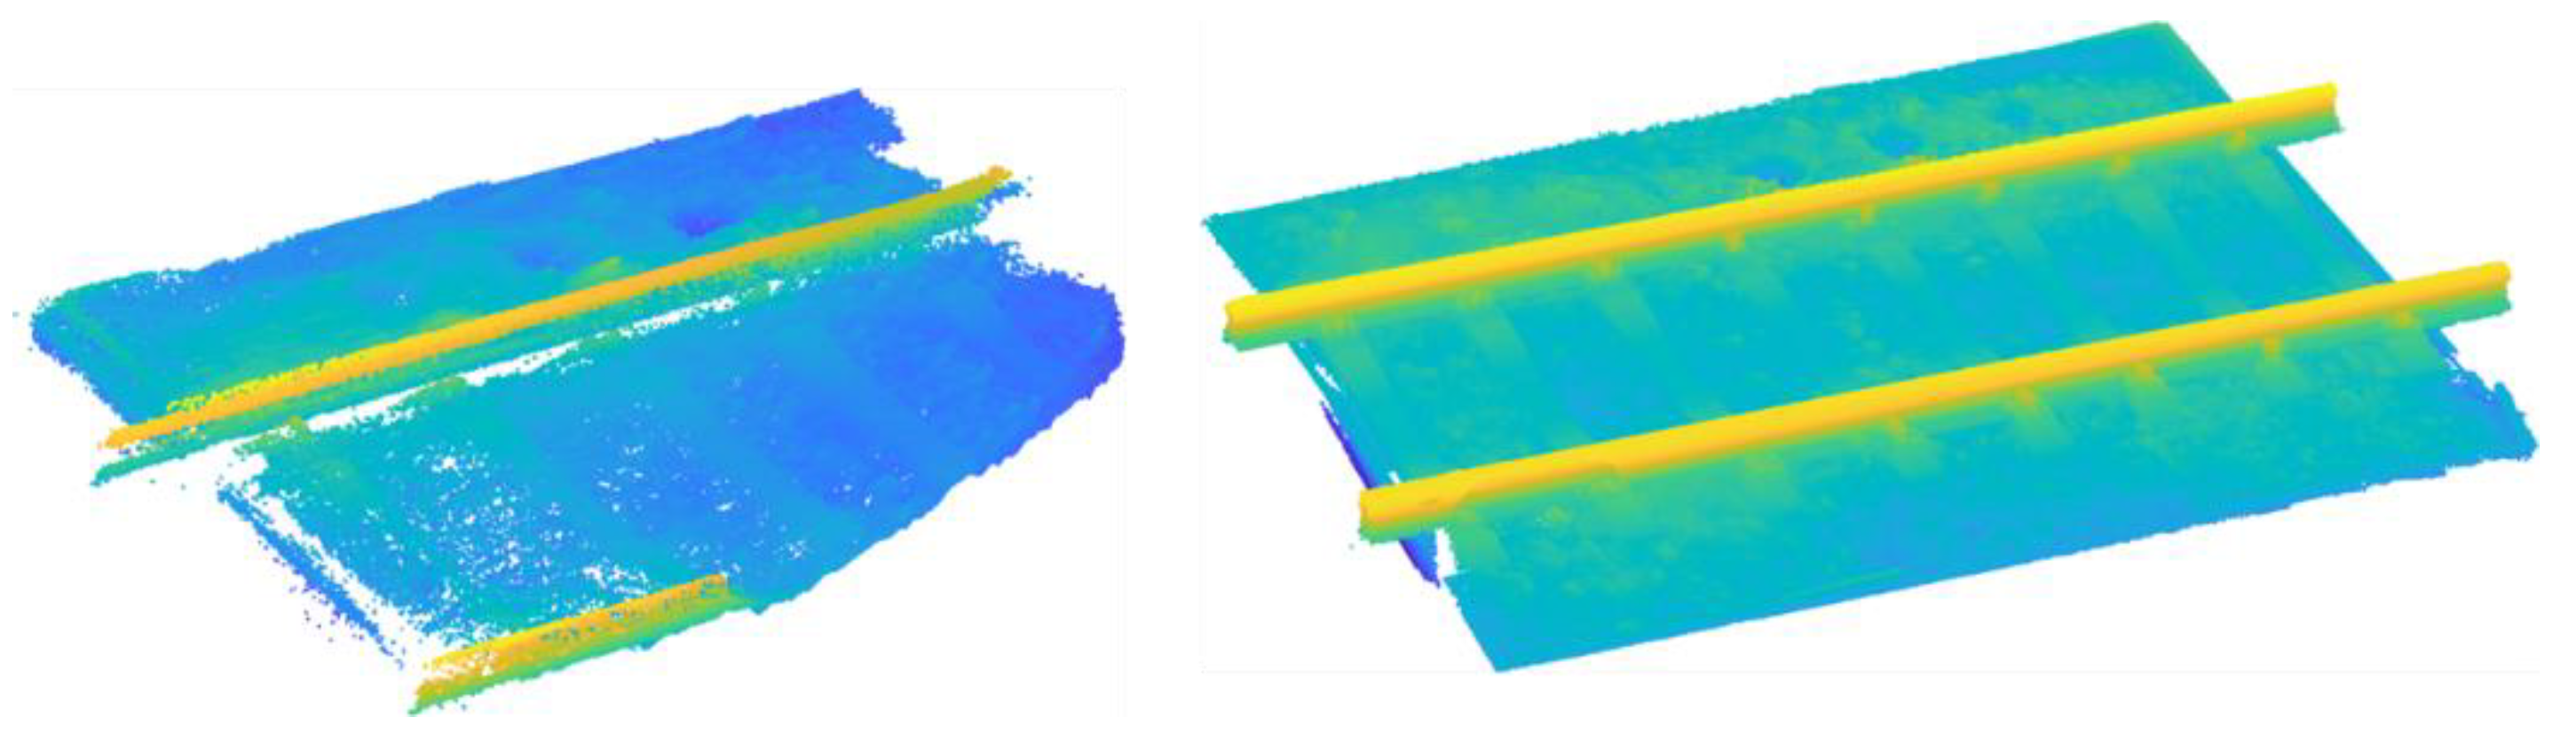
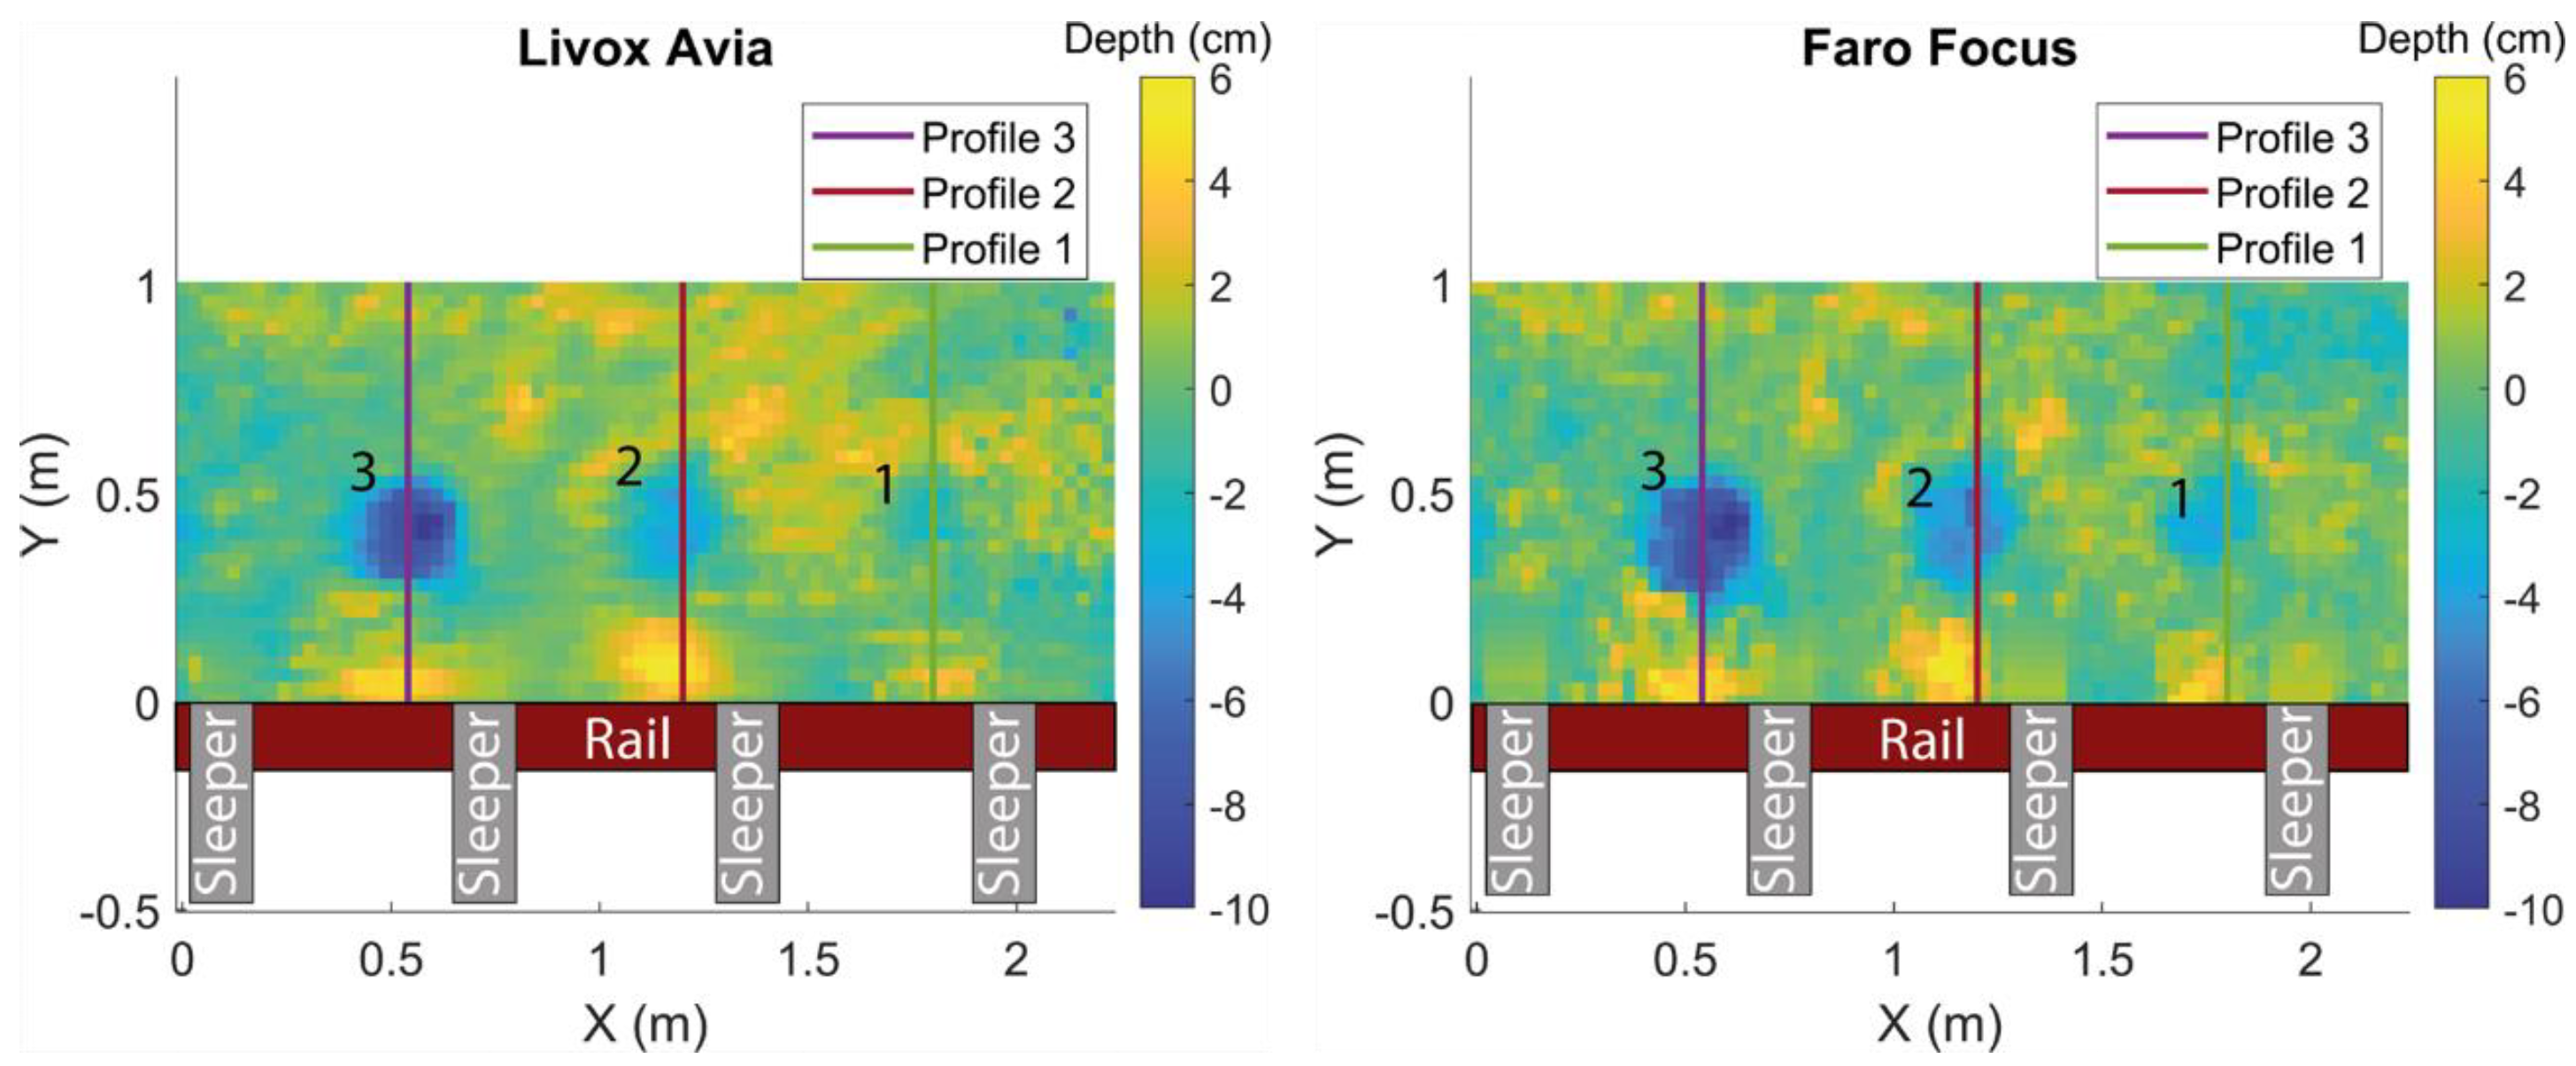
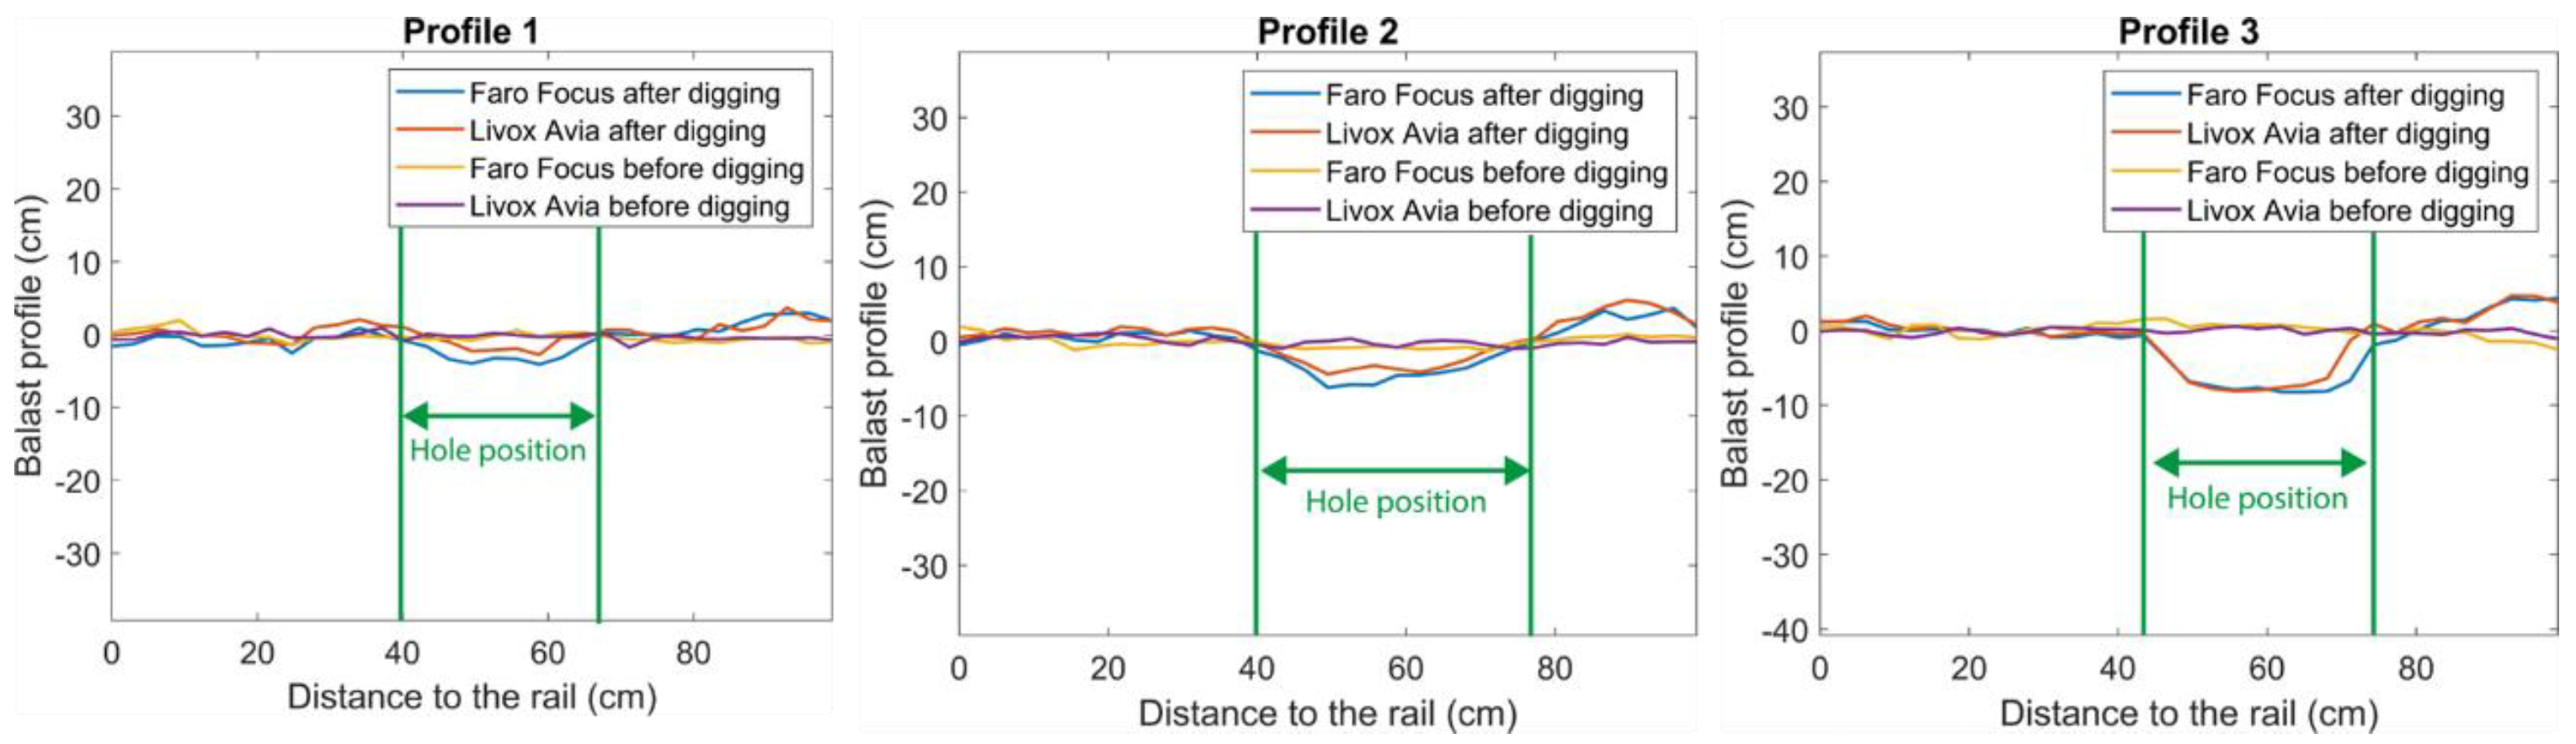
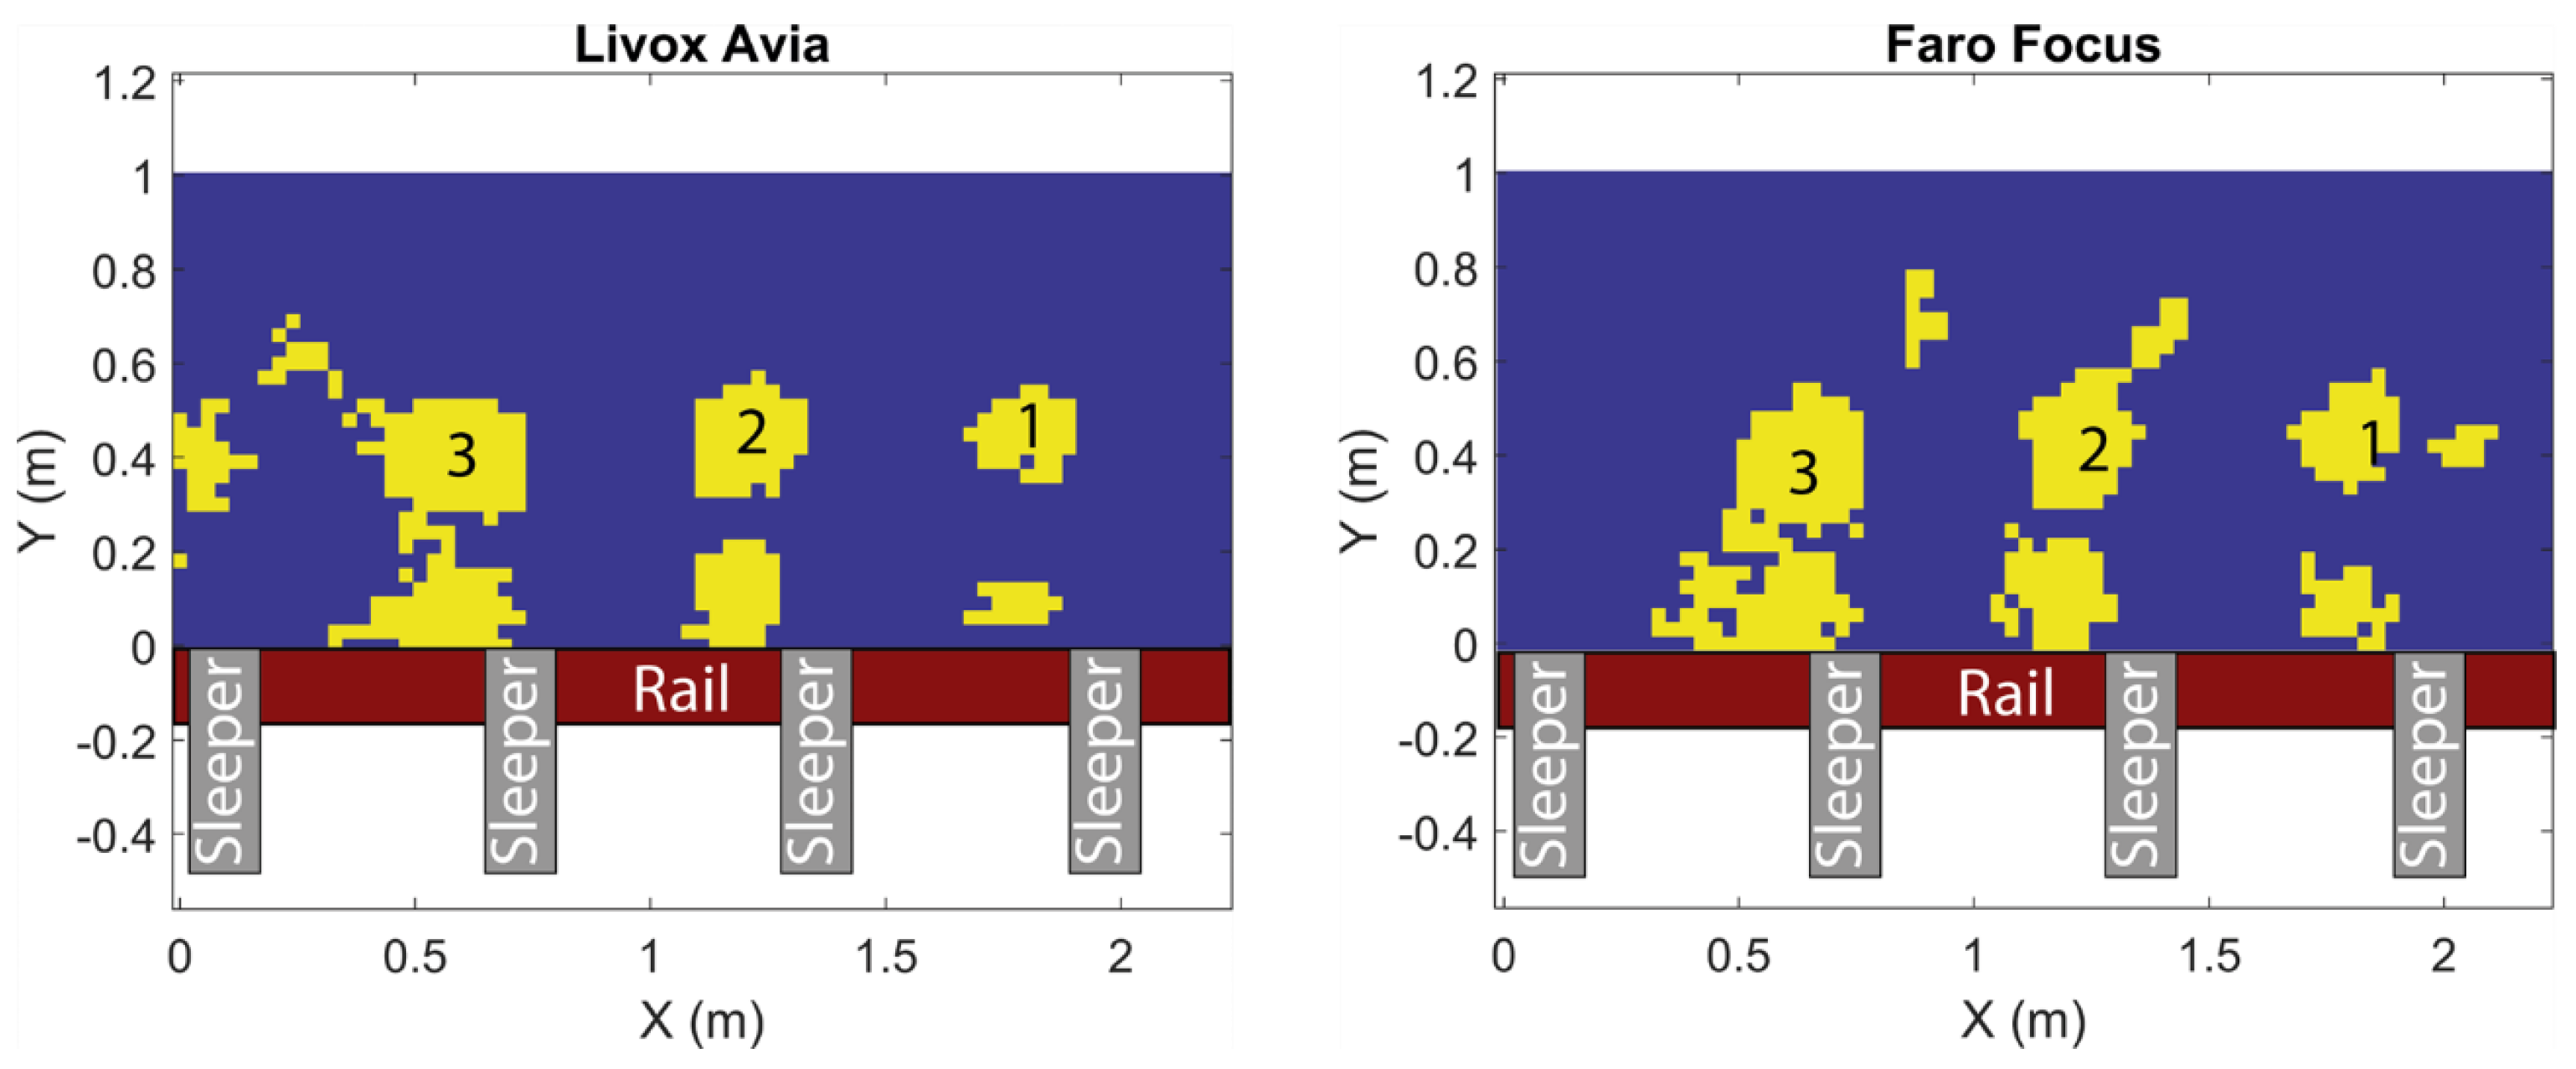
2.2.2. Digital Elevation Model and Ballast Profiles
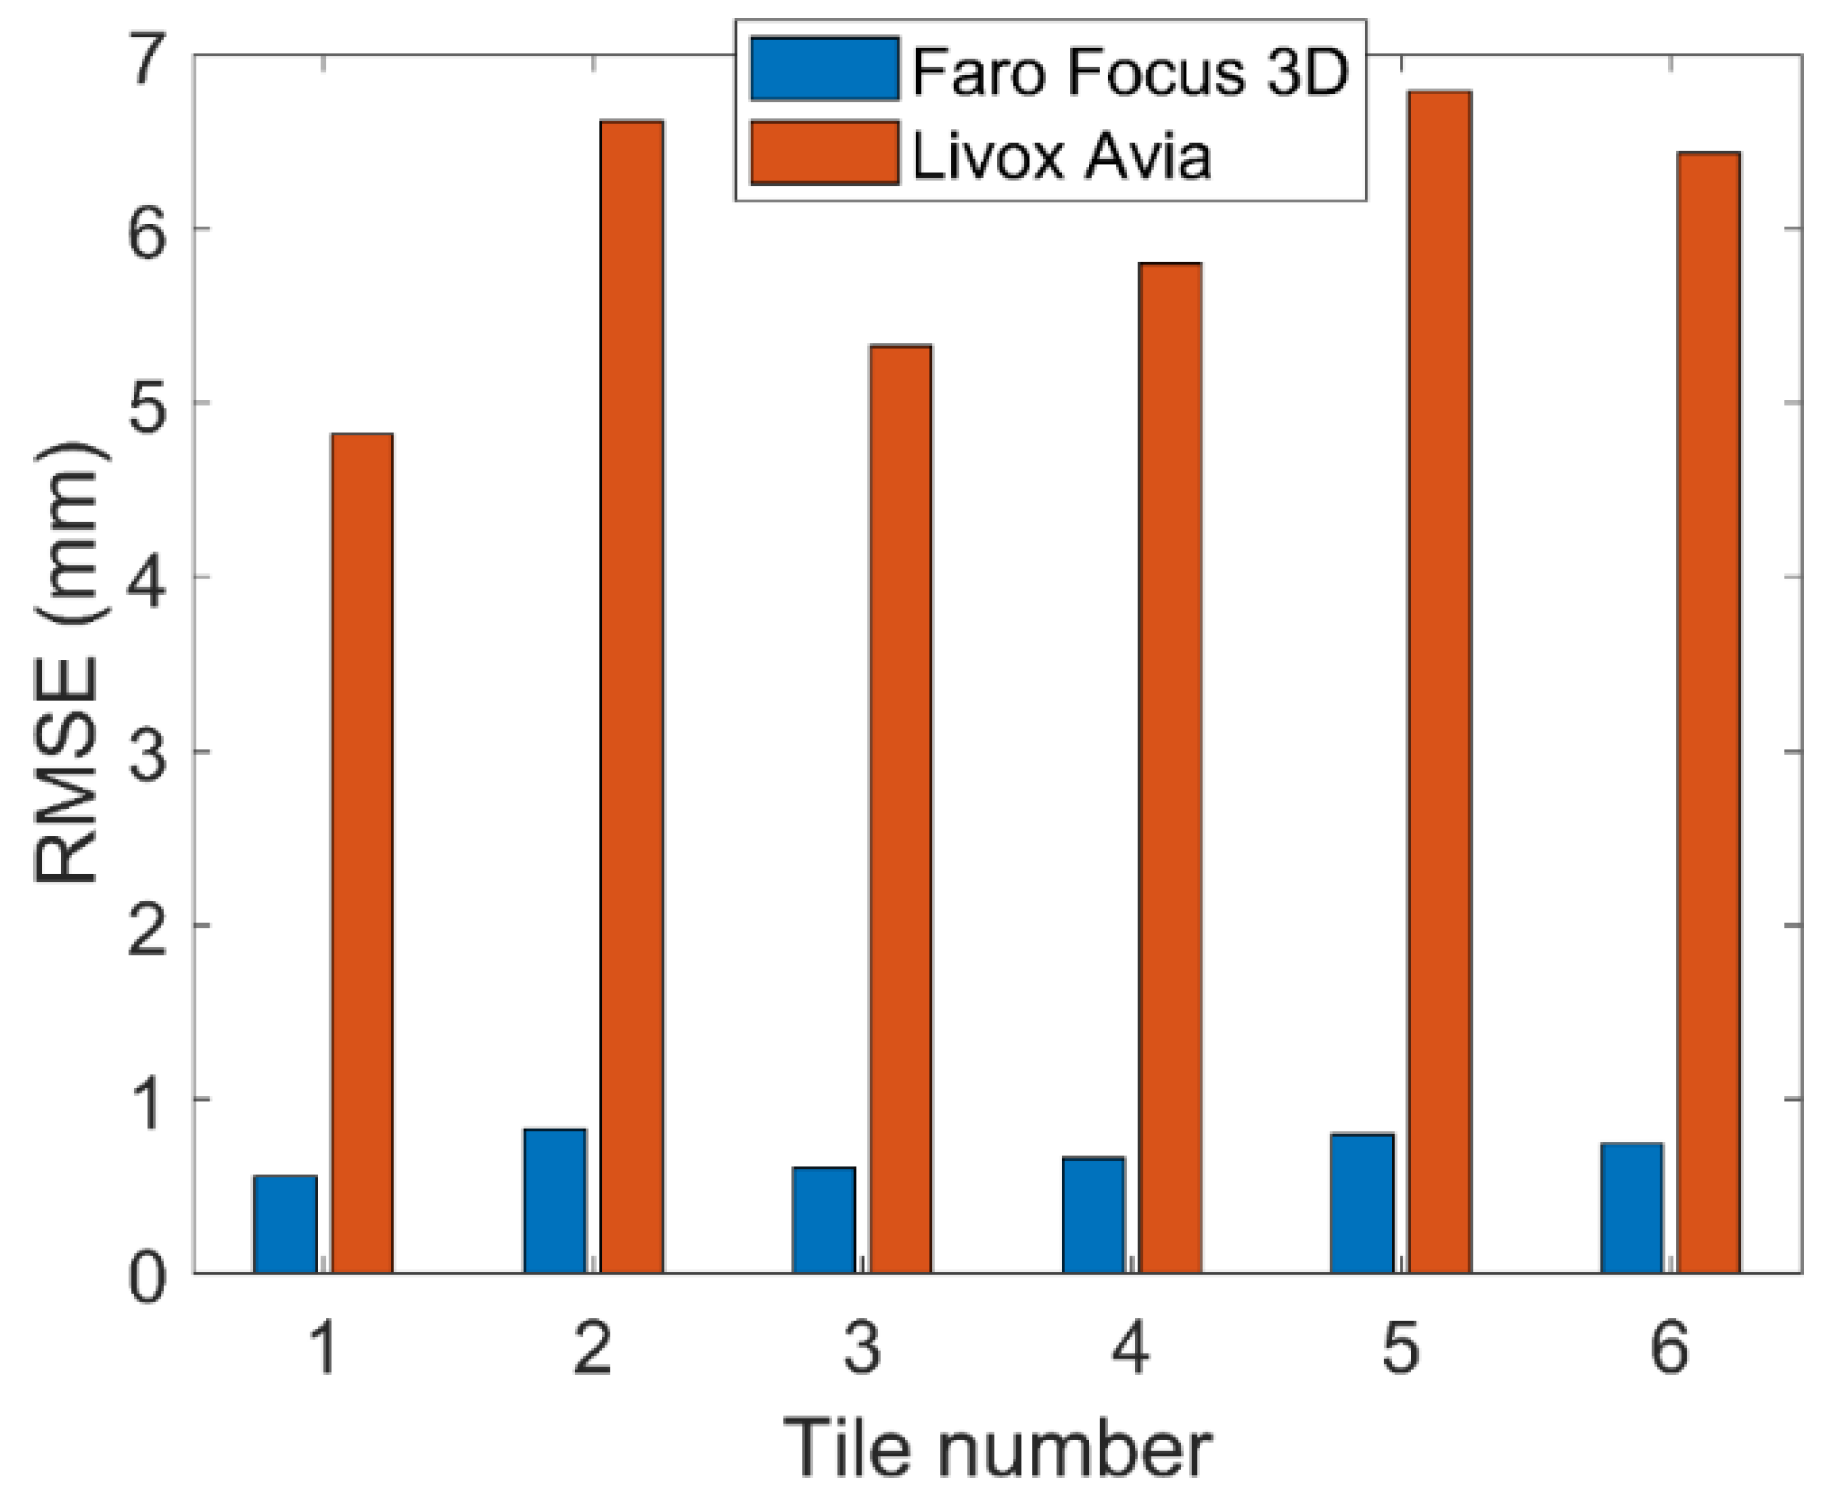
3. Results
4. Conclusions
Author Contributions
Funding
Acknowledgments
Conflicts of Interest
References
- Cavendish, R. George Stephenson’s first steam locomotive. Hist. Today 2014, 64, 7. Available online: https://www.historytoday.com/archive/george-stephensons-first-steam-locomotive (accessed on 26 December 2022).
- Guo, X.; Sun, W.; Yao, S.; Zheng, S. Does high-speed railway reduce air pollution along highways? Evidence from China. Transp. Res. Part D: Transp. Environ. 2020, 89, 102607. [Google Scholar] [CrossRef]
- Lalive, R.; Luechinger, S.; Schmutzler, A. Does expanding regional train service reduce air pollution? J. Environ. Econ. Manag. 2018, 92, 744–764. [Google Scholar] [CrossRef]
- Zhu, L.; Yu, F.R.; Wang, Y.; Ning, B.; Tang, T. Big data analytics in intelligent transportation systems: A survey. IEEE Trans. Intell. Transp. Syst. 2019, 20, 383–398. [Google Scholar] [CrossRef]
- Papaelias, N.P.; Roberts, C.; Davis, C.L. A review on non-destructive evaluation of rails: State-of-the-art and future development. Proc. Inst. Mech. Eng. Part F J. Rail Rapid Transit. 2008, 222, 367–384. [Google Scholar] [CrossRef]
- Sainz-Aja, A.J.; Ferreño, D.; Pombo, J.; Carrascal, I.A.; Casado, J.; Diego, S.; Castro, J. Parametric analysis of railway infrastructure for improved performance and lower life-cycle costs using machine learning techniques. Adv. Eng. Softw. 2023, 175, 103357. [Google Scholar] [CrossRef]
- Cannon, D.F.; Edel, K.O.; Grassie, S.L.; Sawley, K. Rail defects: An overview. Fatigue Fract. Eng. Mater. Struct. 2003, 26, 865–886. [Google Scholar] [CrossRef]
- Popov, K.; De Bold, R.; Chai, H.K.; Forde, M.C.; Ho, C.L.; Hyslip, J.P.; Kashani, H.F.; Long, P.; Hsu, S.S. Big-data driven assessment of railway track maintenance efficiency using artificial neural networks. Constr. Build. Mater. 2022, 349, 128786. [Google Scholar] [CrossRef]
- Luo, X.; Haya, H.; Inaba, T.; Shiotani, T.; Nakanishi, Y. Damage evaluation of railway structures by using train-induced AE. Constr. Build. Mater. 2004, 18, 215–223. [Google Scholar] [CrossRef]
- Xin Wang, X.L.; Todd, L.E. Relationship between track geometry defect occurrence and substructure condition: A case study on one passenger railroad in the United States. Constr. Build. Mater. 2023, 365, 130066. [Google Scholar] [CrossRef]
- Chen, L.; Chen, W.; Wang, L.; Zhai, C.; Hu, X.; Sun, L.; Tian, Y.; Huang, X.; Jiang, L. Convolutional neural networks (CNNs)-based multi-category damage detection and recognition of high-speed rail (HSR) reinforced concrete (RC) bridges using test images. Constr. Build. Mater. 2023, 276, 115306. [Google Scholar] [CrossRef]
- Guo, Y.; Xie, J.; Fan, Z.; Markine, V.; Connolly, D.P.; Jing, G. Railway ballast material selection and evaluation: A review. Constr. Build. Mater. 2022, 344, 128218. [Google Scholar] [CrossRef]
- Xiaio, H.; Fang, J.; Chi, Y.; Zhang, Z.; Ma, J.; Nadakatti, M.M.; Wang, X. Discrete element analysis of the effect of manual tamping operation on the manual tamping operation on the mechanical properties of ballast bed. Constr. Build. Mater. 2022, 361, 129557. [Google Scholar] [CrossRef]
- Prescott, D.; Andrews, J. A track ballast maintenance and inspection model for a rail network. Proc. Inst. Mech. Eng. Part O J. Risk Reliab. 2013, 227, 251–266. [Google Scholar] [CrossRef]
- Prasad, K.V.S.; Hussaini, S.K.K. Review of different stabilization techniques adapted in ballasted tracks. Constr. Build. Mater. 2022, 340, 127747. [Google Scholar] [CrossRef]
- Guo, Y.; Markine, V.; Jing, G. Review of ballast track tramping: Mechanism, challenges and solutions. Constr. Build. Mater. 2021, 300, 123940. [Google Scholar] [CrossRef]
- Zhang, B.; Lee, S.J.; Qian, Y.; Tutumluer, E.; Bhattacharya, S. A smartphone-based image analysis technique for ballast aggregates. In Proceedings of the International Conference on Transportation and Development, Houston, TX, USA, 26–29 June 2016; pp. 623–630. [Google Scholar] [CrossRef]
- Paixao, A.; Resende, R.; Fortunato, E. Photogrammetry for digital reconstruction of railway ballast particles. A cost-efficient method. Constr. Build. Mater. 2018, 191, 963–976. [Google Scholar] [CrossRef]
- Paixao, A.; Afonso, C.; Delgado, B.; Fortunato, E. Evaluation of ballast particle degradation under micro-deval testing using photogrammetry. Lect. Notes Civ. Eng. 2022, 165, 113–124. [Google Scholar] [CrossRef]
- Díaz-Vilariño, L.; González-Jorge, H.; Bueno, M.; Arias, P.; Puente, I. Automatic classification of urban pavements using mobile LiDAR data and roughness descriptors. Constr. Build. Mater. 2016, 102, 208–215. [Google Scholar] [CrossRef]
- Sánchez-Rodríguez, A.; Riveiro, B.; Soilán, M.; González-deSantos, L.M. Automated detection and decomposition of railway tunnels from mobile laser scanning datasets. Autom. Constr. 2018, 96, 171–179. [Google Scholar] [CrossRef]
- Zarembski, A.M.; Grissom, G.T.; Euston, T.L. On the use of ballast inspection technology for the management of track substructure. Transp. Infrastruct. Geotechnol. 2014, 1, 83–109. [Google Scholar] [CrossRef]
- Zarembski, A.M.; Palese, J.W.; Euston, T.L. Correlating ballast volume deficit with the development of track geometry exceptions utilizing data science algorithm. Transp. Infrastruct. Geotechnol. 2017, 4, 37–51. [Google Scholar] [CrossRef]
- Sun, H.; Xu, Z.; Yao, L.; Zhong, R.; Du, L.; Wu, H. Tunnel monitoring and measuring system using mobile laser scanning: Design and deployment. Remote Sens. 2020, 12, 730. [Google Scholar] [CrossRef]
- Niel, Z.; Ashiru, M.; Chen, X.; Mohamud, S.; Chen, X.; Mohamud, S.H. Appraisal of railway ballast degradation through Los Angeles abrasion, cyclic loading tests, and image technics. In Advances in Geotechnical Engineering & Geoenvironmental Engineering; Sustainable Civil Infrastructures Series; Springer: Berlin/Heidelberg, Germany, 2021; pp. 48–58. [Google Scholar] [CrossRef]
- Schulte-Tigges, J.; Förster, M.M.; Nikolovski, G.; Reke, M.; Ferrein, A.; Kaszner, D.; Matheis, D.; Walter, T. Benchmarking of various LiDAR sensors for use in self-driving vehicles in real-world environments. Sensors 2022, 22, 7146. [Google Scholar] [CrossRef]
- Kelly, C.; Wilkinson, B.; Abd-Elrahman, A.; Cordero, O.; Lassiter, H. Accuracy assessment of low-cost LiDAR scanners: An analysis of the Velodyne HDL-32E and LiVOX Mid-40’s temporal stability. Remote Sens. 2022, 14, 4220. [Google Scholar] [CrossRef]
- COPASA. Available online: https://www.copasagroup.com/es/inicio/ (accessed on 26 December 2022).
- Sanchis, I.V.; Franco, R.I.; Zuriaga, P.S.; Fernández, P.M. Risk of increasing temperature due to climate change on operation of the Spanish rail network. Transp. Res. Procedia 2020, 45, 5–12. [Google Scholar] [CrossRef]
- LiVOX Avia Specifications. Available online: https://www.livoxtech.com/avia (accessed on 29 December 2022).
- Faro Focus 3D Specifications. Available online: https://knowledge.faro.com/Hardware/Focus/Focus/Performance_Specifications_for_the_Focus3D (accessed on 29 December 2022).
- Cloud Compare. Available online: https://www.cloudcompare.org/ (accessed on 29 December 2022).
- González-Jorge, H.; Riveiro, B.; Armesto, J.; Arias, P. Standard artifact for the geometric verification of terrestrial laser scanning systems. Opt. Laser Technol. 2011, 43, 1249–1256. [Google Scholar] [CrossRef]
- Besl, P.J.; McKay, N.D. A method for registration of 3-D shapes. IEEE Trans. Pattern Anal. Mach. Intell. 1992, 142, 239–256. [Google Scholar] [CrossRef]
- Riveiro, B.; González-Jorge, H.; Martínez-Sánchez, J.; Díaz-Vilariño, L.; Arias, P. Automatic detection of zebra crossings from mobile LiDAR data. Opt. Laser Technol. 2015, 70, 63–70. [Google Scholar] [CrossRef]
- Types of Ballast. Available online: https://civilcrews.com/ballast-and-types-of-ballast/ (accessed on 29 December 2022).


| Feature | LiVOX Avia | Faro Focus 3D |
|---|---|---|
| Pulse repetition rate | 240,000 points/s | 976,000 points/s |
| Scanning rate | 10 Hz | 97 Hz |
| Maximum detection range | 320 m (80% reflectivity) 190 m (10% reflectivity) | 153.49 m |
| Field of view | 70.4° (H) × 4.5° (V) | 305° (H) × 360° (V) |
| Laser wavelength | 905 nm | 905 nm |
| Range precision | 2 cm (1 σ) | 1.2 mm (10 m range) 2.2 mm (25 m range) |
| Angular precision | 0.05° | 0.009° |
| Beam divergence | 0.03° (H) × 0.28° (V) | 0.01° |
| Data storage | USB 3.0 flash drive | SD card |
Disclaimer/Publisher’s Note: The statements, opinions and data contained in all publications are solely those of the individual author(s) and contributor(s) and not of MDPI and/or the editor(s). MDPI and/or the editor(s) disclaim responsibility for any injury to people or property resulting from any ideas, methods, instructions or products referred to in the content. |
© 2023 by the authors. Licensee MDPI, Basel, Switzerland. This article is an open access article distributed under the terms and conditions of the Creative Commons Attribution (CC BY) license (https://creativecommons.org/licenses/by/4.0/).
Share and Cite
Aldao, E.; González-Jorge, H.; González-deSantos, L.M.; Fontenla-Carrera, G.; Martínez-Sánchez, J. Validation of Solid-State LiDAR Measurement System for Ballast Geometry Monitoring in Rail Tracks. Infrastructures 2023, 8, 63. https://doi.org/10.3390/infrastructures8040063
Aldao E, González-Jorge H, González-deSantos LM, Fontenla-Carrera G, Martínez-Sánchez J. Validation of Solid-State LiDAR Measurement System for Ballast Geometry Monitoring in Rail Tracks. Infrastructures. 2023; 8(4):63. https://doi.org/10.3390/infrastructures8040063
Chicago/Turabian StyleAldao, Enrique, Higinio González-Jorge, Luis Miguel González-deSantos, Gabriel Fontenla-Carrera, and Joaquin Martínez-Sánchez. 2023. "Validation of Solid-State LiDAR Measurement System for Ballast Geometry Monitoring in Rail Tracks" Infrastructures 8, no. 4: 63. https://doi.org/10.3390/infrastructures8040063
APA StyleAldao, E., González-Jorge, H., González-deSantos, L. M., Fontenla-Carrera, G., & Martínez-Sánchez, J. (2023). Validation of Solid-State LiDAR Measurement System for Ballast Geometry Monitoring in Rail Tracks. Infrastructures, 8(4), 63. https://doi.org/10.3390/infrastructures8040063