Abstract
There is currently no mature calculation theory to accurately predict the settlement of high-fill subgrade. This paper developed an intelligent monitoring system to accurately predict the settlement of high-fill subgrade based on on-site experiments, and the back-propagation (BP) neural network model was used to predict the settlement of high-fill subgrade. The results show that multiple data preprocessing methods built into intelligent systems can automatically generate multi-point and correlation curves, and the system can identify and distinguish various influencing factors to improve the accuracy and reliability of monitoring data. There will be a certain initial settlement of subgrade in the initial stage after filling construction is completed, and the settlement rate at this stage is relatively fast. Afterwards, the soil enters a rapid consolidation stage, and the settlement rate of subgrade gradually slows down. Finally, the filling soil consolidation becomes stable, and the rate of subgrade settlement enters a relatively stable stage. In addition, the BP neural network model is a good method for predicting the settlement of high-fill subgrade. The research findings can provide inspiration for developing an intelligent monitoring system to accurately predict the settlement of high-fill subgrade.
1. Introduction
In order to ensure the safe operation of highways within their service life, asphalt pavements reflect high requirements for post-construction settlement, differential settlement, and road surface smoothness [,,]. It is generally required that within the design service life, the post-construction settlement of the road surface should be less than 30 cm, according to Technical Specification of China Traffic Ministry (Highway Subgrade Design and Planning, JTGD30). In addition, The bridge head subgrade should be less than 10 cm. The flatness requirements are higher, and the standard deviation should be within 1.8 mm. Moreover, settlement should not occur at the connection between artificial structures and subgrades [,]. Therefore, the prediction of the later settlement of pavement has become an important issue in highway construction.
In recent years, expressways have gradually spread from plains to mountainous areas. The geological conditions along the highway have become more and more complex, including hilly and mountainous areas. High-filling, deep excavation and half-filling, and half-excavation are extremely common, which results in the emergence of high-speed highways [,,,]. Compared with ordinary subgrades, the high-fill subgrade displays the following characteristics: large filling height, filling area, and earthwork volume of the subgrade, making it difficult to ensure the quality of filling and compaction; moreover, there are relatively numerous filling defects. The self-heavy weight of the subgrade and complex filling properties also hinder the accurate calculation of post-construction settlement [,,,]. However, there is currently no mature calculation theory for predicting settlement.
In addition, the settlement of high-fill subgrade is a long-term process, and some settlements continue long after the highway is opened to traffic [,,]. The deformation of the longitudinal and transverse sections affect the quality of traffic. As highway grades improve and driving speeds become faster and faster, subgrade deformation brings more hidden dangers to driving safety [,,]. Therefore, in-depth research on the influencing factors and prevention strategies of high-fill subgrade settlement has important theoretical significance and practical economic benefits.
Traditional approaches such as empirical formulae, the layer summation method, and Terzaghi’s consolidation theory have been used for settlement prediction [,]. These models are often implemented using finite element analysis (FEA) tools. However, their applicability is limited by reliance on precise geotechnical parameters and site-specific calibration [,]. To address this, machine learning (ML) and deep learning (DL) methods have been increasingly adopted. Techniques such as Support Vector Regression (SVR), Artificial Neural Networks (ANN), Random Forests (RF), Gradient Boosting (GBM), and Long Short-Term Memory (LSTM) networks show strong capability in capturing the nonlinear and time-dependent behavior of settlement [,,]. These models can process multi-source monitoring data and offer superior prediction accuracy, especially in complex environments.
Modern monitoring systems have evolved from manual, point-based methods to integrated networks capable of full-field, real-time, and automated observation [,]. Sensor technologies such as GNSS/GPS, fiber Bragg grating (FBG) sensors, inclinometers, laser scanners, and settlement plates are commonly used. These are often coupled with wireless communication protocols (e.g., NB-IoT, LoRa, 5G) to ensure real-time data transmission [,].
2. Research Objectives
Based on the literature, it is difficult to meet the requirements for the deformation observation of high-fill subgrade due to the long cycle time and large errors of traditional data processing methods. All in all, this paper develops an intelligent monitoring system to improve accuracy and efficiency in predicting the settlement of high-fill subgrade based on on-site experiments and BP neural network models. The three objectives in this paper are as follows:
- (1)
- To implement a full-cycle subgrade settlement monitoring system by dividing the subgrade into three height-based layers and installing sensors at specific construction stages.
- (2)
- To ensure efficient and proactive safety management by recording settlement data at 10 min intervals.
- (3)
- To enhance the predictive capability for high-fill subgrade settlement by employing back-propagation (BP) neural network models.
3. Establishment of Intelligent Monitor Systems for Subgrade
3.1. Site Parameters of Subgrade
In the current research study, the intelligent monitoring of settlement was performed during the construction period and within one year of operation for the high-fill subgrade (fill subgrade above 20 m) along the Zhenguang Expressway. Through considering the project cost, three typical high-fill subgrade sections were selected. The implementation of the intelligent monitoring of subgrade settlement, along with select road sections chosen to identify technical solutions, are shown in Table 1, and on-site photos of high-fill subgrade are shown in Figure 1.

Table 1.
Parameters of representative road sections.

Figure 1.
Overview of representative road sections (a) Side view, (b) Top view and (c) distant view.
High-fill subgrade construction starts with clearing and foundation treatment, including removal of weak soils and installation of drainage facilities, if needed. Filling is carried out in thin lifts (typically 150–300 mm loose thickness), using suitable materials—preferably well-graded granular soils—with moisture content controlled to the optimum moisture content (OMC) ± 2%. Compaction is performed using appropriate equipment, such as vibratory rollers for granular soils or sheepsfoot rollers for cohesive soils, ensuring uniform coverage and overlap.
Compaction acceptance is based on field density testing (e.g., sand cone method or nuclear density gauge) and comparison with the maximum dry density (MDD) from a Proctor test. Common specifications require ≥98% MDD (Modified Proctor) for the top 0.5 m and ≥ 95% MDD for deeper layers, with stricter requirements (up to 100% MDD) under heavily loaded areas. Adequate slope stability measures, staged filling, and drainage systems are essential to control settlement and maintain long-term stability.
Based on the above subgrade section, in the current research study, a subgrade intelligent monitoring system is used, based on high-precision sensing equipment, wireless data communication transmission, high-precision satellite positioning, and highly integrated data acquisition modules, which can achieve all-weather, automated, high-precision ground and subgrade monitoring. The intelligent monitoring of settlement ensures the safety of highway construction and operation and provides strong data support for management decision making.
3.2. Layered Drilling
After the high-precision satellite positioning measuring instrument is used to accurately determine the reference point, the hole is drilled downward at the reference point position; the hole is plumb, and the hole depth reaches the bedrock. Since the pneumatic drilling rig is very dusty during operation, a geological exploration positioning hydraulic water drilling rig is used, which is suitable for operations in various terrains and is easy to move. Considering that the diameter of the single-point settlement meter anchor head is 80 mm, a 110 mm standard rhinestone drill bit is selected, and the on-site drilling process is shown in Figure 2.
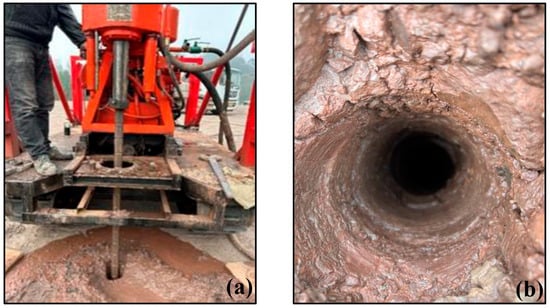
Figure 2.
The on-site program for (a) drilling and (b) hole formation.
3.3. Sensor Embedding
The settlement meter model selected for this project is JMDL4740AT, with a range of 200 mm, 0.5% FS, a sensitivity of 0.1 mm, and a gauge length of 1340 mm. The settlement meter consists of a settlement plate, an electrical displacement sensor, a measuring rod, a metal hose, an anchor head, and an extension rod, and the bottom layer is composed of opening pins. Designed using the principle of inductive magnetic flux frequency modulation technology, this method offers higher stability, reliability, and durability than that of traditional settlement meters. It displays intelligent memory and automatic storage, along with other functions. The displacement value can be intelligently displayed through the reading instrument, allowing the field test of the subgrade to be studied.
After drilling is completed, the settlement meter is inserted into the hole until the bottom anchor head is pressed to the bedrock to ensure that the settlement data measured by the sensor is accurate. At the same time, a reading instrument is used to test the initial displacement during installation, and a buried account is prepared for the single-point settlement meter after shrinkage, as shown in Figure 3.
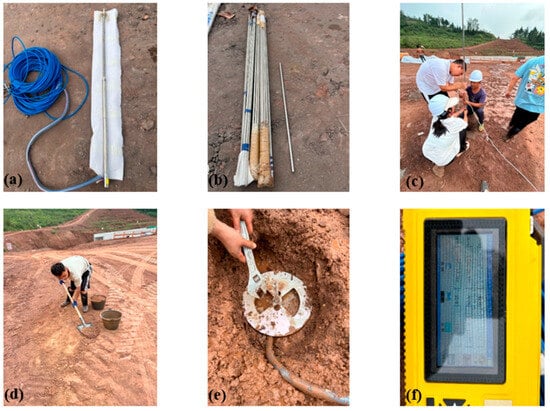
Figure 3.
The detailed process of the (a) intelligent single-point settlement meter, (b) settlement meter extension rod, (c) extension rod connection, (d) fine soil backfill, (e) settlement pan installation, and (f) measurement of settlement meter burial and installation.
3.4. Line Burial
The intelligent single-point settlement meter is buried as a whole, and the wires are led out from the side. In order not to affect the road compaction construction and improve the service life of the line, the line is protected with PVC casing (diameter 25 mm), buried 30 cm below the base level, and covered with fine soil, as shown in Figure 4.
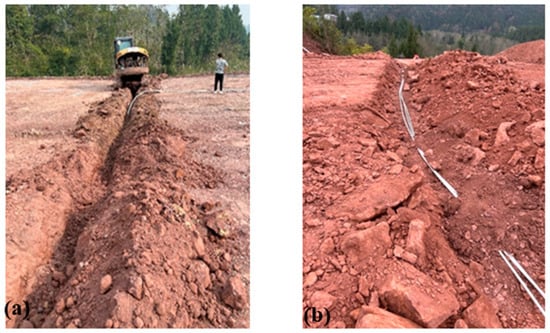
Figure 4.
Photos of the (a) aisle and (b) layout of on-site line protection.
3.5. Installation and Debugging of Automated Acquisition System
In the current research study, an automated acquisition chassis (as shown in Figure 5a) is used to collect data. It has two built-in automated acquisition modules and an intelligent power module, including DTU and lightning protection switch modules. It also contains 20 settlement meter interfaces. It is possible to monitor multiple sections, achieving collaborative monitoring. The intelligent power module is powered by solar rechargeable batteries, which can automatically manage to ensure uninterrupted power supply, strong output load capacity, and small ripple. It is also equipped with a photosynthetic silicon energy controller (as shown in Figure 5b) to achieve over-current, over-voltage, under-voltage, and short-circuit protection and can realize remote monitoring and remote control of the power supply current, voltage, power and other parameter data.
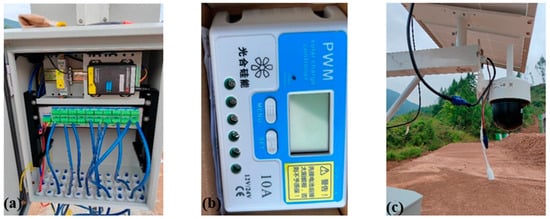
Figure 5.
Photos of the (a) automated collection chassis (b) photosynthetic silicon energy controller, and (c) ultra HD camera of the on-site line protection.
The automated collection system integrates intelligent single-point settlement meter data transmission and Hikvision-EZVIZ Cloud wireless video transmission into the engineering pulse platform, allowing real-time viewing of on-site settlement deformation and on-site conditions through the device.
4. Experimental Design
4.1. Intelligent Monitoring Solution of Subgrade
4.1.1. Technological Requirement
- (1)
- The subgrade deformation observation mainly includes surface and internal settlement observation of high-fill subgrade [,,,], settlement observation of the foundation center in the soft soil foundation treatment section, settlement observation of the subgrade slope toe in the soft soil foundation treatment section, and settlement observation of high-fill subgrade in the transition section area.
- (2)
- The settlement deformation observation section after subgrade construction should be set according to the engineering structure, topographic and geological conditions, foundation treatment methods, filling and excavation sections, subgrade height, construction methods, settlement control standards; and other specific conditions. At the same time, the observation sections should be adjusted or added based on the terrain and geological changes learned during the construction process.
- (3)
- This project mainly adopts an intelligent automatic settlement observation system for key sections of the subgrade (soft soil foundation, high fill, transition section, slope, etc.). There are three foundation treatment methods for no soft-base treatment, sand and gravel replacement, and cement mixing pile used in the current research study, as shown in Figure 6. As for controlling soil stratification, the thickness of each backfill layer is generally controlled at 30~50 cm. If different materials need to be filled in layers (such as gravel cushion + fine sand), a transition layer should be designed. At the same time, bulldozers, pavers, or loaders are used to spread fill evenly, which can avoid direct contact between materials with large particle size differences. Regarding controlling soil compaction quality, vibratory rollers are employed for sand, heavy rollers or vibratory rollers are used for gravel, and compaction tests or on-site moisture testers are used to control the moisture content within the optimal range.
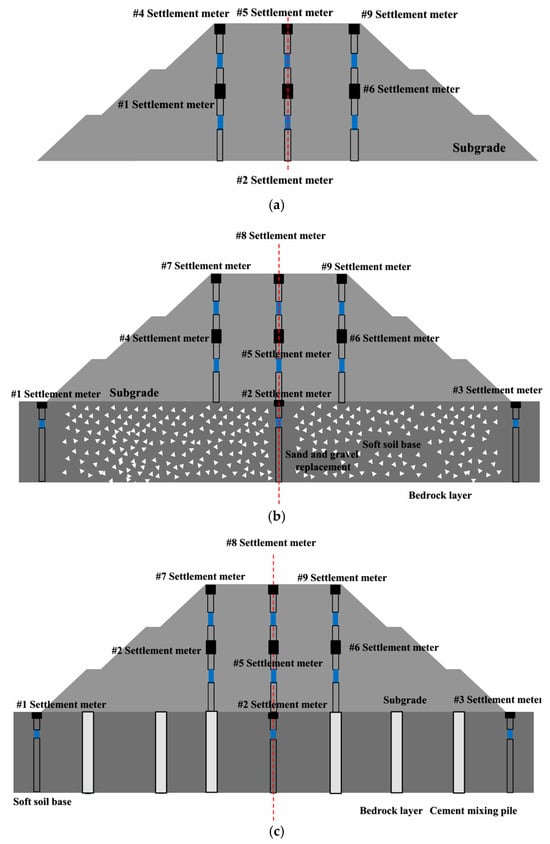 Figure 6. Schematic diagram of the subgrade treatment method using (a) no soft-base treatment, sand, (b) gravel replacement, and (c) cement mixing pile.
- (4)
- The information regarding the layout and equipment of the subgrade settlement intelligent monitoring system is as follows.
- The intelligent single-point settlement meter should be buried on the outside of the foot of the subgrade slope (measured inside the ditch), the center of the subgrade, and the shoulders on both sides. The automated chassis should be placed on the outside of the foot of the slope and equipped with an anti-theft box. After the construction site is leveled and cleared, and before subgrade filling is carried out, it is necessary to drill holes and embed the settlement meter under good weather conditions, without rain or snow. If it rains, the meter must be installed two days after the weather clears. A total of 3–5 days after the single-point settlement meter is installed, a reading instrument is used to test the initial displacement during installation behind the shrinkage cavity, and the burial specifications of the single-point settlement meter are prepared, as required.
- The intelligent single-point settlement meter is composed of an electrical displacement sensor, measuring rod, metal hose, anchor head, extension rod, and bottom opening pin.
- The intelligent single-point settlement meter exhibits an accuracy of 0.5%, a range of 400 mm, and a sensitivity of 0.01 mm, and the principle of inductor magnetic flux frequency modulation technology is designed. The product offers higher stability, reliability, and durability. It is buried as a whole, and the wires are led out from the side, which does not affect the construction of road compaction and makes the measured values consistent with the actual working conditions.
- The automation chassis adopts a standardized design and can contain two built-in automatic acquisition modules and a power module, including DTU and lightning protection switch modules, supporting up to 20 interfaces for multiple monitoring sections (such as Class I and II observation sections). In addition, collaborative monitoring can also be achieved.
- The intelligent power module is powered by solar rechargeable batteries. It can automatically manage to ensure that the power supply is not interrupted, the output load capacity is strong, and the ripple is small. At the same time, the product has over-current, over-voltage, and short-circuit protection and can realize remote monitoring and remote control of the power supply current, voltage, power, and other parameter data.
- The drill is pointed downward at the reference point, and the hole diameter should be 101 mm. In addition, the settlement meter is inserted into the hole until the bottom anchor head is pressed to the bedrock, and the instrument and installation accessories should not drop into the hole during the installation process.
4.1.2. Observation Requirements
- (1)
- The settlement observation should be carried out from the beginning of subgrade filling in the subgrade section. There should be a settlement observation and adjustment period of not less than 12 months after the subgrade filling is completed or the preload is applied.
- (2)
- The observed value of settlement displacement during subgrade filling construction should meet the following requirements: if there is an abnormality in the subgrade monitoring data, filling should be stopped immediately and resumed after the observed value returns to below the limit value.
- (3)
- During the observation period, the daily observation data must be sorted and analyzed in a timely manner, and settlement observation data must be provided to relevant units without delay [,,]. If the actual measured value of subgrade settlement exceeds the design value (Table 2), the cause should be promptly identified in conjunction with construction, survey, and design units, and geological review should be conducted, if necessary [,,]. The calculation parameters should be adjusted based on the actual measurement results, and the design-predicted settlement should be revised or settlement control measures should be taken.
 Table 2. Allowable post-construction settlement.
4.2. Back-Propagation (BP) Neural Networks Model
4.2.1. Influence Factors
The embankment settlement is determined by the BP neural network, and the prediction can be completed after the settlement law is found through training and learning with a large amount of preliminary observation data. The specific steps can be referred to in the literature [].
4.2.2. Time Series Multi-Step Rolling
The rolling prediction of the foundation settlement data is realized by taking the foundation settlement output data of the previous day as the input of the next day and continuously iterating the input data, constructing a multi-dimensional time series based on the data. Based on this, the input and output of the multi-step rolling BP neural network of the embankment settlement prediction model are shown in Table 3.

Table 3.
Input and output examples of BP neural network for embankment settlement prediction model.
5. Results and Discussions
5.1. Settlement Curve Prediction of Subgrade
A total of 15 settlement meters are buried in the K165+500 and 560 sections. Due to on-site construction and other reasons, the settlement meters of K165+500-1-1, 1-2, 1-3, 2-2, and 2-3 and K165+560-1-1, 1-3, 2-2, and 2-3 were damaged, and the data became invalid. Based on the on-site settlement monitoring results, the settlement curves of the road shoulder and the center of the subgrade are drawn, as shown in Figure 7 and Figure 8. Since the second layer of settlement meters has been buried for a short time, and the amount of monitoring data is small, the regularity is weak. As can be seen from Figure 7 and Figure 8, the consolidation rate of the subgrade soil in the initial stage of loading is slow, and the settlement rate is small. As the filling height increases, impact rolling is simultaneously carried out on site on November 26, so the soil becomes solidified. The knotting is accelerated, the settlement rate increases significantly, as does the subgrade settlement. As time goes by, the curve gradually becomes flat, and the sedimentation rate gradually becomes smaller. Judging from the current settlement of the entire test section, the cumulative maximum settlement of K165+500 is 17.8 mm, the cumulative maximum settlement of K165+560 is 35.17 mm, and the longitudinal settlement difference is 17.37 mm.
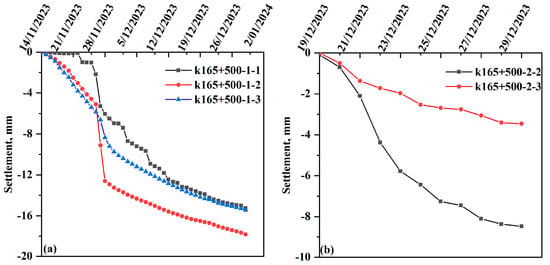
Figure 7.
The settlement curve of (a) K165+500-1 and (b) K165+500-2 in road section A on different dates.
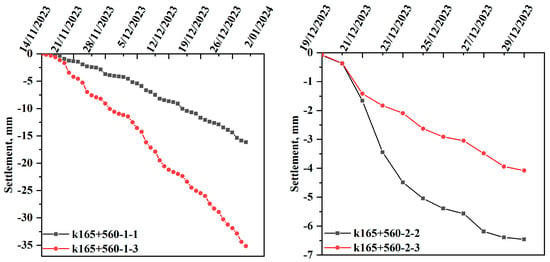
Figure 8.
The settlement curve of K165+560 in road section A on different dates.
Based on the on-site settlement monitoring results of the K272+840 section, the settlement basin diagram and settlement curve were drawn, as shown in Figure 9. As can be seen from Figure 9, the consolidation rate of the subgrade soil is slow, and the settlement rate is small at the initial stage of loading. This is mainly because the geogrid reinforcement disperses the load, reduces the local stress of the soil, and increases the stability of the soil properties, thereby reducing the compressibility of the soil. As the fill height increases, soil consolidation accelerates, and the settlement rate increases significantly, as does the subgrade settlement. As time goes by, the curve gradually becomes flat and the sedimentation rate gradually becomes smaller.
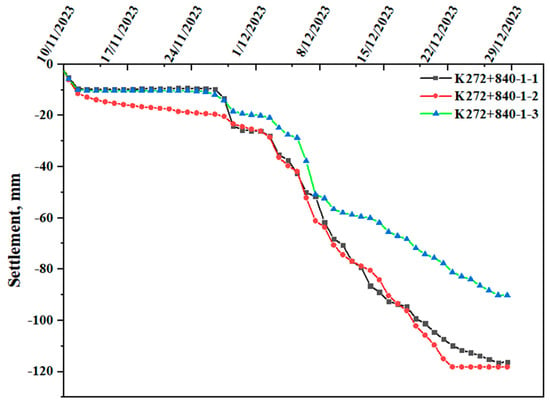
Figure 9.
The settlement curve of K272+840 in road section B on different dates.
According to the on-site settlement monitoring results of the K253+140 section, the settlement curve is drawn, as shown in Figure 10. The settlements at the road shoulder and the road center are both small. The maximum settlement at the road shoulder is 2.9 mm, and the maximum settlement at the road center is 6.2 mm. It stabilizes after a short period of minor subsidence. This is due to the fact that in the early stage after the construction of the cement mixing pile, there was a certain initial settlement due to the disturbance of the soil during the construction process and the volume change during the cement solidification process. As the consolidation of cement gradually occurs, the stiffness and load-bearing capacity of the soil will rapidly increase, leading to a stage of rapid consolidation; thus, the settlement curve rate has slowed down since December 16. After the cement mixing piles are completely consolidated, the foundation settlement rate enters a relatively stable stage. In this stage, after December 21, the bearing capacity and stability of the foundation are relatively improved, and the settlement rate gradually slows down. The final settlement of the foundation reinforced with cement mixing piles will tend to be stable in the long term. The settlement at this stage is relatively slow, and the foundation has reached a relatively stable state.
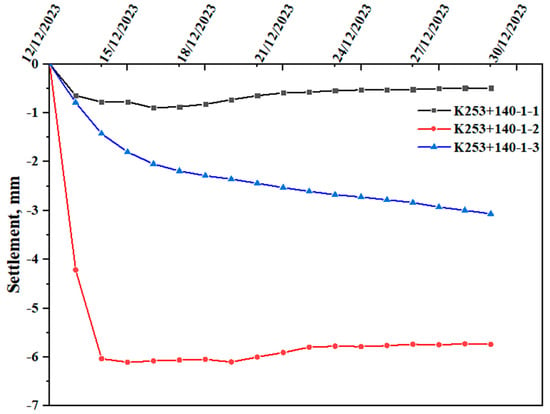
Figure 10.
The settlement curve of K253+140 in road section C on different dates.
5.2. Settlement Basin Prediction of Subgrade
From the analysis of the cross-sectional settlement basin diagram (Figure 11), it can be seen that differences in settlement have always existed during the entire filling process. The initial loading shows that the settlement of the right shoulder is larger than that of the left shoulder and the center of the road, while the settlement of the left shoulder is smaller. This was caused by long-term crushing by large machinery and engineering vehicles during the early construction of the culvert at K165+480. In the later period, as the filling height increases, the settlement of the center of the subgrade is slightly greater than that of the left and right shoulders, and the difference in settlement of the left and right shoulders is smaller. This is mainly because the load in the middle of the road is greater than that on both sides. The settlement difference between the left and right shoulders and the center of the road is 6.4 mm, and the settlement of the shoulders is about 71% of the center settlement. Overall, the differential settlement in this experimental section is not obvious.
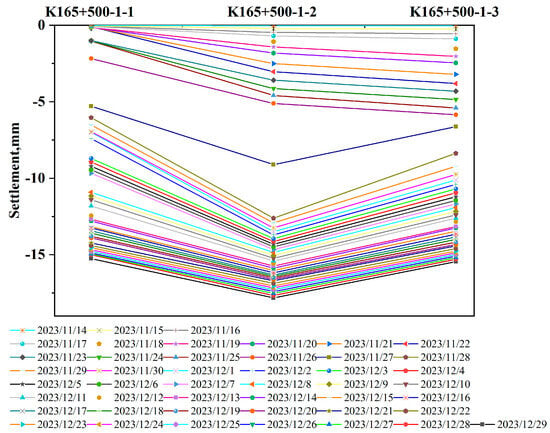
Figure 11.
The settlement basin diagram of K165+500 in road section A on different dates.
Figure 12 demonstrates the settlement basin diagram of K272+840. As can be seen from Figure 12, in the early stage of loading, the settlement of the center of the subgrade is greater than the settlement of the left and right shoulders. In the later stage, the settlement of the left shoulder is greater than that of the right shoulder and the center of the road, and the settlement of the right shoulder is smaller. The maximum settlement of the left shoulder is close to that of the road center, which is about 115 mm. The settlement of the right shoulder is 83 mm, and the settlement difference from the settlement of the road center is 32 mm. Judging from the current settlement of the entire test section, the cumulative maximum settlement of K272+840 is 115 mm, and the soil displays high compressibility.
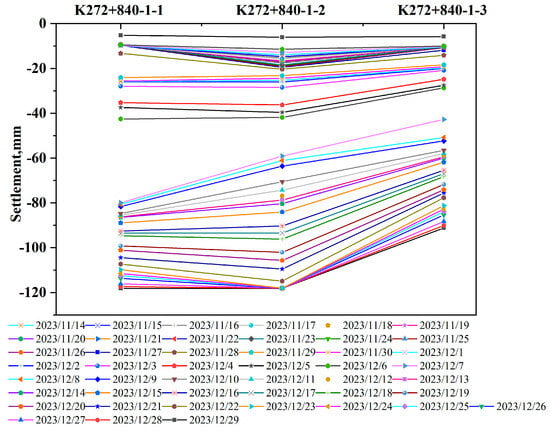
Figure 12.
The settlement basin diagram of K272+840 in road section B on different dates.
Therefore, this section uses geogrids, impact rolling reinforcement, and compaction for soft foundation treatment to reduce the compressibility of the soil, make the soil more solid, improve the soil’s bearing capacity and stability, and thereby reducing settlement.
The settlement curve of K253+140 is shown in Figure 13. From the analysis of the cross-sectional settlement basin diagram, it can be seen that differential settlement has always existed during the entire filling process. It shows that the settlement of the center of the subgrade is larger than that of the left and right shoulders, and the difference in settlement between the left and right shoulders is small. The difference in settlement between the left and right shoulders and the center of the road is about 3 mm. Overall, the differential settlement in this experimental section is not obvious. However, it should be noted that the settlement pattern after the foundation is reinforced with cement mixing piles may vary depending on factors such as geological conditions, engineering design, and construction quality. In order to accurately assess the settlement pattern, it is necessary to combine long-term settlement monitoring before and after construction and use a large amount of settlement data and early warning functions to adjust the design and construction plans in a timely manner, ensuring the stability and safety of the foundation.
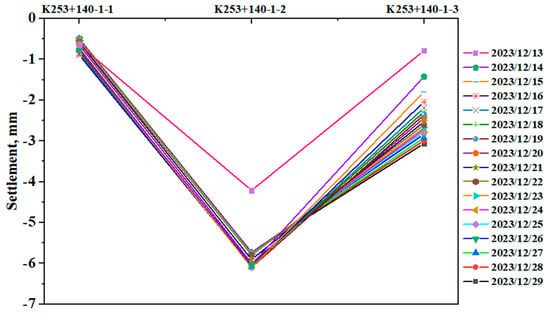
Figure 13.
The settlement basin diagram of K253+140 in road section C on different dates.
5.3. Settlement Prediction of BP Neural Network Model
The settlement data of six monitoring points K165+500-1-1, 1-2, 1-3, 2-3, 3-2, and 3-3 were selected as training samples, and the training process of the BP neural network model for the subgrade settlement is shown in Figure 14. As can be seen from Figure 14, K165+500-1-1 reaches a minimum mean square error of 9.034 × 10−06 at the 37th iteration, K165+500-1-2 reaches a minimum mean square error of 8.6775 × 10−05 at the 5th iteration, K165+500-1-3 reaches a minimum mean square error of 8.6775 × 10−05 at the 5th iteration, K156+560-1-3 reaches a minimum mean square error of 1.2893 × 10−05 at the 6th iteration, K156+560-2-3 reaches a minimum mean square error of 3.489 × 10−05 at the 5th iteration, and K156+560-3-3 reaches a minimum mean square error of 9.4819 × 10−05 at the 17th iteration. Based on these results, it can be seen that the convergence speed of each model is fast, which indicates that the network structure of the model is excellent, the goodness of fit of each network is above 0.95, and that the BP neural network model of subgrade settlement can effectively improve the nonlinear convergence rate.
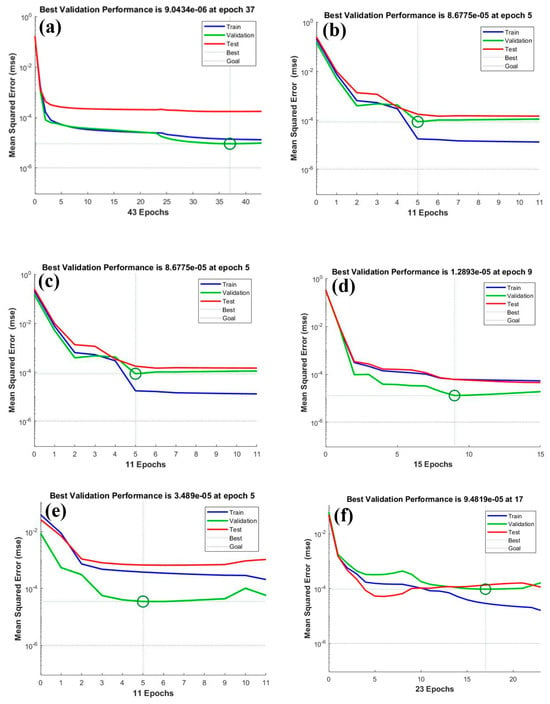
Figure 14.
Training process of neural network prediction model for subgrade (a) K156+500-1-1, (b) K156+500-1-2, (c) K156+560-1-3, (d) K156+560-2-3, (e) K156+560-3-2, and (f) K156+560-3-3 settlements.
Figure 15 shows the results of training, testing, and verification obtained after training of the K156+500-1-1 settlement data. The goodness of fit R2 of the settlement prediction model training set is 0.99992, the goodness of fit R2 of the test set is 0.99894, and the overall goodness of fit is 0.99978. Based on this, the training effect of the BP neural network model is excellent. In addition, the evaluation results for other subgrade sections can be referred to in Figures S1–S5 of the Supplementary Materials.
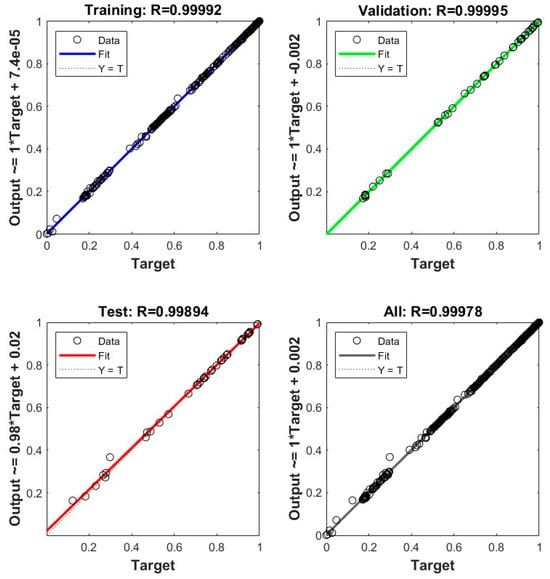
Figure 15.
Training evaluation of K156+500-1-1 subgrade settlements.
6. Conclusions and Recommendations
In the current research study, the on-site monitoring system and video surveillance system are integrated into the Engineering Pulse Internet Cloud Platform. The intelligent monitoring system, which exhibits remote monitoring capabilities, can collect data generated by sensors in real time to ensure timely acquisition of foundation settlement information, allowing engineers to monitor on-site data through the Internet at any time. In addition, the back-propagation (BP) neural network model is used to predict the settlement of high-fill subgrade. The following conclusions can be drawn.
- (1)
- The on-site monitoring system and video surveillance system are integrated into the Engineering Pulse Internet Cloud Platform, and the intelligent monitoring system can collect data generated by sensors in real time to ensure timely acquisition of foundation settlement information.
- (2)
- The layered settlement monitoring program helps to monitor the settlement of various parts of the subgrade, identify whether there is differential settlement, and enable early detection of problems that may lead to uneven settlement of the structure so that remedial measures can be taken in a timely manner.
- (3)
- The system displays a variety of built-in data preprocessing methods to automatically generate multi-point curves and correlation curves. Using data processing algorithms and analysis techniques, the system can identify and distinguish various influencing factors to improve the accuracy and reliability of monitoring data.
- (4)
- The settlement rate at the initial settlement of the subgrade is relatively fast. Afterwards, the soil enters the rapid consolidation stage. As the consolidation process of the fill gradually unfolds, the settlement rate of the subgrade gradually slows down. Finally, the rate of subgrade settlement enters a relatively stable stage.
- (5)
- Based on the above settlement rules, it is recommended to build vertical drainage channels in the foundation to accelerate the discharge of pore water during preloading or to use high-energy rammers to repeatedly tamp the ground to compact the soil and improve the density and bearing capacity to control settlement of high-fill subgrade.
The intelligent settlement monitoring system proposed in the current research study can provide real-time data and historical data analysis, which helps engineers optimize on-site construction plans, adjust construction parameters, and improve construction efficiency. Our future work will investigate the effect of loading conditions, temperature, humidity, soil properties, and secondary consolidation on the settlement prediction of high-fill subgrade based on the intelligent monitoring system developed in this paper.
Supplementary Materials
The following supporting information can be downloaded at: https://www.mdpi.com/article/10.3390/infrastructures10080220/s1, Figure S1: Data training of subgrade settlements for K156+500-1-2 based on BP neural network model; Figure S2: Data training of subgrade settlements for K156+500-1-3 based on BP neural network model; Figure S3: Data training of subgrade settlements for K156+560-1-3 based on BP neural network model; Figure S4: Data training of subgrade settlements for K156+560-2-3 based on BP neural network model. Figure S5: Data training of subgrade settlements for K156+560-3-3 based on BP neural network model.
Author Contributions
Conceptualization, M.L. and E.Y.; methodology, K.W.; software, M.L.; validation, H.Z., Y.D. and E.Y.; formal analysis, K.W.; investigation, L.T.; resources, X.Z.; data curation, J.W.; writing—original draft preparation, M.L.; writing—review and editing, H.Z.; visualization, E.Y.; supervision, E.Y.; project administration, E.Y. and H.Z.; funding acquisition, E.Y. and H.Z. All authors have read and agreed to the published version of the manuscript.
Funding
This study was supported by National Natural Science Foundation of China under Grant (52278460), the Science and Technology Department of Sichuan Province (24NSFSC0113, 23NSFSC0015), and the Postdoctoral Fellowship Program of CPSF under Grant Number GZC20251139.
Acknowledgments
All the authors offer their thanks to the Sichuan Provincial Key Laboratory of Road Engineering for providing the macroscopic instruments used to carry out the indoor pavement test.
Conflicts of Interest
The authors declare no competing interests. The author Manhong Liao was employed by the company Sichuan Digital Transportation Tech Co, Ltd. The author Kai Wang, Xin Zhou and Junxin Wang was employed by the company Sichuan Zhenguang Expressway Co., Ltd. The author Liang Tian was employed by the company Sichuan Road and Bridge Group Co., Ltd. There is no conflict of interest between any of the authors and the company.
References
- Di Zornberg, J.G.; Azevedo, M.; Sikkema, M.; Odgers, B. Geosynthetics with enhanced lateral drainage capabilities in roadway systems. Transp. Geotech. 2017, 12, 85–100. [Google Scholar] [CrossRef]
- Matias, S.R.; Ferreira, P.A. Railway slab track systems: Review and research potentials. Struct. Infrastruct. Eng. 2020, 16, 1635–1653. [Google Scholar] [CrossRef]
- Zhao, G.; Song, D.; Peng, Z.; Yan, Z. Analysis on control indicators for settlement and deformation of the rock-filled subgrade in mountainous area. Int. J. Pavement Res. Technol. 2022, 15, 213–220. [Google Scholar] [CrossRef]
- Wang, C.; Wang, B.; Guo, P.; Zhou, S. Experimental analysis on settlement controlling of geogrid-reinforced pile-raft-supported embankments in high-speed railway. Acta Geotech. 2015, 10, 231–242. [Google Scholar] [CrossRef]
- Yang, G.Q.; Liu, H.; Zhou, Y.T.; Xiong, B.L. Post-construction performance of a two-tiered geogrid reinforced soil wall backfilled with soil-rock mixture. Geotext. Geomembr. 2014, 42, 91–97. [Google Scholar] [CrossRef]
- Anbazhagan, S.; Ramesh, V. Landslide hazard zonation mapping in ghat road section of Kolli hills, India. J. Mt. Sci. 2014, 11, 1308–1325. [Google Scholar] [CrossRef]
- Dunning, S.A.; Massey, C.I.; Rosser, N.J. Structural and geomorphological features of landslides in the Bhutan Himalaya derived from Terrestrial Laser Scanning. Geomorphology 2009, 103, 17–29. [Google Scholar] [CrossRef]
- Jin, H.; Hao, J.; Chang, X.; Zhang, J.; Yu, Q.H.; Qi, J.; Lü, L.; Wang, S. Zonation and assessment of frozen-ground conditions for engineering geology along the China–Russia crude oil pipeline route from Mo’he to Daqing, Northeastern China. Cold Reg. Sci. Technol. 2010, 64, 213–225. [Google Scholar] [CrossRef]
- Abella, E.A.C.; Van Westen, C.J. Qualitative landslide susceptibility assessment by multicriteria analysis: A case study from San Antonio del Sur, Guantánamo, Cuba. Geomorphology 2008, 94, 453–466. [Google Scholar] [CrossRef]
- Wang, K.; Zhang, J.; Gao, G.; Qiu, J.; Zhong, Y.; Guo, C.; Zhao, W.; Tang, K.; Su, X. Causes, risk analysis, and countermeasures of urban road collapse in China from 2019 to 2020. J. Perform. Constr. Facil. 2022, 36, 04022054. [Google Scholar] [CrossRef]
- Zheng, J.L.; Zhang, R.; Yang, H.P. Highway subgrade construction in expansive soil areas. J. Mater. Civ. Eng. 2009, 21, 154–162. [Google Scholar] [CrossRef]
- Liu, J.; Zou, D.; Kong, X. A three-dimensional state-dependent model of soil–structure interface for monotonic and cyclic loadings. Comput. Geotech. 2014, 61, 166–177. [Google Scholar] [CrossRef]
- Zhang, Q.; Liu, T.; Zhang, Z.; Huangfu, Z.; Li, Q.; An, Z. Unmanned rolling compaction system for rockfill materials. Autom. Constr. 2019, 100, 103–117. [Google Scholar] [CrossRef]
- Wang, R.; Hu, Z.; Ma, J.; Ren, X.; Li, F.; Zhang, F. Dynamic response and long-term settlement of a compacted loess embankment under moving train loading. KSCE J. Civil Eng. 2021, 25, 4075–4087. [Google Scholar] [CrossRef]
- Zhu, C.; Li, N. Ranking of influence factors and control technologies for the post-construction settlement of loess high-filling embankments. Comput. Geotech. 2020, 118, 103320. [Google Scholar] [CrossRef]
- Wang, H.; Zhang, W.; Zhang, Y.; Xu, J. A bibliometric review on stability and reinforcement of special soil subgrade based on CiteSpace. J. Traffic Transp. Eng. (Engl. Ed.) 2022, 9, 223–243. [Google Scholar] [CrossRef]
- Wang, X.; Dong, X.; Zhang, Z.; Zhang, J.; Ma, G.; Yang, X. Compaction quality evaluation of subgrade based on soil characteristics assessment using machine learning. Transp. Geotech. 2022, 32, 100703. [Google Scholar] [CrossRef]
- Benedetto, A.; Pensa, S. Indirect diagnosis of pavement structural damages using surface GPR reflection techniques. J. Appl. Geophys. 2007, 62, 107–123. [Google Scholar] [CrossRef]
- Nautiyal, A.; Sharma, S. Methods and factors of prioritizing roads for maintenance: A review for sustainable flexible pavement maintenance program. Innov. Infrastruct. Solut. 2022, 7, 190. [Google Scholar] [CrossRef]
- Chen, Z.J.; Feng, W.Q.; Yin, J.H. A new simplified method for calculating short-term and long-term consolidation settlements of multi-layered soils considering creep limit. Comput. Geotech. 2021, 138, 104324. [Google Scholar] [CrossRef]
- Ren, Y.; Zhang, Z.; Huang, M. A review on settlement models of municipal solid waste landfills. Waste Manag. 2022, 149, 79–95. [Google Scholar] [CrossRef]
- Phoon, K.K.; Cao, Z.J.; Ji, J.; Leung, Y.F.; Najjar, S.; Shuku, T.; Tang, C.; Yin, Z.-Y.; Ikumasa, Y.; Ching, J. Geotechnical uncertainty, modeling, and decision making. Soils Found. 2022, 62, 101189. [Google Scholar] [CrossRef]
- Tolooiyan, A.; Gavin, K.; Dyson, A.P. Estimation of spudcan penetration in variable sand deposits with the Arbitrary Lagrangian Eulerian Finite Element Method. Ocean Eng. 2023, 281, 114955. [Google Scholar] [CrossRef]
- Ren, J.J.; Liu, W.; Du, W.; Zheng, J.L.; Wei, H.; Zhang, K.Y.; Ye, W.L. Identification method for subgrade settlement of ballastless track based on vehicle vibration signals and machine learning. Constr. Build. Mater. 2023, 369, 130573. [Google Scholar] [CrossRef]
- Kardani, N.; Kumar, A.; Kumar, S.; Karr, O.; Bardhan, A. A Deep Learning Approach for Modelling of Resilient Modulus of Compacted Subgrade Subjected to Freezing-Thaw Cycles and Moistures. Transp. Infrastruct. Geotechnol. 2024, 11, 3805–3828. [Google Scholar] [CrossRef]
- Thapa, I.; Ghani, S. Explainable AI-Enhanced Machine Learning for CBR Prediction in Stabilized and Unstabilized Subgrade Soils. Appl. Soft Comput. 2025, 178, 113275. [Google Scholar] [CrossRef]
- Shao, Y.; Li, L.; Li, J.; Li, Q.; An, S.; Hao, H. Out-of-plane full-field vibration displacement measurement with monocular computer vision. Autom. Constr. 2024, 165, 105507. [Google Scholar] [CrossRef]
- Huang, Y.; Feng, R.; Zhong, C.; Tong, X.; Shao, X.; Gu, L.; Hui, Z. Computer vision-based real-time deflection monitoring of complex and sizeable steel structures. Eng. Struct. 2024, 305, 117752. [Google Scholar] [CrossRef]
- Wang, Z.; Zhu, J.; Ma, T. Review on monitoring of pavement subgrade settlement: Influencing factor, measurement and advancement. Measurement 2024, 237, 115225. [Google Scholar] [CrossRef]
- Zhang, J.; Liu, L.; Yang, H. An overview of intelligent construction and maintenance technology for highway subgrade engineering. Intell. Transp. Infrastruct. 2023, 2, liad019. [Google Scholar] [CrossRef]
- Chen, D.; Ling, J.; Li, D.; Zheng, C. Monitoring and evaluating techniques of highway subgrade safety in the operation period. Road Mater. Pavement Des. 2017, 18, 215–225. [Google Scholar] [CrossRef]
- Wei, K.H.; Pei, X.J.; Zhang, S.S.; Ran, C.Y.; Xiao, H.B.; Li, T.T. Deformation Characteristics of a Vertical Support Structure in a High-Filled Loess Slope Associated with Temperature Fluctuations. Soil Mech. Found. Eng. 2021, 58, 353–360. [Google Scholar] [CrossRef]
- Yao, Y.; Zhang, Y.; Ma, C.; Zhao, Y.; Lv, G. Study on deformation of filling composite geological body in loess mountainous area. Nat. Hazards 2022, 110, 1469–1493. [Google Scholar] [CrossRef]
- Bae, A.; Stoffels, S.M.; Antle, C.E.; Lee, S.W. Observed evidence of subgrade moisture influence on pavement longitudinal profile. Can. J. Civil Eng. 2008, 35, 1050–1063. [Google Scholar] [CrossRef]
- Heydinger, A.G. Evaluation of seasonal effects on subgrade soils. Transp. Res. Rec. 2003, 1821, 47–55. [Google Scholar] [CrossRef]
- Hossain, M.; Romanoschi, S.; Gisi, A.J. Seasonal and spatial variation of subgrade response. In Pavement Subgrade, Unbound Materials, and Nondestructive Testing; American Society of Civil Engineers: Reston, VA, USA, 2000; pp. 150–166. [Google Scholar]
- Ntambakwa, E.; Yu, H.; Guzman, C.; Rogers, M. Geotechnical design considerations for onshore wind turbine shallow foundations. In Geotechnical and Structural Engineering Congress 2016; American Society of Civil Engineers: Reston, VA, USA, 2016; pp. 1153–1165. [Google Scholar]
- Qian, W.; Qi, T.; Zhao, Y.; Le, Y.; Yi, H. Deformation characteristics and safety assessment of a high-speed railway induced by undercutting metro tunnel excavation. J. Rock Mech. Geotech. Eng. 2019, 11, 88–98. [Google Scholar] [CrossRef]
- Yang, E.; Wang, K.; He, J.; Liu, K.; Wang, J.; Zhang, H.; Qiu, Y. Settlement prediction of a high embankment based on non-linear regression and neural network algorithm. Transp. Geotech. 2025, 50, 101443. [Google Scholar] [CrossRef]
Disclaimer/Publisher’s Note: The statements, opinions and data contained in all publications are solely those of the individual author(s) and contributor(s) and not of MDPI and/or the editor(s). MDPI and/or the editor(s) disclaim responsibility for any injury to people or property resulting from any ideas, methods, instructions or products referred to in the content. |
© 2025 by the authors. Licensee MDPI, Basel, Switzerland. This article is an open access article distributed under the terms and conditions of the Creative Commons Attribution (CC BY) license (https://creativecommons.org/licenses/by/4.0/).