Article

Quantitative Risk Analysis Framework for Cost and Time Estimation in Road Infrastructure Projects

by
Victor Andre Ariza Flores
* and
Gerber Zavala Ascaño
Escuela de Posgrado, Universidad Nacional Federico Villarreal, San Miguel 15088, Peru
*
Author to whom correspondence should be addressed.
Infrastructures 2025, 10(6), 139; https://doi.org/10.3390/infrastructures10060139
Submission received: 27 March 2025 / Revised: 17 April 2025 / Accepted: 22 April 2025 / Published: 5 June 2025

Abstract

Inaccurate cost and schedule estimations in road infrastructure projects continue to be a critical source of contractual disputes and financial inefficiencies, particularly in developing countries. While quantitative risk analysis (QRA) methods such as Monte Carlo simulation (MCS) and schedule risk analysis (SRA) are well-established in the literature, their practical adoption remains limited in contexts with low technical capacity and limited access to advanced modeling tools. This study addresses this gap by proposing a practical and accessible quantitative risk analysis framework tailored to the needs of professionals with limited expertise in probabilistic techniques. The framework combines MCS and SRA using probability distributions (PERT, triangular, and normal) and was empirically validated through three road projects in Peru. Results indicated substantial reductions in uncertainty, achieving cost contingency estimates between 1.34% and 11% which were significantly lower than documented overruns of up to 32.29%. Schedule contingencies ranged from 28.71% to 91.67%, markedly improving accuracy. The novelty of this research lies in its context-adapted implementation strategy, offering a robust and easily replicable approach for similar infrastructure environments in Latin America and beyond. This contribution bridges the gap between theoretical risk modeling and its practical adoption, thus enhancing the reliability of infrastructure planning under resource-constrained conditions.

1. Introduction

Worldwide, road infrastructure projects have persistently faced challenges in cost and schedule estimation, resulting in recurrent cost overruns and delay [1,2]. These deviations not only affect the financial viability of the projects but also delay the delivery of the expected social and economic benefits.
Annually, the World Economic Forum (WEF) publishes the Global Competitiveness Report, evaluating 141 economies worldwide using 12 criteria to assess a country’s competitiveness, with infrastructure being one of the main factors [3]. In this report, Peru ranked 65th globally and 88th in the infrastructure category, highlighting the conclusion that improvements in road infrastructure would enhance its overall competitiveness ranking. Another relevant index is the IMD World Competitiveness Ranking, which also emphasizes the importance of infrastructure as a key factor for economic performance [4]. According to the IMD, as of 2023, Peru ranked 55th out of 64 evaluated countries [5] and continues to receive a low score in infrastructure. This underscores the urgent need to accelerate the execution of infrastructure projects, particularly road infrastructure, to boost the country’s competitiveness.
In Peru, the long-term infrastructure gap amounts to USD 120 billion [6]. However, despite the existence of policies and strategies aimed at promoting infrastructure development, a technical study determined that by the end of 2024, there were 2648 stalled public works projects representing an investment of USD 15 billion [7]. Various studies on the quality of public investment in Peru highlight that the main causes of project paralysis are contractual breaches, the lack of financial resources, and disputes during project execution. These causes are closely associated with deficiencies in cost and schedule estimation during the bidding phase of infrastructure projects.
Since 2017, Peru’s Public Procurement Law has promoted risk management, but only through a qualitative risk analysis approach [8,9] primarily based on the PMBOK methodology [10,11]. In 2025, under a new law, a quantitative risk analysis approach was incorporated; however, no specific method was established for its implementation.
Given the challenge of efficiently promoting public investment in road infrastructure, this research developed a quantitative risk analysis methodology to optimize cost and time estimation in Peruvian road projects.

2. Literature Review

2.1. Cost and Time Estimation Issues in Road Infrastructure Projects

Studies indicate that 98% of road infrastructure projects have exceeded their budgets or experienced delays [12], and that this problem has persisted over the last 70 years, with underestimation being one of its main causes [13]. Moreover, various studies indicate that traditional methods for estimating costs and schedules represent the primary obstacle in project management [14], leading to contractual breaches and disputes in arbitration tribunals or courts.
Deterministic estimation methods have been strongly criticized in recent years [15,16,17] due to their inability to incorporate uncertainty and their lack of integration with advanced computational tools, which currently offer better solutions for engineering.
Table 1 illustrates the emblematic cases of road projects in different countries, showing significant deviations between the originally estimated budgets and schedules and the final outcomes.

2.2. Integration of Quantitative Techniques in Cost and Schedule Estimation

To achieve this goal, this study identified appropriate quantitative analysis techniques applicable to the estimation of costs and schedules. The simulation techniques were selected through a systematic literature review, highlighting Monte Carlo simulation and schedule risk analysis. Likewise, the probability distribution functions applicable to cost and time analysis were identified, including the normal, beta PERT, triangular, and uniform distributions, with the possibility of incorporating distribution fitting for a broader dataset. The proposed method was applied to three case study road projects: the Oyon-Ambo Road, the Combapata Local Road, and the New Central Highway.

2.3. Barriers to the Use of Quantitative Methods in Developing Countries

Although various advanced methodologies for quantitative risk analysis exist and are internationally recognized [10,23,24], their application in contexts such as Peru faces significant limitations—mainly due to limited dissemination and insufficient technical training in advanced statistical and probabilistic techniques [25].
Consequently, the main contribution of this study is not to introduce a novel or highly sophisticated approach, but rather to provide a practical, accessible, and technically sound methodology tailored for environments with low expertise in quantitative risk analysis.

2.4. Contribution of the Proposed Framework

This study contributes to the literature by developing an integrated quantitative risk analysis methodology that simultaneously addresses cost and schedule uncertainty in road infrastructure projects—an area where previous studies have identified a significant research gap [15,17,25,26]. In contrast to traditional approaches that tend to assess cost and schedule risks separately [16,27,28], this research presents a structured approach that can be adapted and tested in similar contexts. The proposed methodology is explicitly designed for conditions characterized by high uncertainty, limited historical data, and insufficient technical capacity—the typical features of infrastructure development in Peru and other Latin American countries. Moreover, the framework serves as an introductory and implementation-oriented tool for professionals unfamiliar with advanced quantitative techniques, thus enabling the wider and more effective adoption of risk analysis practices in public and private projects.

2.5. Quantitative Risk Analysis Techniques Methodology

In the field of quantitative analysis applied to project management and decision-making, various techniques are employed, grouped into categories such as statistical analysis, mathematical modeling, simulation, and artificial intelligence. Among the most prominent techniques are contingency reserve estimation, decision tree analysis, Monte Carlo simulation, and machine learning, all of which are supported by an extensive body of the literature. The results of the systematic literature review are presented in Table 2.

2.6. Probability Distribution Functions in Cost and Time Modeling

Probability distribution functions allow for modeling uncertainty in cost and time estimation in infrastructure projects. Table 3 presents the main distributions used in quantitative risk analysis, their applications, and the number of studies supporting their use.

2.7. Barriers to the Implementation of Advanced Quantitative Techniques

In recent years, various studies have validated the effectiveness of sophisticated quantitative techniques in risk management for infrastructure projects. Internationally, Garrido Martins [26] proposed a Monte Carlo simulation model for fast-track construction projects, achieving schedule optimization and cost minimization. Chau Hai Le [28] applied multi-objective optimization and pattern mining to enhance decision-making in road infrastructure projects, while Senić et al. [75] utilized Sugeno fuzzy logic to predict delays and cost overruns in high-uncertainty scenarios.
While these methods represent significant advancements in the field, their practical application in developing countries such as Peru remains limited. This limitation stems primarily from the insufficient dissemination of quantitative methodologies and the lack of specialized training among construction professionals. As a result, advanced models—although theoretically robust—often remain inaccessible or impractical for routine project implementation in these regions.

3. Materials and Methods

3.1. Methodological Scheme

The research methodology was structured into three main stages, as shown in Figure 1. The first stage defined the study object, including the identification of the research problem, formulation of objectives and hypotheses, and selection of relevant variables. The second stage focused on identifying appropriate quantitative analysis techniques (QATs) and probability distribution functions (PDFs) through a systematic review of academic and non-academic sources, complemented by expert surveys to validate the selection. The third stage involved the application of the proposed methodology to the case studies, beginning with the collection of cost (CAPEX/OPEX) and schedule data, followed by the implementation of stochastic simulations—Monte Carlo simulation for cost estimation and schedule risk analysis for time estimation. The process concluded with a sensitivity analysis and decision-making regarding contingency allocations. This sequence provided a structured and replicable framework for probabilistic cost and time estimation in road infrastructure projects.

3.2. Theoretical Framework

3.2.1. Probability Distribution Function

Probability distribution functions (PDFs) enable the modeling of uncertainty in cost and schedule estimation by describing the likelihood that a random variable takes certain values within a specific range. In this study, three main distributions were used: the normal distribution, suitable for variables with symmetrical variability around a mean and when extensive historical data are available; the triangular distribution, applied when data availability is limited and expert judgment is required to estimate the minimum, most likely, and maximum values; and the beta PERT distribution, used similarly to the triangular distribution but offering a smoother representation of uncertainty based on expert-estimated extreme values and the most likely value.
The selection of these distributions follows methodological recommendations pro-vided by internationally recognized technical guidelines such as AACE and PMI, by carefully considering the availability and quality of historical data, the specific complexity of the projects analyzed, and expert judgment. Additionally, these distributions were chosen due to their familiarity among the professionals involved in infrastructure project risk management, their widespread understanding, and their proven suitability for analyzing cost and schedule risks.

3.2.2. Monte Carlo Simulation

The Monte Carlo simulation [71] was employed to quantitatively assess uncertainty in cost and schedule estimations for the construction projects analyzed in this study. Multiple simulations were conducted by varying the input variables according to predefined probability distributions, specifically normal, triangular, and beta PERT, selected based on data availability and expert judgment. The number of iterations was determined by evaluating the stability and convergence of the probabilistic outcomes. Initially, 5000 iterations were performed, subsequently increasing to 10,000, 50,000, and finally 100,000 simulations, to ensure sufficient stability in key percentile estimates (e.g., the 95th percentile, P95). This progressive increment in the number of simulations aligned with international best practices recommended by recognized technical guidelines such as AACE and PMI, aimed at ensuring robust, reliable, and convergent probabilistic estimates for project contingencies and potential risks.
In this study, the @RISK software version 8.4 [76], developed by the Palisade Corporation, was employed to generate all the probability distributions and sensitivity analysis charts. This tool integrates with Microsoft Excel and MS Project, allowing seamless Monte Carlo simulations and tornado diagram generation. The use of @RISK ensured standardized probabilistic modeling and enhanced the reliability of contingency estimations for both cost and schedule.

3.2.3. Schedule Risk Analysis

In this research, schedule risk analysis (SRA) was employed to quantitatively evaluate uncertainty in the time estimation of the analyzed projects. Although SRA is not yet widely known or frequently used in the Peruvian context [77], its selection is justified by its foundation in Monte Carlo simulation and the capability of integration with widely recognized software in Peru, such as MS Project. Specifically, the @Risk software was utilized, allowing for probabilistic analyses directly on the schedules generated in MS Project, thereby facilitating practical implementation.
SRA enabled the identification of critical activities with the highest potential for delays, provided quantitative evaluation of their impact on the overall schedule, and facilitated improved planning and data-driven decision-making. Due to this technological integration and the use of tools familiar to infrastructure project professionals, the proposed method is accessible and easy to understand, particularly for practitioners who are less experienced with advanced quantitative techniques for managing project schedules.

3.3. Research Methodology

3.3.1. Research Hypotheses and Statistical Validation

This study employed a quantitative and applied research methodology to specifically address practical challenges in risk management for road infrastructure projects in Peru. A quantitative approach was selected to ensure objective measurement and consistent hypothesis testing through statistical analyses, allowing a clear assessment of the relationship between the proposed quantitative risk analysis method and improvements in cost and schedule estimations.
A hypothetico-deductive approach guided the research, beginning with the identification of real-world problems in risk management practices, followed by formulating specific hypotheses about how quantitative methods could optimize the project outcomes. Empirical data collected from actual infrastructure projects served to verify these hypotheses.
To strengthen the methodological structure of this study, a set of research hypotheses were formulated within a hypothetico-deductive framework. These hypotheses aimed to assess whether the application of the proposed quantitative risk analysis methodology would lead to statistically significant improvements in cost and time estimation when compared to traditional deterministic methods.
Hypothesis 0 (H₀).
There is no statistically significant difference between cost and time estimates obtained through the proposed quantitative risk analysis methodology and those derived from deterministic planning techniques.
Hypothesis 1 (H₁).
There is a statistically significant difference between cost and time estimates obtained through the proposed quantitative risk analysis methodology and those derived from deterministic planning techniques.
To test these hypotheses, simulation results were compared against the original deterministic estimates for each case study. For cost estimation, comparisons were made between the deterministic baseline, simulated mean, and P95 percentiles from the Monte Carlo simulations. For time estimation, deterministic durations were compared to the simulated durations derived from schedule risk analysis (SRA). The statistical significance of the differences was evaluated using two-sample t-tests, assessing whether the differences observed were attributable to the probabilistic treatment of uncertainty rather than random variation.
Furthermore, convergence of the simulation results was verified by comparing outputs across the increasing numbers of iterations (5000, 10,000, 50,000, and 100,000), ensuring consistency and robustness of the findings. The integration of these statistical tests strengthened the empirical evidence supporting the use of probabilistic methods in infrastructure project planning.
Considering the nature of this study, statistical analyses were conducted to assess whether significant associations existed between the application of the proposed methodology and improved risk management results. While correlational analyses provide valuable insights, they cannot establish causality. Therefore, future research could benefit from integrating experimental or quasi-experimental designs and employing longitudinal studies to capture the impact of the methodology across different project phases, offering deeper validation and insight compared to traditional methods

3.3.2. Population and Sampling Strategy

The target population of this study comprised Peru’s national road network, covering approximately 23,687 km, of which 83.7% are paved. Using the stratified sampling formula shown in Equation (1) [78], the required sample size for representativeness at a 95% confidence level with a 5% margin of error was approximately 378 km.
n = N . Z 2 . p . ( 1 p ) e 2 . N 1 + Z 2 . p . ( 1 p )
However, due to practical constraints (the availability of detailed project data, the ease of data access, and the representativeness of typical road construction challenges in Peru), a non-probabilistic convenience sample totaling exactly 378 km was intentionally selected. This sample included three projects: the New Central Highway (185 km), chosen for its complexity involving tunnels and viaducts; the Oyon-Ambo Road (150 km), representing common roadway expansion challenges; and the Combapata Road (43 km), exemplifying rural infrastructure projects with specific environmental conditions. These cases were carefully selected to ensure practical relevance and sufficient representativeness of the typical scenarios encountered in Peru’s road construction sector.

3.4. Technical Methodology

3.4.1. Quantitative Risk Analysis Techniques

Quantitative risk analysis techniques were identified through a systematic literature review. Various studies have tested multiple techniques, highlighting Monte Carlo simulation and expected monetary value as the most used. However, the selection of techniques focused on those with the greatest application in the construction sector. The PMI [10] proposed an extensive list of techniques, but priority was given to those most frequently applied in infrastructure projects. For this identification process, a systematic review was conducted in specialized databases such as Scopus, Web of Science, and ProQuest, selected for their broad coverage in construction, engineering, and safety. The search strategy, structured with Boolean operators, as shown in Appendix A.1, followed a systematic approach, defining key terms and their synonyms related to construction accidents, risk analysis, and quantitative methods.
Monte Carlo simulation (MCS) and schedule risk analysis (SRA) were selected in this study because they allowed for the incorporation of probabilistic inputs into cost and time estimations, respectively. MCS enabled the representation of variability in cost estimates by simulating multiple scenarios based on defined probability distributions. SRA incorporated uncertainty directly into the project schedule, facilitating the identification of potential delays and their contributing factors. Compared to methods such as expected monetary value or basic sensitivity analysis, MCS and SRA provided a framework for analyzing the interaction of multiple risk variables within complex project environments. These techniques are included in international guidelines, such as those of PMI and AACE, and their implementation is feasible using tools like @RISK and MS Project, which are increasingly being adopted in infrastructure projects in Peru. Their selection responded to the objective of this research: to develop a practical quantitative approach that can be applied in professional contexts with the limited prior use of probabilistic methods.
Although no new simulation algorithms were developed, the methodological contribution of this study lies in the adaptation, integration, and validation of quantitative risk techniques within an operational framework suitable for developing country infrastructure contexts.

3.4.2. Probability Distribution Function (PDF)

Probability distribution functions (PDFs) play a crucial role in data analysis, risk assessment, and reliability modeling across various fields [79]. They provide a theoretical basis for describing data characteristics and enable quantitative analysis and prediction. The most widely used models include the normal distribution, the PERT distribution (or beta PERT), and the triangular distribution. The latter two are based on the three-point estimation model, extensively studied by Keefer [80,81].
In practice, different distributions are commonly used, such as normal, log-normal, uniform, exponential, and Weibull, each identified by specific parameters [82]. These functions are particularly valuable for modeling skewed datasets and evaluating extreme events in actuarial risk analysis [83]. In the context of energy systems, probability distribution functions are employed to assess reliability performance, using indices such as the average frequency and duration of system interruptions [84]. The selection and application of appropriate probability distribution functions can significantly enhance the accuracy and efficiency of data analysis, providing valuable support for decision-making processes across disciplines [85].
To identify the most frequently used probability distribution functions for cost and time estimation in road projects, a search was conducted combining the literature from related sectors and non-academic sources, including technical manuals, consulting reports, and specialized theses. Finally, the information from these sources was triangulated to identify the criteria explaining the selection of each distribution function and its applicability to road construction projects.

3.5. Case Study

The proposed method was applied to three road projects used as case studies. The first was the New Central Highway, a project in the engineering development phase at the time of the research. The project consisted of a 185 km extension and included tunnels, bridges, and dual carriageway sections. It had an estimated execution time of ten years, with an estimated investment of PEN 24,000 million.
The second case study involved the Oyon-Ambo Road, approximately 140 km in length, which connects the Lima region with Huánuco through the expansion of roadways, the construction of bridges and tunnels, and the implementation of drainage and signage systems. It had a budget exceeding one billion soles and an estimated execution period of four to five years.
The third case study involved the Local Road PE-3S in Combapata, which rehabilitated routes in the Cusco region, improving road infrastructure in rural towns. It had an extension of 23 km and an estimated execution time of two years. The initial cost and time data for the three projects studied are shown in Table 4.
All cost and time data were extracted from official project budgets and schedules, verified during design or construction phases. No missing data were encountered, and thus no imputation techniques were applied.

4. Results

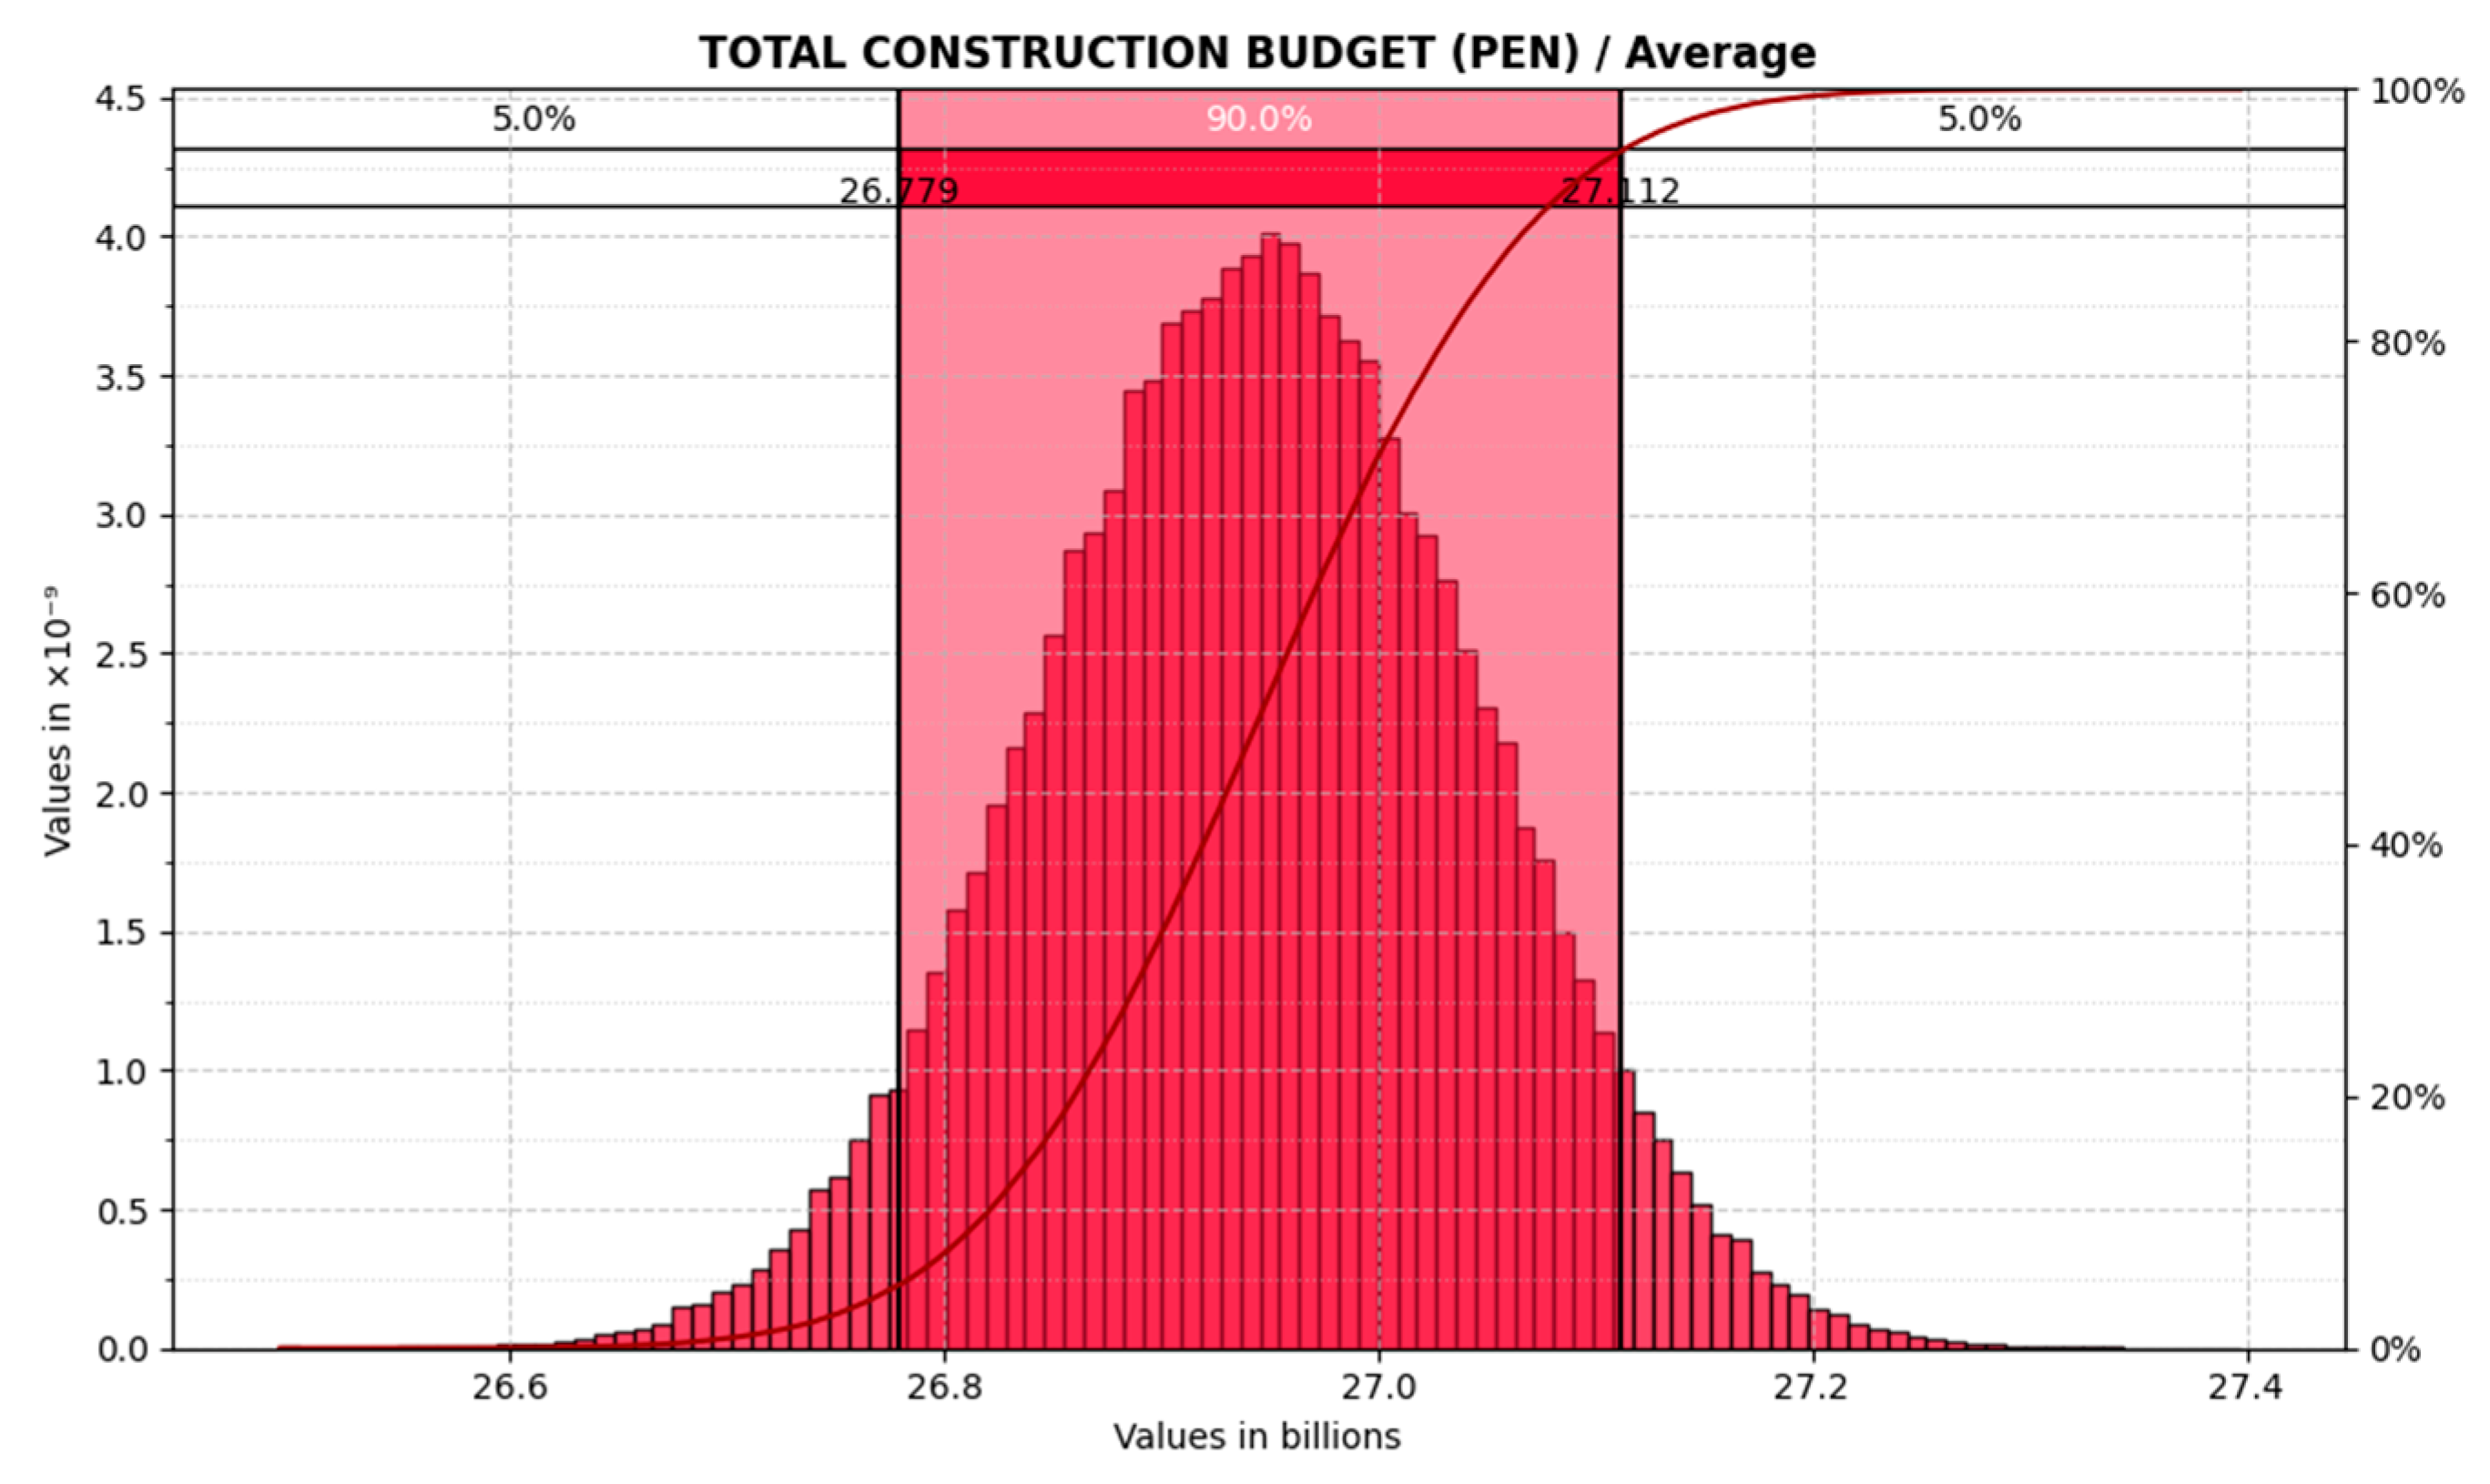
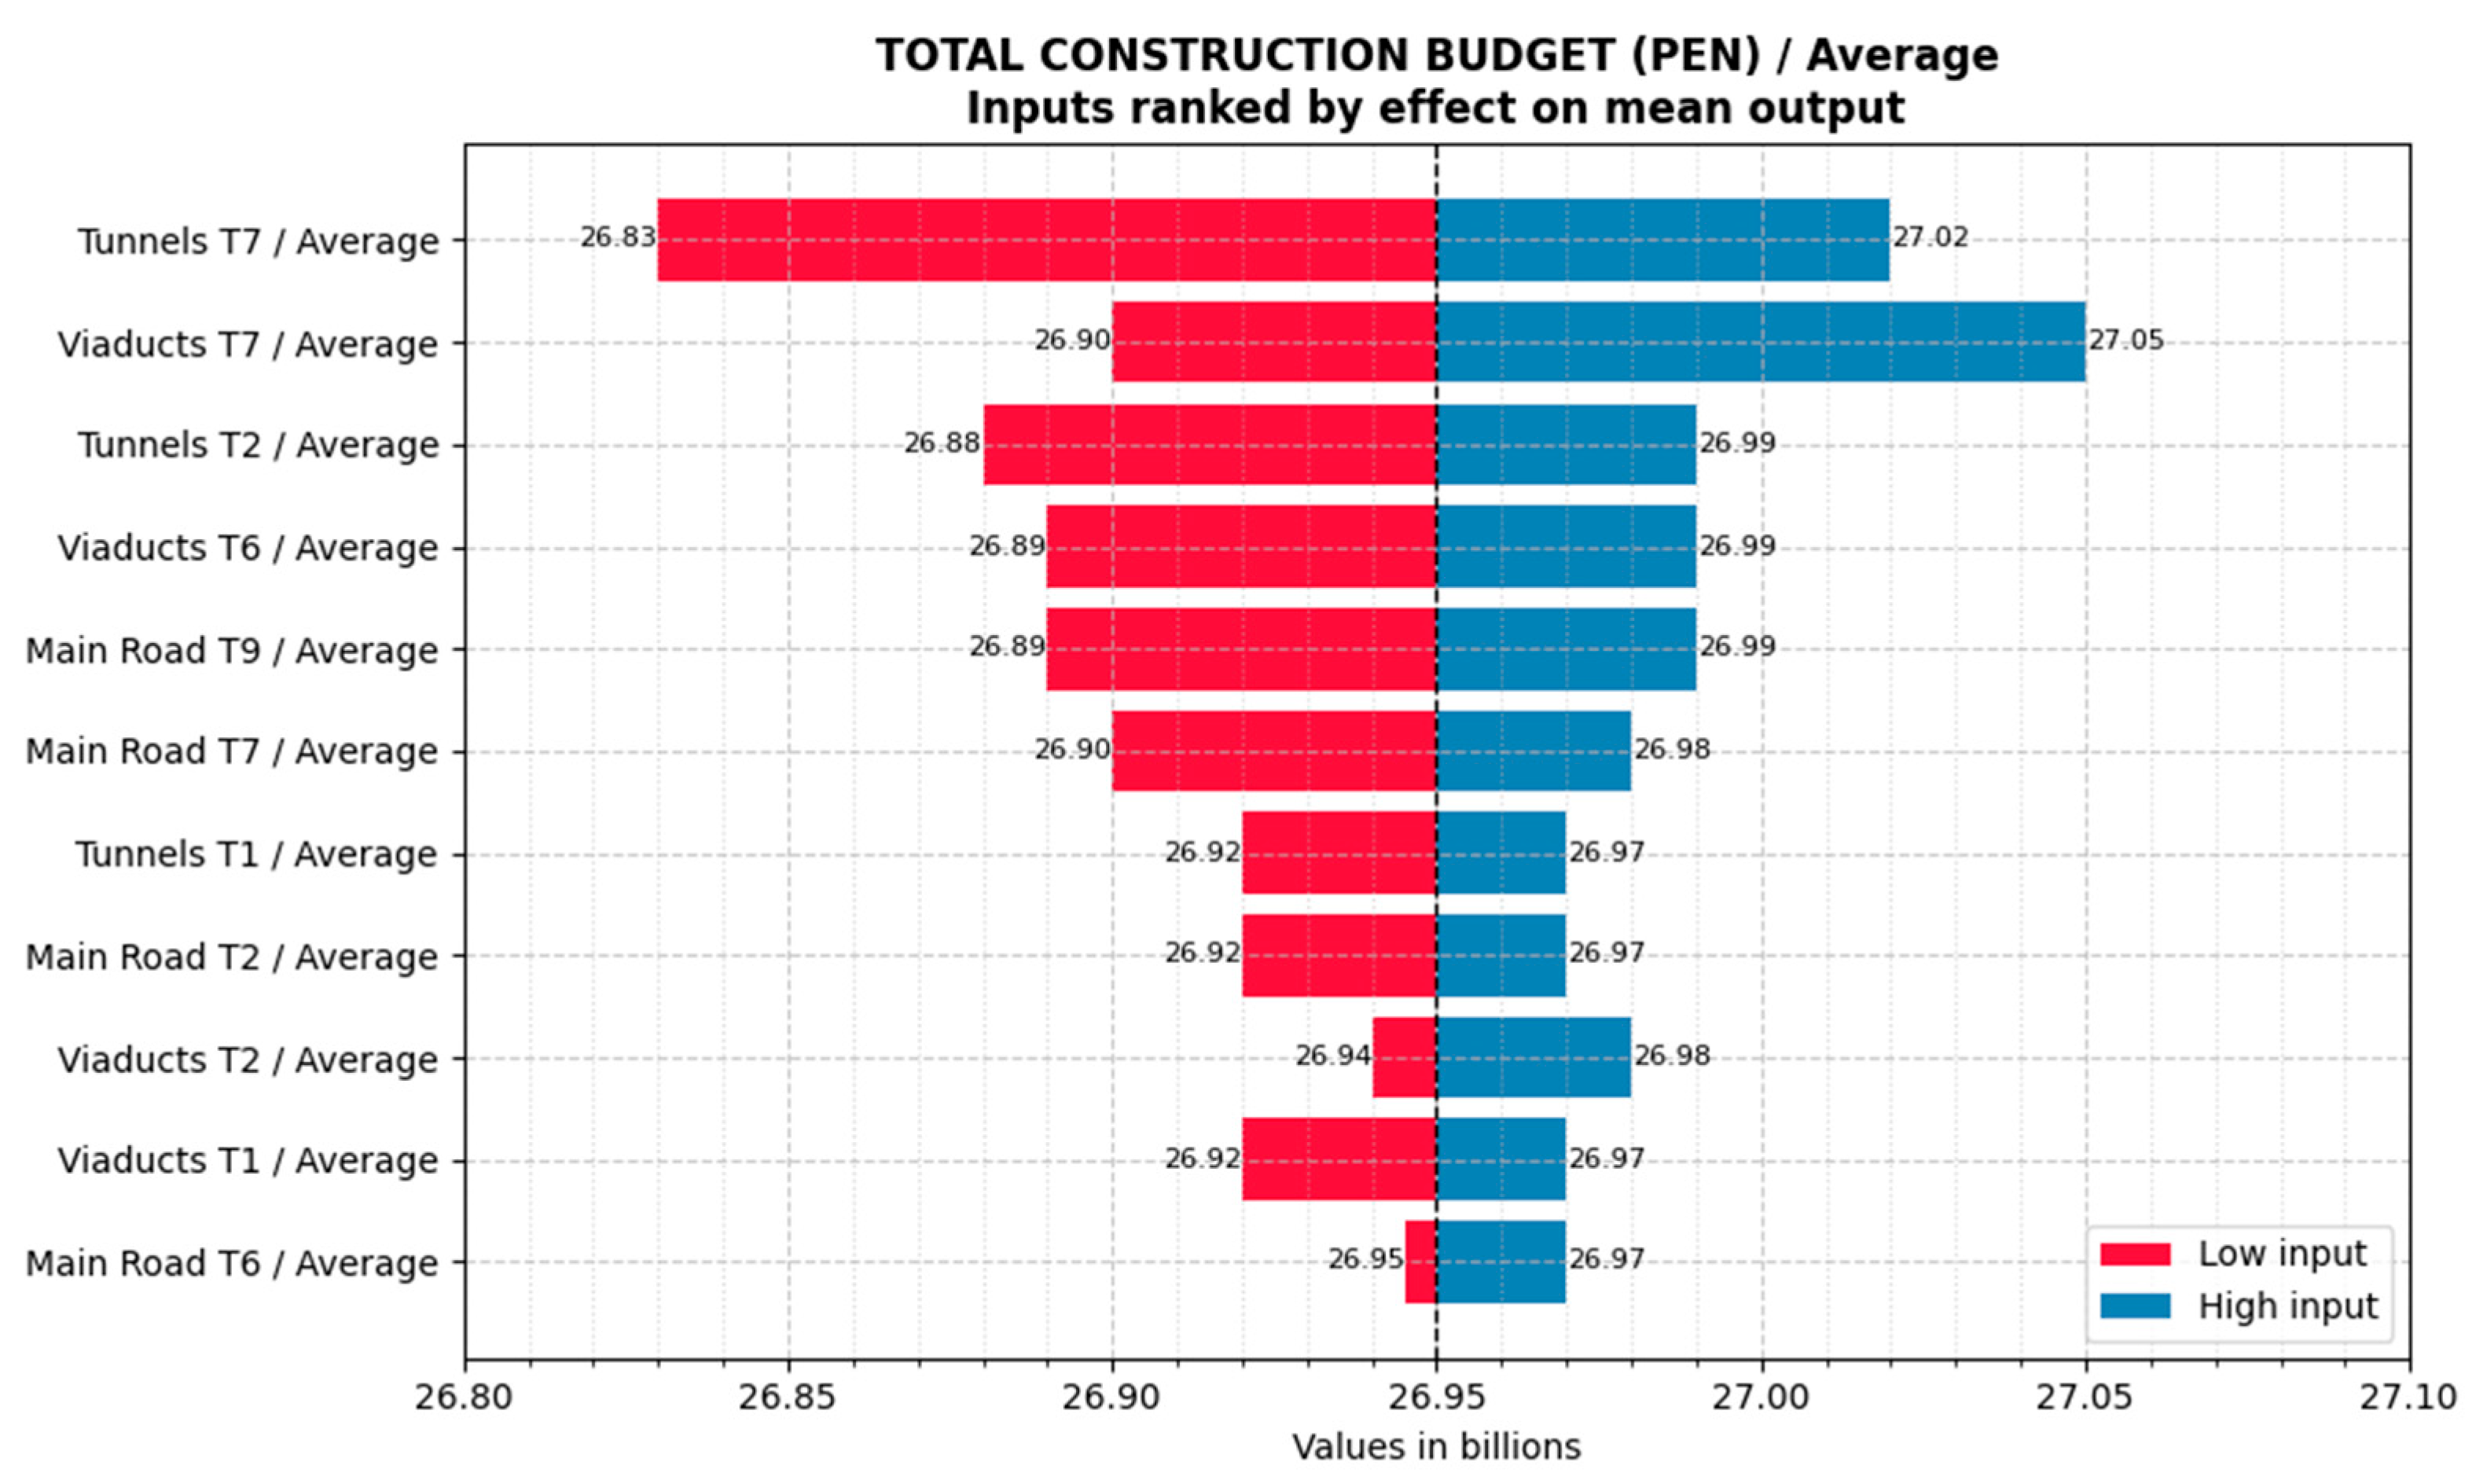
4.1. Estimation of Cost for Project I

For contingency estimation, the project’s cost structure was based on its CAPEX components. This structure classifies the project’s nine sections according to its three main components: main road (highways), tunnels, and viaducts.
For cost calculation, PERT distributions were applied in most cases, except for the tunnels in Section 6, where the price remained constant, and a uniform distribution was used. Three reference values were considered: the minimum value, the most likely value (corresponding to the optimized design with variants), and the maximum value. The selection of the PERT distribution was justified by its more frequent use compared to the triangular distribution as researched in the systematic literature review.
Simulations were performed with 5000, 10,000, 50,000, and 100,000 iterations, as shown in Table 5. In the case of 100,000 simulations, the analysis indicated that 90% of the iterations resulted in an estimated cost between 26.779 and 27.112 billion soles. With a 95% confidence level, the expected construction cost was estimated at 27.112 billion soles.
The kurtosis was greater than three, indicating that the graph was leptokurtic. This suggested a low risk that the costs would significantly exceed the estimated range, except in the event of extraordinary deviations. However, in the simulation with 100,000 iterations, the results showed that the estimated costs exceeded the initial estimate by 7%, 10%, and 11%. Figure 2 presents the results of the Monte Carlo simulation with 5000 iterations (sim) for the estimation of cost contingencies for Project I.
The simulations indicated that the extreme values could reach up to 27.3 billion soles. Additionally, the sensitivity analysis, using a tornado diagram as shown in Figure 3, highlighted that Segment 7 of the infrastructure project (T7 in Figure 3)”—specifically the tunnels and viaducts—exhibited the greatest variability in the budget. In particular, the cost of the tunnels in Segment 7 accounted for 32.8% of the total variance, while the viaducts in the same section contributed 19.8%. Together, these two elements explained approximately 50% of the cost variability, making their control essential for the project’s financial stability. This suggested the need for specific cost controls during the project’s engineering phase. The proposed methodology will serve as a basis for establishing risk mitigation mechanisms during both the engineering and execution phases of the project.

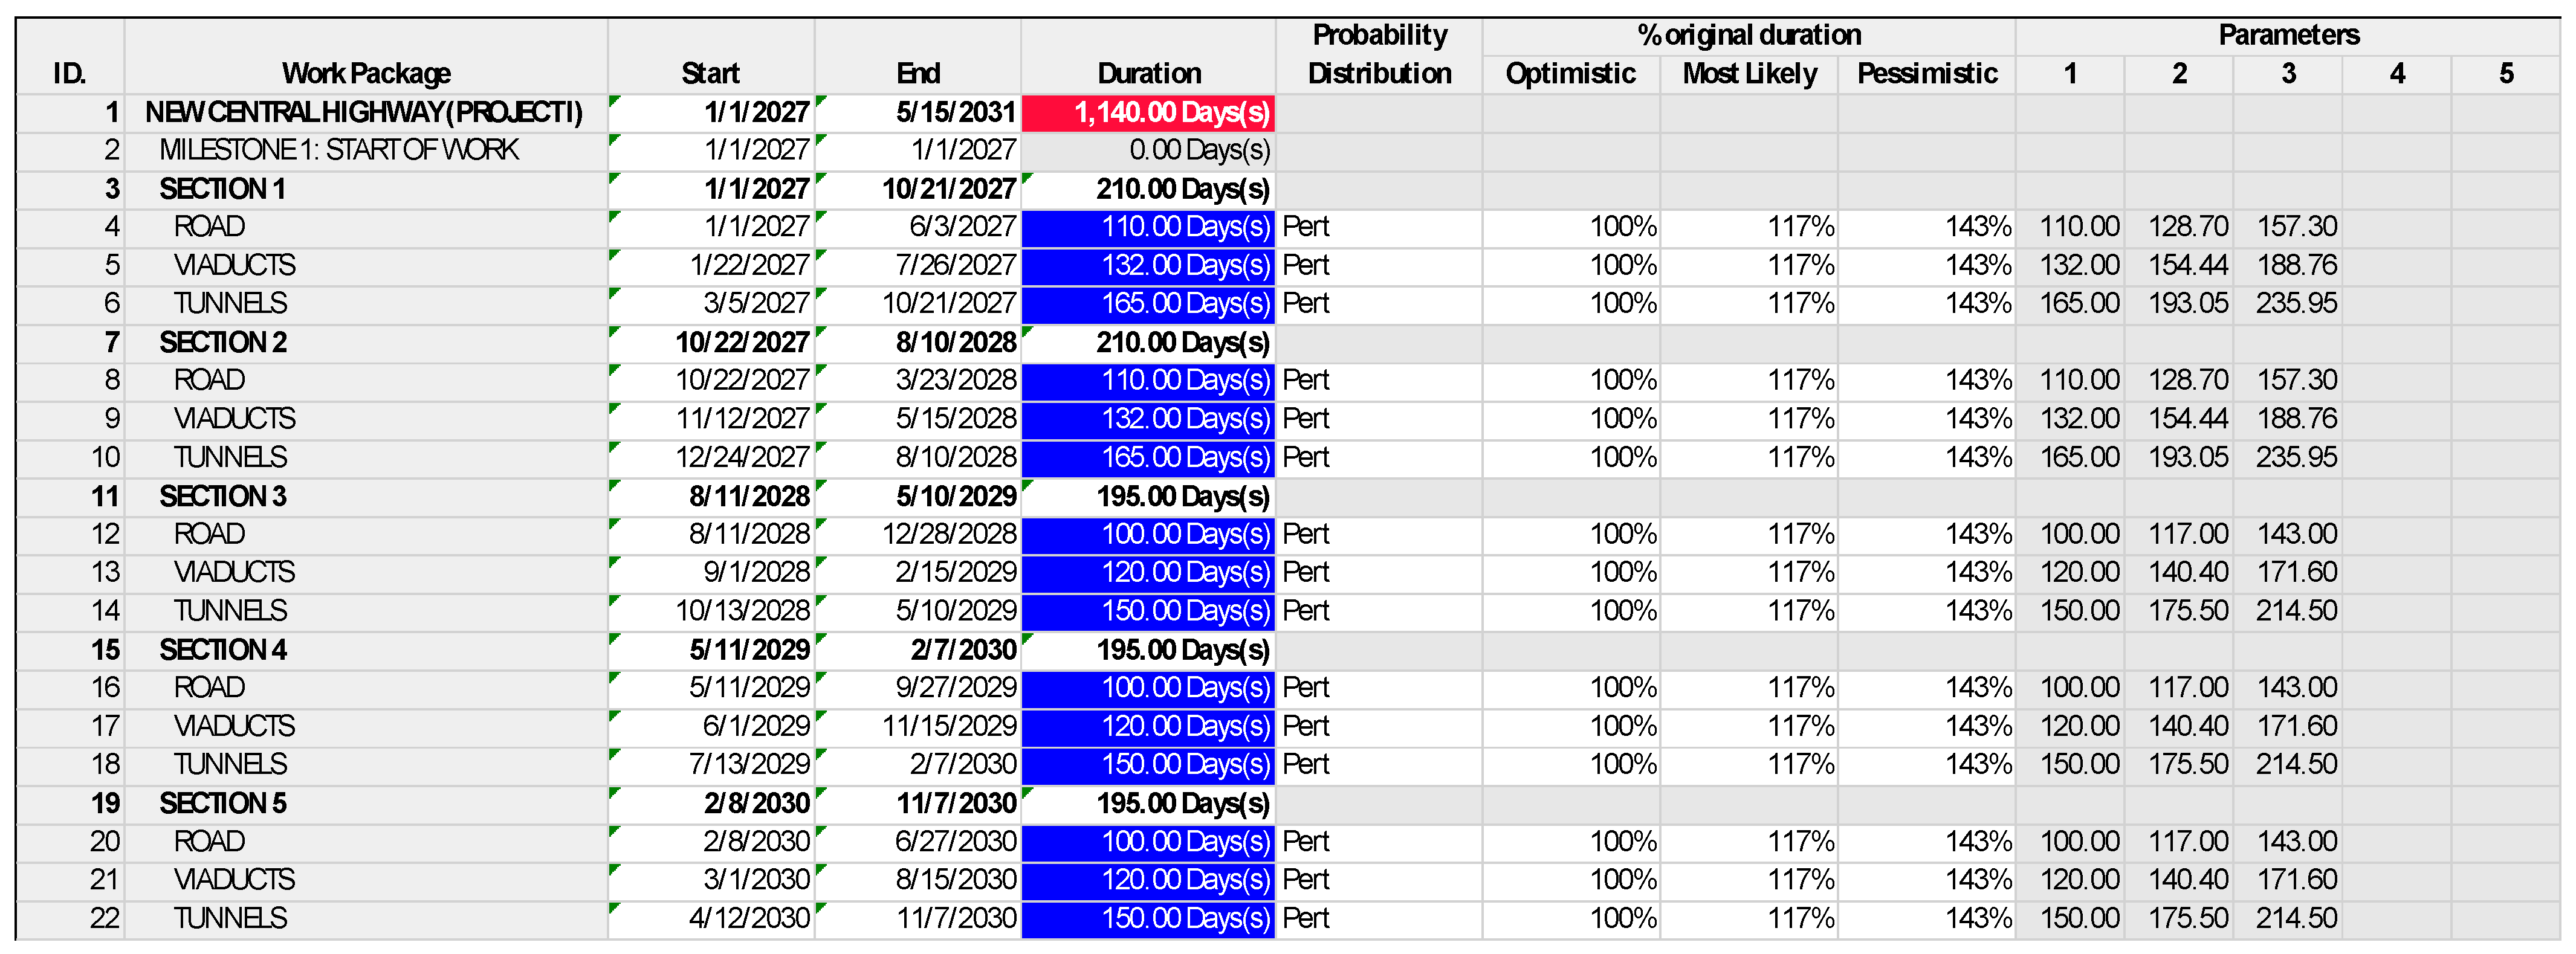
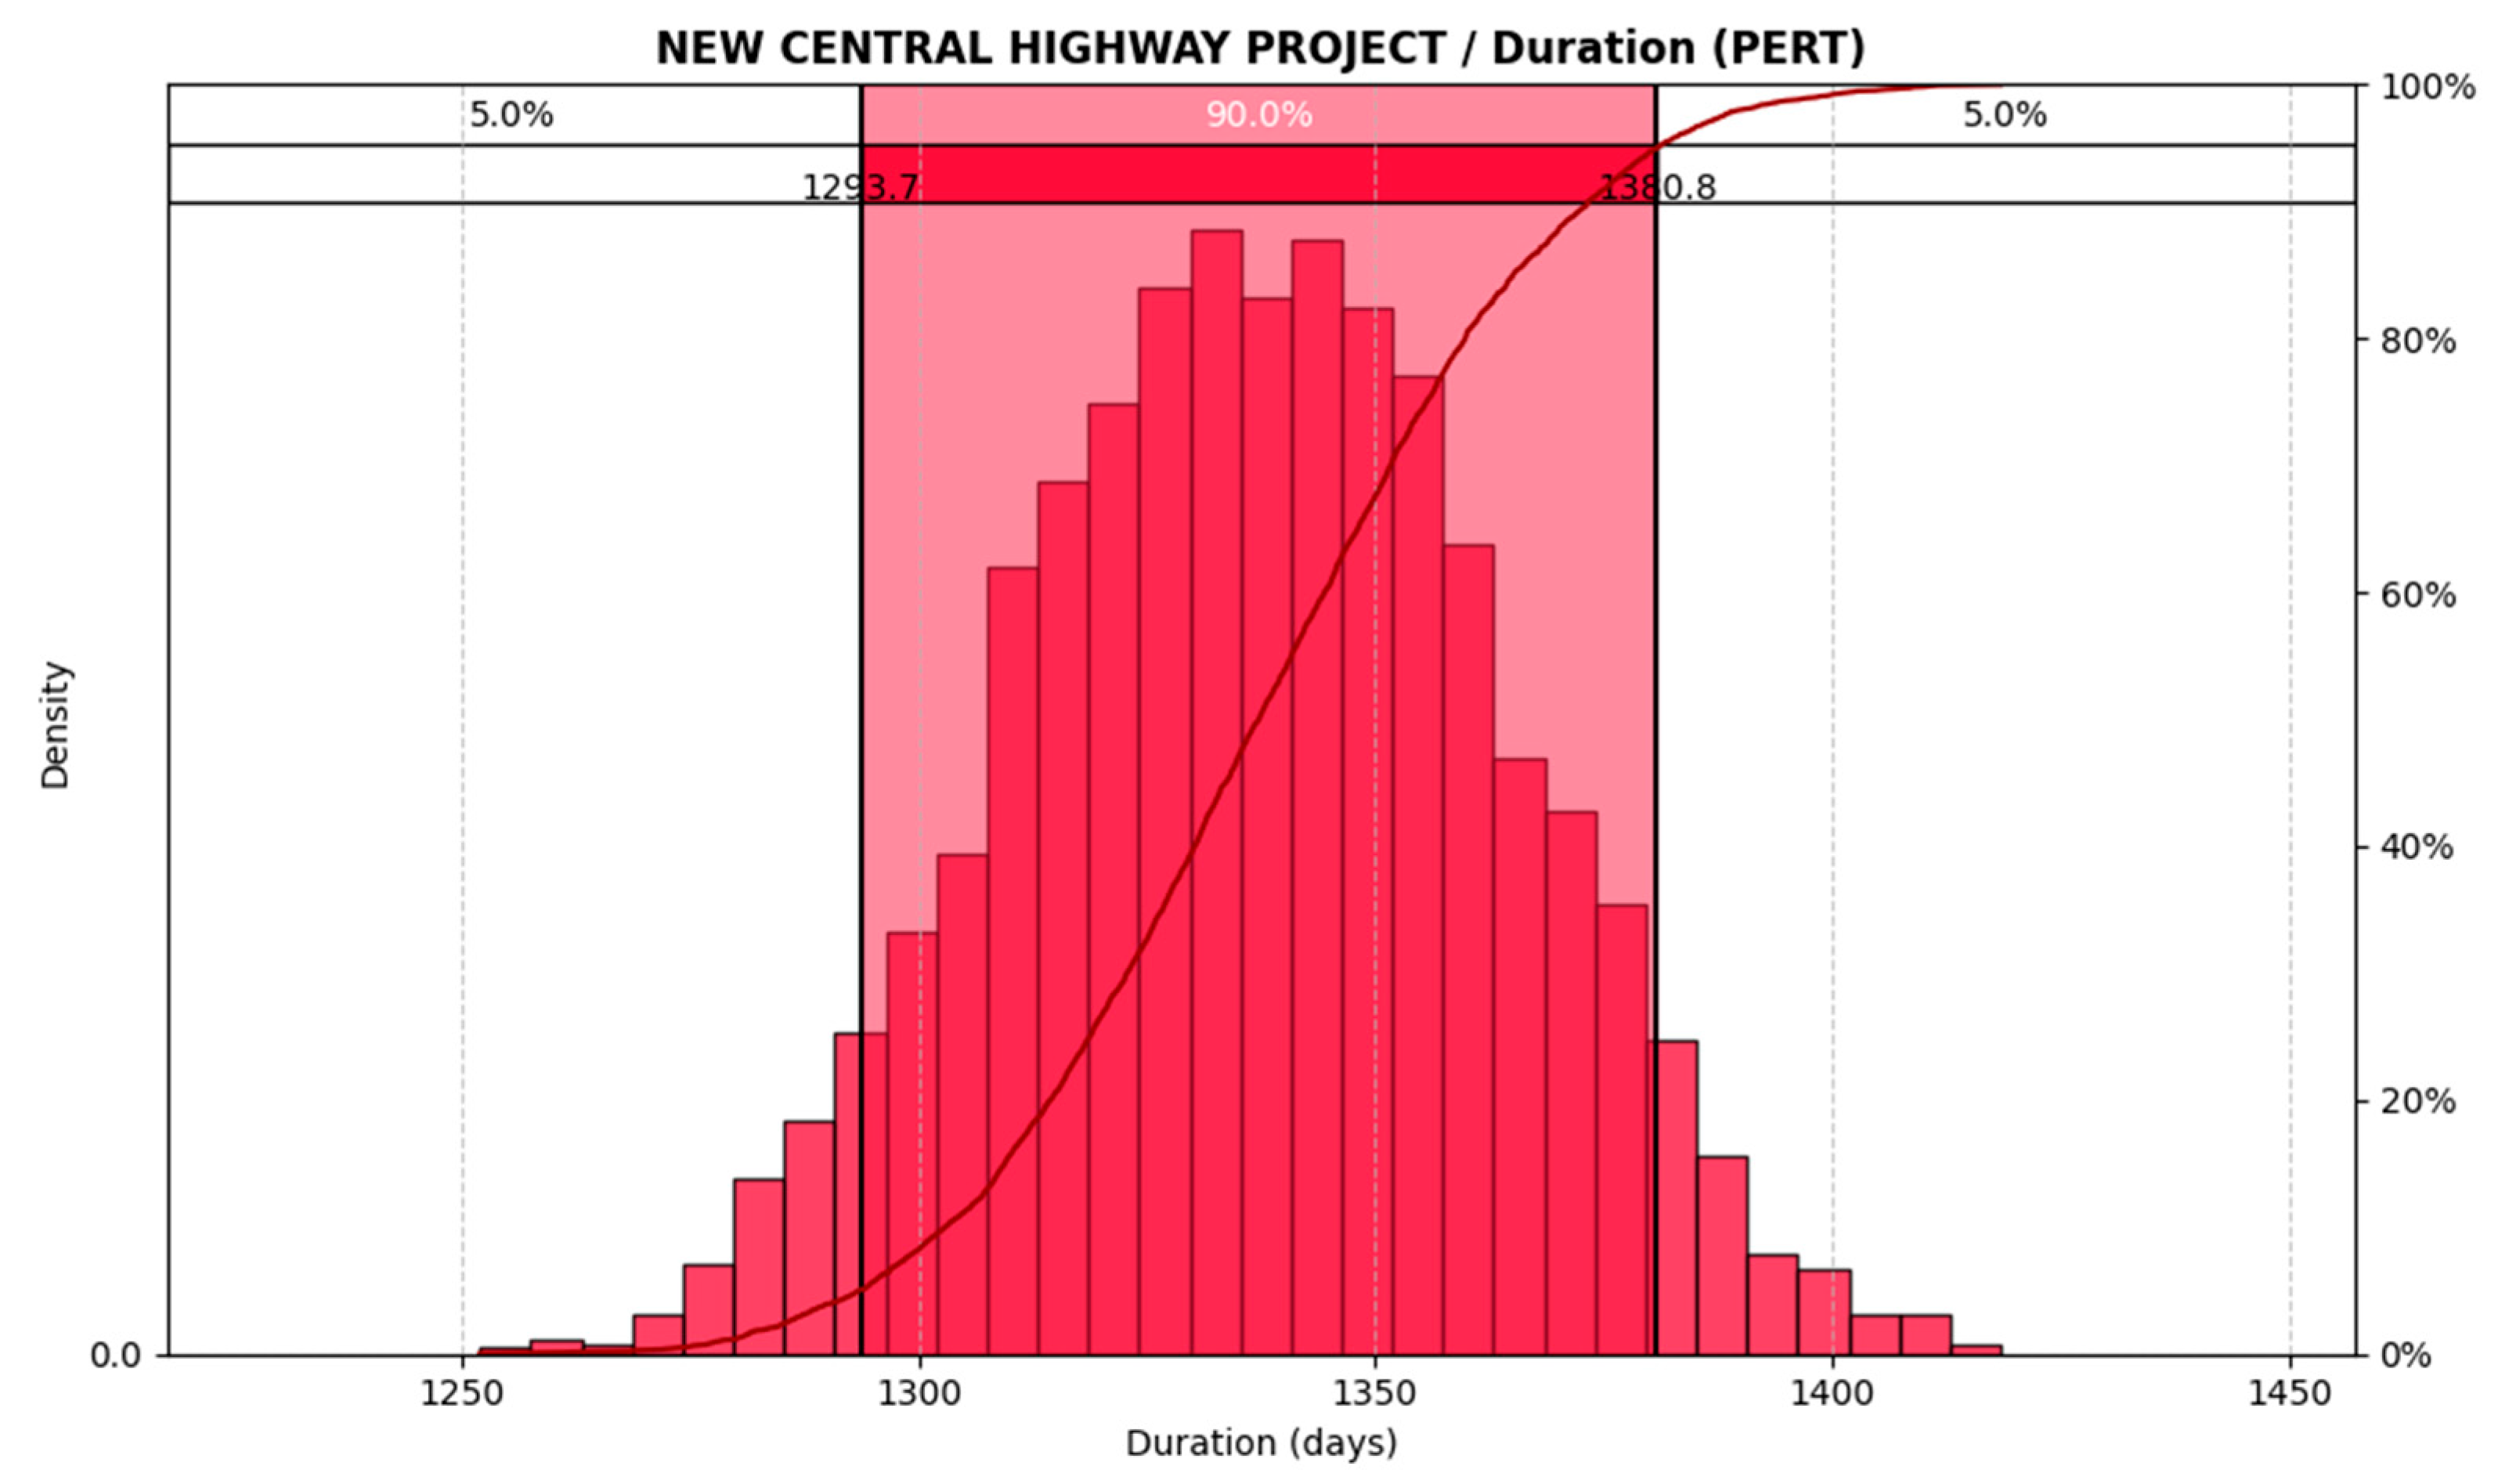
4.2. Estimation of Time for Project I

For contingency estimation, the project’s work breakdown structure (WBS) was used within the project schedule, assigning durations and predecessor links to each activity. Before initiating the schedule risk analysis, it was essential to perform a schedule audit to avoid conflicts that could affect the calculation of the durations. Figure 4 shows the input results derived from the schedule developed in MS Project, distinguishing the optimistic, most likely, and pessimistic values used for the simulation.
The calculations performed required the modeling of all activities using the PERT distribution. In the absence of data to allow for distribution fitting, the three-point estimation method was applied, identifying the optimistic, most likely, and pessimistic values. Table 6 presents the calculations carried out to determine the input values for the simulation, which were obtained through the measurement of schedule performance in similar projects (tunnels, roads, and bridges) independently assessed in Peru.
The simulation, shown in Figure 5, indicated that the results consistently exceeded the deterministic schedule of 1142 days, which implied the need to allocate contingency time for the final schedule estimation. Figure 6 illustrates the sensitivity analysis of the results.

4.3. Estimation of Cost for Project II

For the contingency estimation, the cost structure from the budget obtained in the project’s engineering study was used. The initial estimated cost was USD 83,363,610, and the implemented method involved a series of choices for the 429 cost items that made up the budget. The selection of the probability distribution function corresponded to the use of the PERT and uniform distributions. The simulation results, shown in Figure 7, indicated that the 95th percentile corresponded to a value of USD 84,630,245, which represented a required contingency of 1.5% to account for quantity variation.
Figure 8 shows the sensitivity analysis results for Project II, highlighting the variables with the greatest influence on the direct cost. The inputs “AC111” and “AC35” exhibit the highest impact on the cost variability, indicating that they should be prioritized for cost control strategies. The analysis was performed using Monte Carlo Simulation outputs, ranking the factors based on their effect on the mean project cost in USD.

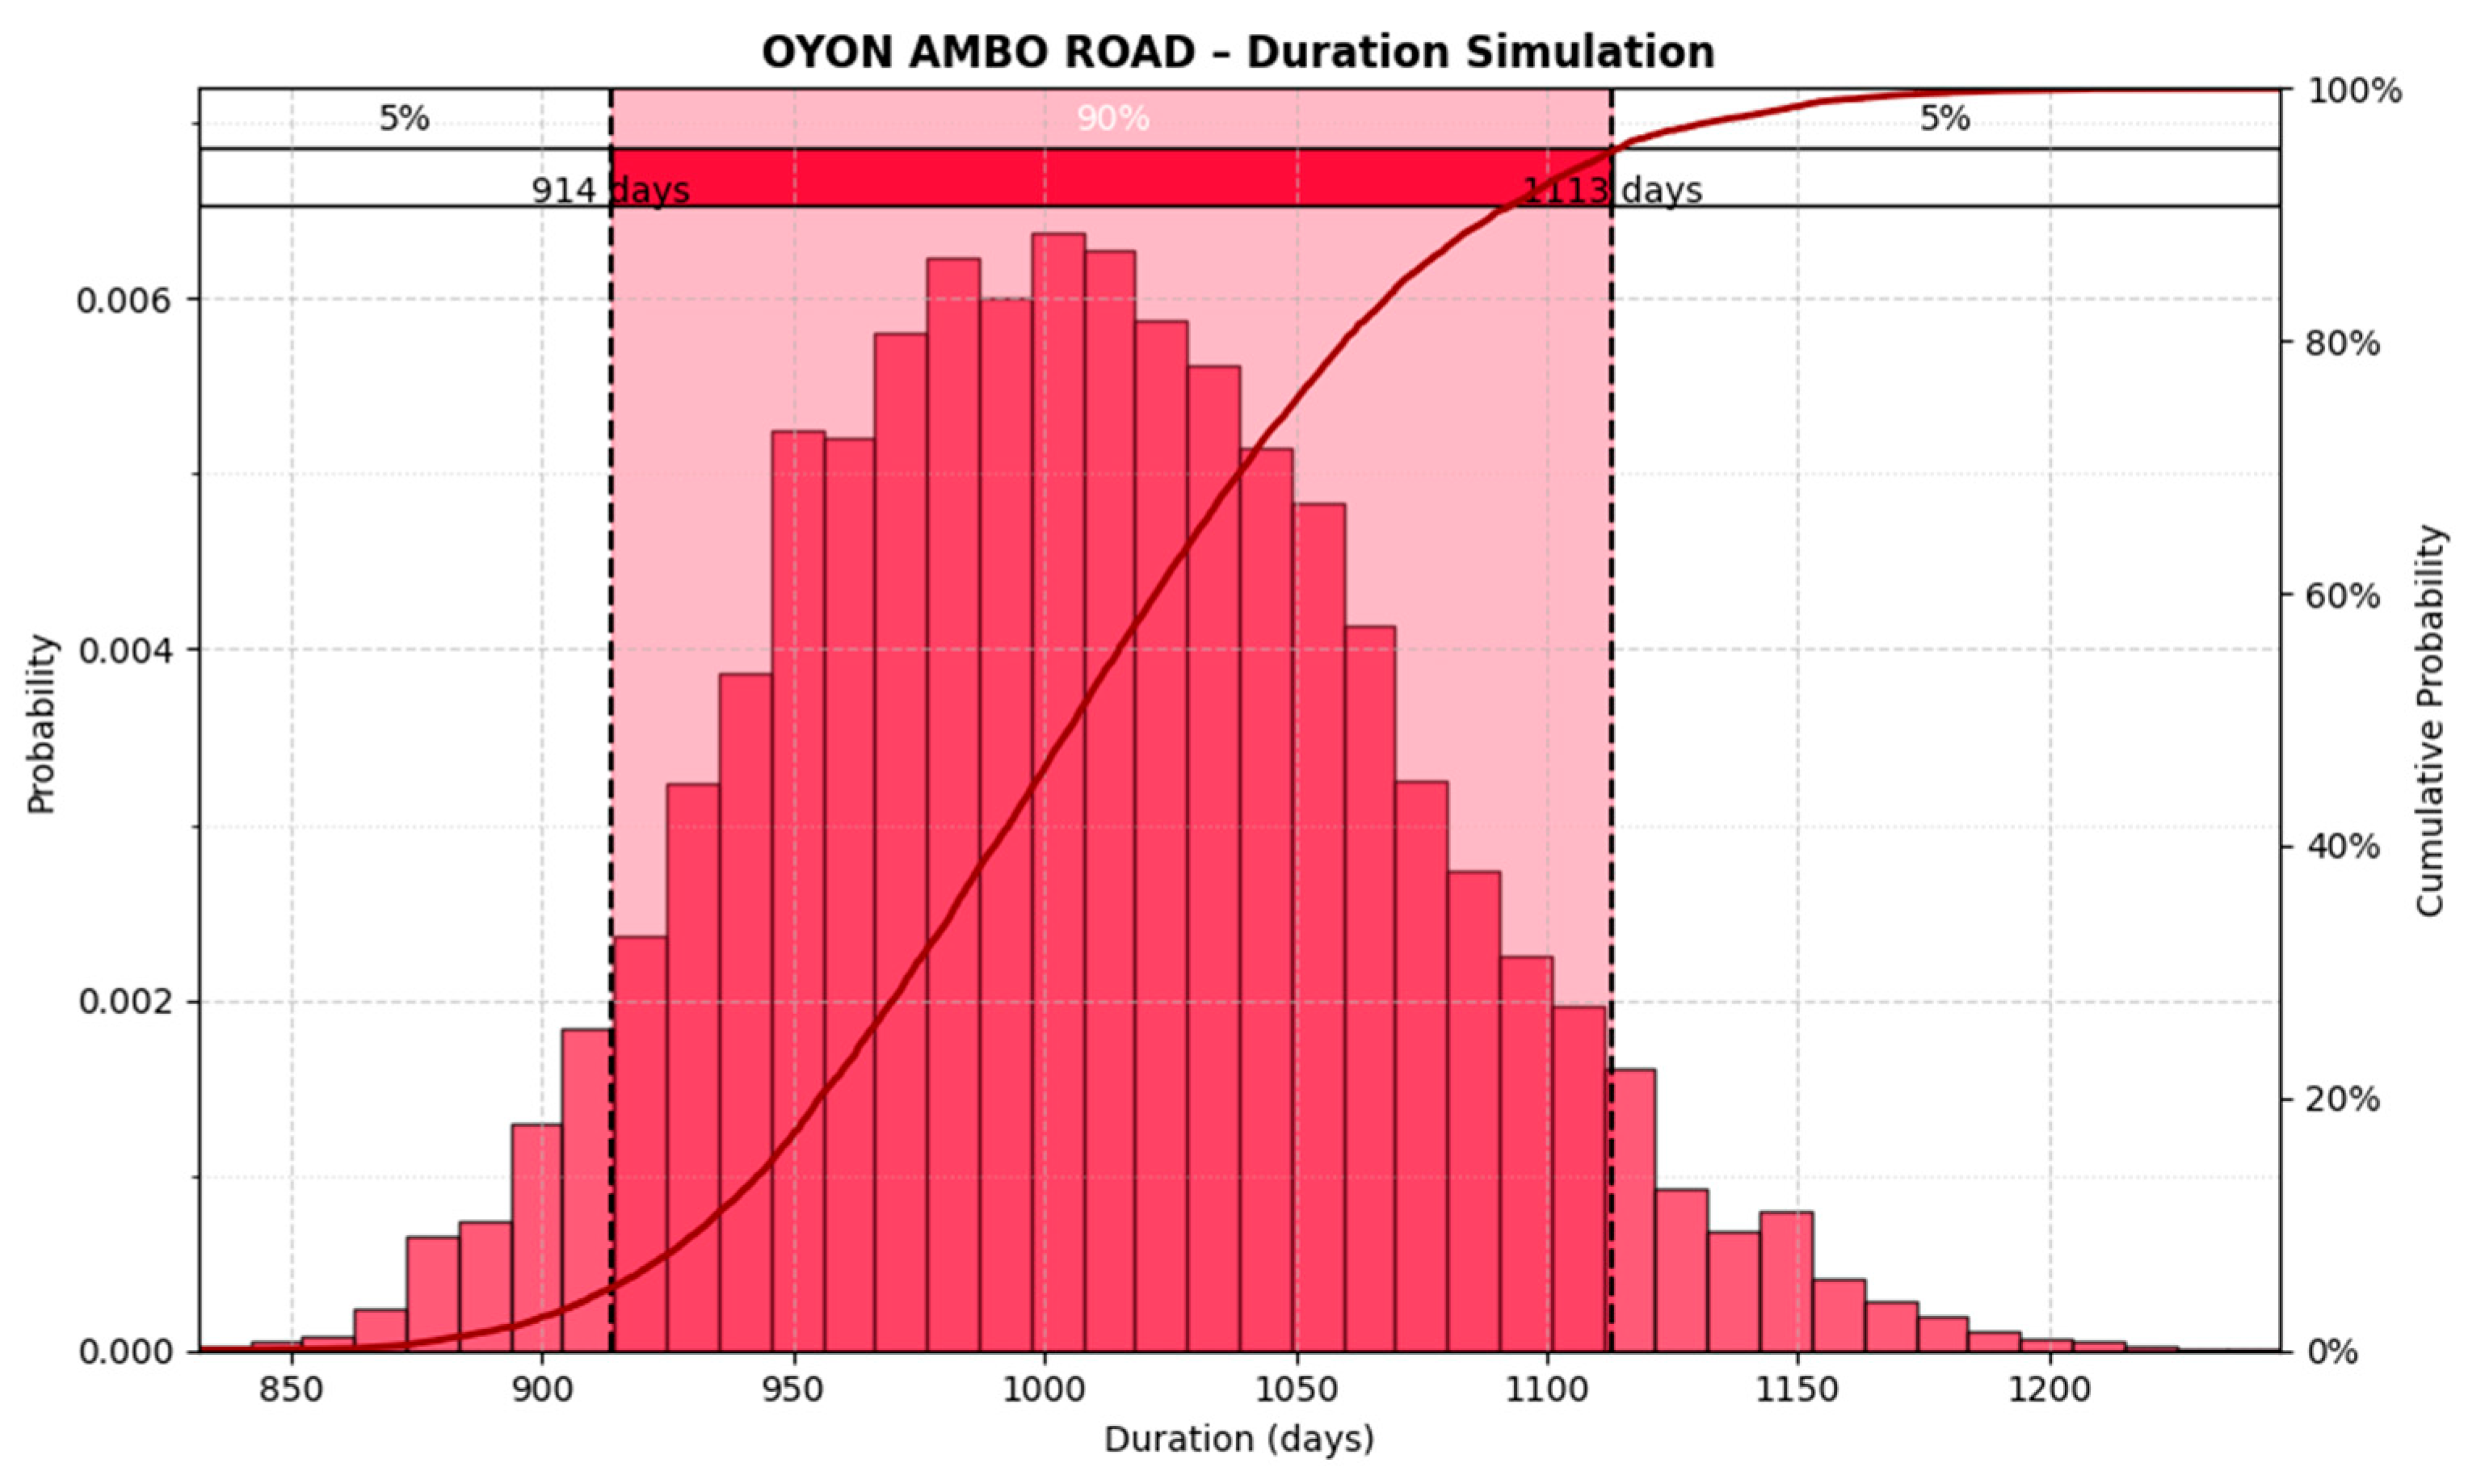
4.4. Estimation of Time for Project II

For the contingency time estimation of Project II, it was necessary to structure the construction activities according to the work breakdown structure (WBS), which differed from the scheduling approach used in Project I. This was because Project II primarily consisted of road construction, with bridge works representing minor activities that did not influence the project’s critical path. Figure 9 shows the schedule for Project II developed in MS Project. This project considered a total execution period of 720 calendar days and included the rainy seasons, lasting 105 days between December and March each year, during which precipitation prevented the execution of pavement work.
Based on all these factors, the results of the schedule risk analysis provided a time estimate ranging from 885 days to 1115 days for Project II, as shown in Figure 10. According to Figure 11, the traffic maintenance activity and earthworks introduced the greatest potential variability to the schedule. This highlighted the need for continuous monitoring of these activities to ensure effective schedule control for the project.
The schedule risk analysis based on Monte Carlo simulations showed stability in the estimated values as the number of simulations increased. Table 7 presents the results of this analysis. The mean contingency time remained around 993 days across all iterations (5000, 10,000, and 50,000 simulations), with minimal variations in the minimum value (ranging from 802.93 to 772.15 days) and in the maximum value (ranging from 1313.21 to 1340.74 days). The 95th percentile fluctuated between 1112.89 and 1119 days, indicating a slight dispersion of risk. The contingency percentage remained stable, with values between 54.57% and 55.42%, suggesting that the model adequately converged from 5000 simulations onward.
The high schedule contingency values shown in Table 7 were explained by the specific conditions of Project II. This project faced risks related to heavy rainfall, geological instability, limited site accessibility, and social conflicts, which directly affected the execution timeline. The contingency did not represent an expected delay, but rather a risk exposure margin calculated through probabilistic analysis. The duration of projects located in rural and mountainous areas, combined with seasonal weather conditions, requires considering wider time ranges to avoid underestimation.

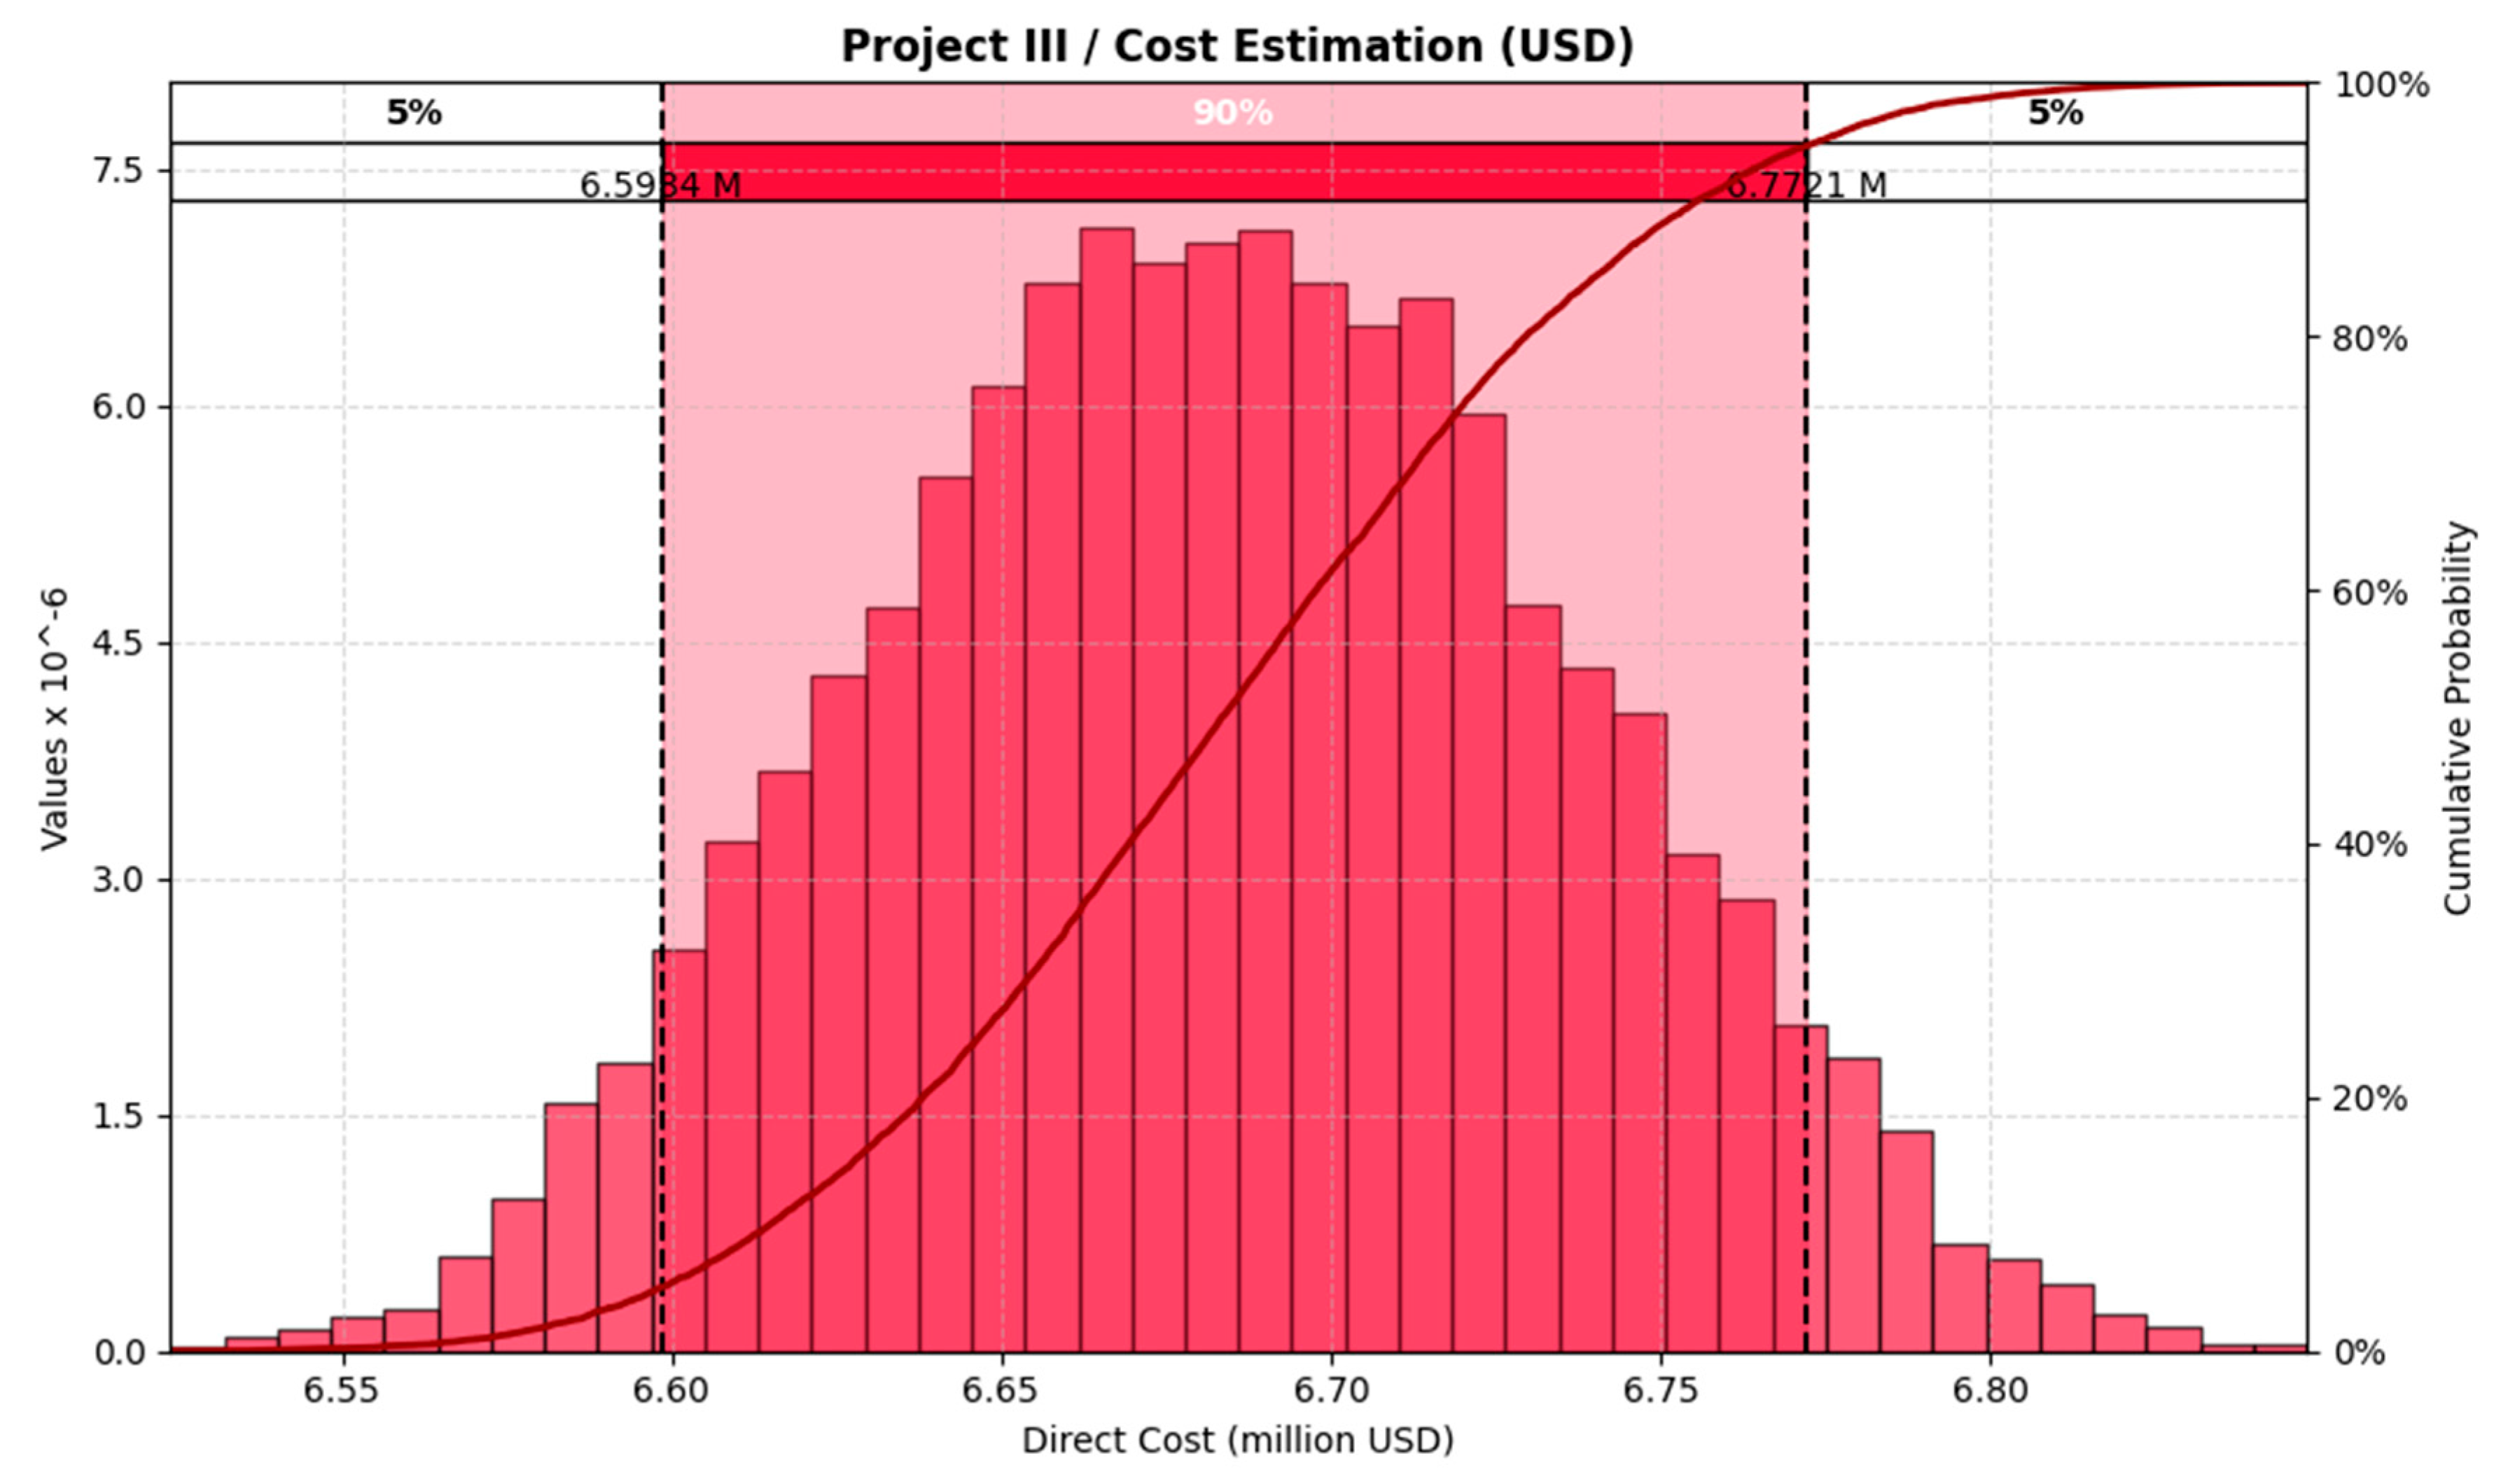
4.5. Estimation of Cost for Project III

For the contingency estimation of Project III, the cost structure from the budget obtained in the project’s engineering study was used. The initial estimated cost was USD 6,682,378.32, and the implemented method involved a series of selections for the 169 cost items that made up the budget. The selected probability distribution function corresponded to the PERT distribution. The results, as shown in Figure 12, indicated that the 95th percentile corresponded to a value of USD 6,772,148.97, which means the project required a 1.34% contingency to account for quantity variation.
Additionally, Figure 13 shows that the pavement items, corresponding to cells E25 and E26 in the project budget, had the greatest influence on the variation in the project’s overall cost.
The simulation results, as shown in Table 8, demonstrated high stability in cost estimation as the number of iterations increased. The mean value remained consistent at approximately USD 6.68 million, while the 95th percentile varied minimally between USD 6.772 million and USD 6.773 million. The calculated contingency ranged from 1.34% to 1.37%, indicating low dispersion and adequate convergence of the model from 5000 simulations onward. This confirmed the reliability of the estimation and the robustness of the applied quantitative risk analysis.

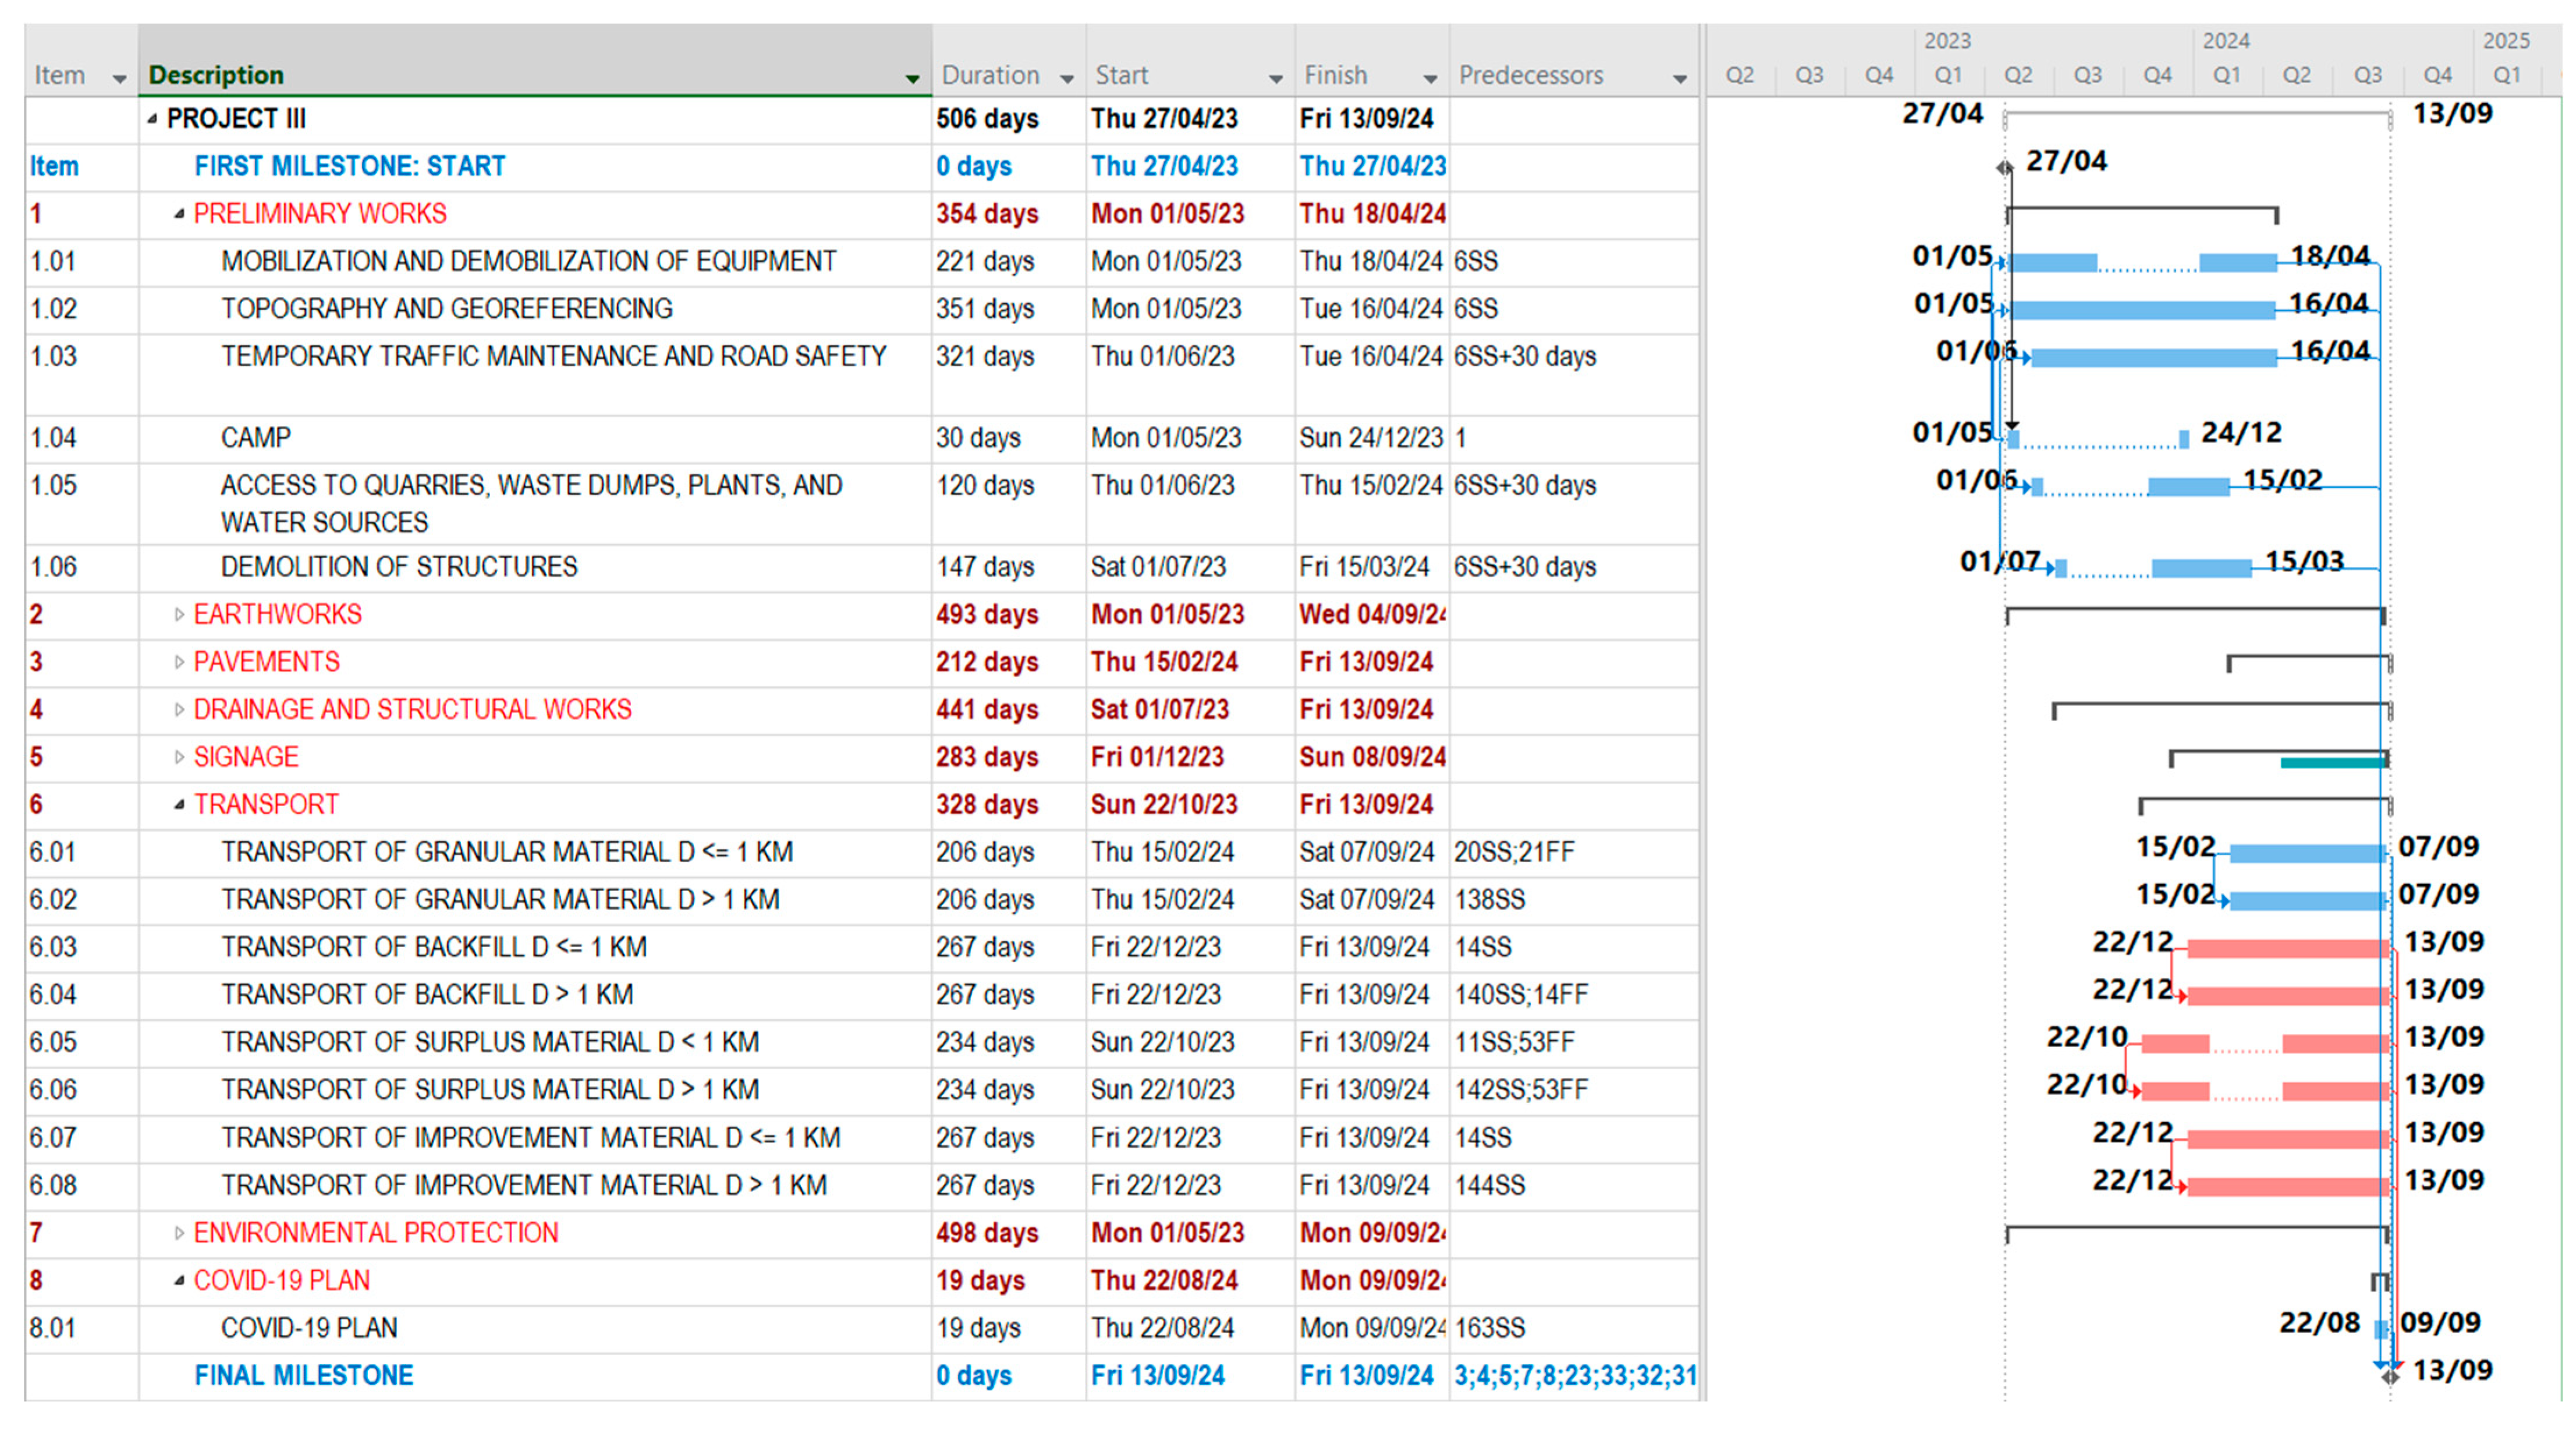
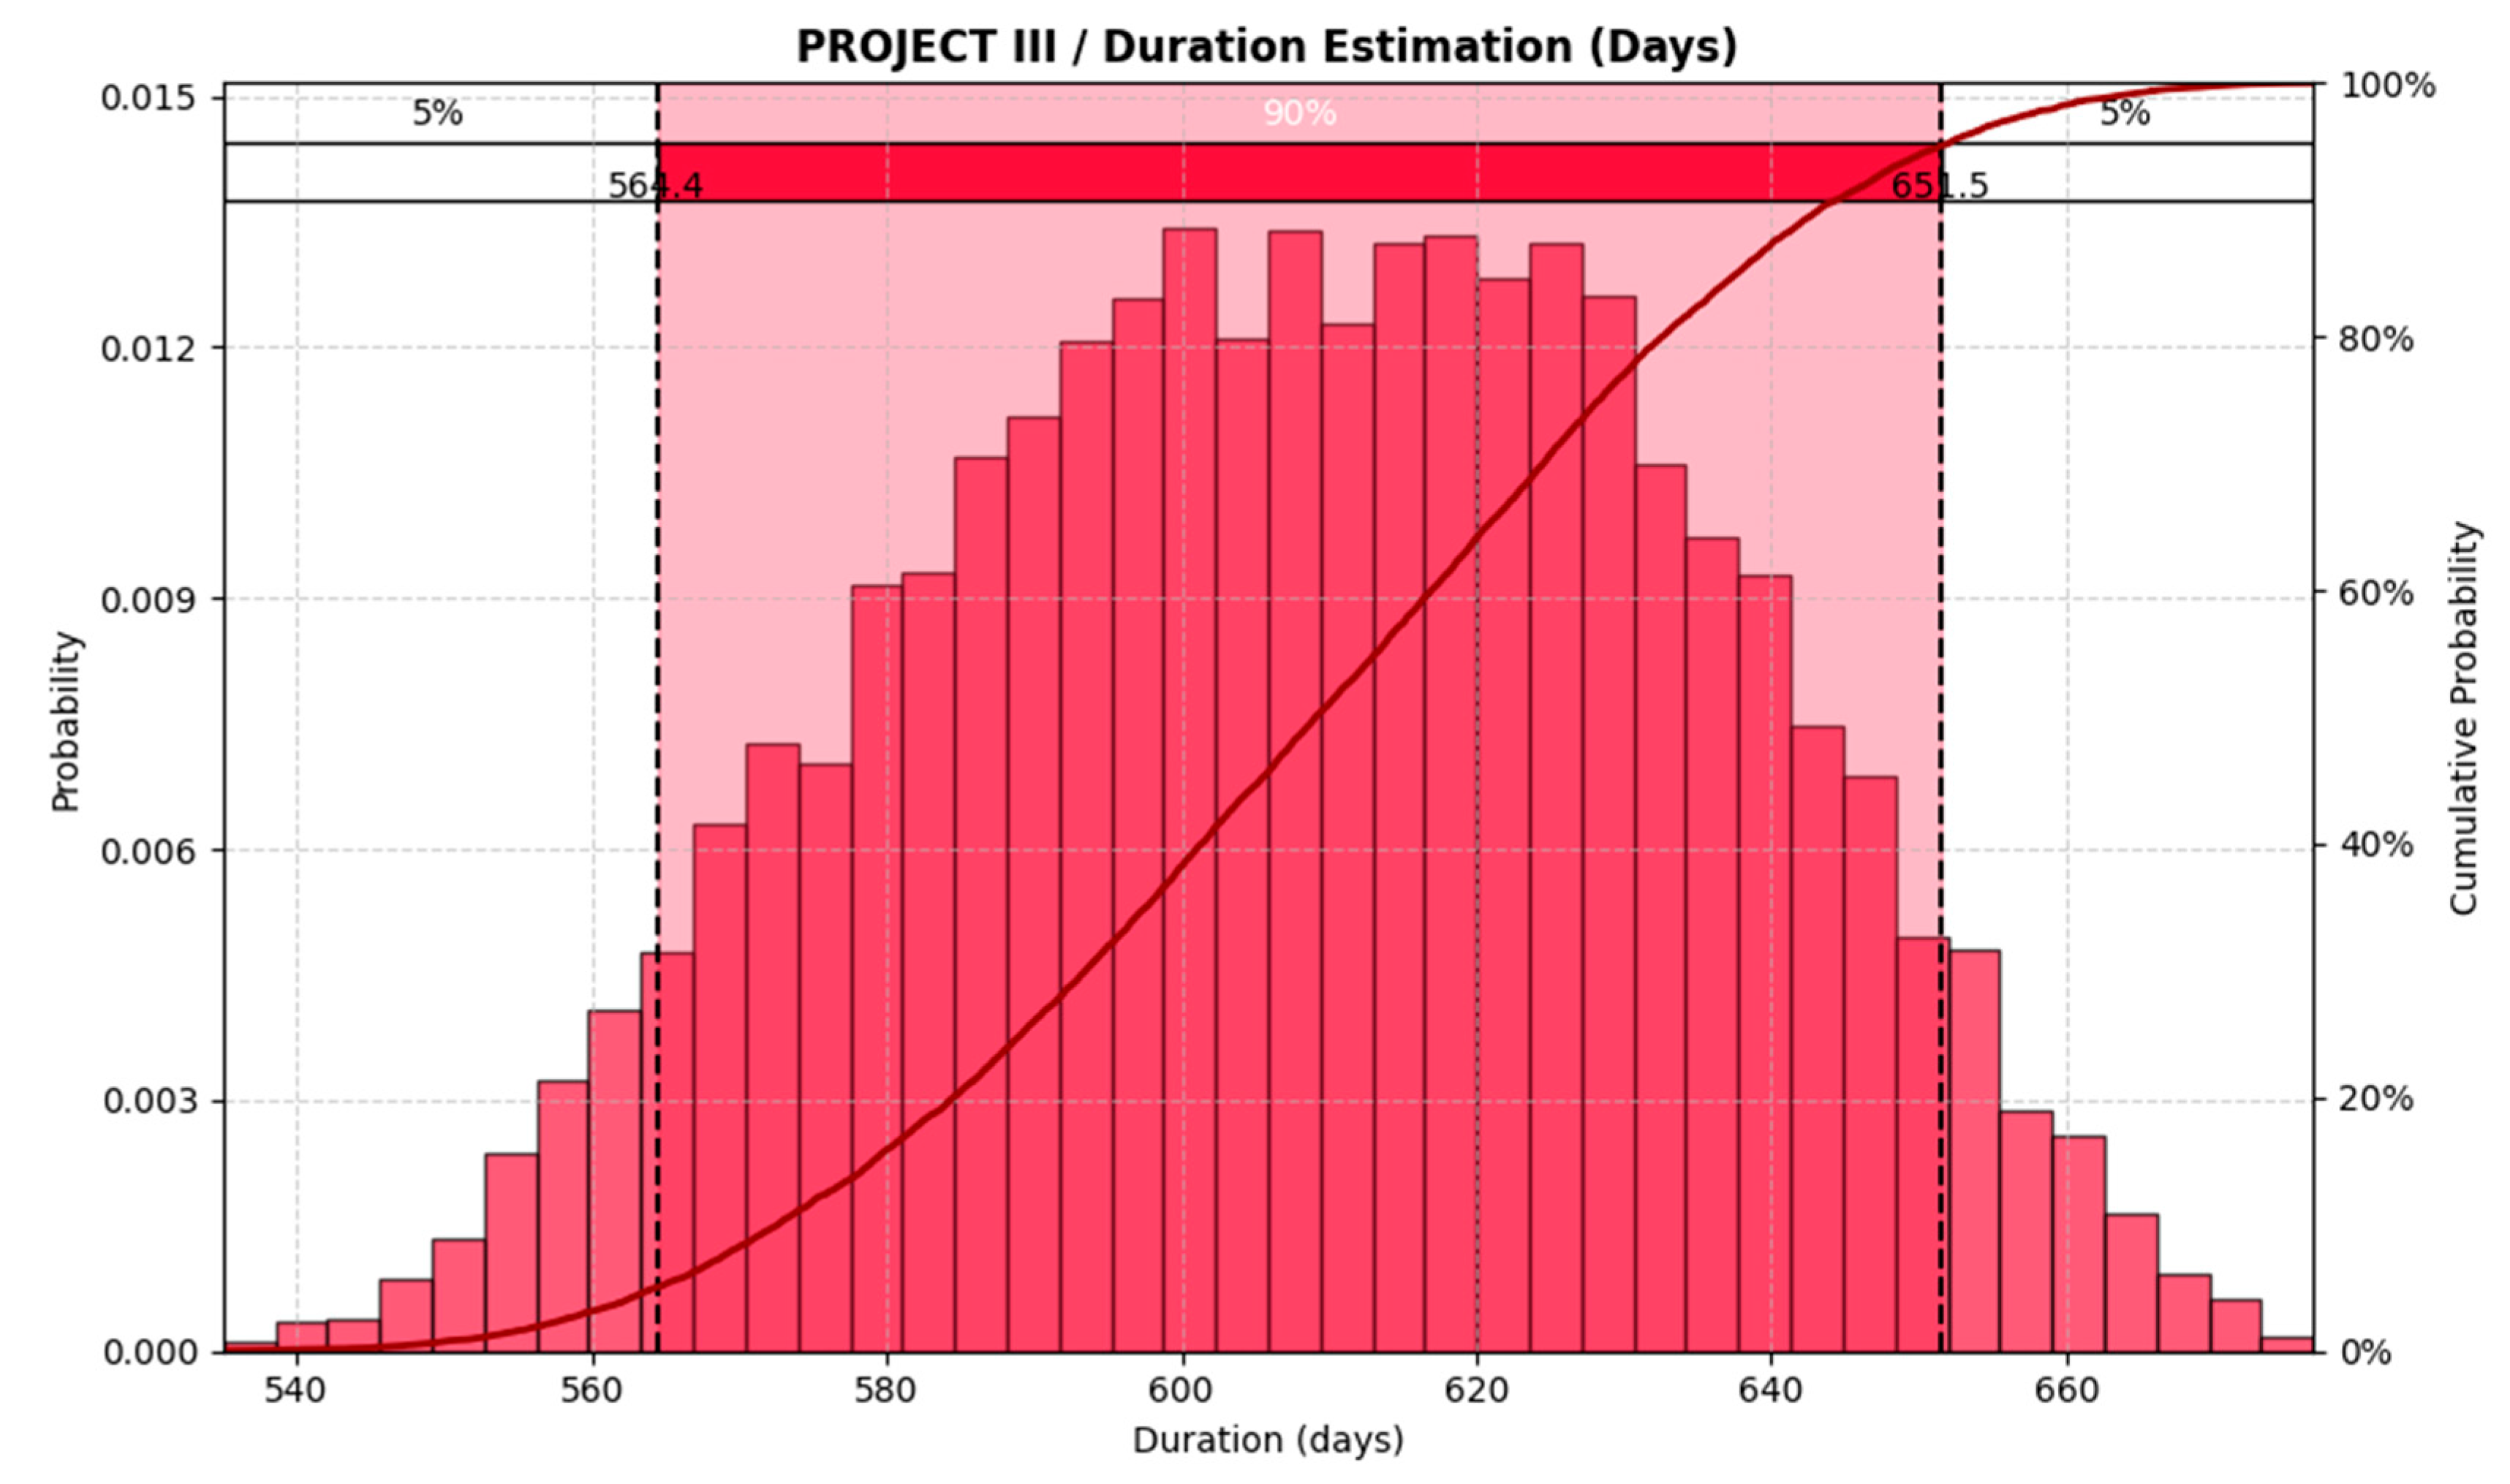
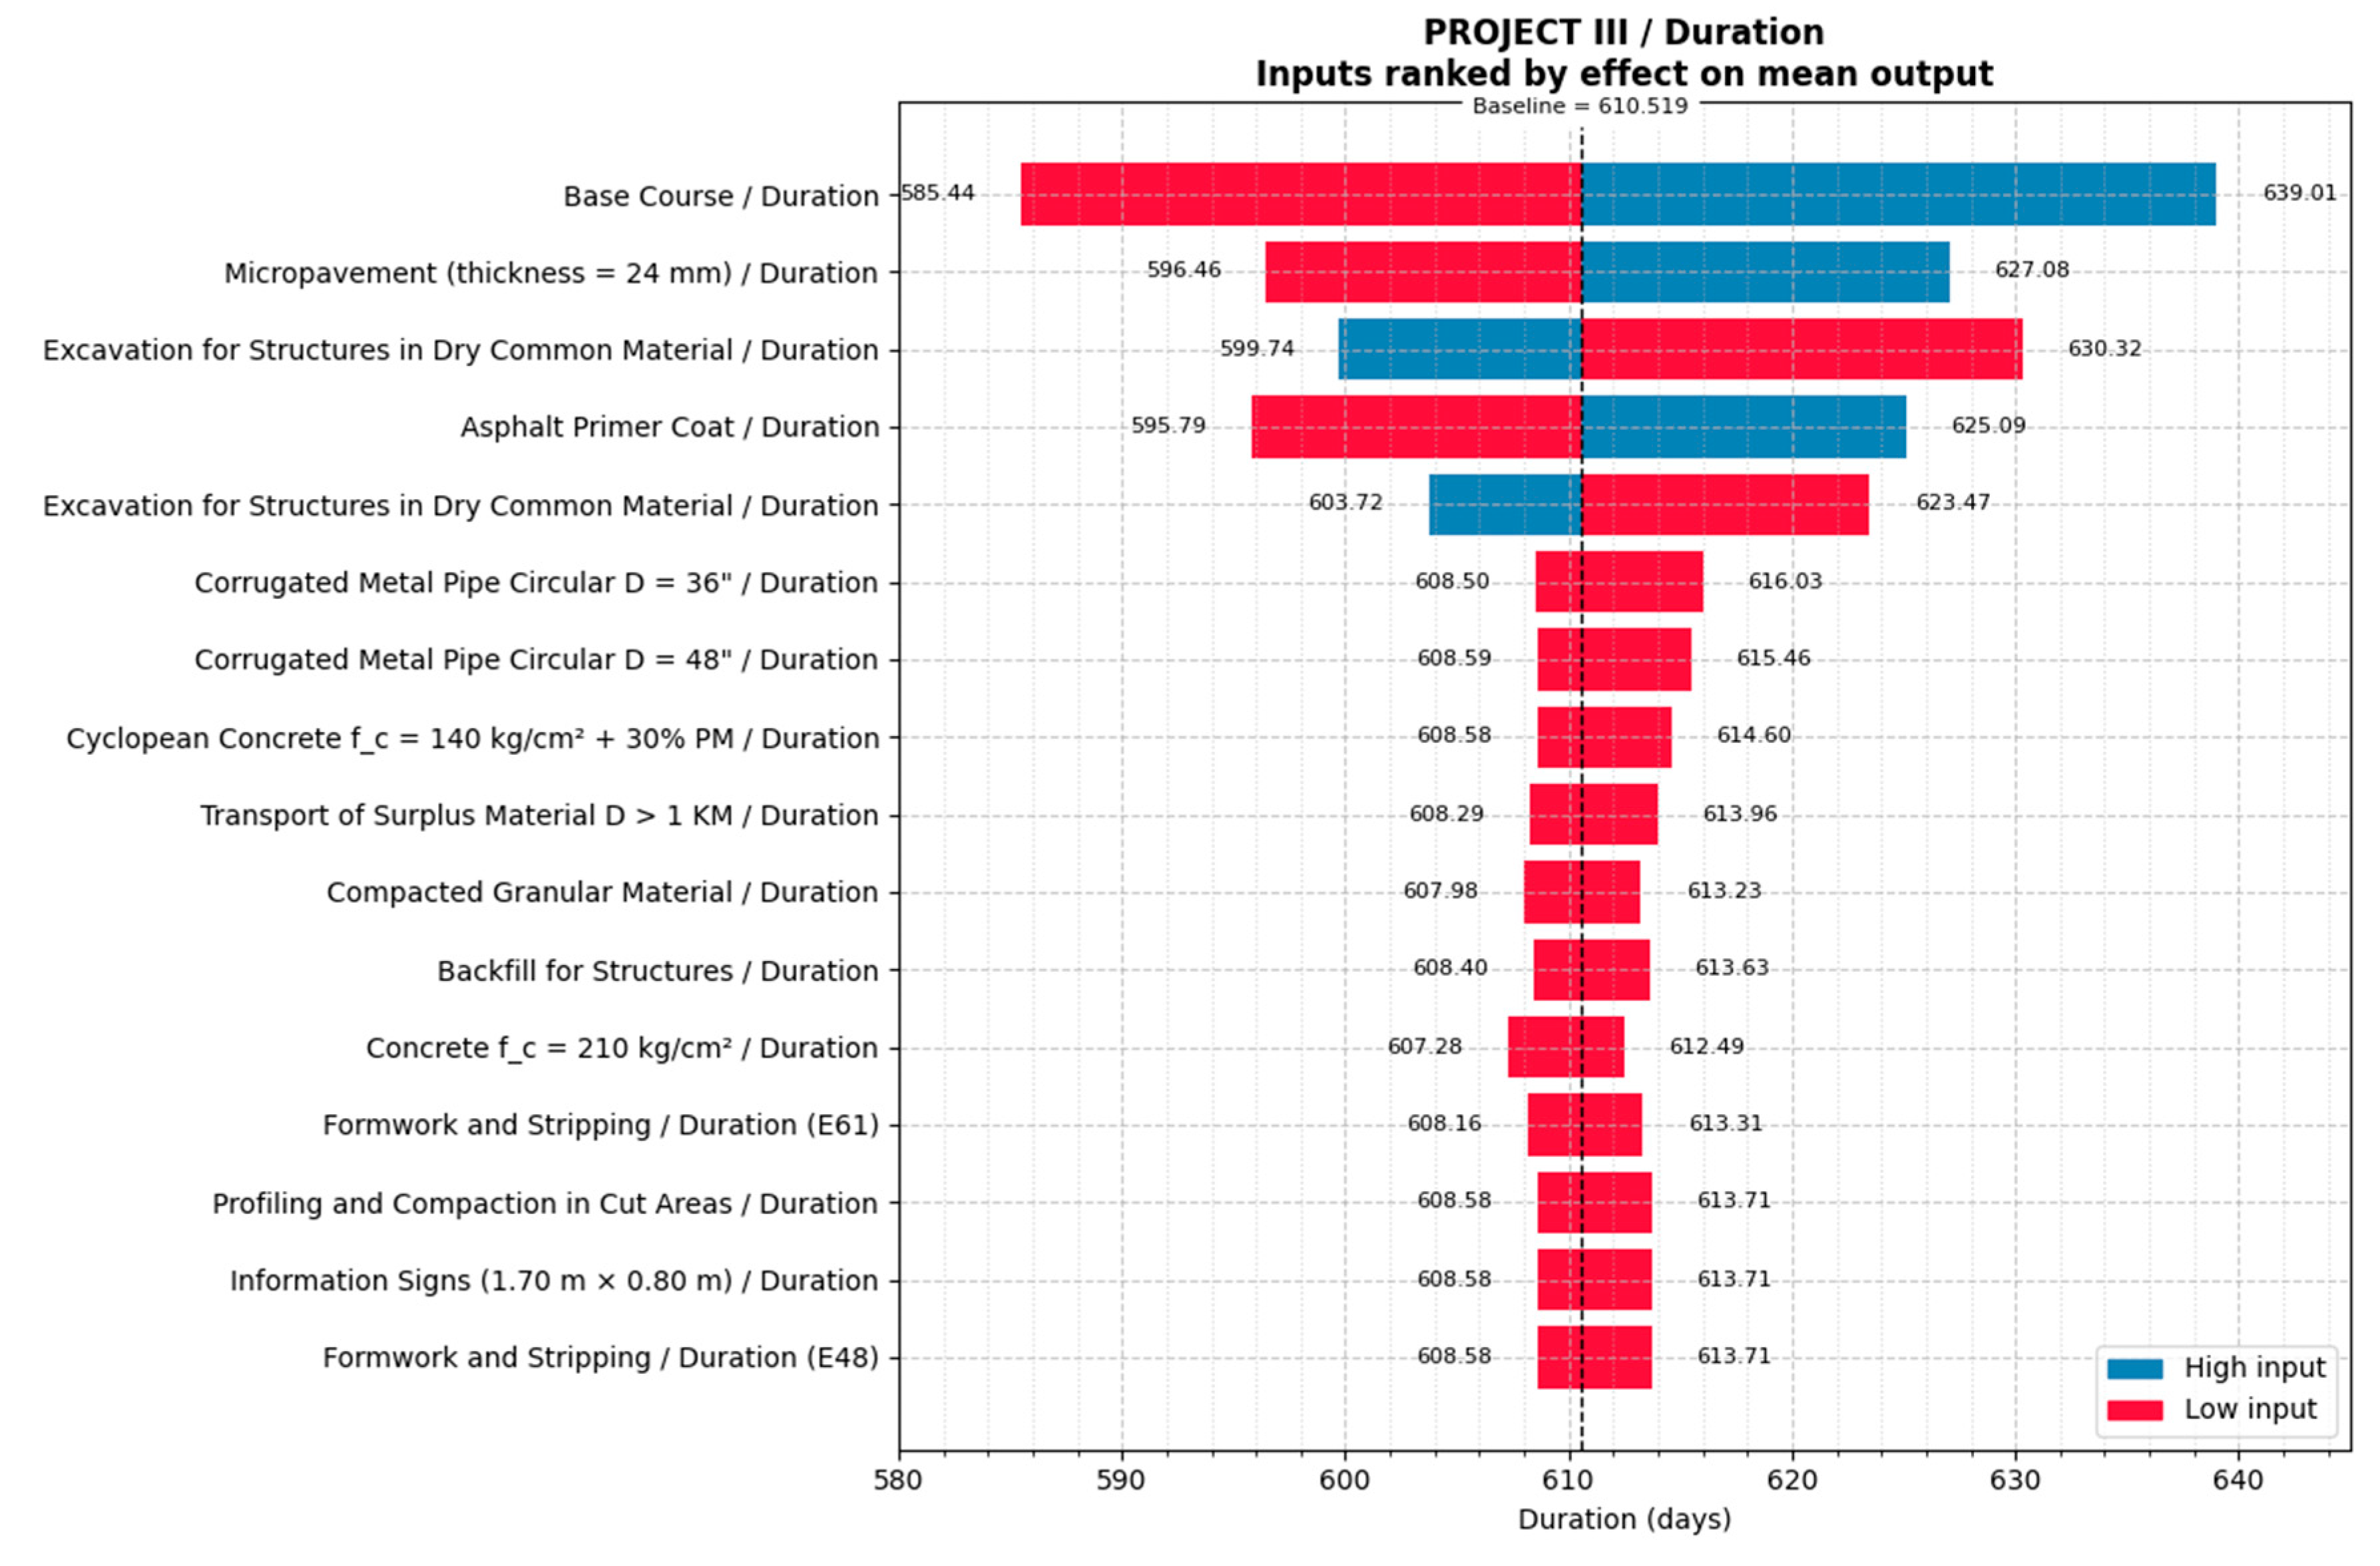
4.6. Estimation of Time for Project III

For the time contingency estimation of Project III, it was necessary to structure the construction activities according to the work breakdown structure (WBS), which differed from the scheduling approach used in Project I. This was because Project III primarily consisted of road construction, with bridge works having less significance and not influencing the project’s critical path. Figure 14 shows the schedule for Project III developed in MS Project. This project considered a total execution period of 506 calendar days and accounted for reduced productivity rates during the rainy season, from December 2023 to March 2024.
Based on all these factors, the results of the schedule risk analysis provided a time estimate ranging from 564 days to 651 days for Project III, as shown in Figure 15. According to the same figure, the activities related to the base layers and micro-paving introduced the greatest potential variability to the schedule. This highlighted the need for continuous monitoring of these activities to ensure effective control of the project timeline. Figure 16 illustrates the sensitivity analysis of the results.
The schedule risk analysis based on the Monte Carlo simulations showed stability in the estimated values as the number of simulations increased. Table 9 presents the results of this analysis. The mean contingency time remained around 610 days across all iterations (5000, 10,000, and 50,000 simulations), with minimal variations in the minimum value (ranging from 532.48 to 539.34 days) and the maximum value (ranging from 689.15 to 703.87 days). The 95th percentile fluctuated between 651.29 and 651.48 days, indicating a slight dispersion of risk. The contingency percentage remained stable, with values ranging from 28.71% to 28.84%, suggesting that the model adequately converged from 5000 simulations onward.

4.7. Statistical Validation of the Hypotheses

To validate the research hypotheses, a one-sample t-test was applied, comparing the deterministic estimates of cost and time against the probabilistic means obtained through quantitative risk simulations such as Monte Carlo for cost and schedule risk analysis for time. The statistical test evaluates whether the differences observed are significant enough to reject the null hypothesis (H0) in favor of the alternative hypothesis (H1). The detailed results are presented in Table 10.
Across all the case studies and simulation sizes, the t-values were consistently high, and the corresponding p-values were below 0.0001. These results indicated statistically significant differences between the deterministic and probabilistic estimates, supporting the rejection of the null hypothesis with a 95% confidence level.
The statistical significance observed in both the cost and time estimates empirically validated the effectiveness of the proposed methodology. These findings confirm that probabilistic approaches provide a more realistic and robust representation of uncertainty in infrastructure project planning, thus improving the accuracy of forecasts and decision-making.

5. Discussion

5.1. Research Gaps and Contributions

This study addressed the implementation gap by proposing a framework that balances methodological consistency with operational simplicity. Unlike prior studies that target highly trained technical audiences, this methodology was intentionally designed to facilitate adoption by professionals with limited exposure to probabilistic modeling. It integrates cost and schedule risk analysis within a unified structure, using carefully selected probability distribution functions (PDFs) adapted to data availability, historical trends, and expert judgment.
Notably, in the Peruvian context, the previous applications of quantitative risk analysis focused on domains such as road safety [86], structural performance [87], or geotechnical assessments [88], but no comprehensive framework had yet been proposed to address both the cost and time risks in infrastructure planning. Our contribution responds to this gap by offering the following:
(a)
A combined risk assessment methodology for cost and schedule estimation;
(b)
An evidence-based selection of probability functions tailored to contextual constraints;
(c)
Empirical validation across three real-world road infrastructure projects with measurable gains in estimation accuracy.
The flexible design of this framework allows for replication in similar regional contexts with limited technical infrastructure. Moreover, it holds potential for adaptation to other infrastructure types—such as ports, railways, or energy projects—by adjusting input parameters and risk categories accordingly.
In doing so, this study bridges the gap between academically validated techniques and their real-world application under constrained conditions. It contributes not only to infrastructure risk management in Latin America but also to the broader discourse on democratizing access to advanced project control tools in global development contexts.

5.2. Optimizing Cost and Time Through Quantitative Risk Analysis

Quantitative risk analysis methods represent a robust alternative for optimizing cost and schedule estimation in road construction projects, particularly when compared to traditional deterministic methods, which often underestimate uncertainty. In the case studies analyzed (New Central Highway, Oyon-Ambo Road, and Combapata Local Road), the application of Monte Carlo simulation and schedule risk analysis enabled more accurate estimates, demonstrating controlled deviations ranging from 1.5% to 11% in costs and from 28.71% to 91.6% in schedules. These techniques proved their ability to reduce cost overruns and delays by identifying variability associated with critical structural elements (e.g., tunnels and viaducts) and activities with high impact on the schedule (e.g., traffic maintenance and earthworks). This probabilistic approach can be adopted in any civil engineering project with comparable baseline data.
Despite existing barriers, the results emphasize the relevance of focusing mitigation strategies on the factors that contribute most to cost and schedule variance. These findings are consistent with previous studies [25,89] that recommend the use of probabilistic models to manage the high complexity and uncertainty inherent in road infrastructure projects. In the case of the New Central Highway, the comparison with the historical trend of cost overruns of up to 32.29%, shown in Appendix A.2, highlights the potential of quantitative analysis to stabilize the project’s financial outcomes. On the scheduling side, the observed gap compared to the deterministic method underlines the need to prioritize the monitoring of the most critical activities. For future research, it is proposed to expand the methodology to other infrastructure sectors, such as railways and urban transportation systems, and to explore artificial intelligence and machine learning tools to enhance the robustness and accuracy of predictions [69].

5.3. Study Limitations

This study was based on three Peruvian infrastructure projects selected through convenience sampling, which limits the statistical generalizability of the findings. While the cases reflect diverse geographic and operational conditions, they were chosen primarily for methodological validation. Additionally, no new algorithms were developed; this contribution lies in the adaptation and integration of existing quantitative techniques within a structured framework. Cost and time data were obtained from official sources, and although complete, their accuracy depended on project documentation and expert input. These limitations suggest that future studies should apply the proposed method to broader datasets to reinforce its external validity.

6. Conclusions

This study confirmed that quantitative risk analysis methods—specifically, the integration of Monte Carlo simulation and schedule risk analysis—can significantly enhance the accuracy of cost and time estimations in road infrastructure projects. By applying this framework to three Peruvian case studies, this research demonstrated that cost contingency estimates ranged between 1.34% and 11%, well below the cost overruns of up to 32.29% recorded in comparable projects. Similarly, schedule contingency allocations ranged from 28.71% to 91.67%, reflecting a more realistic appraisal of project timelines than conventional deterministic models.
The methodology’s primary contribution lies in its dual qualities of adaptability and accessibility. By incorporating probability distribution functions customized to each project’s data availability and complexity, the framework supports its replicability in infrastructure sectors beyond road construction, including ports, railways, and urban transport systems.
Nevertheless, the scope of generalization is limited due to the use of convenience sampling and case selection based on data accessibility. These constraints suggest that further research is needed to validate the framework in a broader range of project types and contexts.
Importantly, institutional inertia and the lack of standardized risk modeling practices in the Peruvian construction industry remain key challenges to broader implementation. Addressing these barriers requires not only technical refinement but also strategic efforts in capacity building and organizational change. Future research should extend the application of this framework to other infrastructure sectors and explore the integration of artificial intelligence and machine learning tools, which could enhance risk prediction by efficiently processing large and complex datasets.
Ultimately, this research offers a scientifically grounded yet operationally practical contribution to risk management in infrastructure development, especially in regions with limited technical resources. By bridging the gap between theoretical models and their real-world implementation, it supports more reliable and accountable decision-making in public and private project planning.

Author Contributions

Conceptualization, V.A.A.F.; methodology, V.A.A.F. and G.Z.A.; software, V.A.A.F.; validation, V.A.A.F. and G.Z.A.; formal analysis, V.A.A.F.; investigation, V.A.A.F.; resources, V.A.A.F.; data curation, V.A.A.F.; writing—original draft preparation, V.A.A.F.; writing—review and editing, G.Z.A.; visualization, V.A.A.F.; supervision, G.Z.A.; project administration, V.A.A.F.; funding acquisition, V.A.A.F. All authors have read and agreed to the published version of the manuscript.

Funding

This research was funded by the Ariza Ingenieros Consulting Firm and the APC was funded by Universidad Nacional Federico Villarreal.

Data Availability Statement

The original contributions presented in this study are included in the article; further inquiries can be directed to the corresponding author.

Acknowledgments

This research work has been carried out thanks to the significant contribution of the Graduate School of the Universidad Nacional Federico Villareal. Likewise, we are grateful to the School of Civil Engineering at the Universidad Nacional Mayor de San Marcos and the Postgraduate School of the Pontificia Universidad Católica de Chile, who supported previous research related to this study.

Conflicts of Interest

The authors declare no conflicts of interest.

Appendix A

Appendix A.1

Table A1. Search strategy for systematic literature review.
DatabaseBoolean Equation
ScopusTITLE-ABS-KEY (“construction*” OR “building*” OR “project*”) AND TITLE-ABS-KEY (“cost*” OR “time*” OR “optimization*” OR “budget*”) AND TITLE-ABS-KEY (“risk*” OR “hazard*” OR “danger*”) AND TITLE-ABS-KEY (“analysis*” OR “assessment*” OR “evaluation*” OR “measurement*” OR “prediction*” OR “optimization*”) AND TITLE-ABS-KEY (“quantitative*” OR “statistical*” OR “mathematical*” OR “simulation*” OR “artificial intelligence*”) AND TITLE-ABS-KEY (“method*” OR “model*” OR “technique*” OR “tool*”)
Web of ScienceTS = (“construction*” OR “building*” OR “project*”) AND TITLE-ABS-KEY (“cost*” OR “time*” OR “optimization*” OR “budget*”) AND TS = (“risk*” OR “hazard*” OR “danger*”) AND TS=(“analysis*” OR “assessment*” OR “evaluation*” OR “measurement*” OR “prediction*” OR “optimization*”) AND TS = (“quantitative*” OR “statistical*” OR “mathematical*” OR “simulation*” OR “artificial intelligence*”) AND TS = (“method*” OR “model*” OR “technique*” OR “tool*”)
ProQuestAB(“construction*” OR “building*” OR “project*”) AND TITLE-ABS-KEY (“cost*” OR “time*” OR “optimization*” OR “budget*”) AND (“risk*” OR “hazard*” OR “danger*”) AND (“analysis*” OR “assessment*” OR “evaluation*” OR “measurement*” OR “prediction*” OR “optimization*”) AND (“quantitative*” OR “statistical*” OR “mathematical*” OR “simulation*” OR “artificial intelligence*”) AND (“method*” OR “model*” OR “technique*” OR “tool*”)

Appendix A.2

The analysis of the road infrastructure projects showed that most of the projects experienced cost overruns, with increases ranging from 0.09% to 32.29%. The projects with the highest increases included the retaining wall in Chaquecyaco (32.29%), Pampallacta—Ancobamba (25.53%), and Coshto—Irhua—Huaraz (23.41%). However, some projects maintained their initial costs, such as Batangrande—Mayascong and Arcuella—Miraflores. These data reflect the variability in the estimation of initial and final costs in road infrastructure projects in Peru.
Table A2. Sample analysis of cost overruns in road projects in Peru [90].
NumberRoad ProjectStart (Day/Month/Year)Initial Cost (PEN) (PEN)Final Cost (PEN)Cost Overrun
1La Unión—Collonce (Amazonas)22/01/132,899,6003,385,27616.75%
2San Cristóbal—MO 104 (Moquegua)18/03/0916,943,08920,711,16622.24%
3Moya—Qui Iri (Huancavelica)01/10/12688,411688,9990.09%
4Tahuada—Sisco (Áncash)20/10/126,734,3577,900,51017.32%
5Chirumpiari—Villa Virgen (Cusco)04/03/134,693,4465,071,4148.05%
6Paccayura—Huayllati (Apurímac)17/09/123,567,4823,793,9186.35%
7Cocabambilla—Tancayoc (Cusco)01/02/123,386,6614,053,84019.70%
8Red. de Velocidad Km 213—214 (Huánuco)20/04/1435,00040,00014.29%
9Boca Mantalo—Alto Mantalo (Cusco)03/11/106,214,7567,047,45513.40%
10Ángel Cruz Mellizo (Áncash)03/02/14920,000920,0000.00%
11Alto Confortayoc—Fundo Paraíso (Cusco)16/01/143,563,2694,413,62423.86%
12Batangrande—Mayascong (Lambayeque)02/06/1415,122,74715,122,7470.00%
13Patay—Jatun Patay (Huánuco)20/04/152,579,2962,674,6243.70%
14Reductores de Velocidad Cusco—Sicuani13/04/1546,79053,96015.32%
15Playa Hermosa—La Chamana (Cajamarca)21/09/152,746,3502,746,3500.00%
16San Lorenzo—Monzante—Miraflores14/04/143,020,7453,042,1160.71%
17Rudacancha—Saulama (Ayacucho)05/10/15382,957384,0570.29%
18Oyolo—Ushua—Corculla05/12/1014,594,01816,774,72614.94%
19Variante San Pedro—Changa (Áncash)01/11/16229,663229,6630.00%
20Huachón—Huancabamba (Pasco)14/10/163,227,7663,419,0695.93%
21Yanashalla—Pachana (Áncash)19/06/17274,653312,94613.94%
22Rosaspampa—Callejón (Ayacucho)02/01/1812,847,44913,264,3393.24%
23Coshto—Irhua—Huaraz (Áncash)01/02/18757,336934,60523.41%
24Huaros—Huacos (Canta)03/12/184,319,0804,769,51210.43%
25Pampallacta—Ancobamba (Apurímac)13/09/187,284,6359,144,74925.53%
26Quichipata—Gopa (Áncash)10/12/18334,026334,0260.00%
27Puente y vía Chuspin—Huaripata (Áncash)09/09/19427,787431,0170.76%
28Muro de Contención Chaquecyaco (Áncash)01/10/1981,436107,73432.29%
29Pistas y Veredas en Cura Mori (Piura)17/12/19998,1411,034,7433.67%
30Cajamarquilla—Kanin—Cullash (Áncash)24/05/07357,683357,6830.00%
31Accesos al Circuito Turístico de Playas (Chimbote)20/01/207,682,7178,166,8896.30%
32Las Aradas—Rinconada (Piura)07/09/2090,228108,35220.09%
33Arcuella—Miraflores (Huancavelica)02/10/2030,21030,2100.00%
34Trocha Ramírez—Trancucho (Cajamarca)14/01/211,252,9181,284,5262.52%
35Movilidad Urbana—Los Pescadores (Lima)30/05/22614,252619,1320.79%

References

  1. Aljohani, A. Construction Projects Cost Overrun: What Does the Literature Tell Us? Int. J. Innov. Manag. Technol. 2017, 8, 137–143. [Google Scholar] [CrossRef]
  2. Abdelalim, A.M.; Salem, M.; Salem, M.; Al-Adwani, M.; Tantawy, M. An Analysis of Factors Contributing to Cost Overruns in the Global Construction Industry. Buildings 2024, 15, 18. [Google Scholar] [CrossRef]
  3. Schwab, K. The Global Competitiveness Report; World Economic Forum: Geneva, Switzerland, 2019. [Google Scholar]
  4. International Institute for Management Development. IMD World Competitiveness Booklet 2022; IMD: Lausanne, Switzerland, 2022; Available online: https://imd.cld.bz/IMD-World-Competitiveness-Booklet-2022 (accessed on 20 September 2022).
  5. IMD World Competitiveness Center. IMD World Competitiveness Booklet 2023; IMD: Lausanne, Switzerland, 2023; Available online: https://worldcompetitiveness.imd.org/ (accessed on 21 September 2024).
  6. Ministerio de Economía y Finanzas (MEF). Plan Nacional de Infraestructura para la Competitividad; MEF: Lima, Peru, 2019. [Google Scholar]
  7. Contraloría General de la República. Reporte de Obras Paralizadas; Contraloría General de la República: Lima, Peru, 2024. [Google Scholar]
  8. OSCE. In Guía Práctica No 6: ¿Cómo se Implementa la Gestión de Riesgos en la Planificación de la Ejecución de Obras? OSCE: Lima, Peru, 2017.
  9. Ariza Flores, V.A.; Portocarrero, E. Integrating Resilience in Construction Risk Management: A Case Study on Peruvian Road Infrastructure. E3S Web Conf. 2024, 497, 02019. [Google Scholar] [CrossRef]
  10. Project Management Institute (PMI). The Standard for Risk Management in Portfolios, Programs, and Projects; PMI: Newtown Square, PA, USA, 2019. [Google Scholar]
  11. Project Management Institute (PMI). Guía de los Fundamentos para la Dirección de Proyectos—Guía del PMBOK, 6th ed.; PMI: Newtown Square, PA, USA, 2017. [Google Scholar]
  12. SmartPM. Construction Cost Overruns: An Industry in Crisis. Available online: https://smartpm.com/blog/construction-cost-overruns/ (accessed on 8 February 2025).
  13. Flyvbjerg, B.; Skamris Holm, M.; Buh, S. Underestimating Costs in Public Works Projects: Error or Lie? J. Am. Plan. Assoc. 2002, 68, 279–295. [Google Scholar]
  14. Flyvbjerg, B.; Skamris Holm, M.; Buhl, S. Five Things You Should Know about Cost Overrun. Transp. Res. Part A Policy Pract. 2018, 118, 174–190. [Google Scholar] [CrossRef]
  15. Abed, Y.G.; Hasan, T.M.; Zehawi, R.N. Cost Prediction for Roads Construction Using Machine Learning Models. Int. J. Electr. Comput. Eng. Syst. 2022, 13, 927–936. [Google Scholar] [CrossRef]
  16. Abd, A.M.; Kareem, Y.A.; Zehawi, R.N. Prediction and Estimation of Highway Construction Cost Using Machine Learning. Eng. Technol. Appl. Sci. Res. 2024, 14, 17222–17231. [Google Scholar] [CrossRef]
  17. Yun, S. Performance Analysis of Construction Cost Prediction Using Neural Network for Multioutput Regression. Appl. Sci. 2022, 12, 9592. [Google Scholar] [CrossRef]
  18. Washington Post. It’s Official: Boston’s Big Dig Will Be Done. Available online: https://www.washingtonpost.com/wp-dyn/content/article/2007/12/25/AR2007122500600.html (accessed on 1 March 2025).
  19. Alstom. Alstom to Supply Driverless Trains and Digital Signalling System for Sydney Metro Extension. Available online: https://www.alstom.com/press-releases-news/2019/11/alstom-supply-driverless-trains-and-digital-signalling-system-sydney (accessed on 1 March 2025).
  20. The Economic Times. Mumbai Metro-3 Opens Today: Stations, Timings, Fares, and Key Details about City’s First Underground Line. Available online: https://economictimes.indiatimes.com/news/india/mumbai-metro-3-opens-today-stations-timings-fares-and-key-details-about-citys-first-underground-line/articleshow/113997417.cms (accessed on 1 March 2025).
  21. El Espectador. Por fin Concluyó Doble Calzada Bogotá-Girardot. Available online: https://www.elespectador.com/bogota/por-fin-concluyo-doble-calzada-bogota-girardot-article-486296/ (accessed on 1 March 2025).
  22. Invierte.pe. Banco de Inversiones. Consulta de Inversiones. Available online: https://ofi5.mef.gob.pe/invierte/consultapublica/consultainversiones (accessed on 1 March 2025).
  23. AACE International. 42R-08: Risk Analysis and Contingency Determination Using Parametric Estimating; AACE International: Morgantown, WV, USA, 2021. [Google Scholar]
  24. AACE International. 57R-09: Integrated Cost and Schedule Risk Analysis Using Risk Drivers and Monte Carlo Simulation of a CPM Model; AACE International: Morgantown, WV, USA, 2019. [Google Scholar]
  25. Ariza Flores, V.A.; Salvador, R. Adaptive Risk Management in Road Construction: Oyon-Ambo Highway Insights, El Niño 2019 Case Study. E3S Web Conf. 2024, 497, 02020. [Google Scholar] [CrossRef]
  26. Garrido Martins, C.; Bogus, S.M.; Valentin, V. Quantitative Risk Assessment Model and Optimization in Infrastructure Fast-Track Construction Projects. Infrastructures 2023, 8, 78. [Google Scholar] [CrossRef]
  27. Olarte, W. An Integrated Approach to Project Planning: Reducing Uncertainty to Improve Safety and Cost. Ph.D. Thesis, Texas A&M University, College Station, TX, USA, 2021. [Google Scholar]
  28. Chau Hai, L. Novel Data-Driven Approaches for Enhanced Project Duration and Cost-Related Decision Making. Ph.D. Thesis, Texas A&M University, College Station, TX, USA, 2021. [Google Scholar]
  29. Jeong, J.; Jeong, J. Quantitative Risk Evaluation of Fatal Incidents in Construction Based on Frequency and Probability Analysis. J. Manag. Eng. 2022, 38, 04021089. [Google Scholar] [CrossRef]
  30. Lee, J.; Jeong, J.; Soh, J.; Jeong, J. Quantitative Analysis of the Accident Prevention Costs in Korean Construction Projects. Buildings 2022, 12, 1536. [Google Scholar] [CrossRef]
  31. Jeong, J.; Jeong, J. Novel Approach of the Integrated Work & Risk Breakdown Structure for Identifying the Hierarchy of Fatal Incident in Construction Industry. J. Build. Eng. 2021, 41, 102406. [Google Scholar] [CrossRef]
  32. Selleck, R.; Cattani, M.; Hassall, M. Proposal for and Validation of Novel Risk-Based Process to Reduce the Risk of Construction Site Fatalities (Major Accident Prevention (MAP) Program). Saf. Sci. 2023, 158, 105986. [Google Scholar] [CrossRef]
  33. Lu, Y.; Gong, P.; Tang, Y.; Sun, S.; Li, Q. BIM-Integrated Construction Safety Risk Assessment at the Design Stage of Building Projects. Autom. Constr. 2021, 124, 103553. [Google Scholar] [CrossRef]
  34. Oguz Erkal, E.D.; Hallowell, M.R.; Bhandari, S. Practical Assessment of Potential Predictors of Serious Injuries and Fatalities in Construction. J. Constr. Eng. Manag. 2021, 147, 04021129. [Google Scholar] [CrossRef]
  35. Hwang, J.-M.; Won, J.-H.; Jeong, H.-J.; Shin, S.-H. Identifying Critical Factors and Trends Leading to Fatal Accidents in Small-Scale Construction Sites in Korea. Buildings 2023, 13, 2472. [Google Scholar] [CrossRef]
  36. Xu, X.; Zou, P.X.W. Discovery of New Safety Knowledge from Mining Large Injury Dataset in Construction. Saf. Sci. 2021, 144, 105481. [Google Scholar] [CrossRef]
  37. Santiago Oliveira, S.; de Albuquerque Soares, W.; Vasconcelos, B.M. Fatal Fall-from-Height Accidents: Statistical Treatment Using the Human Factors Analysis and Classification System—HFACS. J. Saf. Res. 2023, 86, 118–126. [Google Scholar] [CrossRef]
  38. Zermane, A.; Tohir, M.Z.M.; Baharudin, M.R.; Yusoff, H.M. Investigating Patterns of Workplace Fatal Fall Injuries: Case Study of Malaysia. J. Saf. Res. 2023, 85, 492–506. [Google Scholar] [CrossRef]
  39. Chen, W.; Deng, J.; Niu, L. Identification of Core Risk Factors and Risk Diffusion Effect of Urban Underground Engineering in China: A Social Network Analysis. Saf. Sci. 2022, 147, 105591. [Google Scholar] [CrossRef]
  40. Won, J.W.; Jung, W.; Baek, S.; Han, S.H. Probability and Impact Perspectives on Cost and Schedule Risks in International Construction Projects: An Empirical Investigation. KSCE J. Civ. Eng. 2024, 28, 2600–2612. [Google Scholar] [CrossRef]
  41. Małysa, T. Relative Risk (RR) Analysis and Prediction as Part of Assessing Occupational Safety and Determining Priorities for Action in Occupational Health and Safety in the Construction Industry in Poland. Buildings 2023, 13, 1304. [Google Scholar] [CrossRef]
  42. Kang, S.; Kang, Y.; Kim, S. Long-term Trends in Construction Engineering and Management Research in Korea. KSCE J. Civ. Eng. 2023, 27, 1883–1897. [Google Scholar] [CrossRef]
  43. Gleißner, W.; Wolfrum, M. Risikoaggregation und Monte-Carlo-Simulation Schlüsseltechnologie für Risikomanagement und Controlling, 1st ed.; Springer: Berlin, Germany, 2019. [Google Scholar] [CrossRef]
  44. Bukaçi, E.; Korini, T.; Periku, E.; Allkja, S.; Sheperi, P. Number of Iterations Needed in Monte Carlo Simulation Using Reliability Analysis for Tunnel Supports. Int. J. Eng. Res. Appl. 2016, 6, 60–64. [Google Scholar]
  45. Koulinas, G.K.; Demesouka, O.E.; Sidas, K.A.; Koulouriotis, D.E. A TOPSIS—Risk Matrix and Monte Carlo Expert System for Risk Assessment in Engineering Projects. Sustainability 2021, 13, 11277. [Google Scholar] [CrossRef]
  46. Montufar Benítez, M.A.; Mora Vargas, J.; Castro Esparza, J.R.; Rivera Gómez, H.; Montaño Arango, O. Comparative Study of Monte Carlo Simulation and the Deterministic Model to Analyze Thermal Insulation Costs. Appl. Math. 2024, 4, 305–319. [Google Scholar] [CrossRef]
  47. Kostrzewa-Demczuk, P.; Rogalska, M. Planning of Construction Projects Taking into Account the Design Risk. Arch. Civ. Eng. 2023, 69, 613–626. [Google Scholar] [CrossRef]
  48. Ökmen, Ö.; Öztaş, A. Construction Project Network Evaluation with Correlated Schedule Risk Analysis Model. J. Constr. Eng. Manag. 2008, 134, 49–63. [Google Scholar] [CrossRef]
  49. Sackey, S.; Kim, B.-S. Schedule Risk Analysis Using a Proposed Modified Variance and Mean of the Original Program Evaluation and Review Technique Model. KSCE J. Civ. Eng. 2019, 23, 1484–1492. [Google Scholar] [CrossRef]
  50. Fitzsimmons, J.P.; Lu, R.; Hong, Y.; Brilakis, I. Construction Schedule Risk Analysis—A Hybrid Machine Learning Approach. J. Inf. Technol. Constr. 2022, 27, 70–93. [Google Scholar] [CrossRef]
  51. Jin, L.; Yin, Y.; Du, F.; Yuan, H.; Zheng, C. Impact of Engineering Changes on Value Movement in Fund Flow: Monte Carlo-System Dynamics Modeling Approach. Buildings 2023, 13, 2218. [Google Scholar] [CrossRef]
  52. Jang, J.; Jeong, E.; Cho, J.; Kim, T.W. Exploring Simultaneous Effects of Delay Factors in Precast Concrete Installation. Buildings 2024, 14, 3894. [Google Scholar] [CrossRef]
  53. Zaneldin, E.; Ahmed, W. A Generic Framework for Managing Schedule and Cost Risks of Construction Activities Using PERT and the EV Technique. Buildings 2024, 14, 1918. [Google Scholar] [CrossRef]
  54. He, X.; Yao, Y.; Xia, H.W.; Su, Y.W.; Liu, G. Cost Estimation of Construction Project Using Fuzzy Neural Network Model Embedded with Modified Particle Optimizer. Adv. Mater. Res. 2011, 243–249, 6296–6301. [Google Scholar] [CrossRef]
  55. Jiang, Q. Estimation of Construction Project Building Cost by Back-Propagation Neural Network. J. Eng. Des. Technol. 2019, 18, 601–609. [Google Scholar] [CrossRef]
  56. Elfaki, A.O.; Alatawi, S.; Abushandi, E. Using Intelligent Techniques in Construction Project Cost Estimation: 10-Year Survey. Adv. Civ. Eng. 2014, 2014, 107926. [Google Scholar] [CrossRef]
  57. Pham, T.Q.D.; Le-Hong, T.; Tran, X.V. Efficient Estimation and Optimization of Building Costs Using Machine Learning. Int. J. Constr. Manag. 2023, 23, 909–921. [Google Scholar] [CrossRef]
  58. Tayefeh Hashemi, S.; Ebadati, O.M.; Kaur, H. Cost Estimation and Prediction in Construction Projects: A Systematic Review on Machine Learning Techniques. SN Appl. Sci. 2020, 2, 1703. [Google Scholar] [CrossRef]
  59. Yuan, J.; Yin, C. Cost Estimation of Expressway Construction and Installation Engineering Based on Convolutional Neural Networks. J. Eng. Stud. 2023, 15, 446–455. [Google Scholar] [CrossRef]
  60. Hamdy, K.; AbdelRasheed, I.; Essawy, Y.A.S.; ElDeen, A.G. Automated Risk Analysis for Construction Contracts Using Neural Networks. J. Leg. Aff. Disput. Resolut. Eng. Constr. 2024, 16, 04524023. [Google Scholar] [CrossRef]
  61. Turkyilmaz, A.H.; Polat, G. Risk-Based Completion Cost Overrun Ratio Estimation in Construction Projects Using Machine Learning Classification Algorithms: A Case Study. Buildings 2024, 14, 3541. [Google Scholar] [CrossRef]
  62. Moussa, A.; Ezzeldin, M.; El-Dakhakhni, W. Predicting and Managing Risk Interactions and Systemic Risks in Infrastructure Projects Using Machine Learning. Autom. Constr. 2024, 168, 105836. [Google Scholar] [CrossRef]
  63. Salama, A. Evaluating the Impact of Construction Delays on Project Duration Using Machine Learning and Multi-Criteria Decision Analysis. Asian J. Civ. Eng. 2025, 26, 389–399. [Google Scholar] [CrossRef]
  64. Anjum, A.; Hrairi, M.; Shaikh, A.A.; Yatim, N.; Ali, M. Integrating AI and Statistical Methods for Enhancing Civil Structural Practices: Current Trends, Practical Issues, and Future Direction. Frat. Integrità Strutt. 2024, 19, 164–181. [Google Scholar] [CrossRef]
  65. Amicosante, A.; Avenali, A.; D’Alfonso, T.; Giagnorio, M.; Manno, A.; Matteucci, G. Predicting Costs of Local Public Bus Transport Services through Machine Learning Methods. Expert Syst. Appl. 2025, 260, 125396. [Google Scholar] [CrossRef]
  66. Ruiz, J.G.; Díaz, H.; Crespo, R.G. The Application of Artificial Intelligence Planning and Scheduling in Photovoltaic Plant Construction Projects. Expert Syst. 2025, 42, e13798. [Google Scholar] [CrossRef]
  67. Helaly, H.; El-Rayes, K.; Ignacio, E.J.; Joan, H.J. Comparison of Machine-Learning Algorithms for Estimating Cost of Conventional and Accelerated Bridge Construction Methods during Early Design Phase. J. Constr. Eng. Manag. 2025, 151, 04025004. [Google Scholar] [CrossRef]
  68. Koc, K. Role of National Conditions in Occupational Fatal Accidents in the Construction Industry Using Interpretable Machine Learning Approach. J. Manag. Eng. 2023, 39, 04023037. [Google Scholar] [CrossRef]
  69. Oliveira de Sousa, F.; Ariza Flores, V.A.; Cunha, C.S.; Oda, S.; Xavier Ratton Neto, H. Multi-Criteria Assessment of Flood Risk on Railroads Using a Machine Learning Approach: A Case Study of Railroads in Minas Gerais. Infrastructures 2025, 10, 12. [Google Scholar] [CrossRef]
  70. Hofstadler, C.; Kummer, M. Chancen- und Risikomanagement in der Bauwirtschaft; Springer: Berlin/Heidelberg, Germany, 2017. [Google Scholar] [CrossRef]
  71. Damnjanovic, I.; Reinschmidt, K. Data Analytics for Engineering and Construction Project Risk Management. In Risk, Systems and Decisions; Springer International Publishing: Cham, Switzerland, 2020. [Google Scholar] [CrossRef]
  72. Palisade Corporation. @Risk User Guide; Palisade Corporation: Ithaca, NY, USA, 2020. [Google Scholar]
  73. Oracle. Oracle Primavera Cloud Risk Management User Guide; Oracle: New York, NY, USA, 2025. [Google Scholar]
  74. Safran. Safran Risk User Guide; Safran: Stavanger, Norway, 2024. [Google Scholar]
  75. Senić, A.; Dobrodolac, M.; Stojadinović, Z. Predicting Extension of Time and Increasing Contract Price in Road Infrastructure Projects Using a Sugeno Fuzzy Logic Model. Mathematics 2024, 12, 2852. [Google Scholar] [CrossRef]
  76. Palisade Corporation. @RISK, version 8.4; Palisade Corporation: Ithaca, NY, USA, 2024. [Google Scholar]
  77. Espinoza Jaco, J.C.; Lopez Galarza, C.M.; Venero, R.M.; Quispe, J.A.D. Monte Carlo Simulation in a Peruvian Highway. Civ. Eng. Archit. 2021, 9, 1727–1734. [Google Scholar] [CrossRef]
  78. Cochran, W. Sampling Techniques; Wiley: Hoboken, NJ, USA, 1953. [Google Scholar] [CrossRef]
  79. Li, C. Unveiling Different Probability Distribution Functions and Their Applications. Sci. Technol. Eng. Chem. Environ. Prot. 2024, 1, 10. [Google Scholar] [CrossRef]
  80. Keefer, D.L. Certainty Equivalents for Three-Point Discrete-Distribution Approximations. Manag. Sci. 1994, 40, 760–773. [Google Scholar] [CrossRef]
  81. Keefer, D.L.; Bodily, S.E. Three-point Approximations for Continuous Random Variables. Manag. Sci. 1983, 29, 595–609. [Google Scholar] [CrossRef]
  82. Putcha, C.; Dutta, S.; Gupta, S.K. Probability and Density Functions. In Mathematical Modeling and Analysis; Springer: Cham, Switzerland, 2021; pp. 1–14. [Google Scholar] [CrossRef]
  83. Hamedani, G.G.; Goual, H.; Emam, W.; Tashkandy, Y.; Ahmad Bhatti, F.; Ibrahim, M.; Yousof, H.M. A New Right-Skewed One-Parameter Distribution with Mathematical Characterizations, Distributional Validation, and Actuarial Risk Analysis, with Applications. Symmetry 2023, 15, 1297. [Google Scholar] [CrossRef]
  84. Mohd Fauzi, N.F.; Rusyda Roslan, N.N.; Muhammad Ridzuan, M.I. Reliability Performance of Distribution Network by Various Probability Distribution Functions. Int. J. Electr. Comput. Eng. 2023, 13, 2316–2325. [Google Scholar] [CrossRef]
  85. Bosch-Badia, M.-T.; Montllor-Serrats, J.; Tarrazon-Rodon, M.-A. Risk Analysis through the Half-Normal Distribution. Mathematics 2020, 8, 2080. [Google Scholar] [CrossRef]
  86. Nuñez, E. Propuesta para Mejorar la Seguridad Vial en la Empresa TRANSPORTE LLAMOSAS S.R.LTDA Mediante un Sistema de Gestión de Riesgos Implicados en la Conducción Vehicular. Ph.D. Thesis, Universidad Nacional de San Agustín, Arequipa, Peru, 2020. Available online: https://repositorio.unsa.edu.pe/server/api/core/bitstreams/9025f087-0bff-4522-ab27-0a160d722283/content (accessed on 21 September 2024).
  87. Aroquipa, H. Resiliencia de los Sistemas Estructurales ante Eventos Sísmicos Evaluados Mediante las PML y PAE. Ph.D. Thesis, Universidad Nacional Federico Villarreal, Lima, Peru, 2022. [Google Scholar]
  88. Tarazona, C. Modelo Matemático de Regresión Lineal Múltiple para Determinar los Desplazamientos en Laderas Inestables Generadoras de Impactos Ambientales en Obras de Servicio Carrozable—Huaraz. Ph.D. Thesis, Universidad Nacional Federico Villarreal, Lima, Peru, 2019. [Google Scholar]
  89. Ariza Flores, V.; Oliveira de Sousa, F.; Oda, S. Enhancing Risk Management in Road Infrastructure Facing Flash Floods through Epistemological Approaches. Buildings 2024, 14, 1931. [Google Scholar] [CrossRef]
  90. Contraloría General de la República de Perú. Sistema de Información de Obras Públicas. Available online: https://infobras.contraloria.gob.pe/InfobrasWeb/DataSets (accessed on 22 February 2025).
Figure 1. Methodological framework of research.
Infrastructures 10 00139 g001
Figure 2. Results of the Monte Carlo simulation for the CAPEX estimation of Project I. The red area represents the 90% confidence interval for the total construction budget.
Infrastructures 10 00139 g002
Figure 3. Results of the Monte Carlo simulation for Cost sensitivity analysis, using a tornado diagram, of Project I.
Infrastructures 10 00139 g003
Figure 4. Input data for the schedule risk analysis of Project I. Blue cells are input values for Risk software; the red cell is an output result.
Infrastructures 10 00139 g004
Figure 5. Results of the Monte Carlo simulation for the time estimation of Project I. The red area represents the 90% confidence interval for the total construction schedule.
Infrastructures 10 00139 g005
Figure 6. Results of the Monte Carlo simulation for Time sensitivity analysis, using a tornado diagram, of Project I.
Infrastructures 10 00139 g006
Figure 7. Results of the Monte Carlo simulation for the cost estimation of Project II. The red area represents the 90% confidence interval for the total construction budget.
Infrastructures 10 00139 g007
Figure 8. Results of the Monte Carlo simulation for the Cost sensitivity analysis, using a tornado diagram, of Project II.
Infrastructures 10 00139 g008
Figure 9. Project II schedule—Oyon-Ambo Road. Red bars represent critical path activities with zero float, while the blue bars correspond to non-critical activities that have available float within the project schedule.
Infrastructures 10 00139 g009
Figure 10. Results of the Monte Carlo simulation for the time estimation of Project II. The red area represents the 90% confidence interval for the total construction schedule.
Infrastructures 10 00139 g010
Figure 11. Results of the Monte Carlo simulation for the Time sensitivity analysis, using a tornado diagram, of Project II.
Infrastructures 10 00139 g011
Figure 12. Results of the Monte Carlo simulation for the budget estimation of Project III. The red area represents the 90% confidence interval for the total construction budget.
Infrastructures 10 00139 g012
Figure 13. Results of the Monte Carlo simulation for the sensitivity analysis, using a tornado diagram, of Project III.
Infrastructures 10 00139 g013
Figure 14. Project III schedule—Combapata Road. Red bars represent critical path activities with zero float, while the blue bars correspond to non-critical activities that have available float within the project schedule.
Infrastructures 10 00139 g014
Figure 15. Results of the Monte Carlo simulation for the time estimation of Project III. The red area represents the 90% confidence interval for the total construction schedule.
Infrastructures 10 00139 g015
Figure 16. Results of the Monte Carlo simulation for the Time sensitivity analysis, using a tornado diagram, of Project III.
Infrastructures 10 00139 g016
Table 1. Cost and time overruns in road infrastructure projects.
ProjectCountryInitial CostFinal CostEstimated
Duration
Final
Duration
Source
(Million USD)(Million USD)
Big DigUSA280080807 years15 years[18]
Sydney Metro NorthwestAustralia830093004 years5 years[19]
Mumbai Metro Line 3India350045005 years9 years[20]
Bogota–GirardotColombia64726005 years10 years[21]
Puente NanayPeru162.77177.103 years5 years[22]
Table 2. Summary of Quantitative Risk Analysis Techniques.
CategoryQuantitative Risk Analysis TechniquesNumber of ArticlesSource
Statistical
Analysis
Contingency Reserve Estimation12[29,30,31,32,33,34,35,36,37,38,39,40]
Correlation Analysis
Mathematical ModellingDecision Tree Analysis [38,40,41]
Expected Monetary Value4
Fault Tree Analysis
SimulationMonte Carlo Simulation [42,43,44,45,46,47,48,49,50,51,52,53]
PERT Review Technique12
Discrete Event Simulation
Schedule Risk Analysis
Artificial IntelligenceMachine Learning19[15,16,17,42,54,55,56,57,58,59,60,61,62,63,64,65,66,67,68,69]
Optimization Algorithms
Deep Learning
Table 3. Probability distribution functions applied to risk analysis.
Probability Distribution FunctionUseNumber of ArticlesSource
NormalTo model variables concentrated around a mean value8Manual: [23,24]; Books: [70,71]; Guide: [72]
TriangularWhen the minimum, maximum, and most likely values are known, but there is limited historical data 8Manual: [10,23,24]; Books: [70,71]; Guide: [72,73,74]
Beta PERTSimilar to the Triangular distribution, but with smoother behavior at the extremes.8Manual: PMI; Books: [70,71]; Guide: [72,73,74]
UniformUsed when risks have limited available information.6Manual: [23,24]; Books: [70]; Guide: [72,73]
Log-NormalFor variables that cannot take negative values (costs and time)5Manual: [23,24]; Books: [70]; Guide: [74]
PoissonFor discrete events such as the occurrence of accidents or interruptions.5Manual: [23,24]; Books: [71]; Guide: [72,74]
FittingWhen there is a considerable amount of data and traditional distributions may not provide a good fit.3Manual: [23,24]; Books: [70]; Guide: [72]
Table 4. Technical data for case study projects.
ProjectProjectPhaseInitial CostInitial Time
Project INueva Carretera CentralDesignPEN 24,000 million1800 days
Project IICarretera Oyon-AmboConstructionUSD 83,363,610720 days
Project IIICarretera Vecinal CombapataConstructionUSD 6,682,378360 days
Table 5. Results of Monte Carlo simulations for cost estimation.
Number of SimulationsMin95th Percentile P95MaxKurtosis
5000 simulations26,533,279,357.0127,115,168,952.0027,270,668,140.763.188
10,000 simulations26,526,642,932.1627,113,731,500.0027,352,760,178.793.118
50,000 simulations26,504,497,848.4927,113,706,915.5627,335,243,146.823.233
100,000 simulations26,438,506,279.4327,112,407,226.3027,345,584,841.163.226
Table 6. Three-point estimates and Monte Carlo simulation inputs for schedule risk analysis.
Schedule PerformancePPC (%)Three-Point Estimate ConceptSimulation Monte Carlo (1/ PPC)
Minimum70%Pessimistic142%
Historical Average85%Most Likely117%
Maximum100%Optimistic100%
Table 7. Results of the Monte Carlo simulation for the time estimation of Project II.
Results for n SimulationsMinMean (50%)Max95% PercentileTime
Contingency
5000 simulations802.93992.861313.211112.8954.57%
10,000 simulations779.98993.991322.26111955.42%
50,000 simulations772.15993.121340.741113.754.68%
Table 8. Results of Monte Carlo simulation for the cost estimation of Project III.
Results for n SimulationsMinMean (50%)Max95% PercentileCost Contingency (USD)Cost Contingency (%)
5000 sim6,501,136.116,682,315.066,880,812.726,772,148.9789,770.651.34%
10,000 sim6,487,497.826,682,120.696,875,369.766,772,892.7990,514.471.35%
50,000 sim6,472,831.816,682,409.946,882,386.706,773,712.4391,334.111.37%
Table 9. Results of the Monte Carlo simulation for the time estimation of Project III.
Results for n SimulationsMinMean (50%)Max95% PercentileTime
Contingency
5000 simulations539.34610.52698.76651.4828.75%
10,000 simulations532.48610.48689.15651.9228.84%
50,000 simulations535.49610.56703.87651.2928.71%
Table 10. Statistical validation of the hypotheses using one-sample t-test.
Projectn (Simulations)VariableDeterministic
Estimate
Probabilistic
Estimate (P95)
t-Valuep-Value
Project I5000Cost24,065,320.5227,115,168,952.001412.96<0.0001
Project I10,000Cost24,065,320.5227,113,731,500.001998.22<0.0001
Project I50,000Cost24,065,320.5227,113,706,915.564468.17<0.0001
Project I100,000Cost24,065,320.5227,112,407,226.306318.94<0.0001
Project II5000Time720992.86388.66<0.0001
Project II10,000Time720993.99554.36<0.0001
Project II50,000Time720993.121239.6<0.0001
Project II5000Cost6,682,378.066,772,148.9760.7<0.0001
Project II10,000Cost6,682,378.066,772,892.7985.87<0.0001
Project II50,000Cost6,682,378.066,773,712.43191.84<0.0001
Project II10,000Time506610.48148.1<0.0001
Project II50,000Time506610.56330.91<0.0001
Disclaimer/Publisher’s Note: The statements, opinions and data contained in all publications are solely those of the individual author(s) and contributor(s) and not of MDPI and/or the editor(s). MDPI and/or the editor(s) disclaim responsibility for any injury to people or property resulting from any ideas, methods, instructions or products referred to in the content.

