Abstract
Irregular multistorey buildings are prone to seismic forces due to torsional effects resulting from the eccentricity between the mass and stiffness centres. Shear walls are essential in multistorey buildings for improving structural behaviour when subjected to earthquake loads. The seismic response of buildings is highly sensitive to the placement and configuration of shear walls within the building infrastructure. This research focuses on optimising the location of shear walls in a T-shaped irregular reinforced concrete structure for better seismic resilience. The structural analysis is carried out, and the building is evaluated via the response spectrum as per the provisions of IS 1893:2016. This study examines various shear wall configurations to achieve optimised modal mass participation, thereby reducing dynamic irregularities and enhancing overall seismic performance. The impact of these optimised locations is assessed across various seismic zones in India, with a focus on critical response parameters, including lateral displacement, interstorey drift, storey shear, and base shear. The results reveal that strategically optimised shear wall placement significantly enhances seismic performance by reducing lateral drift and torsional effects. In this study, the shear wall configurations that resulted in higher modal participation factors and lower eccentricities between the centre of mass and the centre of stiffness demonstrated a superior seismic performance across all considered seismic zones.
1. Introduction
Post-earthquake damage surveys consistently show that asymmetric or irregular buildings are more vulnerable to seismic damage than regular buildings. This vulnerability arises from lateral seismic forces, which create nonuniform stress paths and concentrate deformation in weak zones caused by abrupt changes in mass, stiffness, or strength. These irregularities, often introduced by architectural demands or site constraints, can lead to localised failure or collapse during strong earthquakes [1,2].
Modern multistorey buildings frequently exhibit irregularities in mass, stiffness, or strength, either along their height or in their plan configuration. While some of these irregularities may arise from functional or site-related factors, they significantly affect the seismic response [3,4]. A building is considered symmetric when its centre of mass (CM) and centre of stiffness (CS) align vertically at every floor. In practice, however, minor asymmetries are almost inevitable in plane and elevation, significantly affecting the seismic response [5,6]. Seismic design codes typically classify irregularities into plane (horizontal) and vertical (elevation) irregularities. Many buildings exhibit combinations of both, resulting in complex dynamic behaviour [7,8]. Vertical irregularities, such as soft stories and mass discontinuities, can disrupt the lateral load path, increasing seismic demands [9,10]. Plan irregularities, such as L-, T-, or U-shaped buildings, cause torsional coupling effects due to an uneven mass and stiffness distribution [3,11].
Torsional irregularity is particularly critical, as it causes the building to twist, amplifying forces and increasing ductility demands [1,12]. Misalignment of the CM and CS leads to eccentric moments, resulting in lateral–torsional coupling that affects lateral stability [5,13]. According to the seismic code IS 1893:2016 [14], torsional irregularity exists when the displacement at one edge of a floor exceeds 1.5 times the displacement at the opposite edge. Similarly, FEMA 450 and ASCE 7-16 classify a structure as torsionally irregular if the maximum storey drift at one edge exceeds 1.2 times the average drift, whereas extreme torsional irregularity occurs beyond a ratio of 1.4 [15,16]. Even symmetrically designed buildings can experience accidental torsion during earthquakes due to rotational ground motion components or uncertainties in mass and stiffness distributions. Therefore, building codes introduce accidental eccentricity, which is typically assumed to be 5–10% of the plane dimension perpendicular to the seismic force direction [6,17]. Torsionally irregular buildings are more challenging to design than symmetric buildings because torsion amplifies both floor displacements and force concentrations, leading to localised failures and progressive collapse under severe seismic events [11,18].
1.1. Vertical Irregularities
Vertical irregularities, such as soft stories, setback structures, or sudden mass/stiffness discontinuities, disrupt the uniform lateral load path and create weak planes that experience greater interstorey drifts [9,19]. Setback buildings and stepped frames, for example, introduce significant mass and stiffness variations at each setback level, leading to complex higher-mode vibrations. For such structures, simplified static analyses are often insufficient, and time-history or response spectrum analyses are recommended [20,21]. Researchers have shown that vertical irregularities amplify both lateral and torsional demands. Similarly, Viti et al. [22] reported that even slight variations in concrete strength could induce unintended stiffness eccentricity, thereby exacerbating torsional effects. To strengthen the structure with vertical irregularities, efforts have also been made using retrofitting interventions, including the use of shear walls, to eliminate the vertical irregularity caused by the reduction in column cross-section at the third storey of an RC frame [23].
1.2. Implications for Seismic Design
Past earthquakes demonstrate that both plan and vertical irregularities significantly increase seismic vulnerability. While seismic codes (e.g., IS 1893:2016, Eurocode 8) provide guidelines for identifying these irregularities, recent studies suggest that these provisions may not be sufficient for performance-based seismic design [7,15,18]. Recent studies emphasise the importance of floor rotation, rather than storey drift ratios, as a more accurate measure of torsional irregularity [24]. To mitigate these issues, strategies such as optimal shear wall placement within the building infrastructure, improved diaphragm rigidity, and seismic separation joints have been proposed [25,26].
2. Literature Review
Torsional irregularity has been extensively studied as a key factor influencing the seismic response of structures. Hejal and Chopra [1] analysed lateral–torsional coupling in asymmetric buildings and reported that the ratio of uncoupled torsional to lateral frequencies governs the force distribution and response spectra. Goel and Chopra [2] further demonstrated that inelastic systems are less sensitive to plan asymmetry than elastic systems because of their inherent energy dissipation capacity. Guevara et al. [3] suggested modelling irregular buildings as separate regular blocks with seismic joints, highlighting that plan irregularity amplifies torsional effects. Hutchinson et al. [4] noted that torsional coupling effects vary with the vertical position of the storey.
The effect of eccentricities on the seismic performance of structures has been well studied by many investigators in the past. Chandler et al. [5,6] showed that code-specified accidental torsion strongly influences ductility and deformation demands, particularly in torsionally unbalanced structures. De la Llera and Chopra [7] and Lin et al. [8] proposed improved estimation methods for accidental torsion, whereas Paulay [9] introduced a simplified force–displacement-based method for ductile buildings. Stathopoulos and Anagnostopoulos [10] and De Stefano and Pintucchi [11] emphasised combined axial and lateral force interactions in multistorey inelastic systems. Cosenza et al. [12] found that Eurocode 8 provisions are adequate for torsionally stiff buildings but inadequate for flexible systems. Zheng et al. [13] compared the seismic codes of China, the US, and Europe, revealing that none reliably capture actual torsional behaviour. Jinjie et al. [15] introduced the “torsion angle capacity spectrum method” to improve seismic performance evaluation. Tabatabaei [16] revealed that torsional coupling is strongest when torsional and lateral frequencies coincide. Moon [17] developed a design scheme that accounts for temporal eccentricity variations. Broderick and McCrum [18] validated the torsional responses of irregular steel-braced frames via full-scale inelastic tests. Further, Valente [27] investigated the seismic response and retrofitting of a non-ductile plan-wise irregular RC building. Lin et al. [19] reported that torsional effects decrease with increasing plastic deformation. Gokdemir et al. [20] emphasised the importance of improving lateral rigidity and providing seismic separation to mitigate torsion.
Rajalakshmi et al. [21] showed that compared with regular buildings, mass and stiffness irregularities lead to greater displacements and localised damage. Viti et al. [22] reported that concrete strength variability induces stiffness eccentricity, whereas Bensalah et al. [28] reported that earthquake intensity significantly influences dynamic eccentricity and ultimate roof displacement. Moehle [24] highlighted that discontinuous shear walls cause significant torsional amplification of interstorey drift under inelastic conditions. Bertero [25] proposed a simplified formula to estimate strength reduction due to inelastic torsion. Hong [26] investigated stiffness eccentricity in wall systems.
Lee et al. [29] reported that code-based period formulas tend to underestimate the actual natural periods of RC shear wall buildings. Gulay and Calim [30] concluded that torsionally irregular shear wall–frame systems result in higher design forces. Demir et al. [31] and Colunga and Osornio [32] reported that shear deformations shift the centre of rigidity, thus modifying torsional behaviour. Lee and Ko [33] reported that wall damage due to overturning and shear deformation is independent of wall location. Magliulo and Ramasco [34] explored the effects of vertical strength discontinuities. Sigmund et al. [35] reported that as walls enter the inelastic range, frames contribute more towards seismic resistance. Heerema et al. [36] studied the contribution of individual shear walls in the overall seismic performance of the building. Özmen et al. [37] recommended using floor rotations rather than code-defined drift ratios to evaluate torsional irregularity. Arabzadeh and Galal [38] confirmed that torsional irregularity increases shear demands even when bending moments remain unchanged.
Apart from seismic effects, several studies have addressed the effect of exceptional loads (e.g., tsunami effects), adopting a multi-hazard analysis perspective [39,40]. Further, innovative section analysis methods that allow large-scale assessment of flexural and shear capacity have also been investigated recently [41,42]. Several papers also discuss the state of the art of the methodologies to assess the seismic resilience [43,44,45].
Collectively, these studies highlight that irregular buildings exhibit more complex and damaging seismic behaviour, necessitating advanced analysis and refined design. Most studies on shear walls typically involve idealised symmetrical buildings, i.e., the shape of the buildings is typically symmetric about one or both principal axes. In the present study, however, an irregularly shaped building is considered, which is more realistic in the modern scenario. Furthermore, these studies typically do not consider long buildings, and therefore, the behaviour of such buildings is not extensively explored. However, a realistic multistorey long building, which is separated by an expansion joint, is considered in the present study. Studying the effect of shear wall configurations on the seismic response of structures can help in understanding the true behaviour of the structure and thus provide generalised guidelines. Therefore, in the present study, different shear wall configurations are developed, and their response under a code-specific elastic spectrum is studied. Furthermore, the positioning of these shear walls is optimised based on a contour plot of modal displacement and modal mass participation factor, which is more robust than the random trial-and-error process.
3. Methodology
This study investigates the structural behaviour of a high-rise G + 9 hostel building, with particular emphasis on the effects of shear wall placement under seismic loads. The building has an overall length of 59 m and a total height of 34.2 m, with each storey measuring 3.3 m in height. Given the substantial building length and the need to accommodate expansion joint requirements, the structure is divided into two independent analytical blocks, referred to as the left block and right block, as illustrated in Figure 1. The expansion joint is centrally located, as indicated in Figure 1. Each block is modelled as a separate entity via identical parameters, including the number of stories, structural layout, and loading conditions. This division ensures that the influence of expansion joints is realistically incorporated into the analysis.
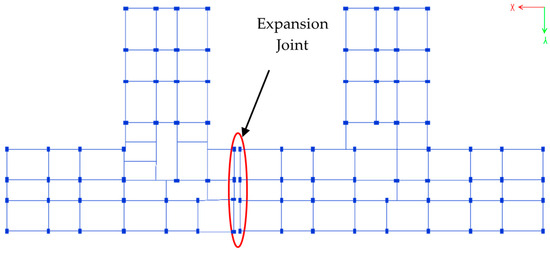
Figure 1.
Layout of the building without shear walls considered for this study.
To explore the effects of shear wall placement, different models are developed for each block (left and right). The only variable among the models is the position of the shear walls; all other parameters, including the geometry, material properties, and boundary conditions, remain constant. These shear wall configurations are decided based on (i) the maximum relative modal displacement criterion and (ii) the modal mass participation criterion as per IS 1893:2016 [14], which suggests at least 65% modal mass participation in the first three modes of vibration. Different models are accordingly finalised based on the above criteria for both the left and right blocks.
The structural analysis was conducted using the ETABS structural analysis software package. A dynamic analysis known as response spectrum analysis is carried out using the elastic response spectrum in accordance with IS 1893 (Part 1): 2016 [14]. The response spectrum is a plot of the maximum response versus the natural time period of a single-degree-of-freedom system for various earthquake ground motions. The typical dead loads and live loads are considered based on IS 875 Part 1 [46] and Part 2 [47], respectively. The details of the building and loads considered in this study are presented in Table 1, and the seismic load parameters used are listed in Table 2.

Table 1.
General details of the building considered for this study.
Table 2.
Seismic zone factors as per IS1893 (Part 1): 2016 [14].
The beams and columns are modelled as frame elements with six degrees of freedom at each node, capable of representing both flexural and axial stiffness. The slabs are modelled using shell elements with membrane and bending stiffness to represent in-plane diaphragm action. Rigid diaphragm constraints were also applied at each floor level to simulate realistic floor behaviour and ensure consistency in mass participation. Shear walls are represented by shell (area) elements with a uniform thickness of 230 mm. Wall elements were meshed at an average panel size of 1.0 m × 1.0 m to ensure adequate convergence and to capture local deformation modes. The base of the building is assigned with fixed support constraints, assuming the foundation prevents translation and rotation at the base nodes.
Seismic gaps are determined based on pounding and thermal effects, and the thermal expansion joint width can be calculated as
where α = the coefficient of thermal expansion of the material for concrete, which is 12 × 10−6/°C.
L = length between expansion joints.
ΔT = temperature variation.
Based on the seismic pounding effect as per IS: 1893 (Part 1): 2016 [14], for buildings or segments on the same floor level and with a similar design,
where R = the response reduction factor.
Δ1 and Δ2 = calculated storey displacement of each left and right building/segment at the corresponding level, respectively.
As shown in Table 3, for all the models, it is ensured that seismic pounding and temperature effects do not influence the structure. Therefore, for practical purposes, the analysis was carried out by considering the left and right blocks separately.
Table 3.
Expansion gap details corresponding to various seismic zones.
4. Results
The response of a multistorey structure with different shear wall configurations in terms of storey shear, base shear, storey displacement, and storey drift is discussed in this section.
The shear wall placement is decided based on the two criteria mentioned in Section 3. As a first step, the shear wall placements are optimised based on the modal displacement corresponding to the translation and torsional mode shapes. For this, a contour plot corresponding to the first mode is extracted from the ETABS software. This contour plot can be used to identify the probable regions of higher translation. The shear walls are then placed in the location corresponding to the maximum relative displacement to minimise the overall translational response of the structure in all three modes. As an example, Figure 2 shows a typical contour plot of the structure’s translational displacement corresponding to the left block. The red colours indicate a lower relative displacement, whereas the darker shade of blue suggests greater relative displacement. Thus, the shear walls can be placed in the regions corresponding to the edges of the building where a darker shade of blue exists. Several models are obtained based on these criteria while ensuring the architectural requirements as well.
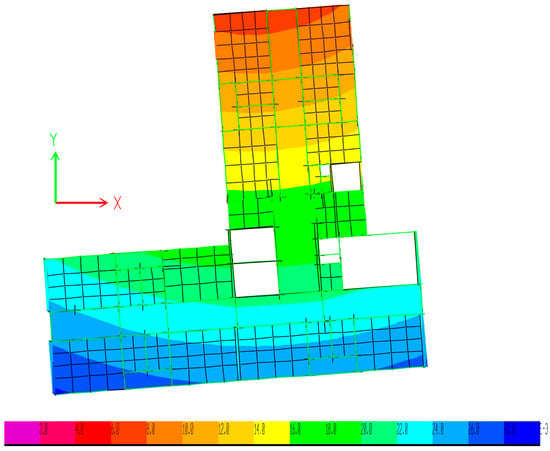
Figure 2.
Typical modal displacement contour of the left block.
As a second step, the developed models are checked based on the criteria set by IS 1893:2016 [14], which is discussed in Section 3 and finalised. To satisfy this requirement, the shear wall configurations that resulted in more than 65% modal mass participation were selected. Accordingly, five models were finalised for each block for this study. Table 4 highlights the modal mass participation for different models for both left and right blocks. It can be seen from the table that all the considered models result in more than 65% modal participation.
Table 4.
Modal participation factors of various models corresponding to left and right blocks.
The models that are finalised for further study are shown in Figure 3. Five different configurations are considered for each block, i.e., left and right blocks separately. In the figures, the shear wall locations are indicated with red-coloured blocks.
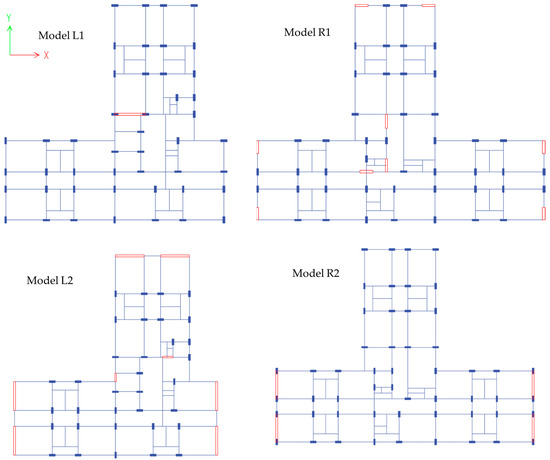
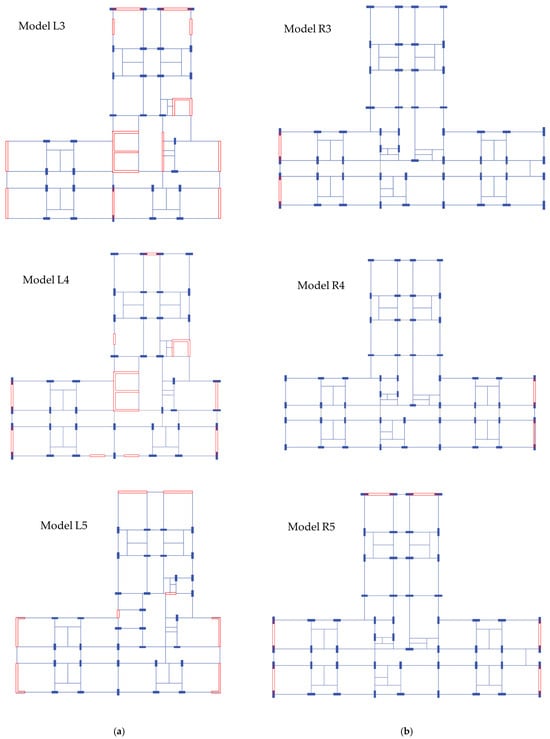
Figure 3.
Shear wall configurations considered for this study: (a) different shear wall configurations in the left block, and (b) different shear wall configurations in the right block.
4.1. Storey Shear Response for Different Shear Wall Configurations
The storey shear is an important parameter considered in the analysis and design of earthquake-resistant structures. Storey shear is the total horizontal force developed at the floor level of each storey due to the lateral forces such as earthquake and wind loads. For the present study, the storey shear values are extracted from ETABS. The design aspects regarding the shear walls and frames are usually governed by storey shear.
4.1.1. Storey Shear Response of Left Block Corresponding to Various Seismic Zones
The storey shear response of the left block corresponding to various seismic zones is shown in Figure 4. These responses correspond to five different shear wall configurations under earthquakes along the X-direction (EQX) and along the Y-direction (EQY). In all the cases, the storey shear increased from the terrace level to the ground floor due to the cumulative effect of seismic forces. The shear at the ground floor (GF) level represents the cumulative shear at the base of the structure, commonly referred to as base shear. The base shear is an important parameter considered in the design of buildings. The size of the columns required and the amount of reinforcement needed for the structure depend on the base shear. The higher the base shear, the larger the column and the reinforcements. It can be seen from the figure that Model L4 consistently exhibited the highest base shear, indicating superior lateral stiffness, whereas Model L1 presented the lowest base shear due to inadequate shear walls. It may be noted that the larger base shear indicates that most of the earthquake forces are resisted by Model L4 rather than the other models. When the responses under various seismic zones were compared, the base shear demand increased significantly with the zone factor, and the maximum base shear in Zone II was approximately 3500 kN in the EQX direction, which increased to 5500 kN in Zone III and nearly 8500 kN in Zone IV, reflecting a relatively high seismic intensity. A similar trend was observed in the EQY direction, although slightly lower values were recorded, indicating some directional stiffness irregularity in the structure. However, optimised shear wall placement reduced this directional difference, improving torsional balance. Compared with Model L1, Models L2, L3, and L5 resulted in moderate improvements in base shear, whereas Model 4 resulted in the largest base shear in comparison with the other models, highlighting that the location of shear walls significantly influences the modal mass participation and overall seismic response. The lower shear in the case of Model L1 is due to the low stiffness offered by the shear walls. The results clearly demonstrate that strategic optimisation of shear wall locations enhances structural performance under seismic loading, especially in higher seismic zones, where lateral forces are more critical.
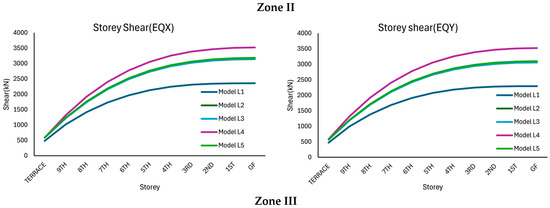
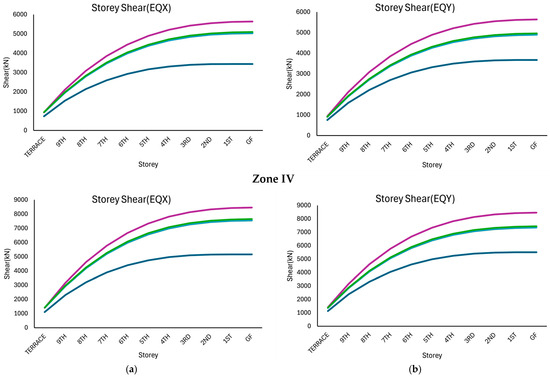
Figure 4.
Storey shear response of the left block structure considered in this study corresponding to various seismic zones: (a) along the x-direction and (b) along the y-direction.
4.1.2. Storey Shear Response of Right Block Corresponding to Various Seismic Zones
The storey shear responses of the irregular structure corresponding to various seismic zones are shown in Figure 5. These responses correspond to five different shear wall configurations in the x- and y-directions. In all the cases, the base shear progressively increased from the terrace level to the ground floor because of the cumulative effect of lateral seismic forces from the upper stories.
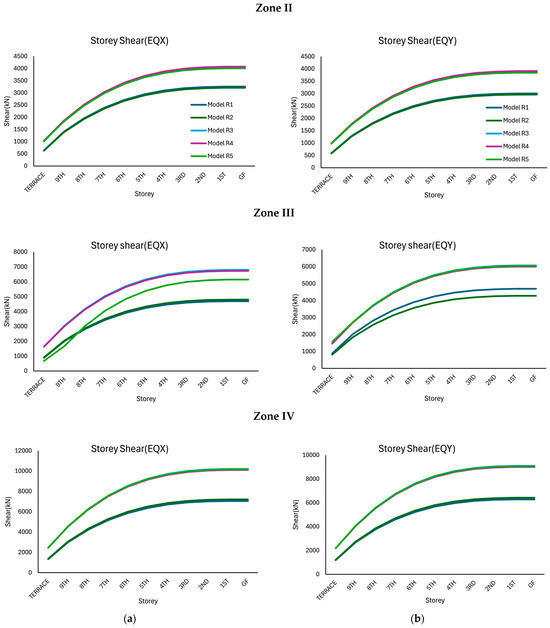
Figure 5.
Storey shear response of the right block structure considered in this study corresponding to various seismic zones: (a) along the x-direction and (b) along the y-direction.
Across seismic zones, an apparent increase in base shear demand was observed with an increasing zone factor. For example, in the EQX direction, the maximum base shear at the terrace level was approximately 4200 kN in Zone II, which increased to approximately 7000 kN in Zone III and further increased to nearly 10,000 kN in Zone IV, reflecting the higher seismic intensity in more critical zones. A similar trend was observed in the EQY direction, with slightly lower values resulting from directional stiffness irregularities in the structure. As can be seen from Figure 5, compared with the other models, Models R4 and R5, with optimised shear wall placement, consistently exhibited the highest base shear across all zones and directions, indicating superior lateral stiffness. Conversely, Model R1, with inadequate shear walls, presented the lowest base shear, indicating weaker lateral resistance. Models R2, R3, and R4 exhibited an intermediate performance, underscoring the significance of shear wall positioning in affecting modal mass participation.
4.2. Storey Displacement Response for Different Shear Wall Configurations
4.2.1. Storey Displacement Response of the Left Block Corresponding to Various Seismic Zones
Control of storey displacement is essential to meet serviceability requirements. Accordingly, the storey displacement responses of the irregular structure corresponding to various seismic zones are shown in Figure 6. These responses correspond to five different shear wall configurations in the x- and y-directions. In all cases, the displacement increased progressively from the ground floor to the terrace. Further, the storey displacement values increase with the increase in seismic zones.
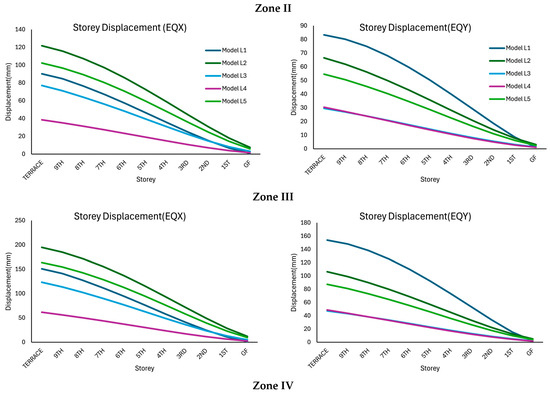
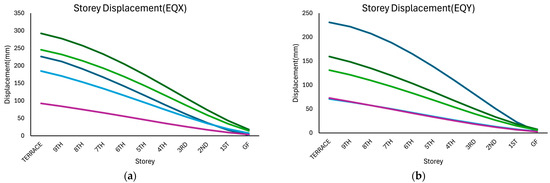
Figure 6.
Storey displacement response of the left block structure considered in this study corresponding to various seismic zones: (a) along the x-direction, (b) along the y-direction.
In Zone II, the terrace displacement for Model L2 was approximately 120 mm in EQX, whereas Model L5 resulted in approximately 100 mm terrace displacement in EQX. Model L1 resulted in lower terrace displacement in comparison with Model L2 and Model L5, followed by Model L3 and Model L4. Model L4 achieved minimum values of approximately 40 mm. In Zone III, all the displacements increase in comparison with the storey displacement values of Zone II, as at higher zones, the seismic forces increase. Similar to the results corresponding to EQX in Zone II, Model L2 shows the highest terrace displacement, followed by Model L5, Model L1, Model L3, and Model L4.
Among all the configurations considered in this study, Model L2 consistently presented the highest storey displacements in the x-direction across all the seismic zones. Meanwhile, along the y-direction, Model L1 consistently showed higher storey displacements in comparison with the results of other models. These large terrace displacements indicate lower structural stiffness in those principal directions. However, Model L4 consistently recorded the lowest displacement values across all seismic zones in both x- and y-directions, suggesting that the stiffness of the structure improved significantly due to this arrangement of shear walls, making it the most effective configuration for the left block as far as the storey displacements are concerned.
4.2.2. Storey Displacement Response of Right Block Corresponding to Various Seismic Zones
As shown in Figure 7, the comparison of storey displacement across seismic zones II, III, and IV for all five models reveals a clear trend of increasing displacement with increasing seismic intensity.
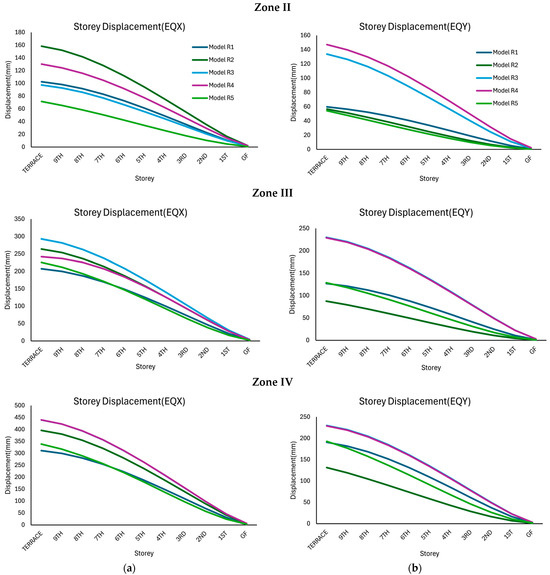
Figure 7.
Storey displacement response of the right block structure considered in this study corresponding to various seismic zones: (a) along the x-direction, and (b) along the y-direction.
In Seismic Zone II, displacements are generally low because of reduced seismic forces. Model R5 records the minimum displacement, which is approximately 70 mm in the EQX and 60 mm in the EQY, indicating high stiffness. In contrast, Model R2 and Model R4 yield higher values of 160 mm and 150 mm in the EQX, respectively, suggesting inadequate lateral resistance even under low seismic demand. Models R1 and R3 have intermediate displacements of 100 mm.
In Zone III, the displacements increased significantly. Unlike the results corresponding to EQX in Zone II, Model R3 shows the highest terrace displacement, followed by Model R2, Model R4, Model R5, and Model R1, respectively. A different pattern is observed for the results corresponding to EQY, where Model R2 undergoes the least terrace displacement of approximately 90 mm. Meanwhile, Models R3 and R4 show the highest displacement of 230 mm. An intermediate displacement of 120 mm is observed for Models R1 and R5. Similar results are obtained for the models in Zone IV, where the least terrace displacements corresponding to EQX and EQY are observed for Model R5 and Model R2, respectively.
Overall, the seismic performance deteriorated with increasing zone severity; however, Model R5 maintained the best resistance towards seismic force in the x-direction for all seismic zones, whereas Model R2 showed the least terrace displacement in the y-direction across all seismic zones, indicating improved structural stiffness due to these arrangements of shear walls, making them the most effective configuration for the right block as far as the storey displacements are concerned.
4.3. Storey Drift Response for Different Shear Wall Configurations
4.3.1. Storey Drift Response of Left Block Corresponding to Various Seismic Zones
The storey drift patterns of the irregular structure are analysed for five shear wall configurations, as shown in Figure 8 for Models L1–L5, under the EQX and EQY directions for seismic zones II, III, and IV. In all the cases, the drift followed a profile, with the maximum values observed at the mid-height of the building and gradually decreasing toward the base and the terrace. The drift values increased progressively from Zone II to Zone IV, reflecting the effect of higher seismic forces in more severe zones.
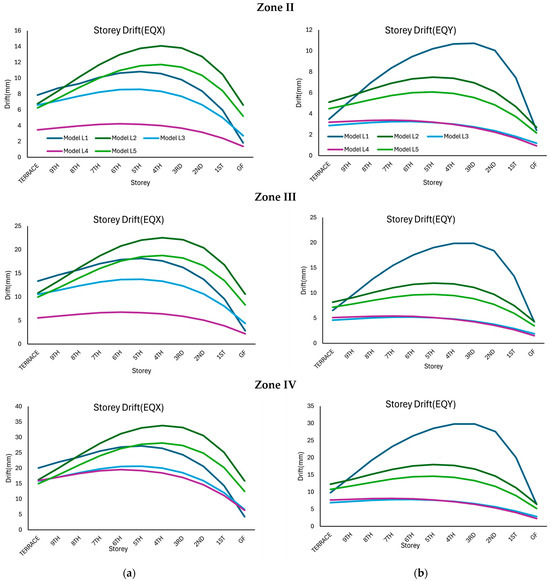
Figure 8.
Storey drift response of the left block structure considered in this study corresponding to various seismic zones: (a) along the x-direction, and (b) along the y-direction.
In Zone II, the maximum drift is observed for Model L2, with a value of approximately 14 mm under EQX, and the least storey drift, of around 4 mm, is observed for Model L4. Model L5, Model L1, and Model L3 show an intermediate drift of 12 mm, 11 mm, and 8 mm, respectively. For the response under EQY, the maximum drift is obtained for Model L1, followed by Model L2, Model L5, Model L4, and Model L3, respectively. A similar response is obtained for the models in Zone III and Zone IV, with slightly increased drift values.
Among all the configurations considered in this study, Model L2 consistently showed the highest storey drift across all the seismic zones in the x-direction, indicating that Model L1 has the lowest lateral stiffness. However, Model L4 consistently recorded the lowest drift values across all seismic zones in the x-direction, making it the most effective configuration. Similarly, the most effective shear wall configuration for forces in the y-direction is as given in Model L3, which showed the least drift value under EQY.
4.3.2. Storey Drift Response of Right Block Corresponding to Various Seismic Zones
The storey drift patterns of the irregular structure were analysed for five shear wall configurations, as shown in Figure 9, for Models R1–R5, under the EQX and EQY directions in seismic zones II, III, and IV. Similar to the results obtained for the left block, in all the cases, the drift followed the expected profile, reaching its maximum at the mid-height of the building and gradually decreasing toward the base and terrace. Further, the drift increased progressively from Zone II to Zone IV as anticipated, because of the higher seismic demands.
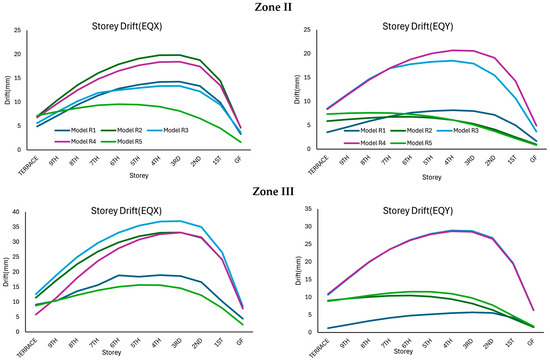
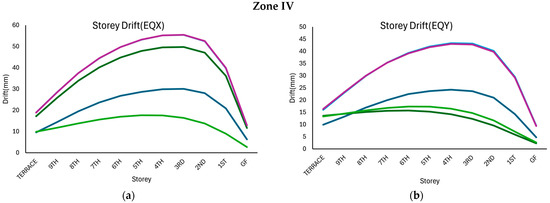
Figure 9.
Storey drift response of the right block structure considered in this study corresponding to various seismic zones: (a) along the x-direction, and (b) along the y-direction.
In Zone II, the maximum drift under EQX is obtained for Model R2, followed by Model R4, Model R1, Model R3, and Model R5, respectively. For the models under EQY, the maximum drift is obtained for Model R4, followed by Model R3, Model R2, Model R5, and Model R1, respectively. A similar response is obtained for the models in Zone III and Zone IV with slightly increased drift values.
Although slight variations were observed between EQX and EQY due to plan irregularities, the optimised shear wall placement in Model R5 minimised these directional differences and improved torsional balance.
Among all the configurations, Model R4 consistently presented the highest drift values across all seismic zones and directions, making it the least favourable configuration due to its poor lateral stiffness. Model R2 also showed high drift but performed slightly better than Model R4. Model R3 made moderate improvements, whereas Model R1 performed marginally better than these intermediate models. In contrast, Model R5 consistently recorded the lowest drift values, demonstrating the most effective control of lateral deformation and torsional effects.
4.4. Statistical Analysis of the Parameters Considered
In general, a shear wall configuration is most efficient if it attracts higher base shear and reduces the values of terrace displacements and peak storey drifts overall. Thus, a statistical analysis was carried out further to obtain other valuable insights regarding the analysis. Table 5 summarises the statistical analysis carried out for the left block.
Table 5.
Summary of statistical analysis corresponding to the left block.
As can be seen from Table 5, for the left block, Model L4 consistently results in higher base shears across all the seismic zones. However, Models L2 and L3 have nearly identical average values, showing similar performance trends of less significance. Further, compared to other models, Model L4 shows a higher standard deviation in the case of base shear, indicating that it is more sensitive to zone intensity and scales more strongly as seismic demand increases. Also, Model L4 results in lower terrace displacements and peak storey drifts compared to other models.
Furthermore, Model L4 has the lowest mean, variability, and maximum displacement, indicating a better performance across the seismic zones from a serviceability perspective.
Model L3 performs reasonably, but with greater variability in displacement across zones. Models L1 and L2 show high displacements, making them less efficient in seismic control. Since Model L4 attracts higher shear, resulting in lower roof displacement and lower storey drift values, it is the most efficient model.
Table 6 summarises the statistical analysis carried out for the various response parameters corresponding to the right block. Models R3, R4, and R5 show higher mean base shears than Models R1 and R2, indicating a better performance. Moreover, Model R5 shows a higher standard deviation in base shear than the other models, indicating good sensitivity towards various seismic zones. Further, Models R1 and R5 show lower mean roof displacements and peak storey displacements than other models, indicating a superior performance. Thus, Model R5 shows a balanced performance, as it shows higher base shear demand while simultaneously reducing roof displacement and peak storey drifts.
Table 6.
Summary of statistical analysis corresponding to the right block.
Based on the statistical analysis, it can be observed that Model L4, corresponding to the left block, and Model R5, corresponding to the right block, result in a superior seismic performance when compared to the other shear wall configuration models. The improved performance can be attributed to the higher modal mass participation factors, as shown in Table 4. Further, it is evident from the analysis that Model L4 of the left block and Model R5 of the right block result in a reduction in the distance between CM and CS, which in turn improves the seismic performance.
5. Conclusions
This research investigated the seismic performance of a T-shaped, irregular, G + 9 reinforced concrete building with various shear wall configurations using ETABS. A dynamic analysis was carried out in accordance with IS 1893:2016 [14]. The analysis focused on critical response parameters—storey shear, base shear, storey displacement, and storey drift—across different seismic zones. The following conclusions are drawn based on the analysis.
The present study focused on the optimisation of shear walls based on the unique approach of modal displacement contour distribution. Shear walls are placed around the zones of higher displacement contours to ensure a better seismic performance. Thus, this approach has a significant advantage over the traditional trial-and-error method of optimisation.
This study emphasises that the strategic placement of shear walls can substantially improve the seismic behaviour of geometrically irregular high-rise structures. The methodology used in this study and the findings can guide designers in selecting efficient and cost-effective shear wall layouts for irregular buildings in seismically active regions.
One of the main response parameters that results in a better seismic performance is the modal participation factor. The models that showed higher modal participation factors, i.e., Model L4 of the left block and Model R5 of the right block, consistently resulted in higher shears across various seismic zones, indicating their better performance than other models.
The parameters that are important from the point of view of serviceability, such as storey displacement and storey drifts, were also considered in this study. The results show that Model L4 of the left block and Model R5 of the right block produce a significant reduction in both parameters compared to the other models.
Models L1 and L2 of the left block, and Model R2 of the right block, consistently result in a poor seismic performance, which can be attributed to a low modal participation factor and a higher torsional response due to the large eccentricity between CM and CS.
The poorly positioned shear walls in Models L1 and L2 resulted in excessive displacements and drifts, rendering them unsuitable for high seismic zones. Models L3 and R3 provided a moderate improvement but did not achieve an optimal performance. Thus, it is clearly demonstrated that the placement of shear walls has a significant impact on the lateral stiffness, torsional balance, and overall seismic resilience of irregular buildings.
In general, it can be concluded that the most optimised shear wall configuration should achieve higher base shear consistently across all the zones and lower roof displacement and storey drifts while still maintaining a higher modal mass participation factor.
For T-shaped irregular buildings, placing shear walls near re-entrant corners and along primary stiff axes is recommended to minimise torsional coupling without compromising architectural functionality.
This study was limited to elastic response spectrum analysis, which is computationally less intensive and serves as a tool for preliminary design. However, a nonlinear time-history analysis is preferred if the performance-based design philosophy, which focuses on achieving specific, measurable performance objectives, such as safety or seismic resistance, is to be followed. Further, as a future study, fragility curves can also be derived to gain knowledge and insights about the seismic vulnerability of the structures.
Author Contributions
Conceptualisation, K.P. and S.A.; methodology, S.A.; software, K.P.; validation, K.P., A.R.A. and M.C.; formal analysis, A.R.A. and M.C.; investigation, A.R.A. and M.C.; resources, K.P. and K.K.; data curation, K.P. and K.K.; writing—original draft preparation, K.P.; writing—review and editing, A.R.A. and M.C.; visualisation, K.P.; supervision, S.A. and A.R.A.; project administration, K.K., A.R.A. and M.C.; funding acquisition, A.R.A. and M.C. All authors have read and agreed to the published version of the manuscript.
Funding
This research received no external funding.
Data Availability Statement
Data may be made available upon request.
Acknowledgments
The authors wish to thank Manipal Academy of Higher Education for providing the necessary facilities.
Conflicts of Interest
Author S. Anil was employed by the company Sundaram Architects Pvt. Ltd. The remaining authors declare that the research was conducted in the absence of any commercial or financial relationships that could be construed as a potential conflict of interest.
Abbreviations
The following abbreviations are used in this manuscript:
| RC | Reinforced concrete |
| CM | Centre of mass |
| CS | Centre of stiffness |
| EQX | Earthquake (load) along the X-direction |
| EQY | Earthquake (load) along the Y-direction |
| GF | Ground floor |
| R | Response reduction factor |
| G + 9 | Ground plus nine (stories/floors) |
References
- Hejal, R.; Chopra, A.K. Lateral-Torsional Coupling in Earthquake Response of Frame Buildings. J. Struct. Eng. 1989, 115, 852–867. [Google Scholar] [CrossRef]
- Goel, R.K.; Chopra, A.K. Inelastic Seismic Response of One-Story, Asymmetric-Plan Systems; Earthquake Engineering Research Center, University of California: Berkeley, CA, USA, 1990. [Google Scholar]
- Guevara, L.T.; Alonso, J.L.; Fortoul, E. Floor-Plan Shape Influence on the Response to Earthquakes. In Proceedings of the 10th World Conference on Earthquake Engineering, Madrid, Spain, 19–24 July 1992; Balkema: Rotterdam, The Netherlands; pp. 3945–3950. [Google Scholar]
- Hutchinson, G.L.; Chandler, A.M.; Rady, M.A. Effect of Vertical Distribution of Mass and Translational Stiffness on Dynamic Eccentricities for a Special Class of Multi-Storey Buildings. BNZSEE 1993, 26, 42–48. [Google Scholar] [CrossRef]
- Chandler, A.M.; Correnza, J.C.; Hutchinson, G.L. Period-Dependent Effects in Seismic Torsional Response of Code Systems. J. Struct. Eng. 1994, 120, 3418–3434. [Google Scholar] [CrossRef]
- Chandler, A.M.; Correnza, J.C.; Hutchinson, G.L. Influence of Accidental Eccentricity on Inelastic Seismic Torsional Effects in Buildings. Eng. Struct. 1995, 17, 167–178. [Google Scholar] [CrossRef]
- De la Llera, J.C.; Chopra, A.K. Evaluation of Code Accidental-Torsion Provisions from Building Records. J. Struct. Eng. 1994, 120, 597–616. [Google Scholar] [CrossRef]
- Lin, W.-H.; Chopra, A.K.; De la Llera, J.C. Accidental Torsion in Buildings: Analysis versus Earthquake Motions. J. Struct. Eng. 2001, 127, 475–481. [Google Scholar] [CrossRef]
- Paulay, T. Seismic Design for Torsional Response of Ductile Buildings. BNZSEE 1996, 29, 178–198. [Google Scholar] [CrossRef]
- Stathopoulos, K.G.; Anagnostopoulos, S.A. Inelastic Earthquake Response of Single-Story Asymmetric Buildings: An Assessment of Simplified Shear-Beam Models. Earthq. Eng. Struct. Dyn. 2003, 32, 1813–1831. [Google Scholar] [CrossRef]
- De Stefano, M.; Pintucchi, B. Seismic Analysis of Eccentric Building Structures by Means of a Refined One Storey Model. In Proceedings of the 13th World Conference on Earthquake Engineering, Vancouver, BC, Canada, 1–6 August 2004. [Google Scholar]
- Cosenza, E.; Manfredi, G.; Realfonzo, R. Torsional Effects and Regularity Conditions in RC Buildings. In Proceedings of the 12th World Conference on Earthquake Engineering, Auckland, New Zealand, 4 February 2000. [Google Scholar]
- Zheng, N.; Yang, Z.; Shi, C.; Chang, Z. Analysis of Criterion for Torsional Irregularity of Seismic Structures. In Proceedings of the 13th World Conference on Earthquake Engineering, Vancouver, BC, Canada, 1–6 August 2004. [Google Scholar]
- IS 1893; IS 1893 (Part 1): 2016—Criteria for Earthquake Resistant Design of Structures. Bureau of Indian Standards (BIS): New Delhi, India, 2016.
- Jinjie, M.; Qingxuan, S.; Qi, Z. Method of Performance Based Seismic Evaluation for Irregular Plane Reinforced Concrete Frame Structures. In Proceedings of the 14th World Conference on Earthquake Engineering, Beijing, China, 12–17 October 2008; pp. 12–17. [Google Scholar]
- Tabatabaei, R. Torsional Vibration of Eccentric Building Systems. In Recent Advances in Vibrations Analysis; IntechOpen: London, UK, 2011; ISBN 978-953-307-696-6. [Google Scholar]
- Moon, D.S. Integrated Seismic Assessment and Design of Plan-Irregular Structures; University of Illinois at Urbana-Champaign: Champaign, IL, USA, 2013. [Google Scholar]
- Broderick, B.M.; McCrum, D.P. An Experimental and Numerical Investigation of the Seismic Response of Plan Irregular Multi-Storey Concentrically-Braced Buildings. In Proceedings of the Fifteenth World Conference on Earthquake Engineering, Lisbon, Portugal, 24–28 September 2012. [Google Scholar]
- Lin, J.-L.; Tsai, K.-C.; Chuang, M.-C. Understanding the Trends in Torsional Effects in Asymmetric-Plan Buildings. Bull. Earthq. Eng. 2012, 10, 955–965. [Google Scholar] [CrossRef]
- Gokdemir, H.; Ozbasaran, H.; Dogan, M.; Unluoglu, E.; Albayrak, U. Effects of Torsional Irregularity to Structures during Earthquakes. Eng. Fail. Anal. 2013, 35, 713–717. [Google Scholar] [CrossRef]
- Rajalakshmi, K.R.; Harinarayanan, S.; Varughese, J.A.; Girija, K. Study of Torsion Effects on Building Structures Having Mass and Stiffness Irregularities. Int. J. Eng. Res. Technol. 2015, 4, 1318–1325. [Google Scholar] [CrossRef]
- Viti, S.; Tanganelli, M.; De Stefano, M. The Concrete Strength Variability as Source of Irregularity for RC Existing Buildings. In Seismic Behaviour and Design of Irregular and Complex Civil Structures II; Zembaty, Z., De Stefano, M., Eds.; Springer International Publishing: Cham, Switzerland, 2016; pp. 149–158. ISBN 978-3-319-14246-3. [Google Scholar]
- Valente, M.; Milani, G. Alternative Retrofitting Strategies to Prevent the Failure of an Under-Designed Reinforced Concrete Frame. Eng. Fail. Anal. 2018, 89, 271–285. [Google Scholar] [CrossRef]
- Moehle, J.P. Seismic Response of Vertically Irregular Structures. J. Struct. Eng. 1984, 110, 2002–2014. [Google Scholar] [CrossRef]
- Bertero, R.D. Inelastic Torsion for Preliminary Seismic Design. J. Struct. Eng. 1995, 121, 1183–1189. [Google Scholar] [CrossRef]
- Hong, H.P. Torsional Responses under Bidirectional Seismic Excitations: Effect of Instantaneous Load Eccentricities. J. Struct. Eng. 2013, 139, 133–143. [Google Scholar] [CrossRef]
- Valente, M. Seismic Upgrading Strategies for Non-Ductile Plan-Wise Irregular R/C Structures. Procedia Eng. 2013, 54, 539–553. [Google Scholar] [CrossRef]
- Bensalah, M.D.; Bensaibi, M.; Modaressi, A. Uncertainties in Seismic Response of a Torsional Irregular Structure. Eur. J. Environ. Civ. Eng. 2019, 23, 488–503. [Google Scholar] [CrossRef]
- Lee, L.-H.; Chang, K.-K.; Chun, Y.-S. Experimental Formula for the Fundamental Period of RC Buildings with Shear-Wall Dominant Systems. Struct. Des. Tall Build. 2000, 9, 295–307. [Google Scholar] [CrossRef]
- Gulay, F.G.; Calim, G. A Comparative Study of Torsionally Unbalanced Multi-Storey Structures under Seismic Loading. Turkish J. Eng. Environ. Sci. 2003, 27, 11. [Google Scholar]
- Demir, A.; Demir, D.D.; Erdem, R.T.; Bagci, M. Torsional Irregularity Effects of Local Site Classes in Multiple Storey Structures. Int. J. Res. Rev. Appl. Sci. 2010, 258–262. [Google Scholar]
- Tena-Colunga, A.; Pérez-Osornio, M.Á. Assessment of Shear Deformations on the Seismic Response of Asymmetric Shear Wall Buildings. J. Struct. Eng. 2005, 131, 1774–1779. [Google Scholar] [CrossRef]
- Lee, H.-S.; Ko, D.-W. Seismic Response Characteristics of High-Rise RC Wall Buildings Having Different Irregularities in Lower Stories. Eng. Struct. 2007, 29, 3149–3167. [Google Scholar] [CrossRef]
- Magliulo, G.; Ramasco, R. Seismic Performance of R/C Frames with Regular and Irregular Strength Vertical Distributions. In Proceedings of the 14th World Conference on Earthquake Engineering, Beijing, China, 12–17 October 2008. [Google Scholar]
- Sigmund, V.; Guljas, I.; Hadzima-Nyarko, M. Base Shear Redistribution between the R/C Dual System Structural Components. In Proceedings of the 14th World Conference on Earthquake Engineering, Beijing, China, 12–17 October 2008. [Google Scholar]
- Heerema, P.; Shedid, M.; El-Dakhakhni, W. Seismic Response Analysis of a Reinforced Concrete Block Shear Wall Asymmetric Building. J. Struct. Eng. 2015, 141, 04014178. [Google Scholar] [CrossRef]
- Özmen, G.; Girgin, K.; Durgun, Y. Torsional Irregularity in Multi-Story Structures. Int. J. Adv. Struct. Eng. 2014, 6, 121–131. [Google Scholar] [CrossRef]
- Arabzadeh, H.; Galal, K. Seismic-Response Analysis of RC C-Shaped Core Walls Subjected to Combined Flexure, Shear, and Torsion. J. Struct. Eng. 2018, 144, 04018165. [Google Scholar] [CrossRef]
- Tagle, S.J.; Jünemann, R.; Vásquez, J.; de la Llera, J.C.; Baiguera, M. Performance of a Reinforced Concrete Wall Building Subjected to Sequential Earthquake and Tsunami Loading. Eng. Struct. 2021, 238, 111995. [Google Scholar] [CrossRef]
- Belliazzi, S.; Lignola, G.P.; Palermo, D. Simplified Structural Analysis Framework for Buildings under Combined Earthquake and Tsunami Loads. Structures 2025, 77, 109206. [Google Scholar] [CrossRef]
- Belliazzi, S.; Lignola, G.P.; Fabbrocino, F.; Cosenza, E. Non-Linear Behavior of Reinforced Concrete Cross-Sections with Dimensionless Equations in Closed Form. In Proceedings of the Protection of Historical Constructions; Mazzolani, F.M., Landolfo, B., Eds.; Springer Nature: Cham, Switzerland, 2025; pp. 137–144. [Google Scholar]
- Deger, Z.T.; Basdogan, C. Empirical Equations for Shear Strength of Conventional Reinforced Concrete Shear Walls. ACI Struct. J. 2021, 118, 61–71. [Google Scholar] [CrossRef]
- Mata, R.; Nuñez, E.; Forcellini, D. Seismic Resilience of Composite Moment Frames Buildings with Slender Built-up Columns. J. Build. Eng. 2025, 111, 113532. [Google Scholar] [CrossRef]
- Forcellini, D. Quantification of the Seismic Resilience of Bridge Classes. J. Infrastruct. Syst. 2024, 30, 04024016. [Google Scholar] [CrossRef]
- Xu, G.; Guo, T.; Li, A.; Zhang, H.; Wang, K.; Xu, J.; Dang, L. Seismic Resilience Enhancement for Building Structures: A Comprehensive Review and Outlook. Structures 2024, 59, 105738. [Google Scholar] [CrossRef]
- IS: 875 (Part-1):2015; Code of Practice for Design Loads for Buildings and Structures. Bureau of Indian Standards (BIS): New Delhi, India, 2015.
- IS: 875 (Part-2):2015; Code of Practice for Design Loads for Buildings and Structures. Bureau of Indian Standards (BIS): New Delhi, India, 2015.
Disclaimer/Publisher’s Note: The statements, opinions and data contained in all publications are solely those of the individual author(s) and contributor(s) and not of MDPI and/or the editor(s). MDPI and/or the editor(s) disclaim responsibility for any injury to people or property resulting from any ideas, methods, instructions or products referred to in the content. |
© 2025 by the authors. Licensee MDPI, Basel, Switzerland. This article is an open access article distributed under the terms and conditions of the Creative Commons Attribution (CC BY) license (https://creativecommons.org/licenses/by/4.0/).