1. Introduction
Buildings typically comprise two primary components: the superstructures and the foundation [
1]. In recent years, China’s expanding infrastructure and evolving building usage patterns have led to increased structural height and complexity, placing greater demands on space utilisation and the bearing capacity of pile foundations [
2,
3,
4]. Consequently, variable-section pile foundations, which are renowned for their superior bearing performance, have been increasingly adopted in engineering projects. Simultaneously, their mechanical behaviour has attracted growing interest from the research community.
CEP pile is a new type of concrete expansion pile, characterised by high efficiency, energy conservation, safety, and environmental friendliness. It is formed using an innovative integrated machine that combines drilling, enlarging, and cleaning functions. Unlike DX and extruded support piles [
5,
6], the CEP pile is based on a straight hole pile, with a concrete expansion plate installed on the pile body to enhance its bearing capacity and side friction resistance [
7,
8]. The actual construction process of the CEP pile and a simulation diagram illustrating the forces acting on the pile body are shown in
Figure 1.
Figure 1a presents key stages during the construction of a CEP pile. As illustrated, a specialized integrated drilling–expanding–cleaning system is employed. The process begins with drilling a straight borehole, followed by the formation of one or more conical cavities at predetermined depths via a unique mechanical arm mechanism, and concludes with hole cleaning. Subsequently, a reinforcement cage is placed into the hole with the formed enlarged cavities, and concrete is poured, resulting in a CEP pile characterized by an integrated shaft-and-enlarged-base configuration and a variable cross-section.
Figure 1b clearly illustrates the load-transfer mechanism of the pile under vertical loading:
Shaft Friction Resistance: The arrows distributed along the pile surface represent the side friction developed between the pile and the surrounding soil—a load-bearing mechanism common to all friction piles.
End Resistance at the Enlarged Base: This is a key feature of CEP piles. The upward-pointing arrows acting vertically on the bottom of the enlarged base represent the end-bearing force mobilized in the underlying soil. Owing to the significantly larger bearing area provided by the enlarged base compared to the pile shaft, it effectively activates the bearing capacity of deeper soil layers.
Load Transfer Path: The schematic indicates that the vertical load applied to the pile head is partially transferred to the surrounding soil through shaft friction, while the remainder is transferred as concentrated end-bearing force via the enlarged base to the underlying bearing stratum. This synergistic mechanism combining “shaft friction” and “end-bearing” enables CEP piles to achieve substantially higher bearing capacity and better settlement control compared with conventional uniform-section straight-shaft piles.
Previous research on CEP piles has extensively investigated their performance under various loading conditions, including compressive resistance [
9,
10], uplift bearing capacity [
11,
12], and the behavior of single piles under overturning moments [
13,
14]. However, these studies have predominantly focused on the response of individual piles. In practical engineering, piles are almost always deployed in groups, where the interaction between adjacent piles through the surrounding soil—known as the group effect—significantly alters the foundation’s overall load-bearing capacity and deformation characteristics. While the group effect has been systematically analyzed for conventional bored piles [
15,
16], research in this critical area remains notably scarce for CEP pile groups. Although the bearing capacities of single CEP piles under compression and uplift have been established, the group efficiency and interactive mechanisms of CEP pile foundations constitute a significant research gap. A comprehensive investigation is therefore essential to translate the established advantages of CEP single piles into rational and effective design practices for group configurations.
This study employed two distinct methodologies to investigate the research problem. First, our research group independently developed a novel semi-cross-sectional pile test method that provides full-process visualisation capabilities [
17,
18]. This approach utilises a half-cross-sectional pile model, enabling continuous observation of the failure process in the soil surrounding the pile. This facilitated a clear documentation and analysis of both the deformation evolution of the peripile soil under vertical loading and the ultimate failure patterns of the double-pile foundation system.
Second, finite element analysis was conducted using ANSYS Workbench 2022R1 software to simulate the failure mechanisms of the pile body and surrounding soil under various loading conditions. The results obtained from both experimental and numerical approaches were systematically compared, leading to robust conclusions. This integrated methodology contributes significantly to the advancement of CEP pile-foundation technology.
2. Laboratory Small-Scale Pile Model United Soil Test
2.1. Preparation of Small-Scale Pile Models
This study employs a 1:40 scale model pile, a ratio selected after comprehensive consideration of laboratory equipment capacity, soil sample preparation feasibility, and prior research experience within our group. This scale is also widely adopted in scaled model tests in both domestic and international research [
19]. The experimental design was primarily based on stress–strain scaling laws, supplemented by dimensional consistency checks, drawing upon previous research conducted by our group [
20]. This combined approach ensures that the 1:40 scale model effectively simulates the mechanical behavior and characterizes the load-bearing capacity of prototype CEP piles within a controllable testing scope, thereby supporting the scientific rigor and reliability of the experimental findings.
The primary objective of this experiment is to investigate the deformation and failure mechanisms of the soil surrounding a pile under vertical loading. This requires that the pile itself remains in an elastic state throughout the loading process, without failure or significant nonlinear deformation. Consequently, the key material property required for the model pile is its elastic modulus, rather than its ultimate compressive strength. Aluminum alloy was selected because its elastic modulus is comparable to that of concrete, allowing it to accurately simulate the pile-soil interaction. Moreover, its high strength ensures that the pile remains entirely elastic under the test loads, satisfying the essential condition of this study. Potential differences in material properties were also considered and addressed. For instance, the influence of the pile’s self-weight on the load data was eliminated through calculation. Since the study focuses on the fundamental mechanism of the pile-soil system, and the semi-interface observation method is specifically designed to directly analyze soil behavior, minor discrepancies in interface parameters do not affect the analysis of the core phenomenon—the soil failure mode.
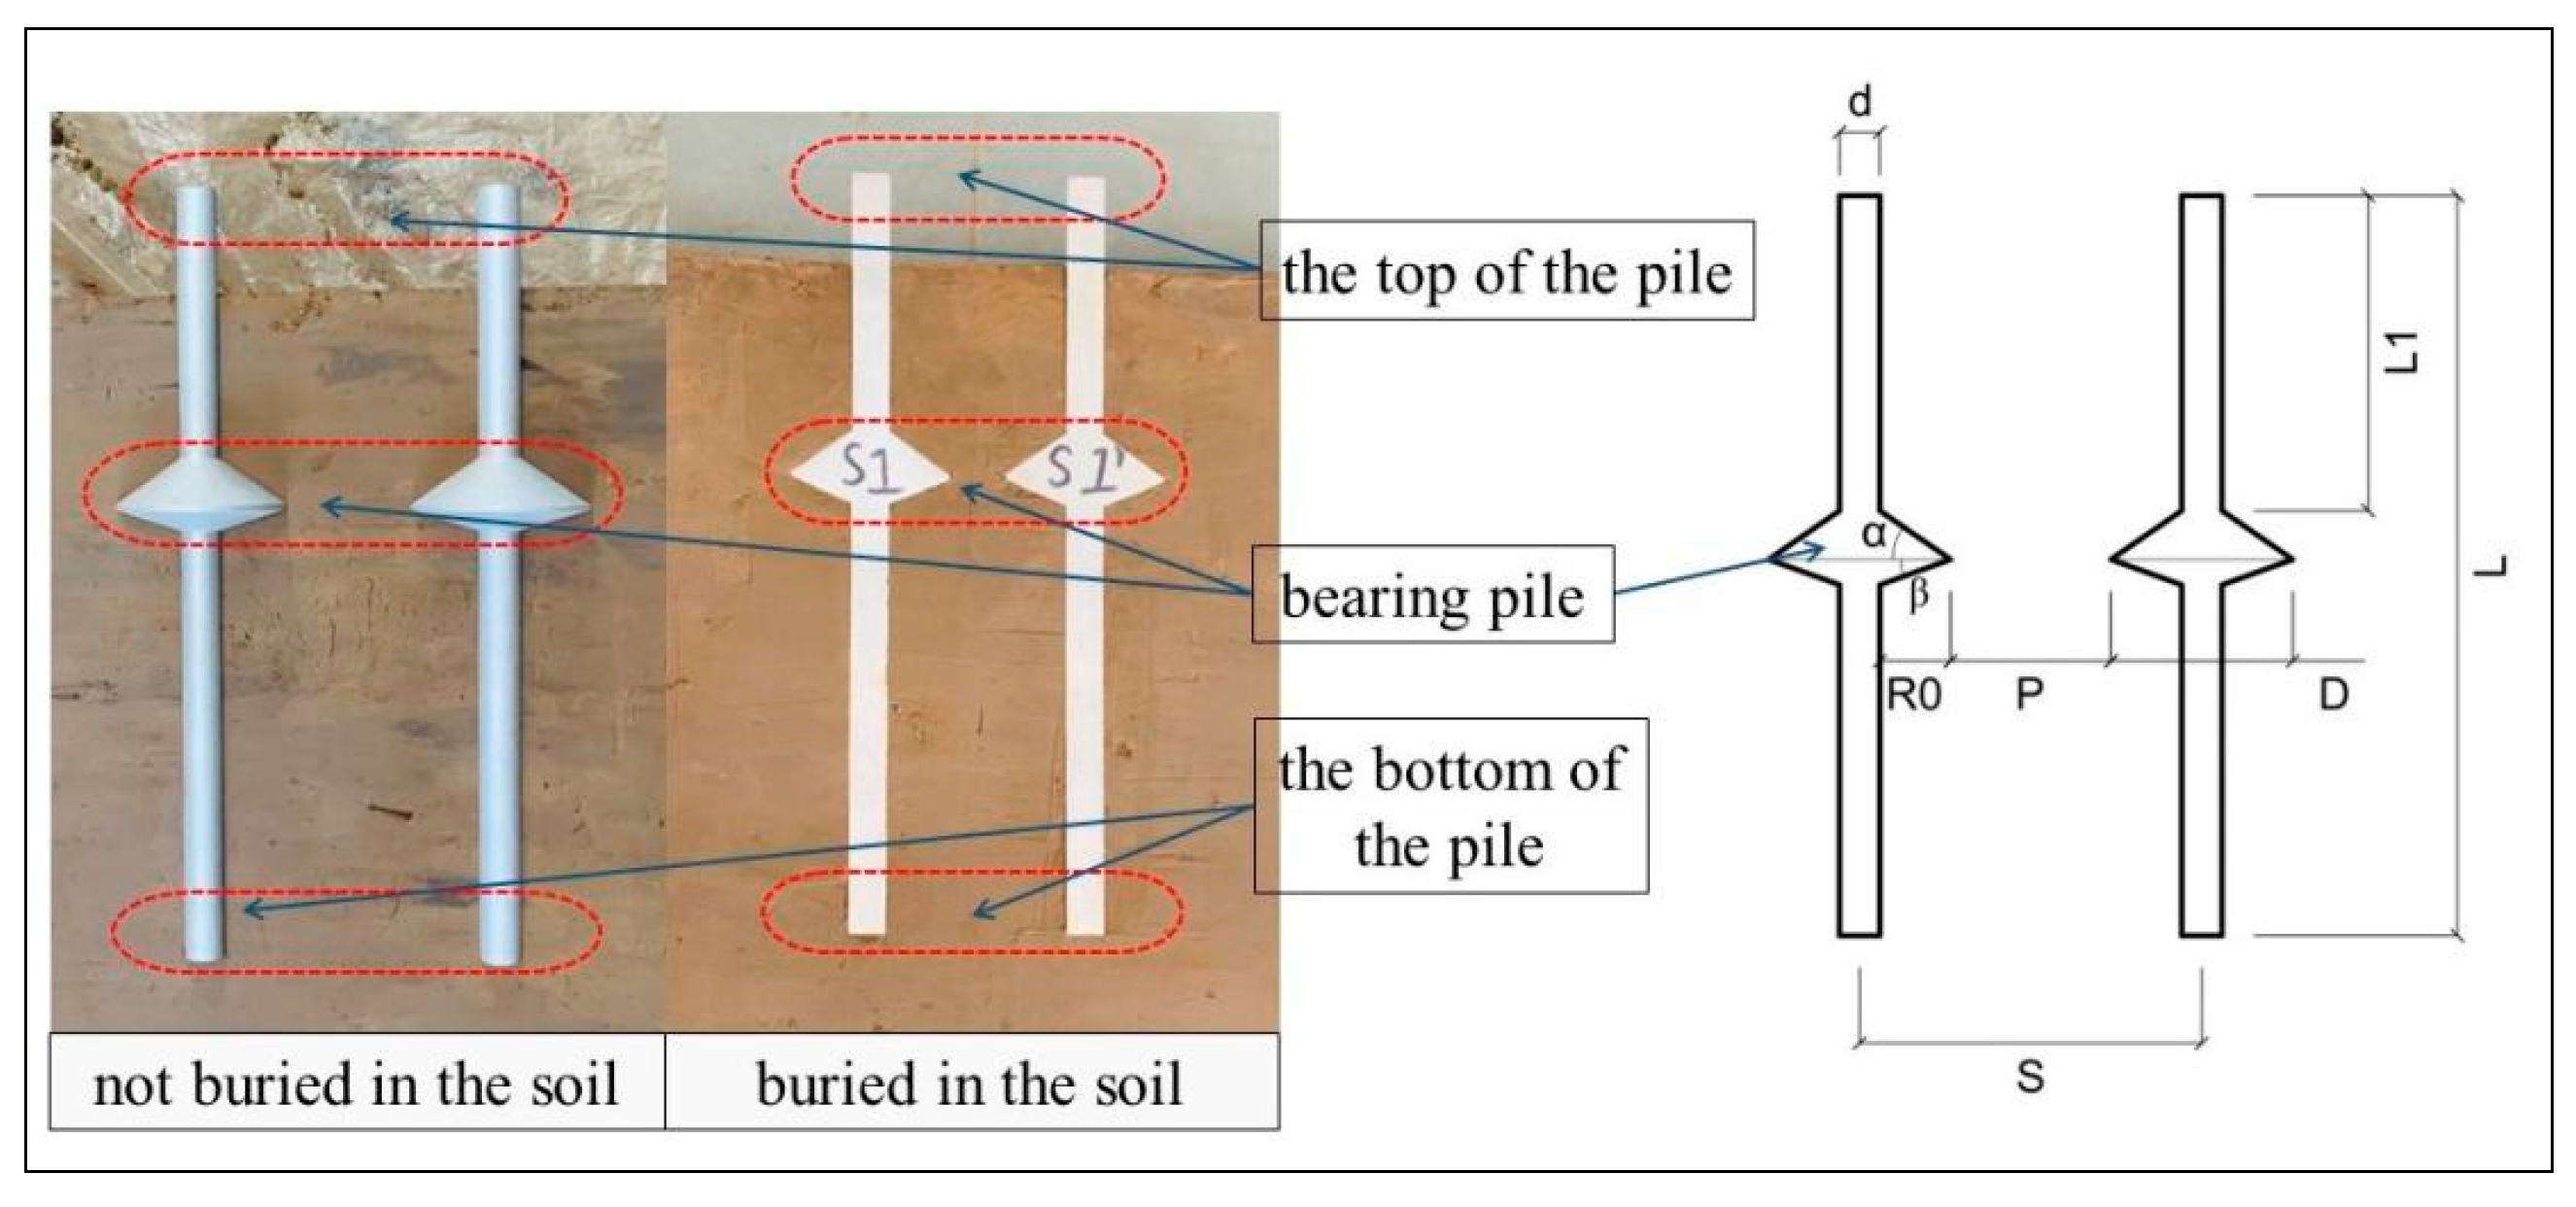
Nine identical semi-cross-sectional piles were manufactured and divided into five test groups: four pairs of piles (designated (S1, S1′), (S2, S2′), (S3, S3′), and (S4, S4′)) with varying centre-to-centre spacings and a single pile serving as the control (designated S5). A schematic and design drawing of the small-scale model pile specimens is shown in
Figure 2.
This study investigated the influence of pile spacing on the behaviour of double CEP piles. Accordingly, pile spacing was treated as the primary variable, whereas other parameters were adopted based on the findings of prior research on CEP monopiles. Pile spacing was controlled by varying the ratio of the distance between the ends of the expansion plates to the cantilever diameter. Four representative pile spacing configurations—P = 1.0 R
0, 1.5 R
0, 2.0 R
0, and 2.5 R
0, where R
0 denotes the cantilever diameter—were selected for finite element analysis. The quantities and dimensions of the CEP piles are listed in
Table 1. A monopile model (Group ⑤) was also established as a control case to quantify the group effect, elucidate the pile-soil interaction mechanisms, and provide a benchmark for comparing the failure modes and load-transfer behavior observed in the double-pile configurations.
2.2. Design and Fabrication of Soil Sampler
To minimise disturbances to the test soil during sampling and handling, a removable soil extraction apparatus was designed. To enable real-time observation of pile deformation and surrounding soil behaviour, particularly in light of the limited research on pile foundations both domestically and internationally, one side of the steel housing was replaced with tempered glass. The soil sampler was constructed as a cuboid (360 mm × 280 mm × 210 mm) with open ends, allowing external pressure devices to be inserted into the soil in situ. To prevent deformation under the applied pressure, which could disrupt the internal soil structure, the sampler was fabricated from materials with sufficient strength. Its sidewalls were composed of 5 mm thick steel plates. The conceptual model and physical prototype of the sampler are illustrated in
Figure 3.
To eliminate boundary effects from the surrounding soil on the test results, the soil domain was designed to be significantly larger than the stress influence zone of the pile under loading. Under these conditions, the size effect is considered negligible.
2.3. Loading, Transportation, and Storage of Unaltered Soil
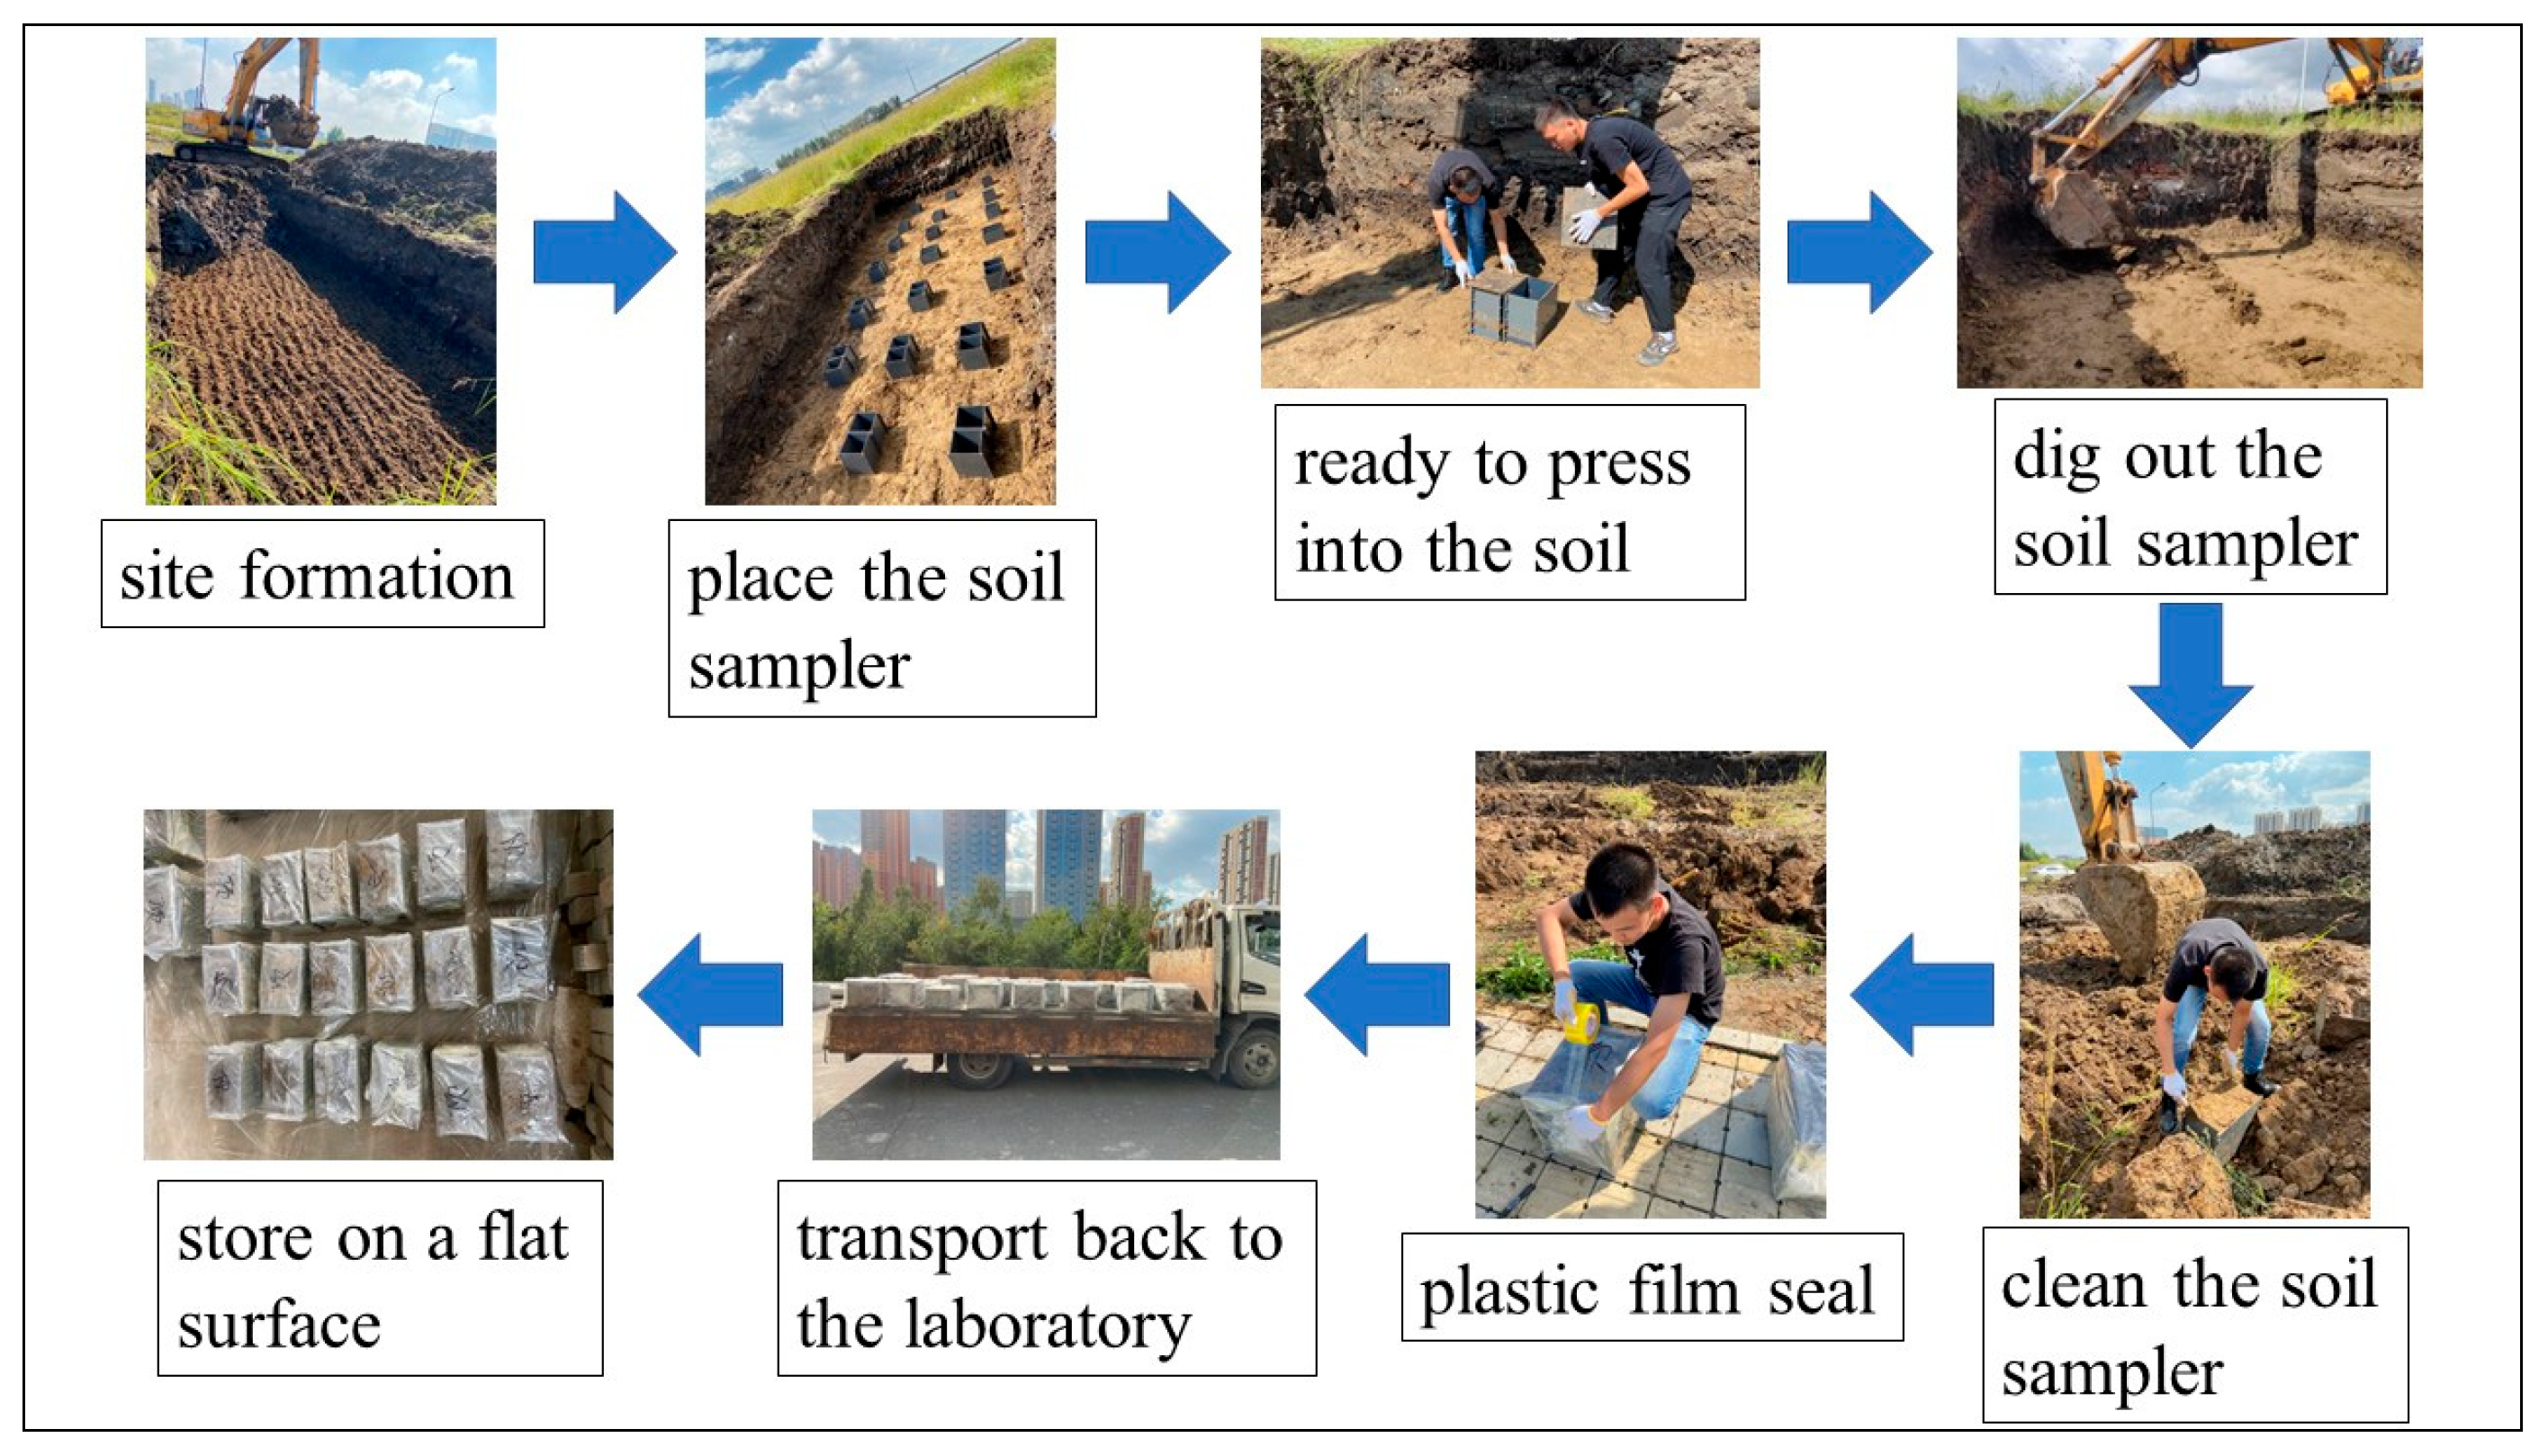
To ensure that the properties of the test soil closely resembled those of soils used in real-world projects, the loading test material was sourced from in situ soil excavated at the construction site. The upper miscellaneous fill layer, which has been subjected to prolonged anthropogenic disturbances, including construction activities, domestic waste deposition, and other factors, contains numerous impurities, rendering it unsuitable for testing. Consequently, a silty clay layer beneath the fill was selected as the test material. The undisturbed soil sampling process involved site levelling, placement of soil extractors, extraction, sealing, and transportation. This procedure is illustrated in
Figure 4.
2.4. Load Procedure Analysis
Following the completion of the pre-trial preparations, the procedure was carried out as follows: the soil extractor was positioned, the loading equipment and accessories were systematically arranged, and the load was subsequently applied, as illustrated in
Figure 5.
A hierarchical loading procedure was adopted, applying controlled load increments [
21,
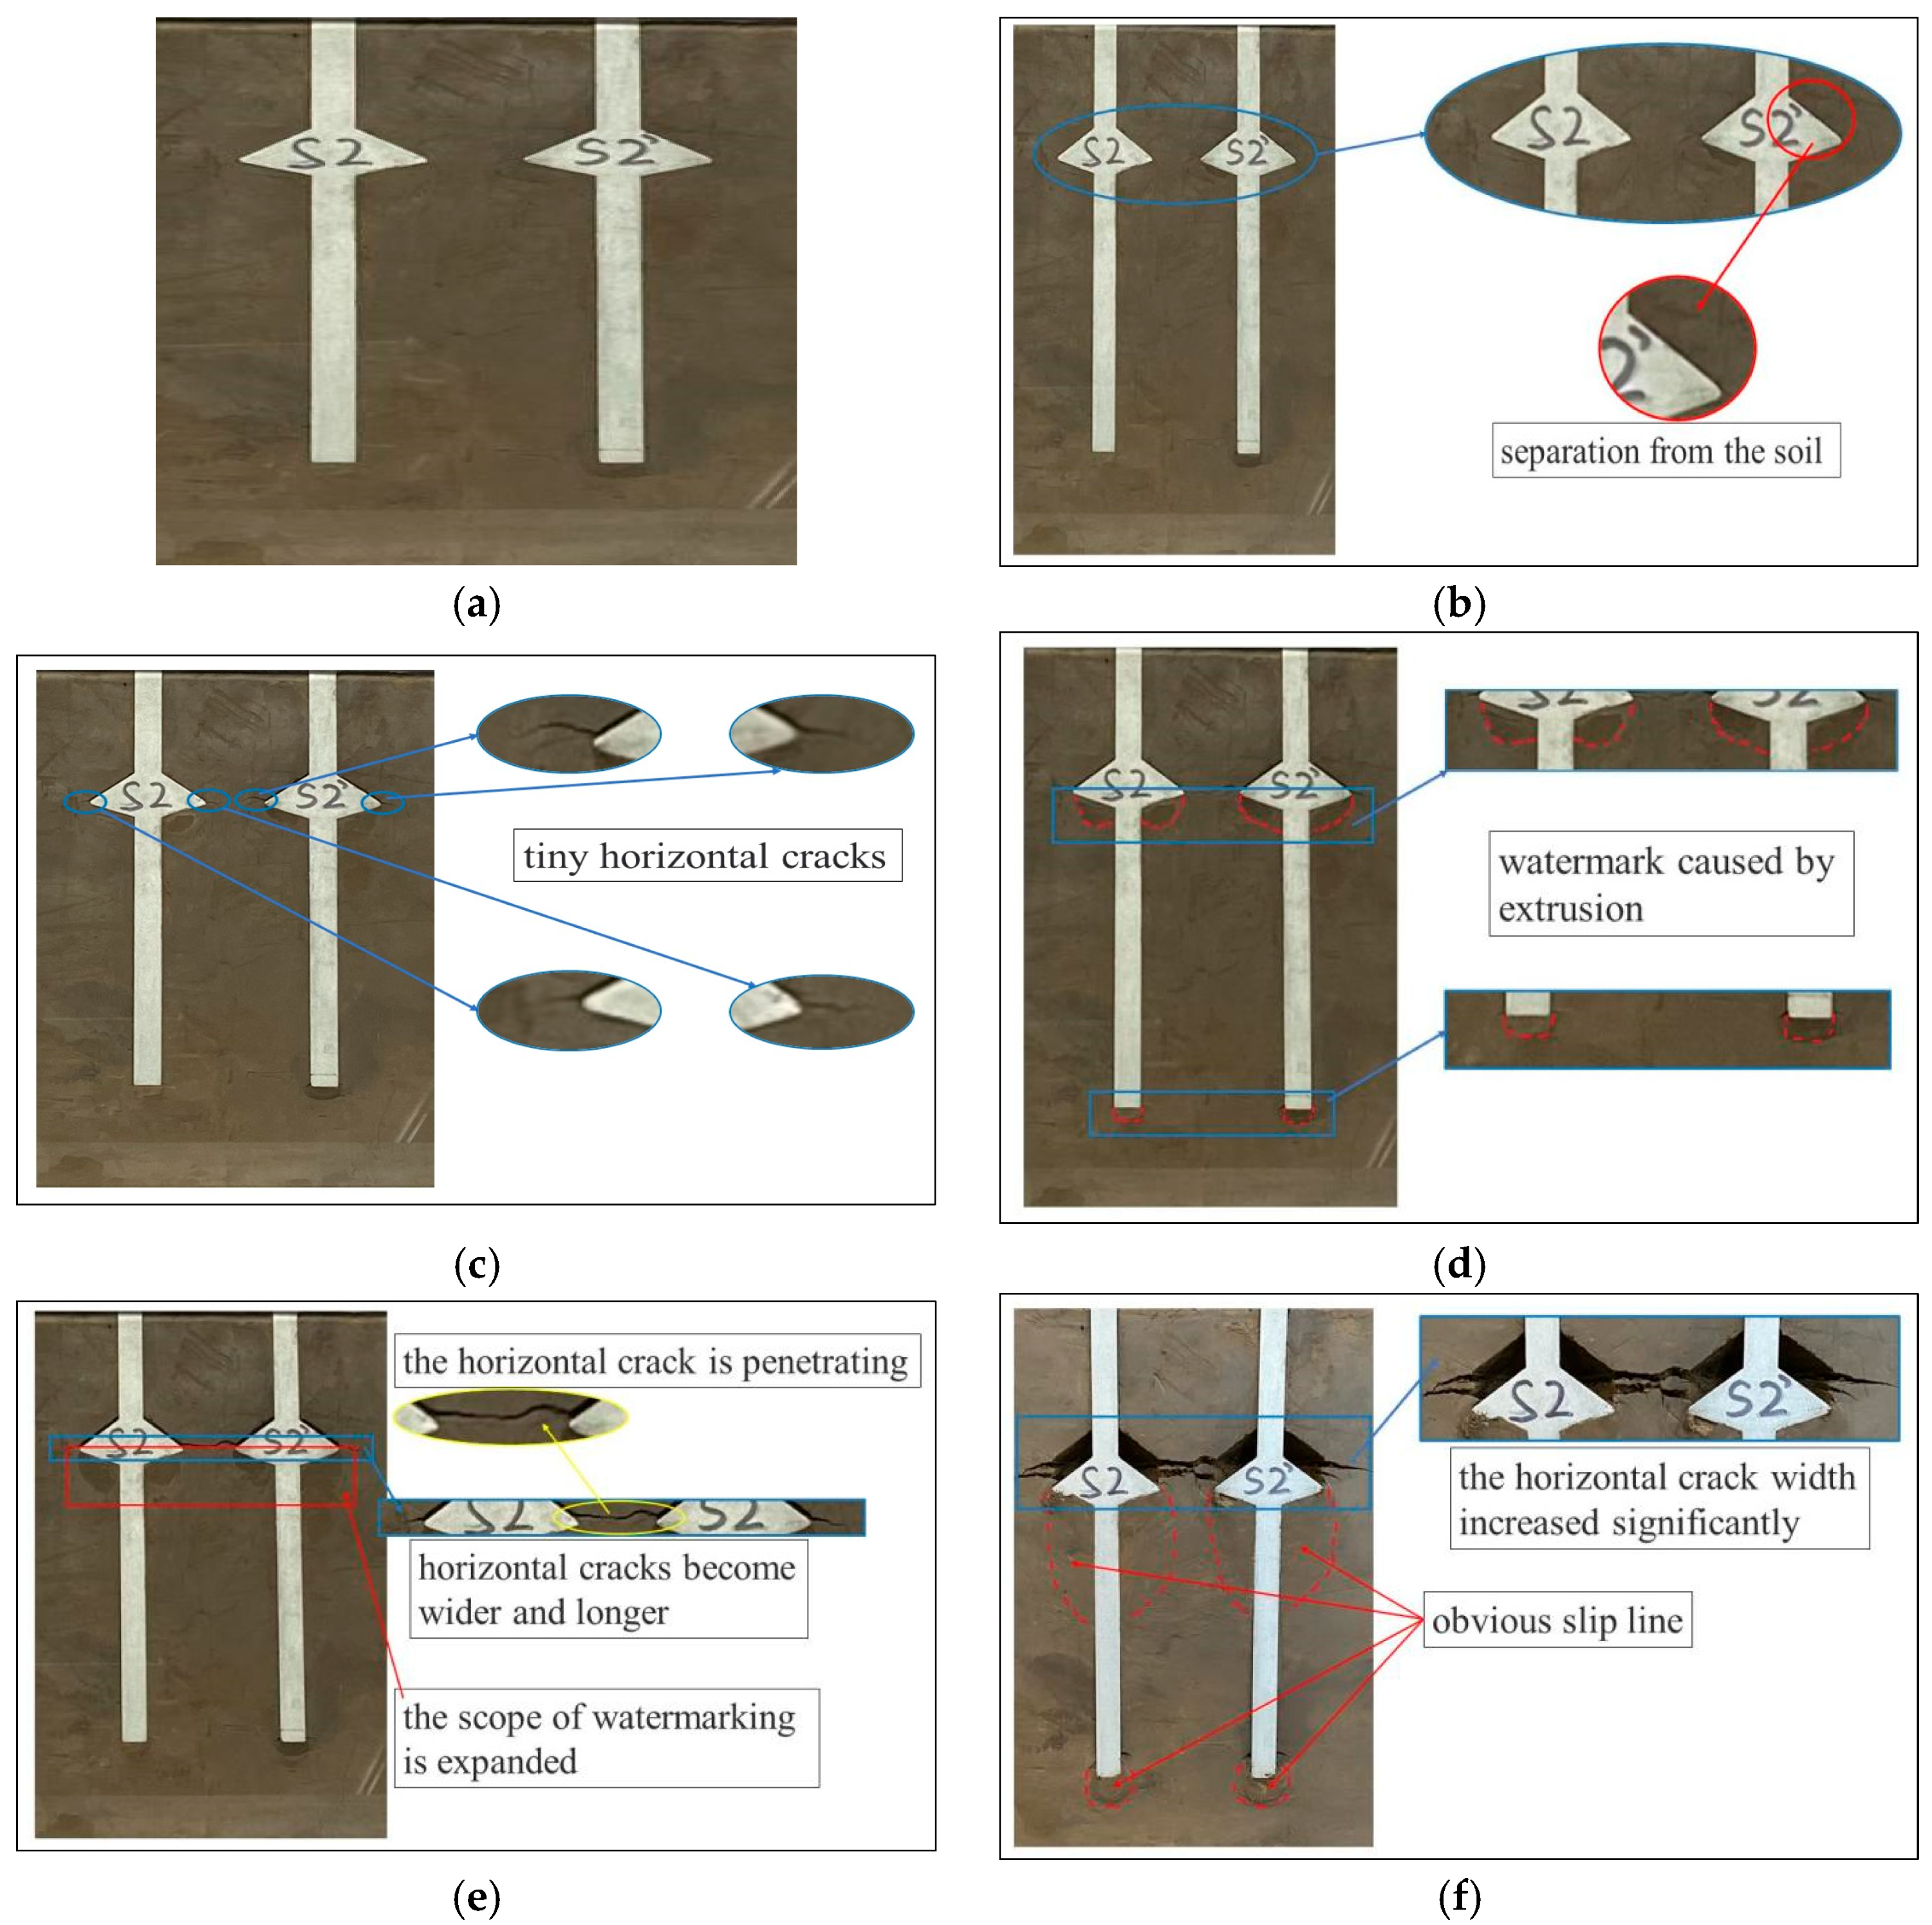
22]. Specifically, increments of 0.05 kN were used until the total load reached 0.8 kN, beyond which 0.1 kN increments were applied. The loading was continued until a termination criterion was met, which was defined as a pile-head displacement of 15 mm. This failure criterion was established based on prior findings from our group’s monopile tests and relevant technical codes. Throughout the process, the response of the surrounding soil was captured at each load level using a digital camera, with Group ② serving as a representative case for illustrating the progressive failure state in
Figure 6.
Figure 6a,b indicate that at the onset of loading, the bearing plate did not contribute to the load transfer because of the lateral friction between the model pile and the surrounding soil, as well as the inherent cohesion of the soil. As the vertical pressure gradually exceeded the side friction resistance, the plate began to resist the vertical tensile forces. When the applied load reached 0.3 kN, the plate was detached from the surrounding soil mass. As shown in
Figure 6c, horizontal microcracks appear on both sides of the plate edge at 0.35 kN, whereas no significant deformation is observed between the two piles.
As the load increased to 0.4 kN (
Figure 6d), the soil beneath the plate exhibited noticeable downward movement, and watermarks formed beneath the plate and at the pile toe due to soil extrusion. As the pressure continued to increase, the watermark region expanded, and the length and width of the horizontal cracks increased. At 0.55 kN (
Figure 6e), the horizontal crack propagated fully through the soil. With continued loading, the width of the horizontal crack between the two piles increased markedly, accompanied by significant displacement of the pile bodies. As shown in
Figure 6f, the soil mass eventually reaches a limit state, resulting in shear failure. At this point, visible slip lines formed at the base of the plate, pile circumference, and toes of both piles.
2.5. Load–Displacement Data Analysis
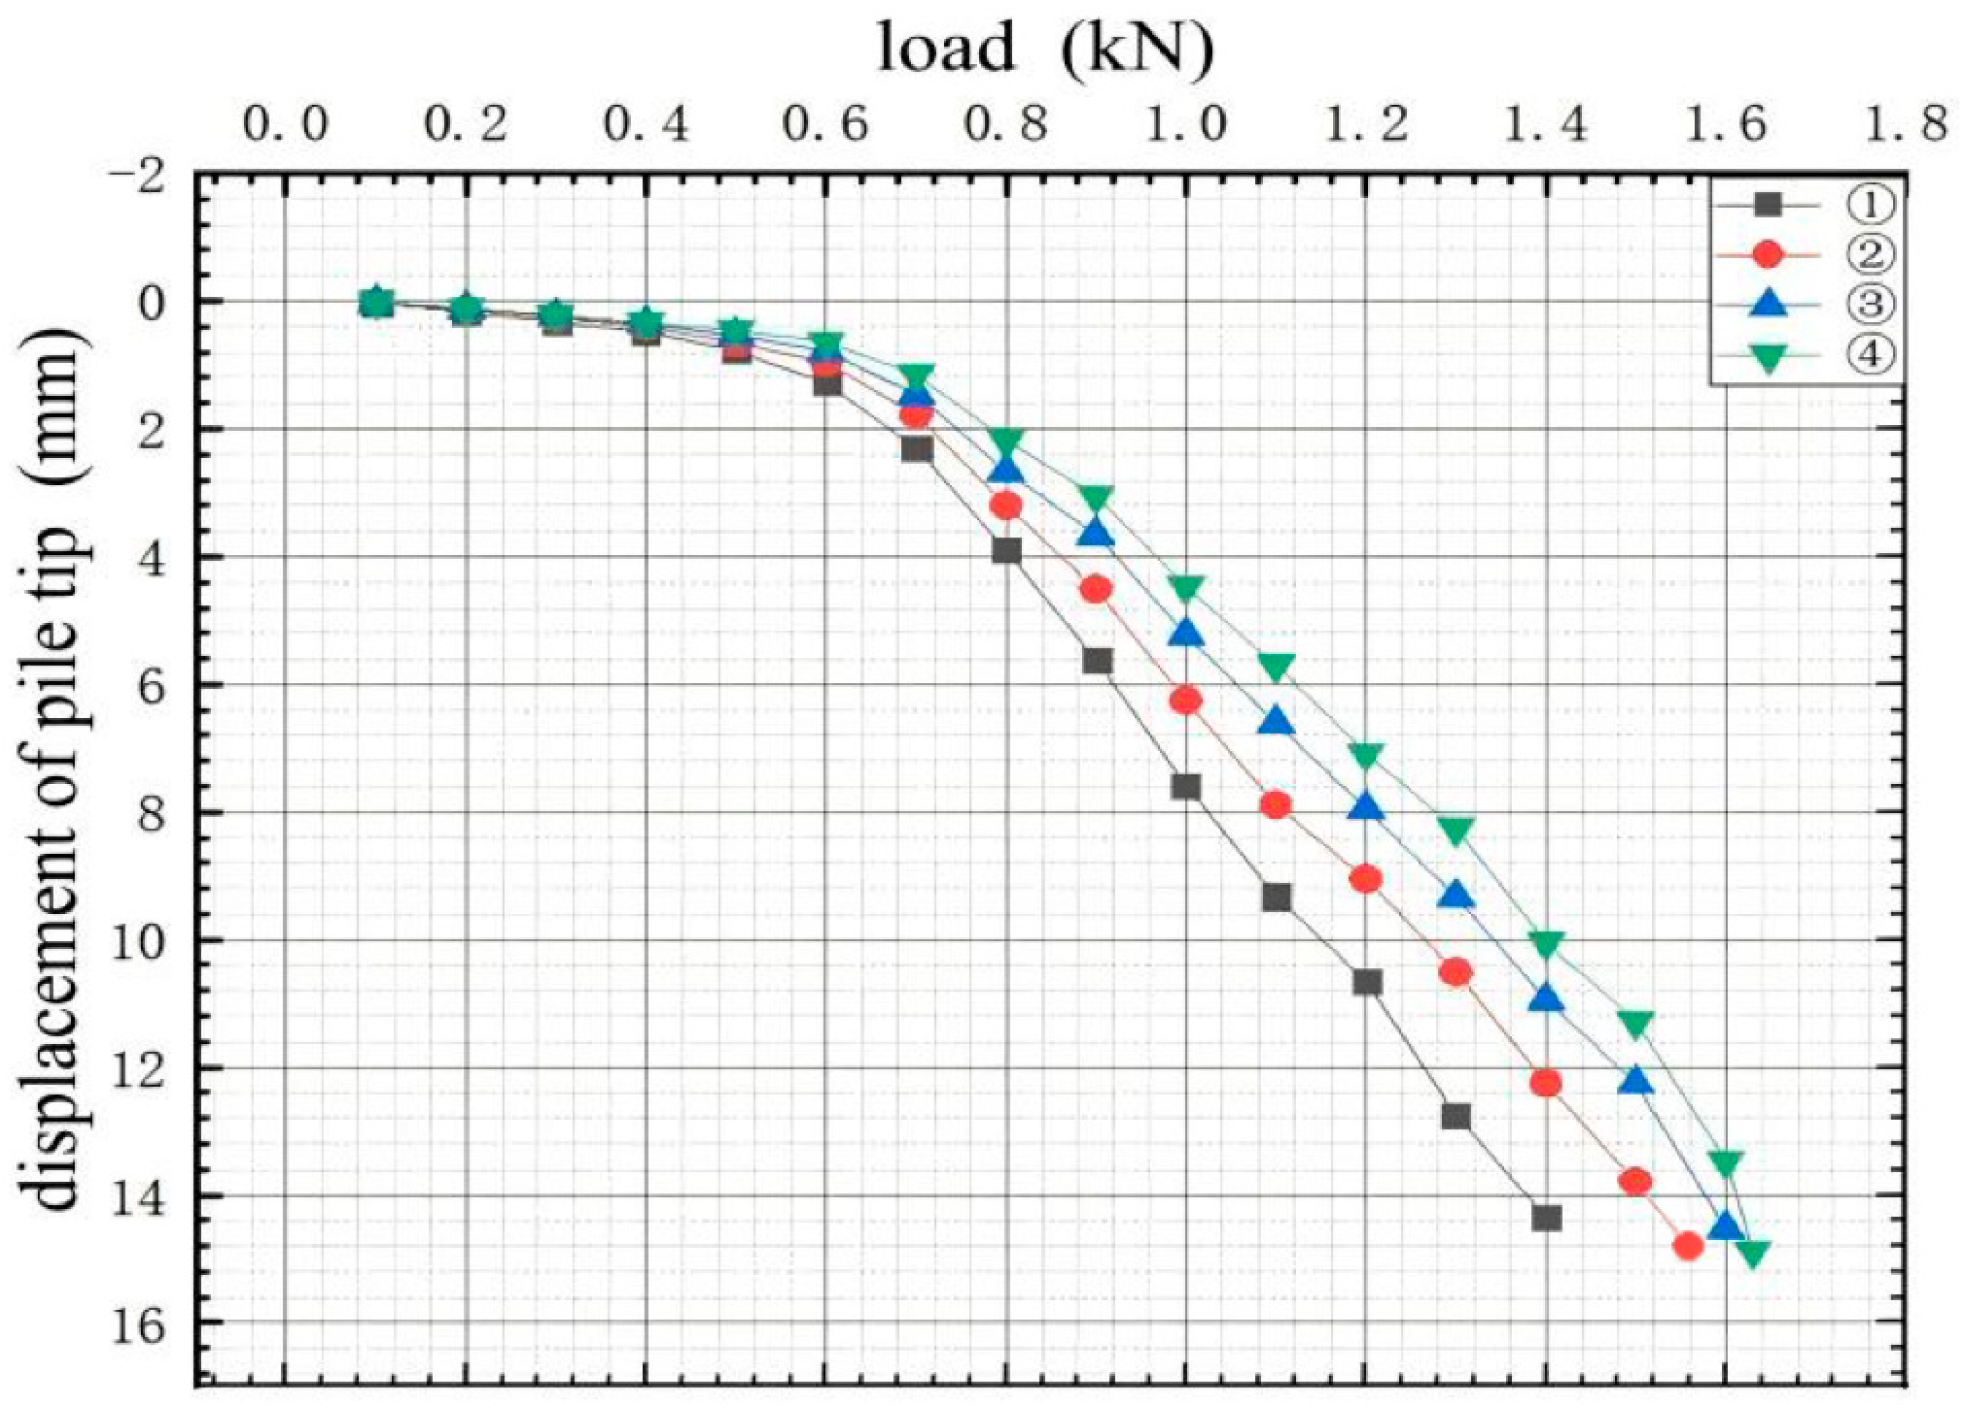
The load–displacement data obtained from the compressive tests were organised and analysed. To facilitate an intuitive interpretation of the test behaviour, the load–displacement curves for double piles with varying pile spacings were plotted, as shown in
Figure 7. The initial load at zero displacement is defined as the combined weight of the jack, pile cap, and gasket.
Figure 7 illustrates that increasing pile spacing positively influences the ultimate bearing capacity of double-pile foundation systems. The ultimate load values for Groups ①, ②, ③, and ④ were 1.4 kN, 1.5 kN, 1.6 kN, and 1.63 kN, respectively. Analysis of the load–displacement curves reveals a distinct pattern: The pronounced spacing between curves ① to ③ indicates a relatively high rate of bearing capacity improvement over this range of pile spacings. Conversely, the significantly reduced spacing between curves ③ and ④ signifies a diminishing rate of improvement in bearing capacity as the pile spacing increased from that of Group ③ to Group ④. This attenuation in efficiency suggests that the pile spacing corresponding to Group ④ approaches the optimal range, implying that further increases in spacing are unlikely to yield substantial gains in bearing capacity and are therefore not recommended.
All test groups exhibited similar load–displacement trends. During the initial loading stage (vertical pressure < 0.2 kN), the differences in displacement between the groups were minimal. This is attributed to the limited influence of the pile spacing on the bearing behaviour of the double-pile foundations at this stage, where the foundation capacity was primarily provided by the shaft friction resistance, with the contribution of the bearing plate being relatively small. As the vertical pressure increased, the pile head displacement progressively increased at an accelerating rate. Within the pressure range of 0.2 kN to 0.8 kN, the rate of displacement increase became increasingly divergent between groups, following the sequence: ① > ② > ③ > ④.
The rate of change in the load of the two-pile model in Groups ②, ③, and ④, compared with the model in Group ① at the same displacement, was calculated separately as
where
RC—The rate of change in the load under the same displacement compared with Group ①.
Fi—Loads of group i two-pile models, where i = 2, 3, 4.
F1—Loads of the two-pile model in Group ①.
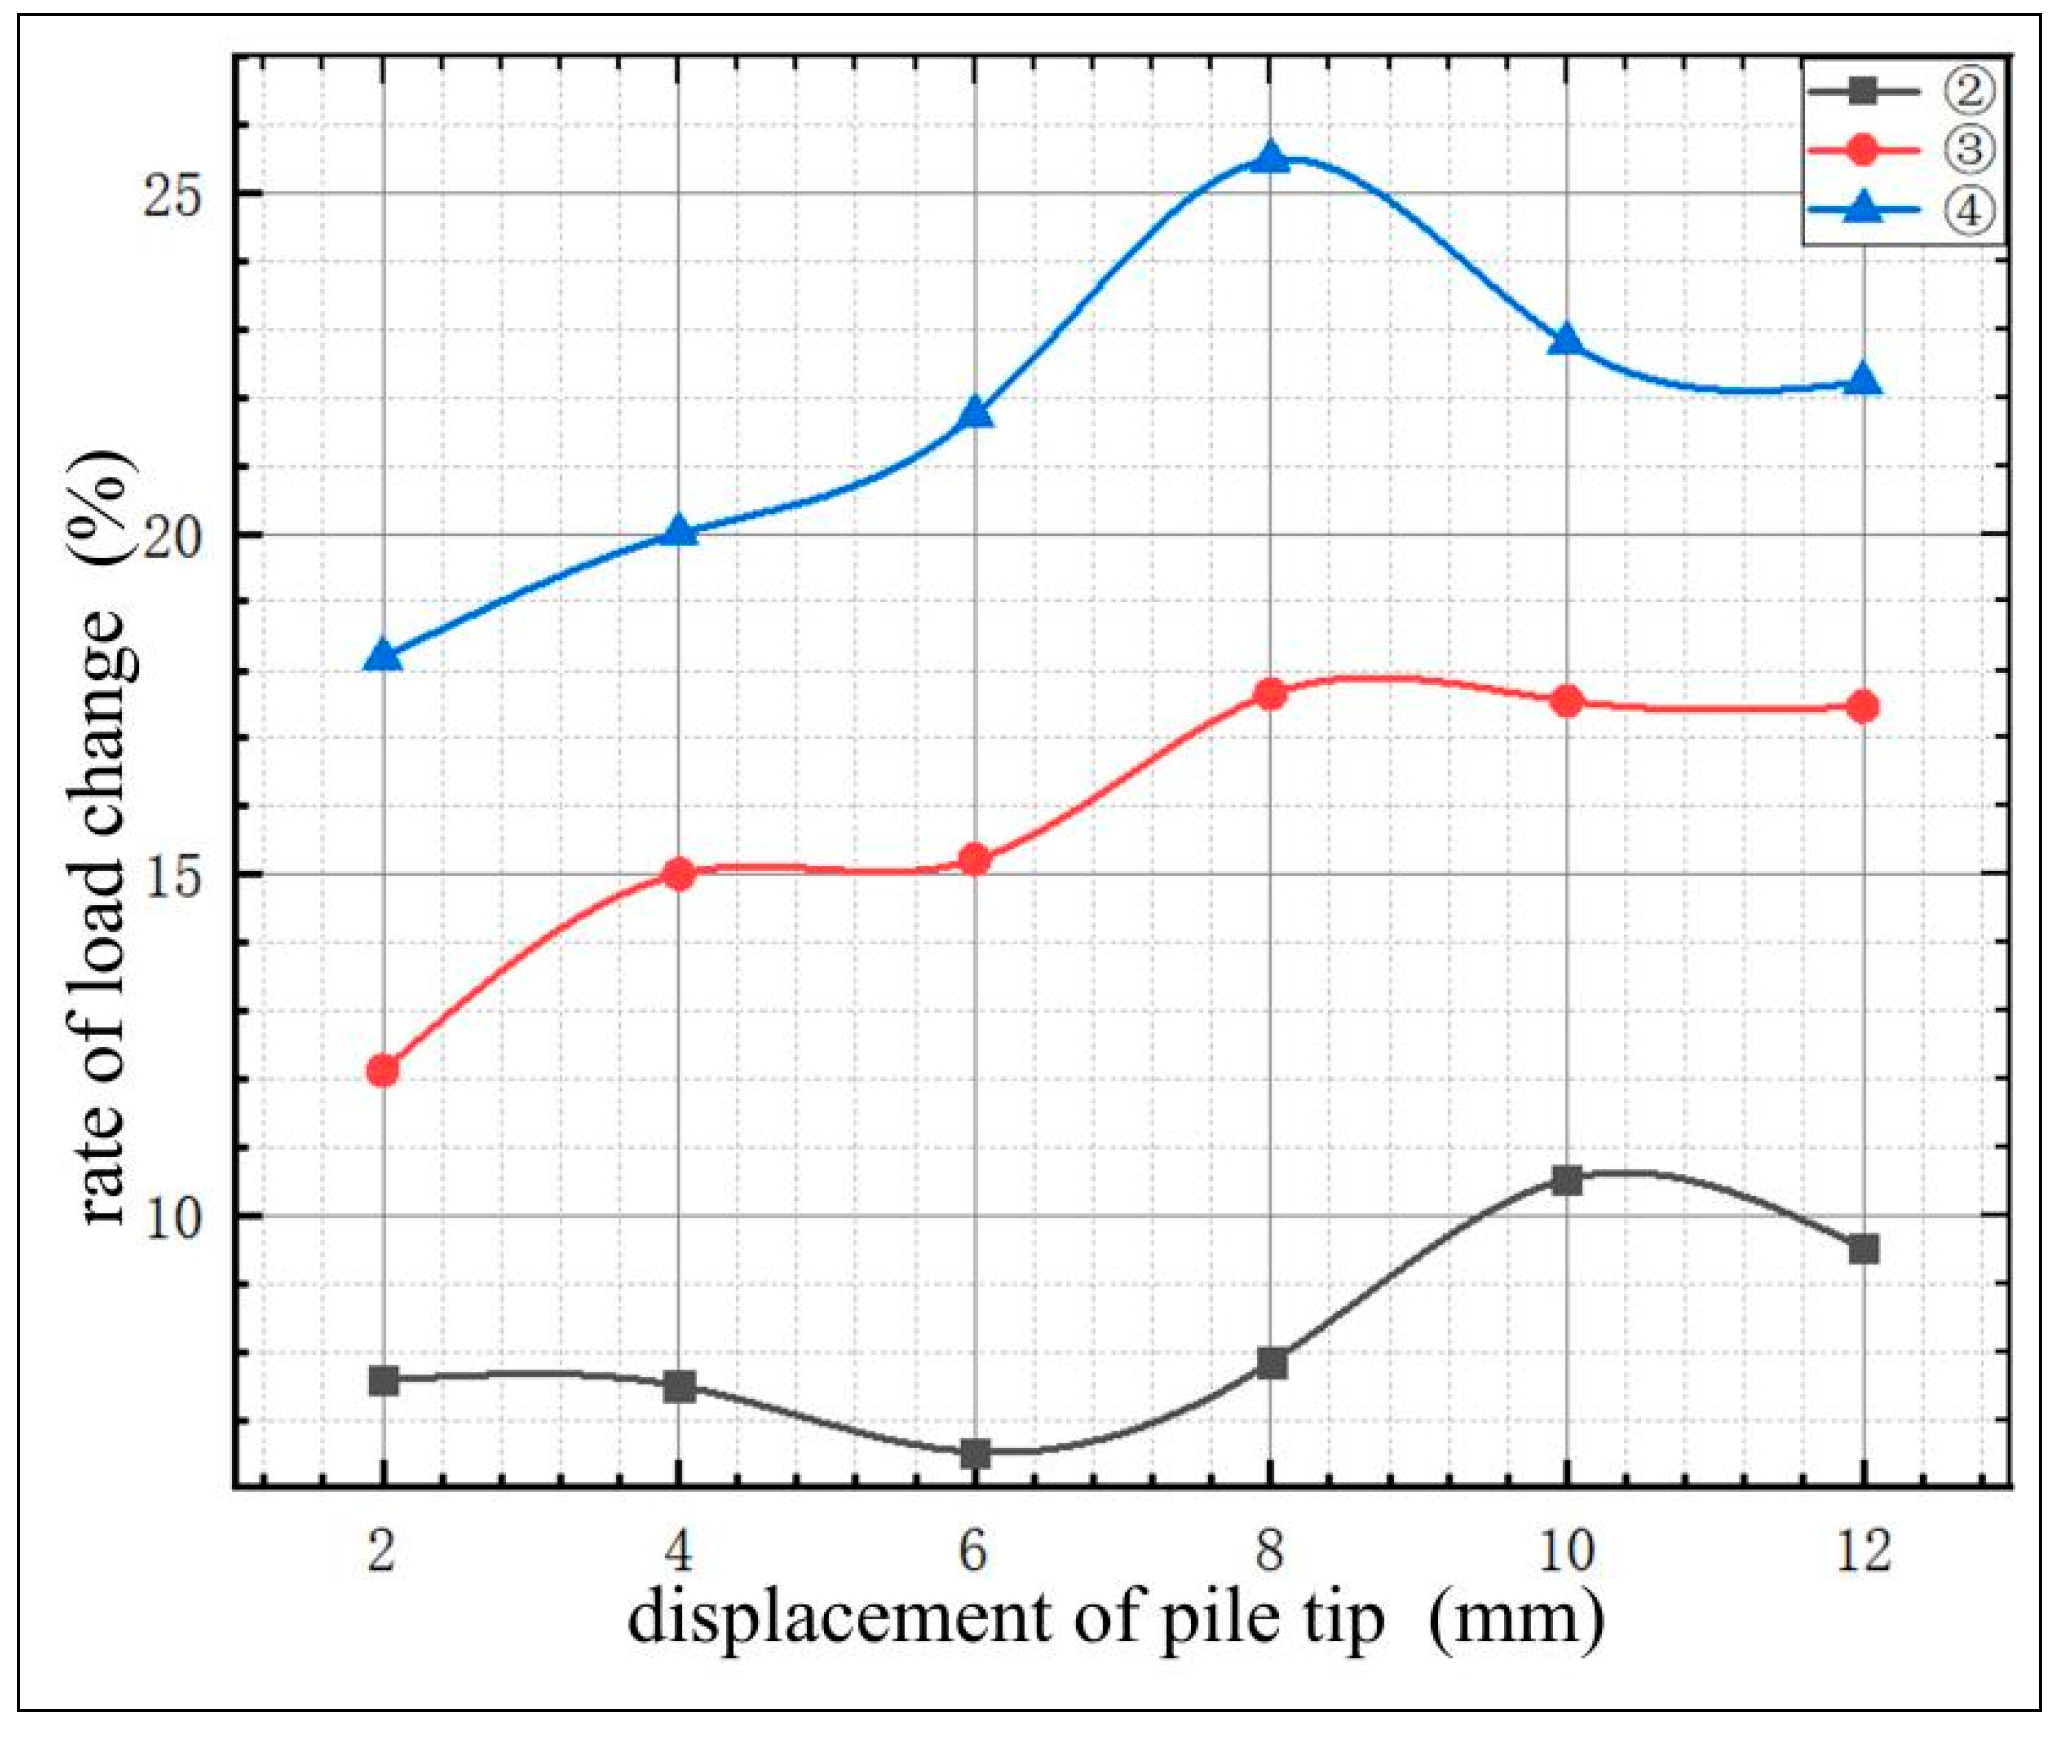
To elucidate the influence of pile spacing on the bearing capacity of CEP piles more clearly, the percentage increase in the vertical load for the double-pile models in Groups ②, ③, and ④ compared with Group I was analysed at identical displacement levels. The resulting load–variation curve is shown in
Figure 8.
Figure 8 shows that a larger pile spacing under the same displacement corresponds to a greater vertical pressure of the double pile relative to Group ①. When the displacement was 4 mm, the vertical pressures of Groups ②, ③, and ④ increased by 7.5%, 15%, and 20% compared with Group ①. When the displacement was 8 mm, the vertical pressures of Groups ②, ③, and ④ increased by 7.8%, 17.6%, and 25.5% compared with Group ①. When the displacement was 12 mm, the vertical pressure of Groups ②, ③, and ④ increased by 9.5%, 17.5%, and 22.2% compared with Group ①. In summary, a larger pile spacing corresponded to a smaller interaction between the piles and a higher capacity. Furthermore, as evidenced by the curves in the figure, the curve for Group ④ exhibits a distinct peak followed by a subsequent decline. This indicates that while the bearing capacity of the CEP double-pile foundation increases with a larger pile spacing, the improvement efficiency reaches an optimum and then diminishes beyond a certain point. Consequently, these results suggest that pile spacing is not unconditionally beneficial when maximised; rather, an optimal range exists for maximising the efficiency. To optimise the trade-off between bearing capacity and economic efficiency, a pile spacing corresponding to Groups ③ and ④, defined distance between the ends of the bearing plates ranging from 2.0 to 2.5 times the cantilevered diameter, is recommended. The pile spacing adopted in this study provides a cost-effective alternative. From a practical design perspective, the recommended pile spacing range of 2.0 R
0 to 2.5 R
0 offers significant advantages in constructability and economy. Compared to tighter spacings, this range substantially reduces the risk of overlapping soil displacement zones during excavation for adjacent piles, thereby enhancing construction feasibility and ensuring the full mobilization of the bearing capacity. Economically, this optimal spacing minimizes material usage, leading to a direct reduction in concrete volume for the piles and the pile cap. Furthermore, it effectively mitigates the group effect, which in turn improves the overall load-bearing efficiency of the foundation system. Therefore, for the preliminary design of CEP double-pile foundations in similar clay soils, a spacing between 2.0 and 2.5 times the cantilever diameter is recommended. This proposal achieves an effective balance between maximizing bearing capacity, optimizing cost, and ensuring construction practicality.
3. Analysis of Finite Element Simulation Results
3.1. Preliminary Work and Material Property Setup for Finite Element Simulation
3.1.1. Selection of Soil Constitutive Model
The primary focus of this study is to investigate the influence of pile spacing on the stresses within the CEP double-pile foundation and the surrounding soil, rather than the effect of material microstructure-induced anisotropy on pile performance. Given this objective, selecting an isotropic elastic material for the piles minimizes error while simplifying and expediting the computational process. Consequently, the CEP piles are modeled as isotropic elastic materials using the Isotropic Elasticity model.
Building on previous research by our group, which typically positions the bearing plates within clay layers, the soil is discretized using SOLID45 elements. For modeling the mechanical behavior of granular materials like soil, common constitutive models include the Mohr-Coulomb, Cam-Clay, and Drucker-Prager (D-P) models. However, the first two cannot adequately capture material behavior under complex triaxial stress states. In contrast, the D-P model accounts for failure induced by material yielding and is well-suited for describing the stress–strain relationship of soils under ultimate limit states. Therefore, the Drucker-Prager model was selected for the soil in this analysis.
3.1.2. Determination of Material Parameters
In accordance with our group’s established methodology, the material parameters for the piles and soil were determined based on actual engineering data and prior experimental findings. The CEP piles were simulated as C35 concrete. To capture the essential mechanism of side friction, a pile-soil friction coefficient of 0.3 was accordingly selected. A complete list of the material properties implemented in the model is provided in
Table 2.
3.1.3. Mesh Generation
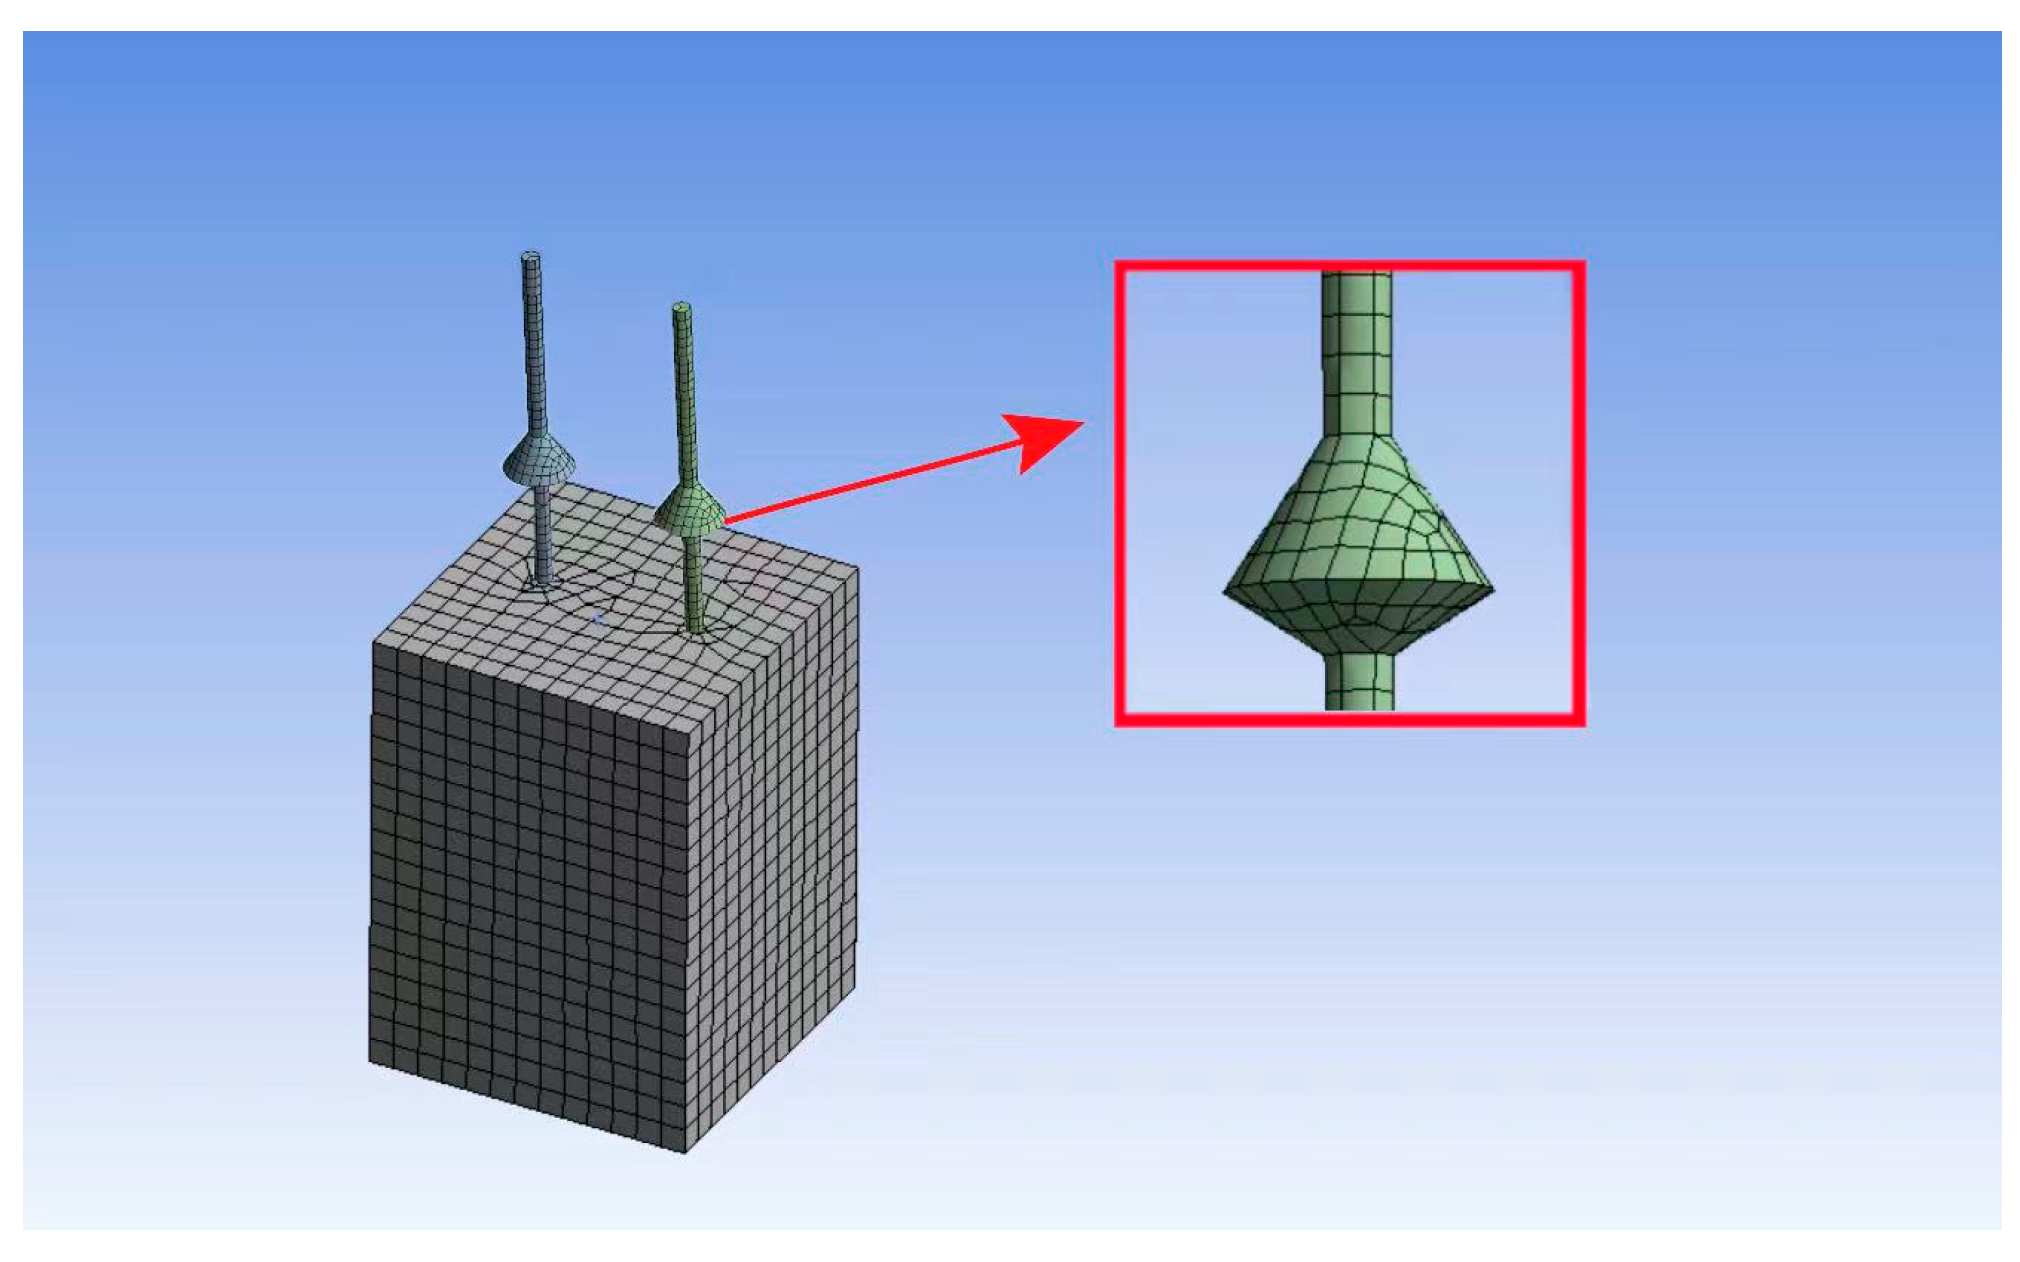
The soil mesh size was identified as a critical factor influencing the simulation’s accuracy. A sensitivity analysis revealed that variations in results became negligible when the element size was smaller than 1200 mm. Therefore, a global soil mesh size of 800 mm was adopted to balance computational accuracy and efficiency. Considering the high stress concentrations, the mesh around the bearing plates was refined to a size of 300 mm. The piles were discretized with a mesh size of 500 mm. Prior to meshing, the model was partitioned along key feature edges to facilitate the generation of hexahedral elements, which are preferred over tetrahedral elements for their superior convergence in nonlinear problems. The final mesh configuration is illustrated in
Figure 9.
3.1.4. Pile–Soil Contact Settings
Due to the distinct material properties of piles and soil, significant shear stress is generated between them when relative displacement occurs. Therefore, to study the pile–soil interaction, the following basic assumptions are established:
- (1)
Throughout the simulation, the pile-side friction coefficient remains constant. The soil in the finite element model is considered an isotropic material, and when the pile reaches the ultimate load, soil failure occurs while the pile remains intact.
- (2)
The soil boundary dimensions are significantly larger than 10 times the pile diameter, allowing the influence of boundary constraints on the simulation results to be neglected.
3.1.5. Loading Method
To ensure consistency with the prior physical tests and the accuracy of the simulation, a surface load was applied to the top of the pile to simulate vertical compression. The loading process in the simulation was incremental, continuing until the pile foundation reached its failure state. The termination criterion, consistent with the physical tests, was a prescribed pile-head displacement of 15 mm, at which point the CEP double-pile foundation was considered to have failed.
3.2. Comparison of Experimental Phenomena with Finite Element Analysis Displacement Clouds
To ensure consistency between the simulation and experimental conditions, a half-section model of double piles matching the experimental setup was established using ANSYS finite element software. For the CEP double-pile models with varying pile spacings, incremental loading was applied until structural failure occurred. Displacement contour plots were extracted from each group, and the finite element simulation results were compared with the experimental data through comparative analysis to validate the accuracy of the model.
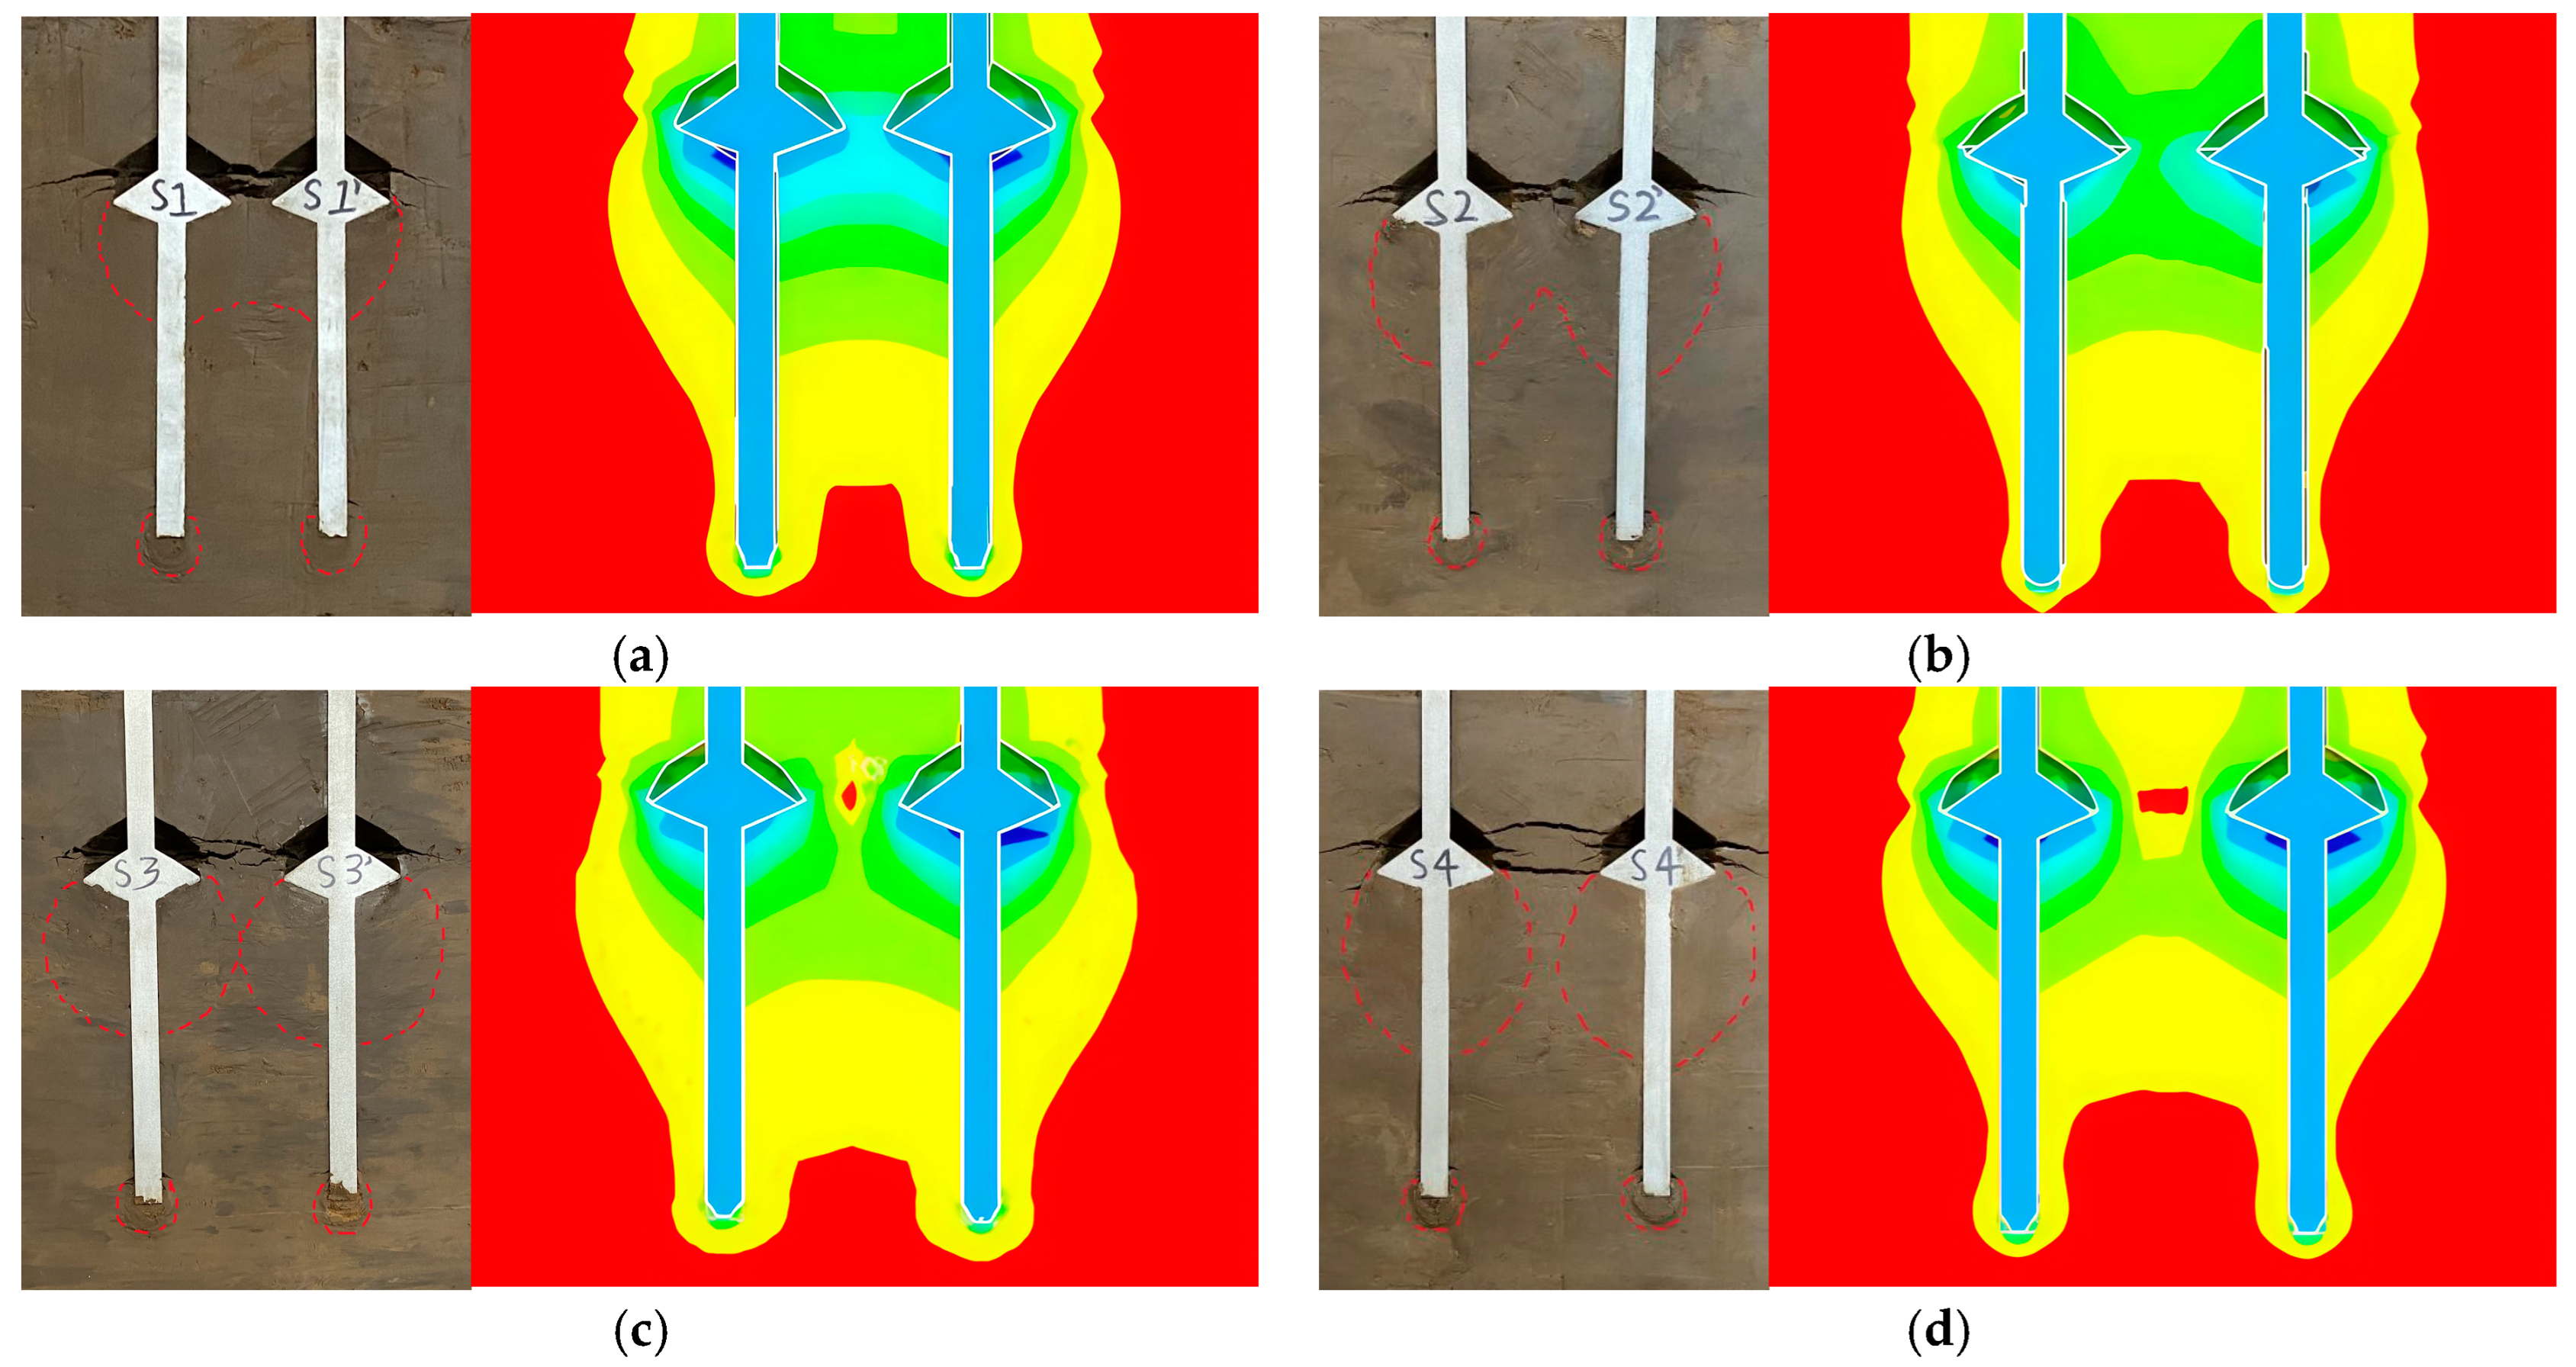
To analyse the influence of pile spacing on soil failure around the double-pile, images of the ultimate bearing state in each group of experiments and images of the ultimate bearing state in the finite element simulation were extracted for comparative analysis, as shown in
Figure 10.
Figure 10 shows that the watermark within the soil slip line around the pile in each group of test phenomena is similar to the corresponding finite element model displacement cloud shape, confirming the reliability of the test. Across all the displacement contour plots, significant compressive deformation of the soil surrounding the bearing plates was evident. This deformation indicates that the bearing plates play a critical role in resisting external loads. However, no watermarks were observed in areas with small displacements in the displacement cloud (yellow and light green), given the relatively small pore water pressure of the soil with a very small displacement in the test, which was not sufficient to allow water to penetrate the pores, thereby preventing the formation of watermarks.
The displacement cloud in
Figure 10a shows that the cloud maps of the area below the bearing plate and adjacent soil body have two different colours, thereby suggesting a displacement difference that corresponds to horizontal cracks at the ends of the two bearing plates in the actual test phenomenon. Meanwhile, the displacement clouds in
Figure 10a,b show an obvious overlap in the area with a large soil displacement (green). This suggests that insufficient pile spacing between the two groups led to soil interaction between the piles, resulting in a significant zone of superimposed displacement in the interpile soil and clearly observable pile group effects.
Figure 10c,d show that the area with a large soil displacement in the simulation analysis was highly consistent with the watermark area of the two piles in the test, and the range of the soil between the two piles was reduced under the joint action of the two load-bearing plates in the cloud map. As the pile spacing increased, the large soil displacement range around the two piles separated. Consequently, the pile group effect diminished, leading to an improvement in the bearing behaviour of the pile foundation.
This comparative analysis confirms a high degree of consistency in pile head displacement, soil failure state around the pile, and pile-soil separation phenomenon under the plate, thereby validating the rationality of the basic assumptions, simulation parameter settings, and experimental results in this study.
To further quantitatively validate the finite element model, the load–displacement curves from the double-pile tests were compared with those obtained from the corresponding simulations, as shown in
Figure 11.
As shown in
Figure 11, the load–displacement curves from the tests and the finite element simulations exhibit a high degree of similarity across all pile groups, which validates the accuracy of the numerical model.
The minor discrepancy observed in the initial loading phase, where the simulated displacement is slightly lower than the experimental measurement, can be attributed to the idealized assumptions in the finite element model. The soil in the simulation was modeled as a homogeneous, fully compacted continuum without initial defects. In reality, the test soil may contain minor initial pores, local looseness, or inherent heterogeneity. Furthermore, differences in pile-soil interface behavior contribute to this deviation. The interface in the model was simulated using an idealized contact algorithm with a constant friction coefficient. However, in the physical tests, factors such as microscopic initial slip or incomplete contact—due to the pile surface roughness and insufficient initial soil-pile interlocking—likely resulted in a slightly lower effective friction coefficient. Consequently, the side friction was mobilized more rapidly and fully in the simulation, leading to a slower development of displacement under initial loads and thus a higher position of the simulated curve.
3.3. Comparative Analysis of the CEP Double Pile and Single Pile Test Results
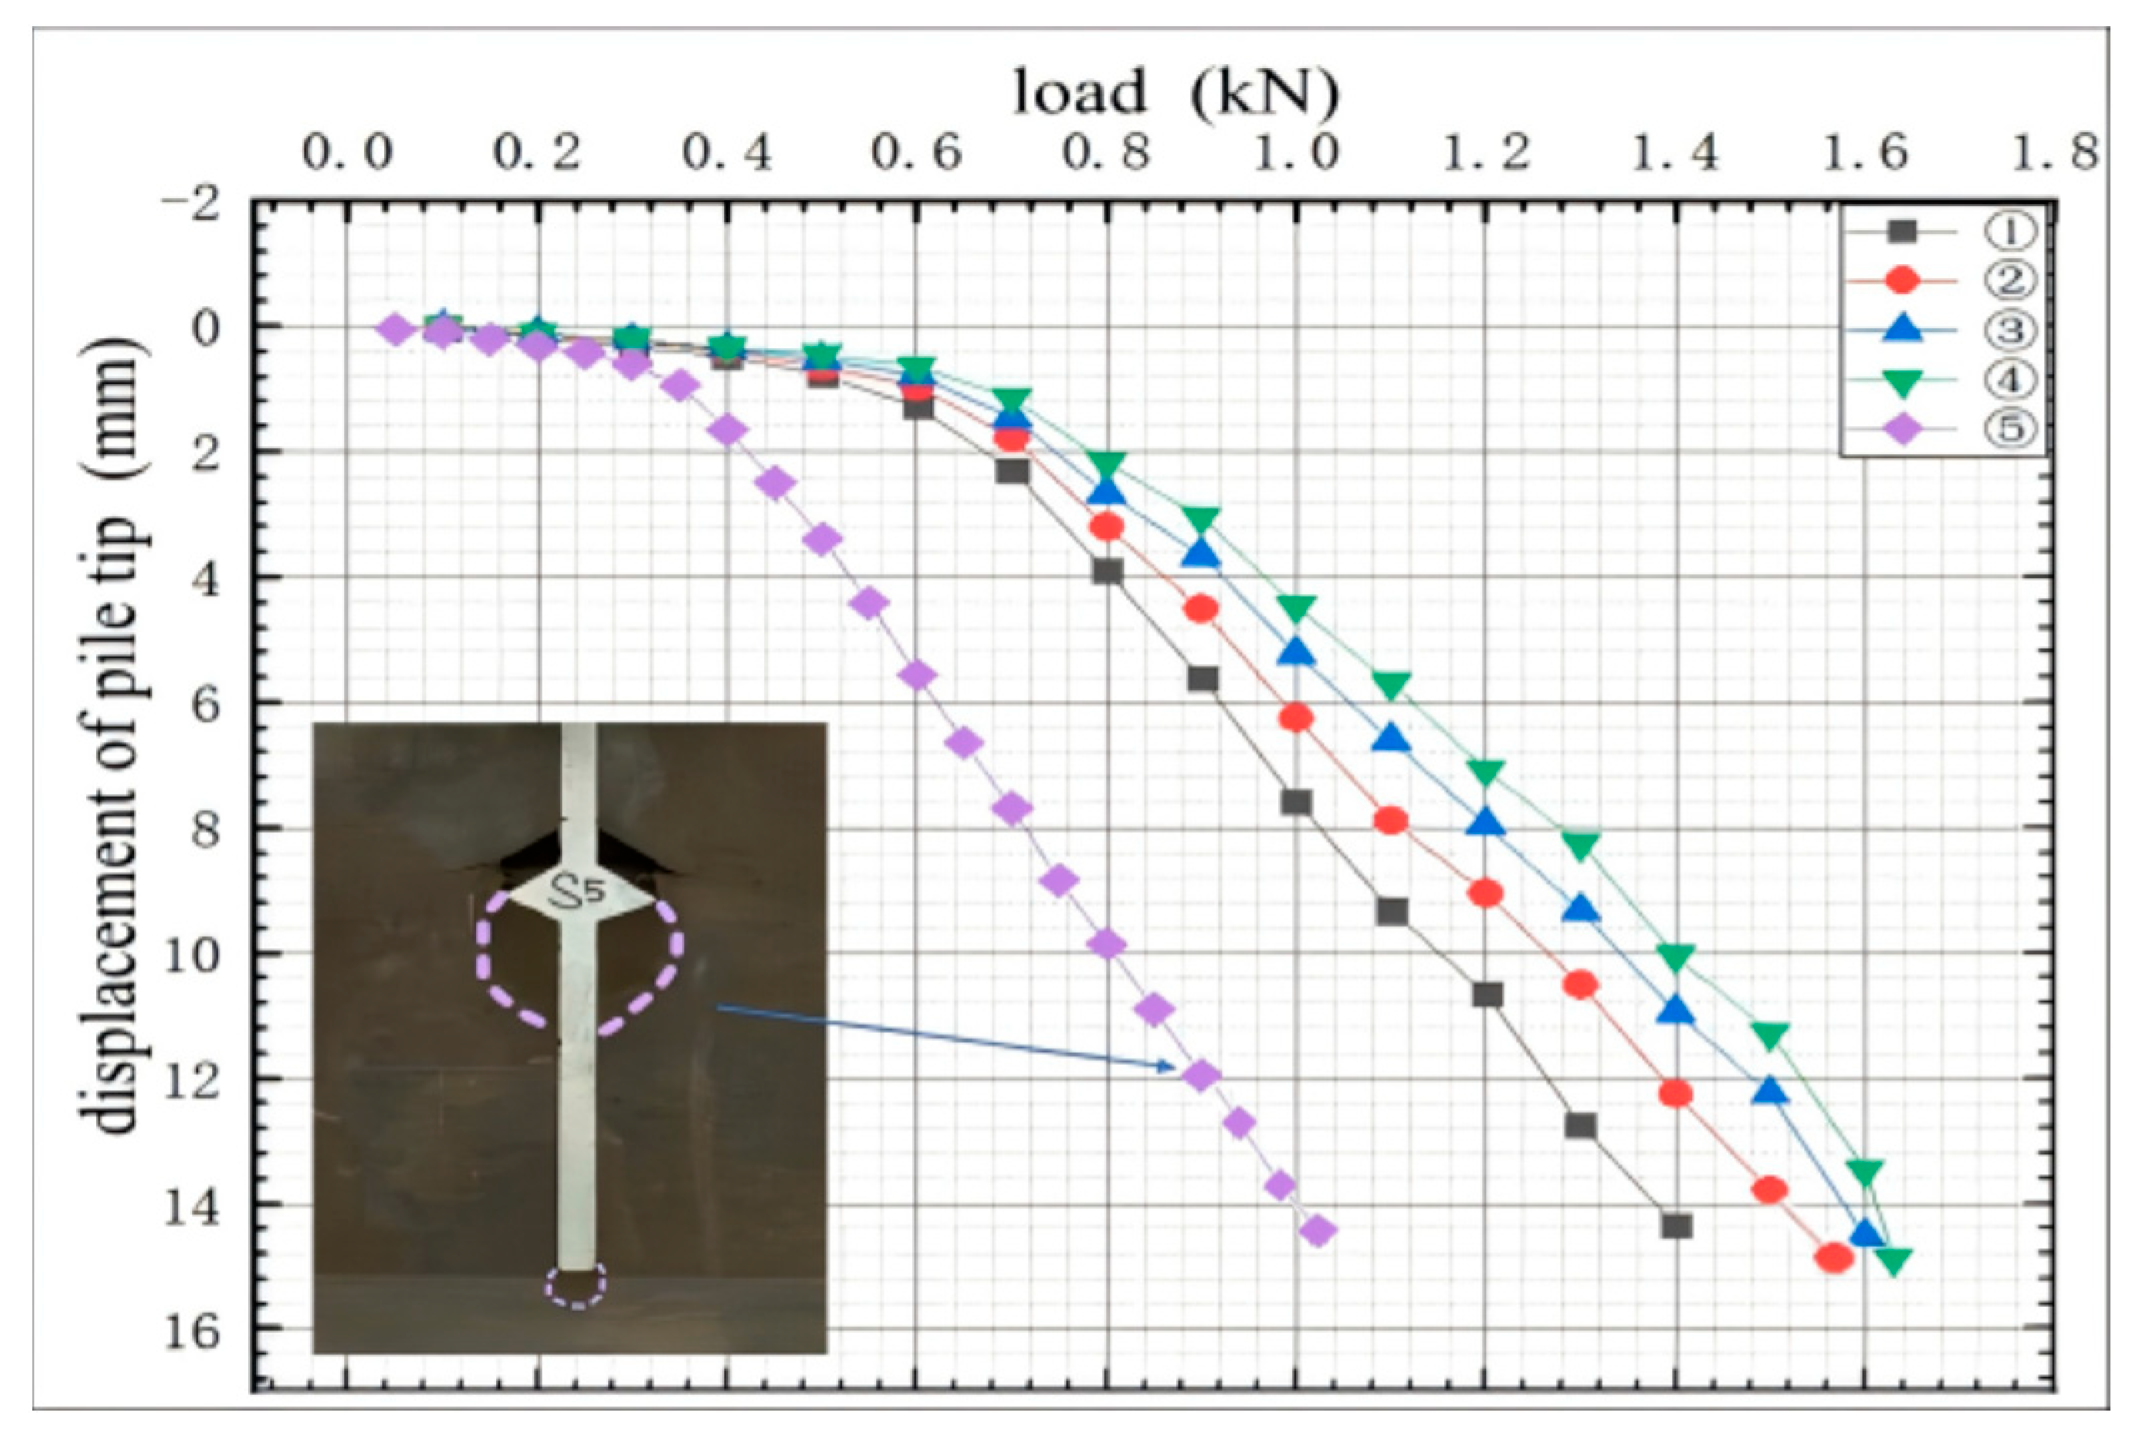
To compare the double piles and monopiles, the pile soil failure state of the monopile was recorded, and the load–displacement curve of the monopile was plotted according to the displacement results of the monopile model test, were illustrated in
Figure 12.
- (1)
As illustrated in the figure, the double-pile foundation exhibits a significantly higher bearing capacity than the single-pile foundation. This enhancement is attributed to the increased soil-pile contact area, which allows for a more effective mobilization of side friction and end-bearing resistance. Since these two components are critical to the overall bearing capacity, the larger contact area directly contributes to the improved performance of the double-pile system.
- (2)
In a double-pile foundation, the structural load is shared between the two piles. Firstly, this distribution means that each pile carries a reduced load compared to a single-pile system, allowing both piles to operate well within their ultimate capacity. Secondly, the two piles, together with the enclosed soil, form a synergistic system that works collaboratively to resist the applied load. This integrated interaction significantly enhances the overall bearing performance of the foundation.
- (3)
The ultimate compressive bearing capacities of Groups ① to ④ of double pile models and Group ⑤ are 1.4, 1.56, 1.6, 1.63, and 1.0 kN, respectively. In other words, the compressive bearing capacities of the four groups of two-pile models increased by 40%, 56%, 60%, and 63%, respectively, indicating that the double-pile foundation exhibited significantly superior bearing behaviour compared with a single pile. This enhancement was primarily attributed to the ability of the double-pile foundation to mobilise the lateral resistance of the surrounding soil more effectively, thereby increasing the overall bearing capacity. Furthermore, by distributing the applied load across multiple pile elements, the double-pile foundation alleviated the stress concentration inherent in single-pile foundations. Consequently, the double-pile foundation exhibited improved structural stability.
4. Calculation of the Compressive Bearing Capacity of the CEP Pile Double Pile
Building on the existing bearing capacity formula for CEP piles, this section refines the compressive bearing capacity formula for CEP double-pile foundations under varying pile spacings, based on the slip-line theory
4.1. Calculation of the Compressive Bearing Capacity of Monopiles
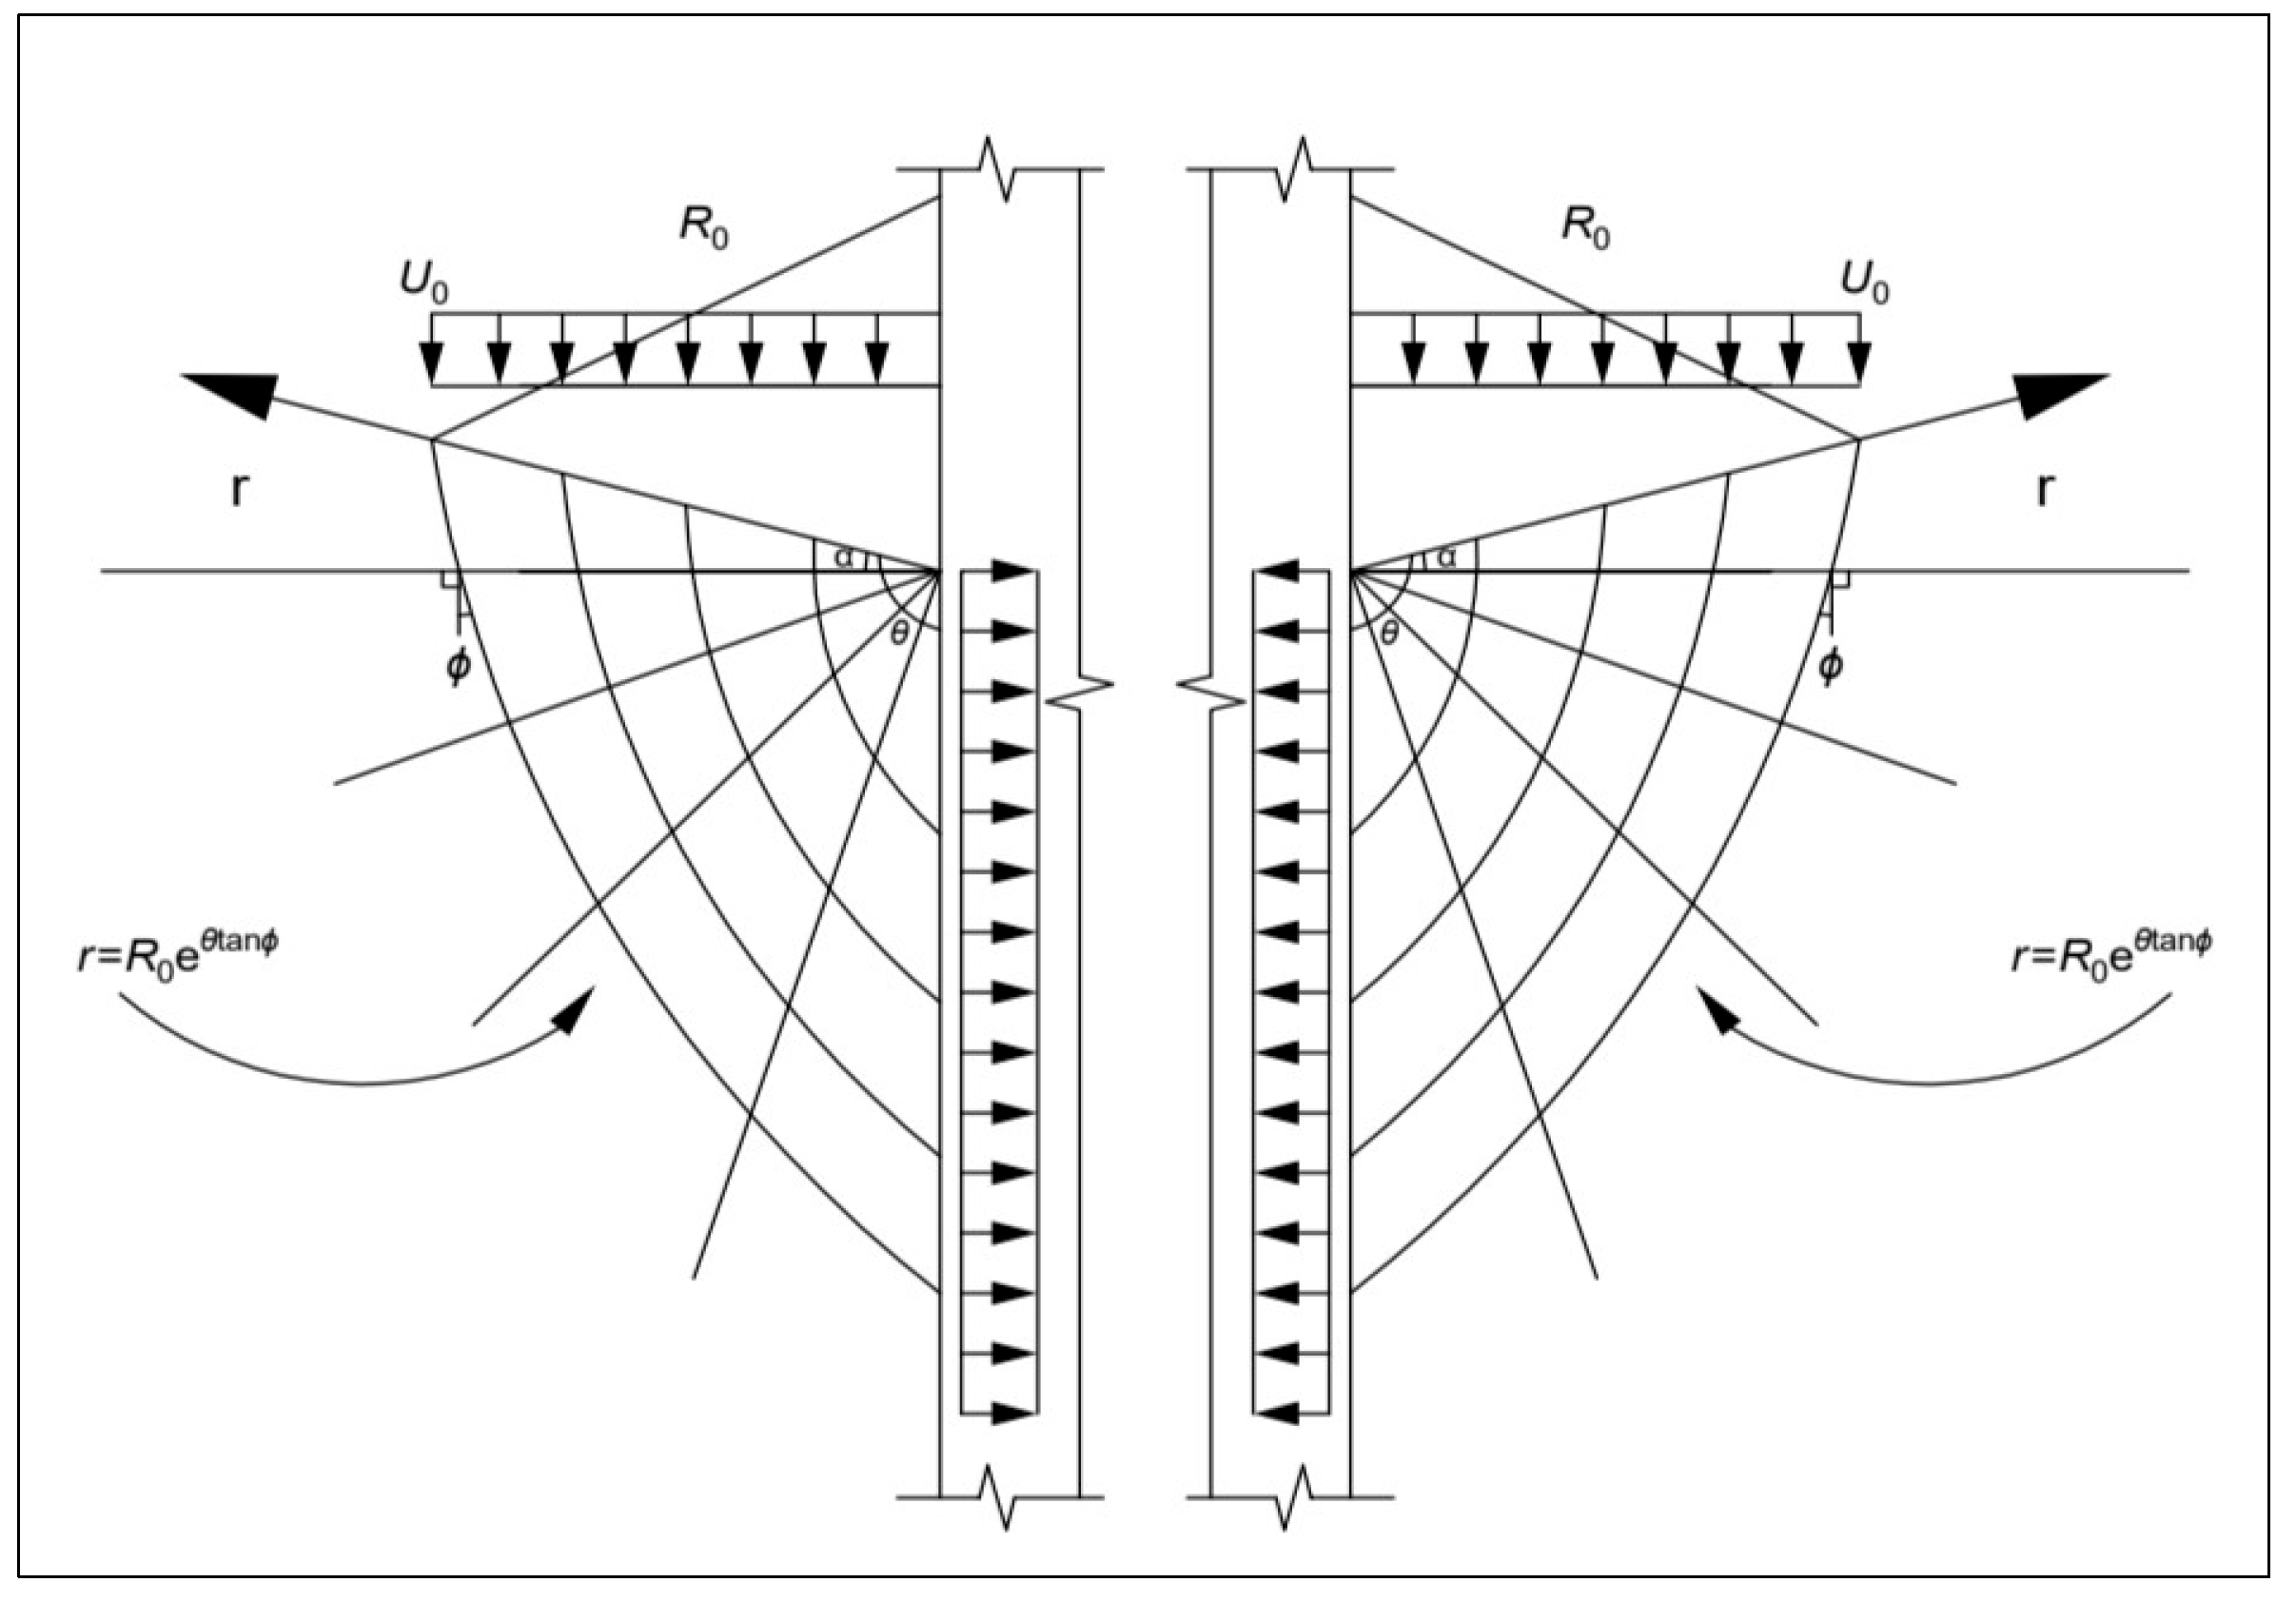
The strain field in the Prandtl region of the soil under the plate, as shown in
Figure 13.
The strain field comprised two radial rays and a logarithmic helix following r = R0eθtanϕ.
The monopile foundation was examined under vertical and horizontal loadings, and the following formula was proposed based on the principles of virtual work and slip line theory:
where
Fplate end,
Fpile end, and
Fpile side are calculated as
where
Fn—the ultimate bearing capacity of the soil under the unit width plate, which is calculated based on the slip line failure theory (kN).
D, d—diameter of the load-bearing plate and main pile (mm).
R0—cantilevered diameter of the load-bearing plate.
c—cohesion (KPa).
θ—α + 90°.
ϕ—internal friction angle (°).
Substituting Equation (3) into Equation (4) yields
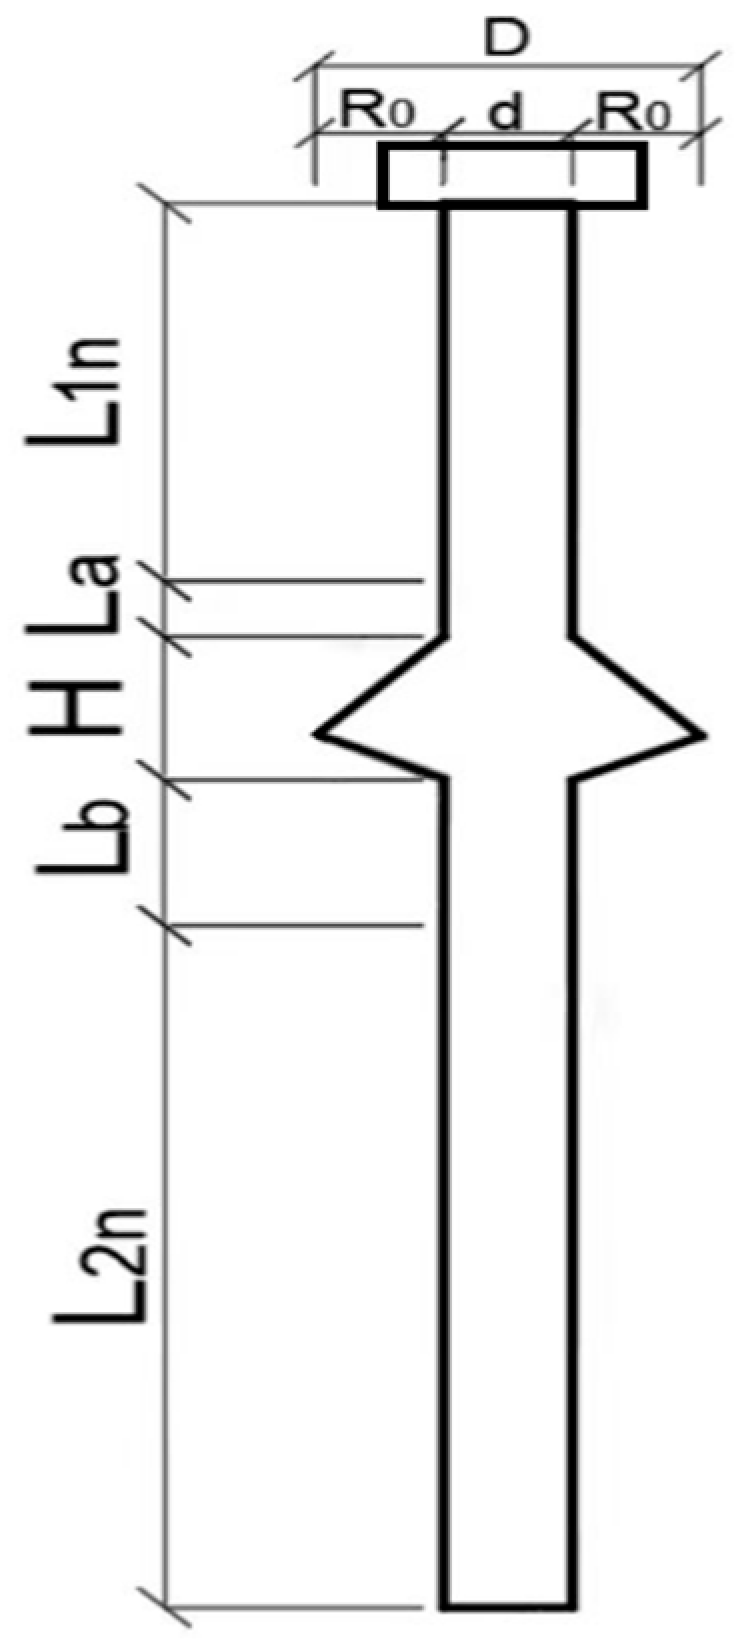
Under vertical loading, separation occurs between the upper surface of the bearing plate and the surrounding soil in a CEP pile foundation. Consequently, shaft friction is absent within the
La zone shown in
Figure 14. In contrast, the soil within the
Lb range beneath the plate is subjected to compression, necessitating the inclusion of an amplification factor
γ in the calculation. Therefore, the effective length for shaft friction,
, is given by:
where
L—length of the pile.
H—height of the load-bearing plate.
La—horizontal compressive stress range appearing around the main grain on the plate.
Lb—increase in horizontal tensile stress around the soil under the plate.
γ—increase factor, ranging from 1.1 to 1.2.
L1n—length of the upper segment of the pile
L2n—length of the lower segment of the pile
This yields the formula for the shaft friction resistance:
The calculation formula for the pile end resistance is:
The formula for the compressive bearing capacity of a single CEP pile can be obtained as:
4.2. Correction of the Calculation Formula for the Bearing Capacity of the Double Pile Foundation
The calculation formula for the compressive bearing capacity under the influence of pile spacing is corrected as follows:
The validated finite element model was subsequently employed to calculate the ultimate bearing capacity of double-pile foundations with different pile spacings. The calculated ultimate loads and the derived double pile influence coefficient (η) are listed in
Table 3.
The influence coefficient of the double pile was computed by dividing the ultimate compressive bearing capacity of the double pile by that of the monopile.
η increases along with pile spacing. Based on these results, the compressive bearing capacity of the CEP double pile is computed as follows:
5. Discussion
This study systematically investigated the compressive performance and soil failure mechanisms of CEP double piles through integrated physical model tests and finite element simulations. The results unequivocally demonstrate that pile spacing is a critical factor governing the bearing behavior, primarily by controlling the degree of pile-soil-pile interaction.
The evolution of the soil failure mode, vividly captured by the visual test method (
Figure 6), provides direct evidence of the load-transfer mechanism. The consistent formation of horizontal cracks at the edges of the bearing plates across all tests confirms that the plates act as the primary load-bearing components. At small pile spacings, significant interaction between the surrounding soil of adjacent piles was observed, resulting in a notable overlap of their displacement zones. As the spacing increased, the soil failure mode transitioned into two distinct and separate failure zones. These experimental observations validate the feasibility and accuracy of using the ANSYS software to simulate the soil failure process in the CEP double-pile system.
As shown in
Figure 7, the ultimate bearing capacity increased with larger pile spacing. At close spacings (e.g., P = 1.0 R
0 and 1.5 R
0), the significant interaction and superposition of shear zones in the inter-pile soil—visually confirmed by the overlapping displacement clouds in
Figure 10a,b—led to a pronounced group effect. This effect manifests as a reduced efficiency per pile because the shared soil mass cannot mobilize its full strength for both piles simultaneously. As the spacing increases, the stress zones become increasingly independent, allowing each pile to mobilize a larger, less-interfered volume of soil, thereby approaching the bearing efficiency of a single pile. The attenuation in the rate of bearing capacity improvement beyond a spacing of 2.0 R
0 (
Figure 8) indicates the existence of an optimal pile spacing range (2.0 R
0 to 2.5 R
0), where the foundation achieves near-optimal capacity without incurring the economic penalties of excessive spacing.
We observed a high degree of consistency between the experimental phenomena and the finite element analysis results. Specifically, the comparison between the soil failure patterns observed in the tests (
Figure 6) and the displacement nephograms obtained from the simulations (
Figure 10) reveals strong agreement, providing robust cross-validation of our findings. The small-scale semi-cross-sectional pile test, independently developed by our research group, offers unique visual insight into the progressive failure process of the soil, while the finite element simulation quantitatively corroborates the conclusions drawn from the experiments. The close alignment of results from these two distinct methodological approaches—one experimental and visual, the other numerical and theoretical—significantly enhances the reliability and credibility of the identified soil failure mechanisms in CEP double piles and the proposed optimal pile spacing range.
The double-pile foundation demonstrated significantly superior performance compared to the monopile (
Figure 12), highlighting the advantage of the group configuration. However, this advantage is not simply additive. The double-pile capacity was less than twice the single-pile capacity, underscoring the inherent group effect. The introduced pile spacing influence coefficient (η) in the modified bearing capacity formula quantitatively captures this effect. For conventional straight-shaft bored pile groups, previous studies have well-documented that the group efficiency (the ratio of group capacity to the sum of single pile capacities) is typically less than 1 due to significant stress overlap and shadowing effects [
23,
24]. In contrast, our CEP double-pile system demonstrated a collective capacity substantially greater than that of a single pile (as shown in
Figure 12), with an effective efficiency factor (η) greater than 1.5 for all spacing configurations (
Table 3). This superior performance can be attributed to the dominant role of the bearing plates, which mobilize deeper and more independent soil masses compared to the primarily shaft-resisting straight piles. Furthermore, when compared to other variable-section piles like DX piles, which also show improved performance, the unique construction method and plate configuration of CEP piles appear to facilitate a more efficient mobilization of both shaft friction and end-bearing resistance in a group setting. This comparative analysis underscores the potential of CEP pile groups to achieve higher bearing capacity with fewer piles, offering clear economic and performance advantages in practical applications. This correction represents a crucial step towards a more rational design methodology for CEP pile groups, moving beyond the conventional approach of applying empirical reduction factors derived from straight-shaft piles, which may not accurately represent the unique failure mechanisms of variable-section piles.
While this study focused on the behavior of a CEP double-pile system under vertical loading, the findings establish a critical foundation for understanding more complex configurations. The identified failure mechanisms and optimal spacing provide a valuable benchmark for future investigations into larger pile groups, different soil types, and combined loading conditions, thereby paving the way for the broader application and promotion of CEP piles.
6. Conclusions
The conclusions are summarized as follows.
The phenomenon produced by each group of double piles was identical in terms of the failure state of the soil around the pile. Specifically, all groups exhibited horizontal cracks at the same position on the plate. The soil around the pile was squeezed under the plate to form a symmetrical watermark, and the soil at the bottom of the pile formed a small circular arc slip line. These results indicate that the double piles can evenly share the load. Therefore, double-pile bearings are conducive to solving the problem of pile foundation settlement.
With small pile spacing, the watermarks of the soil around the pile influenced each other’s distribution; however, as the spacing further increased, the influence gradually decreased. When the distance between the double piles was small, the soil between the piles demonstrated overall failure, which may have led to greater damage. Therefore, pile spacing should be appropriately designed.
The graph shows that with increasing pile spacing, the compressive bearing capacity of the double pile increased continuously, whereas the double pile effect decreased. However, actual projects are affected by many factors, and a sufficiently large pile spacing cannot be guaranteed. Therefore, pile spacing and the double-pile effect should be considered when calculating the ultimate compressive bearing capacity of a double pile.
The double-pile foundation demonstrates a significant enhancement in bearing capacity compared to the single pile, with increases ranging from 40% to 63% across the tested pile spacings. This confirms its superior ability to share the load and more effectively mobilize soil resistance.
Based on the compiled results from compressive simulation analyses and physical model tests for CEP double piles with various spacings, the formula for its compressive bearing capacity was revised, which promoted the development of CEP piles.
7. Future Work
This study primarily focuses on the interaction mechanisms in a CEP double-pile group within a homogeneous soil layer under vertical loading. To simplify the analysis, the soil condition was idealized as a single layer, which consequently introduces deviations from real-world stratified ground. To enhance the practical applicability of the findings, future work will expand in two key directions. First, the influence of multi-layered soil profiles on the group efficiency and failure mechanisms of CEP piles will be systematically investigated. This will clarify how the position of the bearing plate relative to soil interfaces affects the load transfer and overall performance. Second, we will employ Discrete Element Method (DEM) modeling to probe the micromechanical underpinnings, such as force chain evolution and particle rearrangements, providing a particle-scale perspective on the soil failure observed at the macro-scale.
Author Contributions
Conceptualization, Y.Q.; methodology, M.G.; software, Y.D.; investigation, Y.Z. (Ying Zhou); writing—original draft preparation, Y.L.; writing—review and editing, Y.L.; supervision, X.W.; project administration, Y.Z. (Yingtao Zhang); funding acquisition, Y.Q. All authors have read and agreed to the published version of the manuscript.
Funding
This study was financially supported by the National Natural Science Foundation of China (Grant No. 52078239) and the National Key R&D Program of China (Grant No. 2024YFF0508104).
Data Availability Statement
The original contributions presented in the study are included in the article; further inquiries can be directed to the corresponding author.
Acknowledgments
We would like to express our gratitude to the experts from China Construction Fifth Engineering Division Corp., Ltd., for their assistance in laboratory research for this study.
Conflicts of Interest
The authors declare no conflicts of interest.
Abbreviations
The following abbreviations are used in this manuscript:
| CEP piles | Concrete expanded-plate piles |
| D-P | Drucker-Prager |
References
- Zhang, B.; Mei, C.; Huang, B.; Fu, X.; Luo, G.; Lv, B. Model tests on bearing capacity and accumulated settlement of a single pile in simulated soft rock under axial cyclic loading. Geomech. Eng. 2017, 12, 611–626. [Google Scholar] [CrossRef]
- Iovino, M.; Di Laora, R.; de Sanctis, L. Serviceability analysis of piled foundations supporting tall structures. Acta Geotech. 2021, 16, 3963–3973. [Google Scholar] [CrossRef]
- Musial, W.; Spitsen, P.; Duffy, P.; Beiter, P.; Shields, M.; Hernando, D.M.; Hammond, R.; Marquis, M.; King, J.; Sathish, S. Offshore Wind Market Report: 2023 Edition; Department of Energy: Washington, DC, USA, 2023.
- Gao, X.; Ling, X.-Z.; Tang, L.; Xu, P.-J. Soil–pile-bridge structure interaction in liquefying ground using shake table testing. Soil Dyn. Earthq. Eng. 2011, 31, 1009–1017. [Google Scholar] [CrossRef]
- Cheng, J.; Tong, L.; Sun, C.; Zhu, H.; Deng, J. Experimental and numerical simulation investigations on the bearing capacity of stepped variable-section DX piles under vertical loading. Buildings 2024, 14, 3078. [Google Scholar] [CrossRef]
- Tang, S.; Chen, L. Field test of DX pile group. Adv. Mater. Res. 2011, 243–249, 2451–2455. [Google Scholar] [CrossRef]
- Qian, Y.; Ai, S.; Wang, R.; Jin, Y. Calculation model of bearing capacity of the rigid-body expanded plate pile under horizontal force in ocean engineering. J. Coast. Res. 2020, 111, 345–351. [Google Scholar] [CrossRef]
- Wang, G.; Qiao, S.; Li, G.; Singh, J. Direct shield cutting of large-diameter reinforced concrete group piles: Case study on Shenyang Metro construction. Case Stud. Constr. Mater. 2023, 18, e01864. [Google Scholar] [CrossRef]
- Feng, H.; Dai, X.; Chen, S.; Chen, J. Research on bearing characteristics of open-ended pipe piles under static load. Adv. Civ. Eng. 2021, 2021, 5572898. [Google Scholar] [CrossRef]
- Guner, S.; Chiluwal, S. Cyclic load behavior of helical pile-to-pile cap connections subjected to uplift loads. Eng. Struct. 2021, 243, 112667. [Google Scholar] [CrossRef]
- Xu, F.; Zhang, Q.; Li, L.; Wang, K.; Zhang, S.; He, P. Response of a single pile subjected to tension load by using softening models. Soil Mech. Found. Eng. 2017, 54, 24–31. [Google Scholar] [CrossRef]
- Zhao, S.; Wang, K.; Tu, Y.; Chen, W.; Wu, J. Numerical analysis of bearing behaviors of single batter piles under horizontal loads in various directions. Front. Struct. Civ. Eng. 2023, 17, 224–237. [Google Scholar] [CrossRef]
- Tzivakos, K.P.; Kavvadas, M.J. Numerical investigation of the ultimate lateral resistance of piles in soft clay. Front. Struct. Civ. Eng. 2014, 8, 194–200. [Google Scholar] [CrossRef]
- Zhang, Q.-Q.; Liu, S.-W.; Feng, R.-F.; Qian, J.-G.; Cui, C.-Y. Finite element prediction on the response of non-uniformly arranged pile groups considering progressive failure of pile-soil system. Front. Struct. Civ. Eng. 2020, 14, 961–982. [Google Scholar] [CrossRef]
- Sandeep, G.S.; Arun Kumar, Y.M.; Pandit, P.; Alexander, V.B. Effect of soil-pile interaction on inclined pile group subjected to axial and lateral loads. Eng. Lett. 2025, 33, 2713–2722. [Google Scholar]
- Lin, C.; Huang, L.; Chen, S.; Huang, M.; Wang, R.; Tan, Q. Study on shielding effect of the pile group in a soft-soil foundation. Appl. Sci. 2023, 13, 9478. [Google Scholar] [CrossRef]
- He, S.; Lai, J.; Li, Y.; Wang, K.; Wang, L.; Zhang, W. Pile group response induced by adjacent shield tunnelling in clay: Scale model test and numerical simulation. Tunn. Undergr. Space Technol. 2022, 120, 104039. [Google Scholar] [CrossRef]
- Zhang, X.-L.; Xue, J.-Y.; Han, Y.; Chen, S.-L. Model test study on horizontal bearing behavior of pile under existing vertical load. Soil Dyn. Earthq. Eng. 2021, 147, 106820. [Google Scholar] [CrossRef]
- Visuvasam, J.A.; Chandrasekaran, S.S. Effect of spacing and slenderness ratio of piles on the seismic behavior of building frames. Buildings 2022, 12, 2050. [Google Scholar] [CrossRef]
- Ahmadnezhad, M.; Naghipour, M.; Askari Fateh, A.M. Load–displacement behavior of helical pile using Frustum Confining vessel (FCV) and full-scale testing in Babolsar sand. Mar. Georesour. Geotechnol. 2025, 43, 1127–1139. [Google Scholar] [CrossRef]
- Das, R.; Manna, B.; Banerjee, A. Spectral element formulation for rock-socketed mono-pile under horizontal dynamic loads. Soil Dyn. Earthq. Eng. 2023, 169, 107863. [Google Scholar] [CrossRef]
- Zheng, G.; Wang, R.; Lei, H.; Zhang, T.; Fan, Q. Load-transfer-associated settlements of a piled building during shield tunnelling in soft ground. Tunn. Undergr. Space Technol. 2023, 133, 104964. [Google Scholar] [CrossRef]
- Filho, J.M.; Bonan, V.H.F.; Moura, A.S. Experimental study of the group effect on the bearing capacity of bored piles in sandy soil. Soils Rocks 2020, 43, 11–20. [Google Scholar] [CrossRef]
- Dai, G.; Salgado, R.; Gong, W.; Zhang, Y. Load tests on full-scale bored pile groups. Can. Geotech. J. 2012, 49, 1293–1308. [Google Scholar] [CrossRef]
Figure 1.
Actual construction drawings and schematic diagram of forces acting on the pile body. (a) Actual construction drawings. (b) Schematic of force on pile body.
Figure 1.
Actual construction drawings and schematic diagram of forces acting on the pile body. (a) Actual construction drawings. (b) Schematic of force on pile body.
Figure 2.
Test piece and design drawings of small-scale model piles.
Figure 2.
Test piece and design drawings of small-scale model piles.
Figure 3.
Conceptual model and physical prototype of the soil sampler (unit: mm).
Figure 3.
Conceptual model and physical prototype of the soil sampler (unit: mm).
Figure 4.
The process of soil extraction.
Figure 4.
The process of soil extraction.
Figure 5.
Test loading bench.
Figure 5.
Test loading bench.
Figure 6.
Progressive failure of soil surrounding the pile during hierarchical loading in the S2/S2′ group. (a) when not loaded, (b) 0.3 kN, (c) 0.35 kN, (d) 0.4 kN, (e) 0.55 kN, (f) at ultimate load.
Figure 6.
Progressive failure of soil surrounding the pile during hierarchical loading in the S2/S2′ group. (a) when not loaded, (b) 0.3 kN, (c) 0.35 kN, (d) 0.4 kN, (e) 0.55 kN, (f) at ultimate load.
Figure 7.
Load–displacement curves for CEP double piles with varying pile spacings.
Figure 7.
Load–displacement curves for CEP double piles with varying pile spacings.
Figure 8.
Load variation rate with pile spacing under varying displacements of the pile tip.
Figure 8.
Load variation rate with pile spacing under varying displacements of the pile tip.
Figure 9.
Mesh generation.
Figure 9.
Mesh generation.
Figure 10.
Test phenomenon and displacement cloud. (a) Group ①; (b) Group ②; (c) Group ③; (d) Group ④. Note: The displacement cloud colors represent soil displacement magnitude (e.g., red for large displacement, blue for small displacement), and the red dotted lines indicate soil slip lines.
Figure 10.
Test phenomenon and displacement cloud. (a) Group ①; (b) Group ②; (c) Group ③; (d) Group ④. Note: The displacement cloud colors represent soil displacement magnitude (e.g., red for large displacement, blue for small displacement), and the red dotted lines indicate soil slip lines.
Figure 11.
Load–displacement curves from tests vs. finite element (FE) simulations for all pile groups.
Figure 11.
Load–displacement curves from tests vs. finite element (FE) simulations for all pile groups.
Figure 12.
Load–displacement curves for single and double piles.
Figure 12.
Load–displacement curves for single and double piles.
Figure 13.
The strain field in the Prandtl region of the soil under the plate.
Figure 13.
The strain field in the Prandtl region of the soil under the plate.
Figure 14.
Schematic Diagram of the CEP Pile Foundation Zone.
Figure 14.
Schematic Diagram of the CEP Pile Foundation Zone.
Table 1.
Number and dimensions of the CEP piles.
Table 1.
Number and dimensions of the CEP piles.
| Constituencies | ① Group
(P/R0 = 1.0) | ② Group
(P/R0 = 1.5) | ③ Group
(P/R0 = 2.0) | ④ Group
(P/R0 = 2.5) | ⑤ Group |
|---|
| Stake | S1/S1′ | S2/S2′ | S3/S3′ | S4/S4′ | S5 |
| Length (L) | 230 mm |
| Diameter (d) | 12.5 mm |
| Diameter (D) | 56.25 mm |
| Cantilever diameter (R0) | 21.88 mm |
| Distance between plate top and pile top (L1) | 82.4 mm |
| Slope angle of plate (α, β) | α = 35° β = 20° |
| Distance between the ends of plates (P) | 21.88 mm | 32.82 mm | 43.76 mm | 54.70 mm | - |
| Distance between piles (S) | 78.14 mm | 89.08 mm | 100.02 mm | 110.96 mm | - |
Table 2.
Material property parameters of simulated pile-soil.
Table 2.
Material property parameters of simulated pile-soil.
| Material | Density (t/mm3) | Elastic Modulus (MPa) | Poisson’s Ratio | Cohesive (kPa) | Friction Angle (°) | Pile–Soil Friction Coefficient |
|---|
| Concrete | 2.25 × 10⁻⁹ | 3.15 × 10⁴ | 0.2 | -- | -- | 0.3 |
| Clay | 1.688 × 10⁻⁹ | 25 | 0.35 | 43.55 | 10.7 |
Table 3.
Influence coefficients of double piles with different pile spacings.
Table 3.
Influence coefficients of double piles with different pile spacings.
| Constituencies | ① Group | ② Group | ③ Group | ④ Group | ⑤ Group |
|---|
| Distance between the ends of the plates | 1 R0 | 1.5 R0 | 2 R0 | 2.5 R0 | - |
| Ultimate loads (kN) | 1.4 | 1.5 | 1.6 | 1.63 | 0.9 |
| Double pile spacing influence coefficient/η | 1.56 | 1.67 | 1.78 | 1.81 | 1 |
| Disclaimer/Publisher’s Note: The statements, opinions and data contained in all publications are solely those of the individual author(s) and contributor(s) and not of MDPI and/or the editor(s). MDPI and/or the editor(s) disclaim responsibility for any injury to people or property resulting from any ideas, methods, instructions or products referred to in the content. |
© 2025 by the authors. Licensee MDPI, Basel, Switzerland. This article is an open access article distributed under the terms and conditions of the Creative Commons Attribution (CC BY) license (https://creativecommons.org/licenses/by/4.0/).

