Abstract
Maglev trains represent an advanced form of modern rail transportation. The guideway irregularity presents a common disturbance to the safe and reliable operation of the maglev train. Variations in the air gap between the train and the guideway, induced by the guideway irregularities, exert a significant influence on the train’s dynamic performance, thereby impacting both ride comfort and operational safety. Although previous studies have acknowledged the importance of guideway irregularity, the stochastic effects on the car body vibration across different speeds have not been quantitatively assessed. To fill in this gap, this paper presents a 10-degree-of-freedom maglev train model based on multibody dynamics. The guideway is modelled via the finite element method using Euler–Bernoulli beam theory, and a linearized electromagnetic force equation is employed to couple the guideway and the train dynamics. Furthermore, the measurement data of guideway irregularity from the Shanghai Maglev commercial line are incorporated to evaluate their stochastic effect. Analysis results under varying speeds and irregularity wavelengths identify a resonance speed of 127.34 km/h, attributed to the interplay between guideway periodicity and the train’s natural frequency. When the ratio of the train speed versus irregularity wavelength satisfies the train’s natural frequency, a significant resonance can be observed, leading to an increase in train vibration. Based on the Monte Carlo method, stochastic analysis is conducted using 150 simulations per speed in 200–600 km/h. The maximum vertical acceleration remains relatively stable at 200–400 km/h but increases significantly at higher speeds. When the irregularity is present, greater dispersion is observed with increasing speed, with the standard deviation at 600 km/h reaching 2.7 times that at 200 km/h. Across all tested cases, acceleration values are consistently higher than those without irregularities within the corresponding confidence intervals.
1. Introduction
Maglev train is a new mode of modern railway transportation. Maglev trains often use magnetic levitation technology to run along guideways. By using magnetic forces to suspend and prevent the train from directly contacting the rail, the maglev systems offer several advantages over traditional wheel–rail trains. The absence of mechanical contact eliminates the friction and wear of the maglev trains, thereby reducing the maintenance requirements, operational costs, and resource consumption in both manufacturing and maintenance. The impact on the environment is correspondingly mitigated. Furthermore, the abandon of wheel–rail contact can eliminate the operational noise, minimizing noise pollution to surrounding areas. Reducing the physical wheel–rail contact and friction contributes to decreased energy consumption and greenhouse gas emissions in rail operation [1]. Therefore, the maglev train has been developed in many countries since the last century. Currently, there exist six commercial maglev train lines in operation in the world [2].
It has been established that guideway irregularity has the capacity to exert an effect on the air gap in magnetic levitation systems. (Section 2.3) This, in turn, has been shown to result in alterations to the electromagnetic force between the train body and the guideway. Consequently, this has a direct impact on the vibration of the train body. This has become a common occurrence in the daily operation of maglev trains. Maglev trains have a narrow suspension gap of approximately 10 mm [3]. Consequently, variations in the air gap resulting from irregularities in the guideway can have a substantial effect on the vibration level of the train. Research has demonstrated that the vertical acceleration of a train in the presence of irregularities can exceed twice the level observed in the absence of such irregularities. This heightened acceleration has the potential to induce resonance phenomena [4,5]. A plethora of maglev train–guideway coupling models have been proposed in previous studies. The modelling analysis of a coupled train–guideway system can be considered as a force analysis of moving loads on a beam. Therefore, early models only treated the vehicle body as a single mass body and proposed either a single degree of freedom (DOF) or a 2-DOF model [6]. Furthermore, 1-DOF and 2-DOF models that analyse only the critical part of the train in contact with the guideway have been developed in the latest research [3]. A 5-DOF maglev vehicle model was developed by Lee et al. [7] and Kong et al. [8] to investigate the impact of various parameters on dynamic response. This model was tuned by an active controller. Cui et al. [9] established a 5-degree-of-freedom model with lateral movement freedom for the purpose of studying the effect of lateral disturbances on medium- and low-speed maglev trains. The low-speed maglev train model established by Kang et al. [10] consists of a car body and three suspension frames, with each structure containing five degrees of freedom, including lateral motion, vertical motion, pitch motion, yaw motion, and roll motion. Wang et al. [11] established a 2-DOF model that exclusively considers the lateral relative movement between the car body and the suspension frame, and between the suspension frame and the electromagnet, with a view to studying the effects of crosswinds and random guideway irregularities on train lateral vibration. In recent years, more accurate models were established. Kim et al. [12] put forward a three-dimensional full vehicle model encompassing car bodies, joints, force elements, levitation electromagnets, and a feedback controller, which is based on virtual prototyping technology. This model was employed to conduct a numerical analysis on the vehicle’s instability and the performance of air gap control. Han et al. [13] developed a three-dimensional multibody vehicle model consisting of eight bogies and two cabins, along with an electromagnetic controller. Song et al. established a three-dimensional multi-body model that considers the train transmission system [14]. Combining the theoretical model with the test line data of the Shanghai Maglev line, Zhang et al. [15] updated the system model and improved the accuracy of the model based on the measured data. Due to the slender structural characteristics of maglev guideways, they are typically modelled based on Euler–Bernoulli beam theory [16,17]. The efficacy of such models has been demonstrated in the context of slender structures and low-frequency vibration problems. However, these models have been observed to overestimate the natural frequencies of deep beams [18]. Considering the aforementioned circumstances, the present study incorporated the Rayleigh beam theory with a view to enhancing the performance of extant models. With regard to the solutions for coupled train-bridge systems, analytical methodologies such as the Fourier transform method and mode superposition method [19,20], which are commonly utilized for traditional wheel-on-rail systems, remain applicable. Semi-analytical solutions have also been employed in addressing more intricate moving load problems, including considerations such as the critical velocity and instability of two proximate moving masses [21], as well as the nonlinearity inherent in track structures. Furthermore, numerical methods, particularly the finite-element method (FEM) [22], are frequently adopted due to their versatility and superiority in handling complex train-track dynamics compared to purely analytical approaches. In recent studies, the moving element method (MEM) has also been used and successfully applied to various train-track problems [23,24,25]. The convection-type moving mechanism is employed in this method, which attaches the coordinate system to the moving load. Furthermore, structure-preserving numerical methods have been employed in some research to achieve accurate simulation [26,27]. Due to the limited amount of sample data available on magnetic guideway irregularities, most research on maglev train systems is based on analysis of conventional rail track irregularities. Dai et al. [28] reduced the complexity of the guideway irregularity by transforming it into a sinusoidal wave characterized by periodicity. In the study by Zhang et al. [15], the spectrum of a high-speed railway was utilized directly for the purpose of generating random irregularity samples. However, these models are not capable of accurately simulating the actual irregularity of the high-speed maglev guideway. This is due to differences in the manufacturing and maintenance of the guideway, as well as in the way the train operates compared to a conventional high-speed railway [29]. Jin’s findings revealed a substantial discrepancy between the irregularity spectrum of the maglev guideway and that of conventional tracks [30]. Therefore, this study generates random irregularity samples based on the actual irregularity spectrum measured on the Shanghai Maglev commercial line.
Nonetheless, despite the acknowledged significance of guideway irregularity in influencing the ride comfort of maglev trains, there remain noticeable deficiencies in current research. On one hand, the in-depth understanding of the mechanism through which irregularities affect the train’s dynamic behaviour is inadequate, especially regarding how the characteristics of irregularities (such as wavelength) interact with the train’s vibration responses under different operating speeds. On the other hand, the quantitative analysis of the stochastic effects of guideway irregularities is lacking. Most existing studies either adopt simplified deterministic models of irregularities or fail to systematically quantify the probabilistic distribution of dynamic responses caused by random irregularities.
To address these research gaps, this paper establishes a stochastic guideway irregularity model for maglev systems, incorporating the measured irregularity data from the Shanghai Maglev commercial line to enhance the model’s authenticity. In addition to traditional analytical and numerical studies, recent research efforts have also focused on data-driven and signal-based modelling of high-speed train dynamics. For example, Wang et al. [31] proposed a time–frequency dual-domain deep learning approach for predicting pantograph–catenary dynamic performance, which demonstrated the potential of intelligent analysis methods for complex vehicle–infrastructure interaction problems. Inspired by these developments, the present study investigates the stochastic dynamic interaction between maglev trains and irregular guideways through a physics-based modelling framework. By integrating this model with the dynamic analysis framework, the sensitive wavelengths of irregularities that have significant impacts on vehicle vibration at different speeds are identified. Moreover, stochastic dynamics analysis is conducted to quantify the stochastic effects of irregularities, and probabilistic indicators (including standard deviation and confidence interval) are derived to characterize the dispersion and statistical distribution of key dynamic responses. These endeavours are intended to provide an in-depth insight into the mechanism of irregularity-induced vibration and offer quantitative references for the design and maintenance of maglev systems.
In addition to geometric irregularities of the guideway, external aerodynamic disturbances such as crosswinds and unsteady airflow may also influence the dynamic responses of high-speed maglev systems. Previous studies have demonstrated that crosswinds can alter the equilibrium position of suspended vehicles and significantly enhance vibration levels when combined with guideway irregularities [32]. Li et al. [33] further introduced steady aerodynamic loads into maglev dynamic models and revealed their impact on both vertical and lateral vibration indices. Yan et al. [34] employed computational fluid dynamics (CFD) to show that aerodynamic forces increase with train speed and wind velocity, potentially exacerbating instability. More recently, Huang et al. [35] pointed out that crosswinds may degrade stability margins in high-speed maglev operation. While the aerodynamic factor is important, the present study adopts a controlled-variables approach, focusing specifically on the stochastic effects of guideway irregularities under idealized aerodynamic conditions. This allows us to isolate and quantify the fundamental influence of geometric irregularities on vertical dynamics. The findings provide essential theoretical references, and future work will extend the analysis to incorporate aerodynamic excitations for a more comprehensive assessment.
2. Modelling of Maglev System
In this section, a 10-degree-of-freedom maglev train–flexible guideway coupled model is developed using data from the Shanghai Maglev commercial line. The guideway is represented using the finite element method based on Euler–Bernoulli beam theory, while a linearized electromagnetic force equation is applied to couple the guideway and train dynamics. The power spectral density (PSD) characterizing the stochastic properties of guideway irregularities, obtained from measurements on the Shanghai Maglev commercial line, is integrated into the model to facilitate the evaluation of their stochastic effects.
2.1. Train Model
Figure 1 shows a schematic representation of a maglev train traversing a multi-span guideway, based on the Shanghai Transrapid 08 model. In this model, the maglev train is assumed as multiple rigid bodies comprising a maglev car body, four levitation bogies, and eight magnets. The car body and four levitation bogies have both vertical and rotational degrees of freedom (DOFs), and the magnets have only vertical DOF. Thus, the maglev train model has a total of 18 DOFs. According to Newton’s second law, the motion of equation for the maglev train can be expressed by

Figure 1.
Multiple span guideway system.
Here presents the mass, damping and stiffness matrices and external force vector of the train model, respectively. The external force contains the electronic forces and the gravitational forces acting between the maglev train and the guideway. , and denotes the acceleration, velocity and displacement vector of the maglev train, respectively.
Previous studies [15,28] have shown that the 10-degree-of-freedom model created by this model simplification is able to accurately simulate the actual state of train operation. In that case, the simplified maglev-guideway model was conducted in this study, as shown in Figure 2. In this model, the levitation bogies are neglected, and the mass of the levitation bogies is evenly distributed to the underneath magnets to eliminate the effect of the neglection. Table 1 lists the parameters of the car body.

Figure 2.
Simplified maglev-guideway model.

Table 1.
Car body parameters.
The prototype of the maglev-guideway model in this study is Shanghai Transrapid line, in which the car body and guideway are coupled via electromagnet forces, shown in Figure 3. Thus, Equation (1), above, can be juggled through electromagnet force . The electromagnet force between the nth magnet and the guideway is a nonlinear function of the electric current I and the air gap . The relationship can be expressed in a technical form as follows:
where f is a nonlinear function that describes the dependence of the electromagnetic force on the electric current and the air gap. For the specific electromagnet system in this study, the equation can be written as:
where is the magnetic permeability of vacuum with a value of , N is the number of the turns of the coil, and A is the magnet pole area. = is a coupling constant factor.
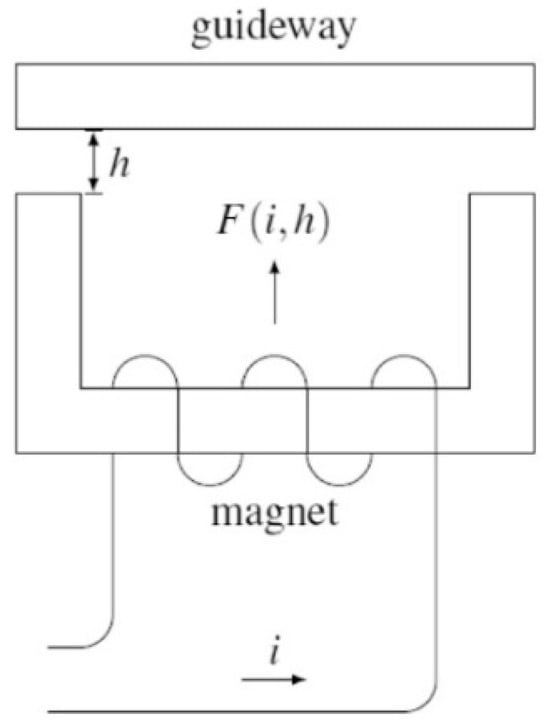
Figure 3.
Electromagnet coupling model.
To reasonably simplify the nonlinear equation, the nominal equilibrium state should be considered. Let = 25 A and = 0.01 m as the nominal current and air gap, respectively [36], the static equilibrium state of the electromagnet force is:
Thus, the electromagnet force can be linearized by:
where = , = . = , . = according to the current control law [36]. The feedback gained corresponding to the velocity, acceleration of the magnet, and the air gap change shows that and [36].
2.2. Guideway Model
Existing research has proposed numerous intricate and sophisticated guideway models. Dimitrovová [37] established a three-layer rail model to investigate system resonance issues caused by moving point loads. Anand et al. [38] further calibrated finite element rail models using log-normal sampling and a genetic algorithm (GA). The guideway model in this study is based on the Shanghai Transrapid line. Figure 4 shows the simplified diagram of a two-span guideway model. The multi-span guideway model in this study simulated the realistic infinitely long guideway bridge. The finite element method can be conducted based on this model. The guideway was modelled according to the Euler–Bernoulli beam theory since the span-to-width ratio of the guideway is relatively large. The infinitely long guideway is divided into elements; each element is treated as a Euler–Bernoulli beam element. The mass matrix for each element is computed by integrating the product of the material density ρ, cross-sectional area A, unit length Le, and the transpose of the Hermite function matrix N over the element’s length. Similarly, the stiffness matrix is derived by integrating the product of the transpose of the strain-displacement matrix B, the elastic modulus E, moment of inertia I, and B itself. These local matrices are then assembled into global matrices M and K, respectively, to facilitate the simulation of the guideway’s structural behaviour under various loading conditions and boundary constraints. The guideway girders, characterized by a unit length mass , length , and flexural rigidity , are supported by bearings with stiffness at both ends. Adjacent spans are interconnected via coupling connections exhibiting rotational stiffness . Table 2 provides a detailed listing of the guideway parameters.

Figure 4.
Guideway model.

Table 2.
Guideway parameters.
Let u (X, T) represent the displacement if the guideway girder at a distance X along the longitudinal direction of the guideway and at time T. The governing equations of motion for a guideway, considering Rayleigh damping, can be expressed as follows:
in which, is the electromagnet force between the guideway and the nth magnet, is the distance of the nth magnet along the longitudinal direction of the guideway. is the Dirac delta function, is the number of magnets on the guideway girder. is the mass proportional Rayleigh damping coefficient, while is the stiffness proportional Rayleigh damping coefficient.
2.3. Irregularity Model
In recent years, research on the irregularities of maglev guideways has gradually matured and has been widely applied in the study of medium- and low-speed maglev systems [39]. However, due to the paucity of maglev lines operating at speeds of 600 km/h, data on the irregularities of high-speed maglev guideways is relatively scarce. Reference [40] proposes a pioneering approach to the rectification of high-speed maglev guideway irregularities. The method first measures the overall guideway irregularity data at the actual operational speed of the Shanghai maglev line (i.e., 430 km/h), then establishes a high-speed maglev train–guideway coupling model to calculate dynamic irregularities. The dynamic irregularities at 430 km/h are then deducted from the overall irregularities, and the dynamic irregularities at 600 km/h are superimposed to obtain the overall irregularities at 600 km/h.
Consequently, in this study, the random guideway irregularities are generated from irregularity spectra measured in the field from the Shanghai Maglev commercial line. The used guideway irregularity power spectral density (PSD) is as follows:
where S(Ω) is the PSD (in ), Ω is the spatial frequency (in ), A, B, C, D, E, F, G are the characteristic parameters, and the corresponding fitting coefficients are shown in Table 3.

Table 3.
Fitting coefficients for guideway irregularity spectra.
The formula for the guideway irregularity spectrum is utilized to generate time-domain samples of guideway irregularity by employing the triangular series method. The triangular series method has been widely applied to generate random irregularity samples in railway and maglev studies, as it preserves the target PSD characteristics while ensuring computational efficiency. The PSD of irregularity samples obtained by this method has been proven to match the actual measured irregularity PSD [41]. In this study, artificial guideway irregularity profiles were generated based on the target PSD using the triangular series method. Following the method proposed by Loprencipe and Zoccali [42], the generation process of artificial profiles from the fitted PSD consists of an inverse Fourier transform with randomly distributed phase angles between 0 and 2π. This method ensures that the synthesized irregularity samples reproduce the statistical and spectral characteristics of the measured PSD. It is important to note that the irregularity samples generated from the PSD do not contain phase information. Consequently, the resulting guideway irregularity samples are random.
The generation of a set of irregularity samples from the PSD formula is demonstrated in Figure 5. The results subsequent to the loading of the irregularity samples into the air gap (i.e., the vertical distance between the electromagnet and the guideway) are demonstrated in Figure 6:

Figure 5.
Random irregularities.

Figure 6.
Air gap variation under irregularities.
It should be noted that the stochastic irregularity model adopted in this study mainly accounts for the geometric irregularities of the guideway. In reality, external disturbances such as airflow and crosswinds can further amplify irregularity effects and significantly alter the dynamic responses of maglev trains. For instance, Wang et al. [11] demonstrated that dual stochastic excitations of crosswinds and track irregularities introduce additional dispersion in vehicle responses. Incorporating aerodynamic excitations into the irregularity model will be an important extension of the present work and is left for future study.
3. Analysis with Different Speeds and Irregularity Wavelengths
3.1. Simulation Without Irregularity
The operation process of the train is simulated using the established maglev train–guideway coupling model. The maximum vertical acceleration of the train is illustrated in Figure 7.
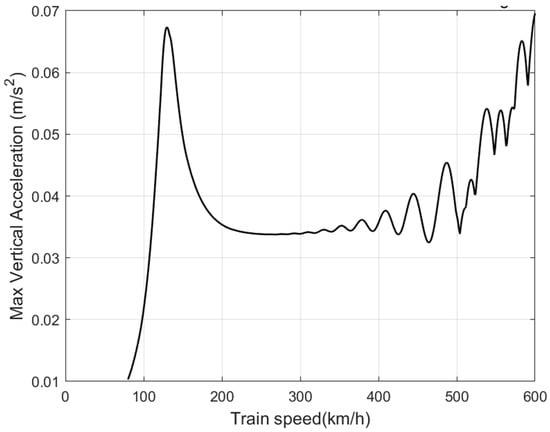
Figure 7.
Effect of train speed on maximum vertical acceleration without random irregularities.
In this study, the vertical acceleration was extracted at the centre of gravity of the car body, which represents the overall ride comfort of passengers. Local accelerations at bogies or electromagnets may differ; however, the car body acceleration is a widely adopted indicator in evaluating dynamic performance.
It is evident that as the train’s velocity exceeds 300 km/h, the maximum vertical acceleration of the train experiences a substantial increase with an increase in train speed, and a significant peak emerges at a running speed of approximately 130 km/h. Although maglev train differs from a conventional wheeled train in its mode of contact with the guideway, there still exists resonance in the system, and therefore a series of natural frequencies of the maglev system need to be calculated to analyse the resonance behaviour of the system. Each order of the train’s natural frequency can be calculated using the following equation:
This formula yields the fundamental frequency of the maglev train body in this study to be 8.89 rad/s (1.41 Hz). This frequency corresponds to the motion mode of the body rotating around its centre of gravity. When the train is running on the maglev guideway, the vertical vibration of the guideway will continuously apply an excitation of frequency V/L (V is the train speed and L is the length of each span of the guideway) to the vehicle body, from which the resonant vehicle speed of the train, , can be calculated as:
The resonant speed of the maglev train calculated by Equation (9) in this study is 127.34 km/h, which explains the data peak shown in Figure 7. The resonance speed of 127.34 km/h and sensitive frequency of 1.41 Hz obtained in this study is consistent with values reported in Zhang et al. [15] (130 km/h) and Dai et al. [28] (1.4 Hz). Minor deviations can be attributed to differences in modelling methods.
3.2. Frequency Analysis of Guideway Irregularities
Dai et al. [28] discovered that the sensitivity wavelength of guideway irregularity is contingent on the operating speed of maglev trains. This section conducts relevant research in order to analyse the relationship between the speed of high-speed maglev trains and the sensitivity wavelength of irregularities.
The frequency (wavelength) effects of the guideway irregularities can be analysed using the model of the maglev system developed in this study. Since the actual guideway irregularities can be regarded as a superposition of single-frequency irregularities, different single-frequency guideway irregularities can be added to the electromagnetic force model to investigate the sensitive frequency of the response of the maglev system to guideway irregularities.
To simplify the simulation study of guideway irregularities, a sinusoidal profile is set between the wavelength and amplitude . The equation is shown below:
where z represents the height of irregularity, X represents the position of irregularity along the guideway span.
The amplitude of the sinusoidal irregularities wave used in this study was selected to be 1 mm to be close to the measured real guideway irregularities data. The simulation results of this maglev system are shown in Figure 8. The train speed range and the guideway irregularity wavelength range are set to 80–450 km/h and 0–100 m, respectively.
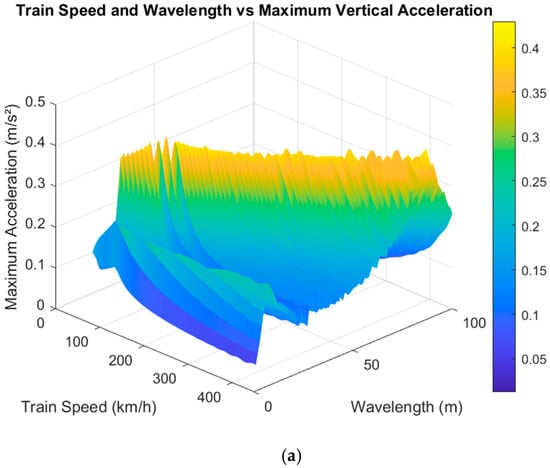
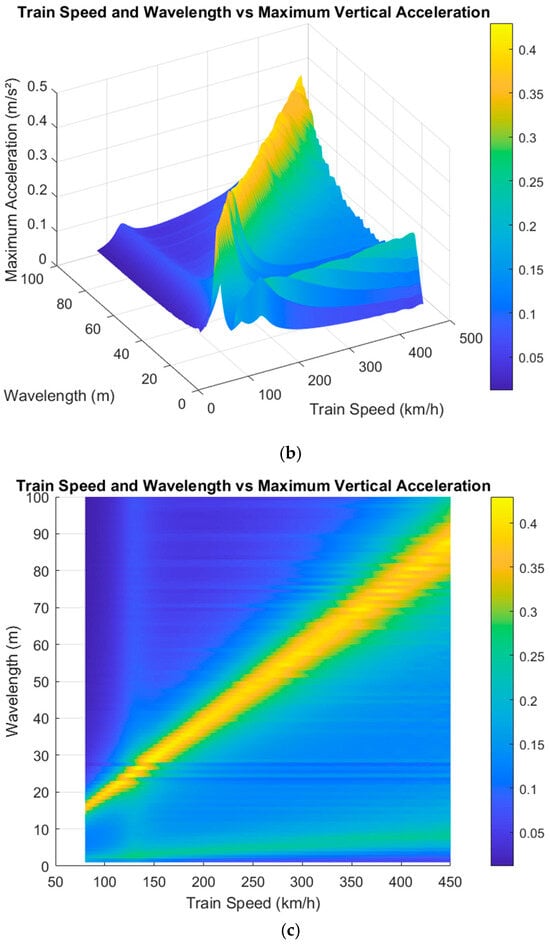
Figure 8.
Single-frequency analysis of guideway irregularities. (a–c) are three-dimensional diagrams from three different perspectives.
It can be seen that there is a significant sensitivity frequency to guideway irregularities during the operation of the maglev system, and the sensitivity frequency analysed in the three-dimensional diagrams is about 1.4 Hz, which is in line with the natural frequency of the vehicle body calculated through the mass matrix and stiffness matrix theory of the vehicle body. The system is predicted to reach a state of resonance under specific conditions, namely when the ratio of train speed to irregularity wavelength is approximately 1.4. The train body resonates at this excitation frequency, which results in a significant increase in the maximum vertical acceleration of the vehicle body. In addition, when the excitation frequency applied to the body by the vertical motion of the guideway is the same as the fundamental frequency of the body, resonance is also caused, and the speed of the train at which this resonance occurs (127 km/h) is also calculated and verified in the three-dimensional diagrams.
4. Analysis with Random Guideway Irregularity
4.1. Analysis of Stochastic Dynamics
Since the initial guideway irregularities power spectral density does not contain phase information, the random guideway irregularities time-domain sequence obtained through its conversion is a random signal. The present study utilized the Monte Carlo method to conduct a random dynamic analysis of the system [43]. This analysis was undertaken with the objective of investigating the impact of random excitation, which is caused by random guideway irregularities, on maglev trains. The process was based on the established maglev train–guideway coupling model, with several sets of random irregularity data generated from actual irregularity measurement data as input. Subsequent to the execution of the model simulation, a statistical analysis was conducted on the outcomes of all random experiments. The sequence of actions is illustrated in Figure 9.
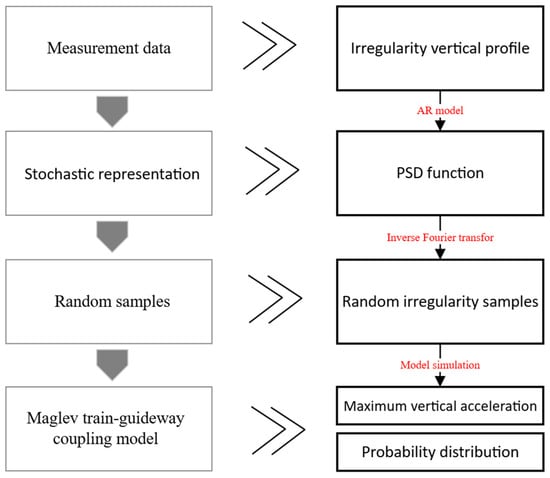
Figure 9.
Procedure of stochastic dynamics analysis.
An interval of train speeds from 200 km/h to 600 km/h is extracted, and 150 stochastic simulations were performed for each speed. Convergence analysis shown in Figure 10 indicates that increasing the number of simulations beyond 150 resulted in negligible changes in the mean and standard deviation of acceleration responses. Thus, 150 sets were considered sufficient to balance statistical reliability and computational efficiency. The results obtained are as follows:
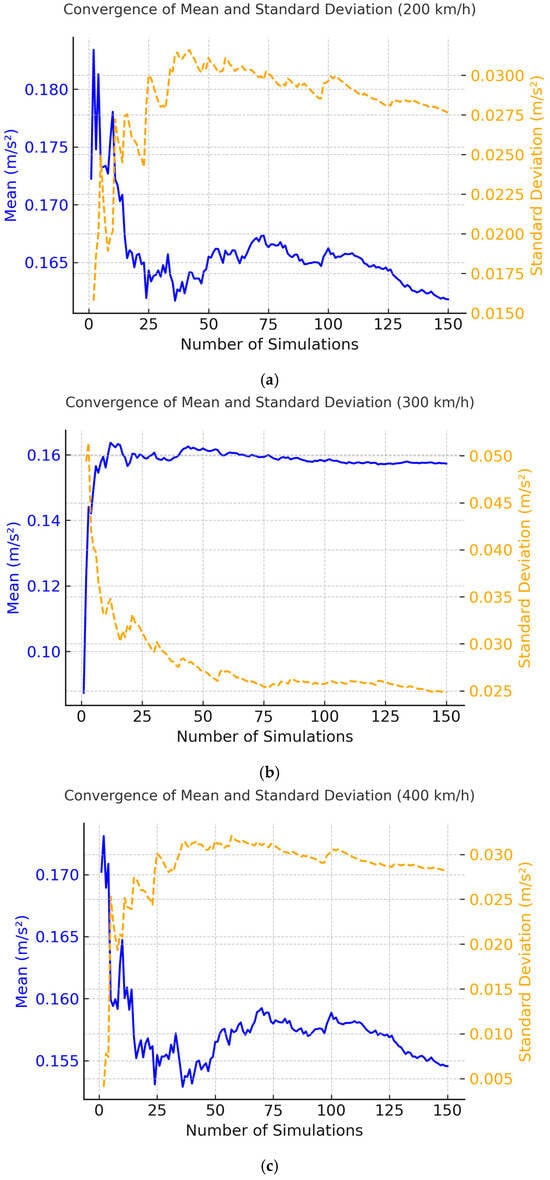
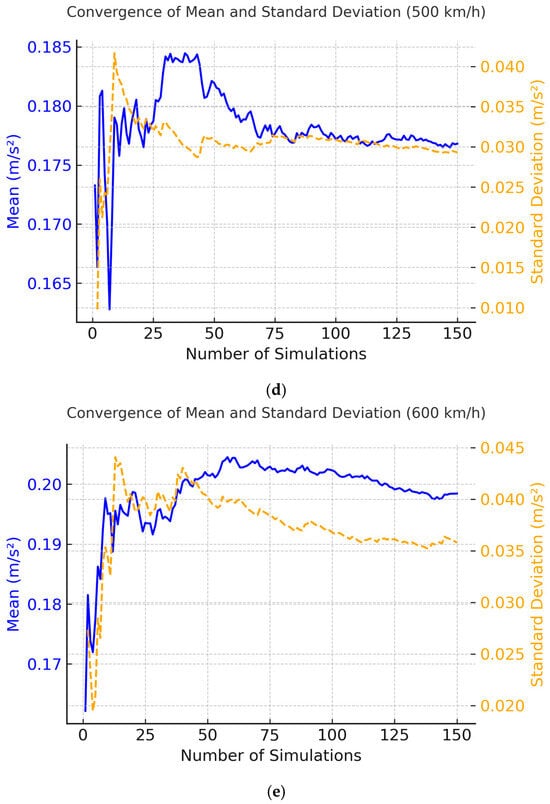
Figure 10.
Convergence of mean and standard deviation of (a) 200 km/h; (b) 300 km/h; (c) 400 km/h; (d) 500 km/h; (e) 600 km/h.
The conformity of the maximum vertical acceleration samples to a normal distribution was verified using the Shapiro–Wilk test (p > 0.05), which confirmed the normality assumption (Figure 11), and the maximum vertical acceleration of the train does not change significantly when the train is running at a speed between 200 km/h and 400 km/h and thereafter increases significantly with the increase in train speed (Figure 12). Box plot in Figure 13 was constructed using 150 sets of maximum vertical acceleration data at each speed within the 200–600 km/h speed range.
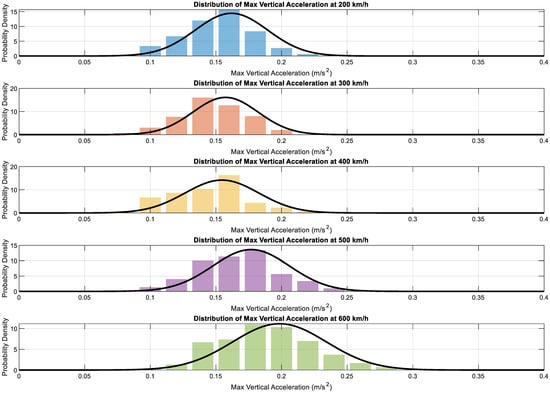
Figure 11.
Distribution of maximum vertical acceleration.
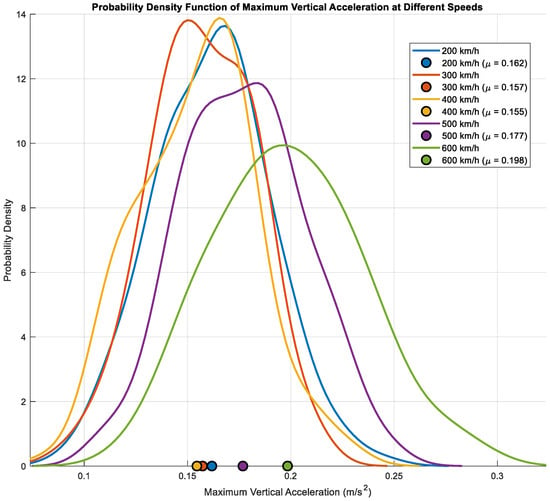
Figure 12.
Probability density function of maximum vertical acceleration.
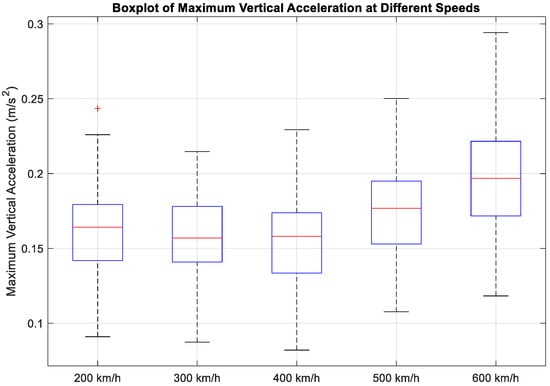
Figure 13.
Boxplot of maximum vertical acceleration.
Within the 200–400 km/h range, the median remains relatively stable with minimal fluctuations, indicating that the central value of acceleration within this speed range does not undergo significant changes. However, at speeds exceeding 400 km/h, the median value exhibits a substantial increase, indicative of a persistent upward trend in the concentration of acceleration as the velocity increases. The box width gradually expands in velocity; At 200 km/h, the interquartile range (IQR) of maximum vertical acceleration is about 0.037 m/s2, while at 600 km/h it increases to 0.049 m/s2, representing an increase of approximately 31%, indicating that random guideway irregularities lead to increased dispersion in acceleration responses. It has been demonstrated that the whisker length increases with speed, particularly the upper whisker, indicating that higher acceleration values occur more frequently at high speeds. The box plot provides a clear visual representation of the relationship between train speed and the dispersion of maximum vertical acceleration. This finding is consistent with the standard deviation analysis, which revealed that the standard deviation at 600 km/h was 2.7 times that at 200 km/h. This indicates that acceleration fluctuations become more intense as speed increases.
In order to further quantify the uncertainty surrounding extreme acceleration responses and to assess potential safety margins, Figure 14 presents the 95% confidence intervals for maximum vertical acceleration at various speeds.
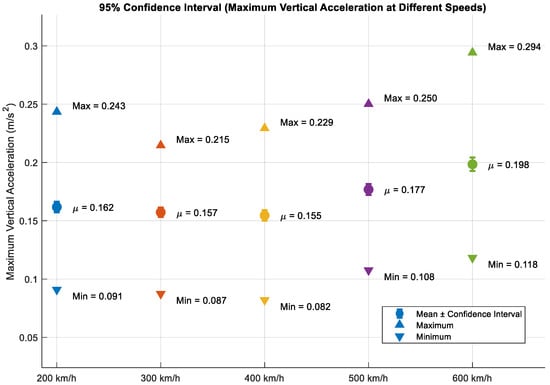
Figure 14.
95% Confidence interval of maximum vertical acceleration.
It is evident that the 95% confidence intervals increase monotonically with the velocity of the vehicle. At velocities of 200 km/h, the interval is found to be narrow, indicating a high degree of predictability with regard to acceleration extremes. However, at speeds of 600 km/h, the interval width increases by almost threefold, reflecting the exacerbated impact of random irregularities and resulting in increased uncertainty with regard to extreme acceleration values. The upper limit of the confidence interval increases gradually within the 200–400 km/h range, but rises steeply above 400 km/h.
Figure 15 and Figure 16 present a comparison between the upper boundary of the maximum vertical acceleration of the train in the presence of random irregularities and the maximum vertical acceleration in the absence of such irregularities. Table 4 illustrates the acceleration increase in the presence of guideway irregularities:
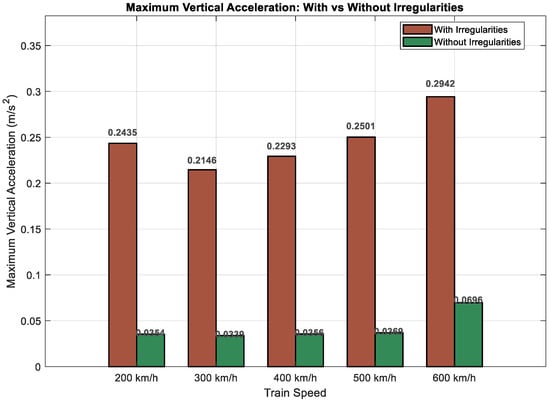
Figure 15.
Maximum vertical acceleration: With vs. Without irregularities.
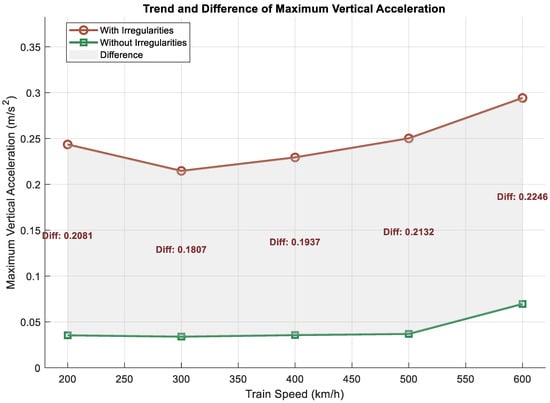
Figure 16.
Trend and difference in maximum vertical acceleration.

Table 4.
Percentage increase in maximum vertical acceleration compared to no irregularities.
The maximum vertical acceleration of the train was significantly greater in the presence of guideway irregularities compared to the absence of added guideway irregularities, and the data within the confidence intervals of the maximum vertical acceleration at each train speed worsened compared to the case without guideway irregularities. The theoretical maximum vertical acceleration achievable in the presence of guideway irregularities increases nonlinearly with train speed. The calculated maximum vertical accelerations remain below the limit of 0.6 m/s2 specified in the German Maglev design guideline [44]. This indicates that, under the modelling assumptions and within the stochastic simulation framework, the suspension system of the Shanghai Maglev Line is theoretically capable of maintaining ride comfort requirements. However, the actual effectiveness of the suspension design must ultimately be validated through experimental measurements and operational testing.
4.2. Case Study of Random Guideway Irregularity
This section involves the superimposition of a segment of random guideway irregularities onto the maglev train–guideway coupling model, followed by the execution of a spectral analysis at three common train operating speeds. The objective of this section is to examine the suppression performance of the Shanghai maglev line train suspension system when confronted with guideway irregularities.
By adding the obtained guideway irregularity data to the established Maglev train–guideway model for simulation, the obtained image of the variation in the maximum vertical acceleration of the train body with the speed of the train during train operation is shown in Figure 17. In the interval between the train operating speed of 80 km/h and 600 km/h, the maximum vertical acceleration of the train peaks near the operating speed of 100 km/h, which is close to the corresponding resonance speed of the calculated train body and triggers a strong resonance response. It then gradually decreases and fluctuates and starts to rise after the train’s operating speed reaches 400 km/h. The maximum vertical acceleration of the train body is less than 0.6 specified in the German Maglev design guideline in all speed intervals [39], suggesting that the current design of the Shanghai Maglev line system meets the requirements for passenger comfort.
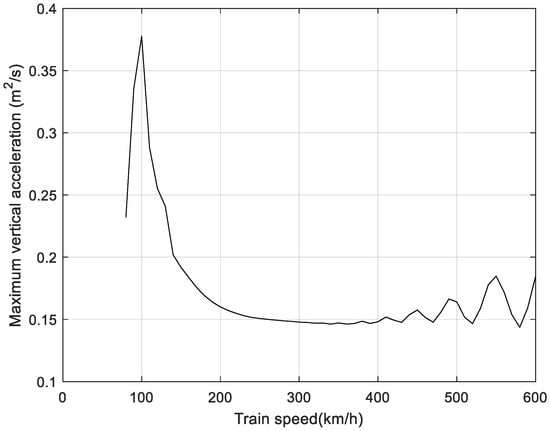
Figure 17.
Effect of train speed on maximum vertical acceleration under one random irregularity sample.
Since the speed of the maglev train is mostly in the range of 200–400 km/h during operation, and the maximum vertical acceleration of the train in this section is relatively smooth, the three train speeds of 200 km/h, 300 km/h and 400 km/h are selected for the analysis, and the maximum vertical acceleration of the train under these three train speeds is obtained in the time domain by using the established model of the maglev system. The time-domain images are obtained. The obtained time images are shown in Figure 18.
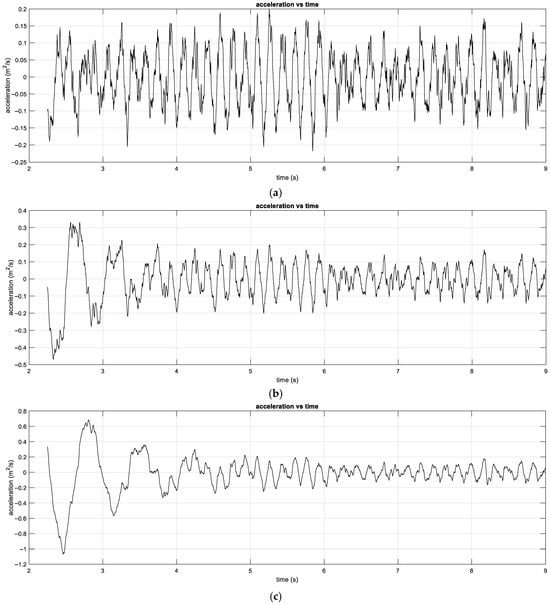
Figure 18.
Vertical acceleration response in time domain; (a): V = 200 km/h, (b): V = 300 km/h, (c): V = 400 km/h.
The time-domain vibration amplitude of the vertical acceleration is stable with no obvious sudden change or violent vibration at the three train operating speeds. This reflects that the levitation control of the maglev system is effective over a wide range of speeds, and the dynamic response in the vertical direction is smooth. The fluctuation of the acceleration amplitude near 0 indicates that the average acceleration in the vertical direction is close to the gravitational acceleration (static equilibrium), and the dynamic vibration component is very small, so the system has good levitation stability, which indicates that the system can suppress high-frequency disturbances.
5. Conclusions
This paper investigates the impact of random guideway irregularity on the dynamic performance of maglev trains. The dynamic performance of the system was studied based on the established maglev train–guideway coupling model, with the aim of determining the effects of different speeds and irregularity wavelengths. The field measurement data of guideway irregularity from the Shanghai maglev commercial line were introduced into the study. The Monte Carlo method was employed to generate a substantial number of random irregularity samples, which were then integrated into the system model to conduct a random dynamic analysis. The random effects of irregularity were then quantified. The primary conclusions that can be drawn from this analysis are as follows:
The maglev system exhibits resonance critical conditions, defined as the point at which the ratio of train speed to irregularity wavelength approaches the natural frequency of the train body (1.4 Hz). At this juncture, significant resonance is triggered, resulting in a substantial increase in vertical acceleration. The resonance speed resulting from the interaction between guideway periodicity and train body natural frequency is 127.34 km/h.
The maximum vertical acceleration of the train body remains relatively stable within the 200–400 km/h range but significantly increases at higher speeds (exceeding 400 km/h). In the presence of irregularity, the dispersion of the acceleration response increases with the speed of the train. For instance, at a speed of 600 km/h, the standard deviation of the maximum vertical acceleration is 2.7 times that at 200 km/h, and the width of the 95% confidence interval expands by nearly three times. It has been demonstrated that, at all test speeds, maximum vertical acceleration under conditions of irregularity is consistently higher than that under conditions without irregularity, within the corresponding confidence interval.
It has been determined that, at operating speeds between 200 and 600 km/h with random irregularity, the maximum vertical acceleration of the train is less than 0.6 m/s2. This validates the effectiveness of the suspension system on the Shanghai Maglev Line.
Author Contributions
Conceptualization, T.Q. and D.K.; methodology, T.Q., D.K. and Y.S.; software, D.K.; validation, T.Q.; formal analysis, T.Q.; investigation, T.Q. and D.K.; resources, L.P. and C.Z.; data curation, T.Q.; writing—original draft preparation, T.Q.; writing—review and editing, T.Q. and Y.S.; visualization, T.Q. and D.K.; supervision, Y.S.; project administration, T.Q.; funding acquisition, Y.S. All authors have read and agreed to the published version of the manuscript.
Funding
This research was funded by the Scientific Research Project of China Academy of Railway Sciences Group Co., Ltd. (2023YJ269); the National Natural Science Foundation of China (52477129, 52441203); the Scientific Research Project of China State Railway Group Co., Ltd. (L2023G006); the Key Research and Development Program of Shaanxi Province (2024GX-YBXM-004); and the Fundamental Research Funds for the Central Universities (2682024CX001).
Data Availability Statement
The raw data supporting the research of this article will be made available by the author (T.Q. and D.K.) on request.
Conflicts of Interest
Author Cheng Zhang was employed by the company China R AILWAY FIRST Survey and Design Institute Group Co., Ltd. The remaining authors declare that the research was conducted in the absence of any commercial or financial relationships that could be construed as a potential conflict of interest.
References
- Lee, H.-W.; Kim, K.-C.; Lee, J. Review of maglev train technologies. IEEE Trans. Magn. 2006, 42, 1917–1925. [Google Scholar] [CrossRef]
- Yavuz, M.N.; Öztürk, Z. Comparison of conventional high speed railway, maglev and hyperloop transportation systems. Int. Adv. Res. Eng. J. 2021, 5, 113–122. [Google Scholar] [CrossRef]
- Wang, W.; Wang, B.; Deng, G.; Ma, L. Research on control parameters of high—Speed maglev train under stochastic track irregularities. Probabilistic Eng. Mech. 2024, 77, 103664. [Google Scholar] [CrossRef]
- Shi, J.; Wei, Q.; Zhao, Y. Analysis of dynamic response of the high-speed EMS maglev vehicle/guideway coupling system with random irregularity. Int. J. Veh. Mech. Mobil. 2007, 45, 1077–1095. [Google Scholar] [CrossRef]
- Liu, Y.; Deng, W.; Gong, P. Dynamics of the bogie of maglev train with distributed magnetic forces. Shock. Vib. 2015, 2015, 896410. [Google Scholar] [CrossRef][Green Version]
- Cai, Y.; Chen, S.S.; Rote, D.M.; Coffey, H.T. Vehicle/guideway interaction for high—Speed vehicles on a flexible guideway. J. Sound Vib. 1994, 175, 625–646. [Google Scholar] [CrossRef]
- Lee, J.-S.; Kwon, S.-D.; Kim, M.-Y.; Yeo, I.H. A parametric study on the dynamics of urban transit maglev vehicle running on flexible guideway bridges. J. Sound Vib. 2009, 328, 301–317. [Google Scholar] [CrossRef]
- Kong, E.; Song, J.S.; Kang, B.B.; Na, S. Dynamic response and robust control of coupled maglev vehicle and guideway system. J. Sound Vib. 2011, 330, 6237–6253. [Google Scholar] [CrossRef]
- Cui, Y.; Guo, X.; Mao, H.; Liu, J. Research on the Dynamic Characteristics of a Typical Medium–Low-Speed Maglev Train–Bridge System Influenced by the Transverse Stiffness of Pier Tops. Appl. Sci. 2025, 15, 6628. [Google Scholar] [CrossRef]
- Kang, X.; Zhang, Z.; Zhang, Z.; Bi, X.; Zhu, B.; Liu, Y. Analysis of Coupled Vibrations in Low-Medium Speed High-Temperature Superconducting Maglev Train and Curved Bridge. KSCE J. Civ. Eng. 2025, 100344. [Google Scholar] [CrossRef]
- Wang, W.; Wang, B.; Ma, L.; Deng, G.; Xue, S. Transverse vibration of high-speed maglev train under dual stochastic excitations of crosswinds and maglev track irregularities. J. Wind. Eng. Ind. Aerodyn. 2025, 261, 106094. [Google Scholar] [CrossRef]
- Kim, K.-J.; Han, J.-B.; Han, H.-S.; Yang, S.-J. Coupled vibration analysis of Maglev vehicle guideway while standing still or moving at low speeds. Veh. Syst. Dyn. 2015, 53, 587–601. [Google Scholar] [CrossRef]
- Han, J.-B.; Han, H.-S.; Kim, S.-S.; Yang, S.-J.; Kim, K.-J. Design and validation of a slender guideway for Maglev vehicle by simulation and experiment. Veh. Syst. Dyn. 2016, 54, 370–385. [Google Scholar] [CrossRef]
- Song, Y.; Wang, Z.; Liu, Z.; Wang, R. A spatial coupling model to study dynamic performance of pantograph-catenary with vehicle-track excitation. Mech. Syst. Signal Process. 2021, 151, 107336. [Google Scholar] [CrossRef]
- Zhang, L.; Huang, J.Y. Dynamic interaction analysis of the high-speed maglev vehicle/guideway system based on a feld measurement and model updating method. Eng. Struct. 2019, 180, 1–17. [Google Scholar] [CrossRef]
- Zangeneh, A.; Museros, P.; Pacoste, C.; Karoumi, R. Free vibration of viscoelastically supported beam bridges under moving loads: Closed-form formula for maximum resonant response. Eng. Struct. 2021, 244, 112759. [Google Scholar] [CrossRef]
- Dai, J.; Abrahamsen, B.C.; Viuf, T.; Leira, B.J. Effect of wave-current interaction on a long ford-crossing floating pontoon bridge. Eng. Struct. 2022, 266, 114549. [Google Scholar] [CrossRef]
- Xia, G.Y.; Shu, W.Y.; Stanciulescu, I. Analytical and numerical studies on the slope inertia-based Timoshenko beam. J. Sound Vib. 2020, 473, 115227. [Google Scholar] [CrossRef]
- Dai, J.; Ang, K.K. Steady-state response of a curved beam on a viscously damped foundation subjected to a sequence of moving loads. Proc. Inst. Mech. Eng. Part. F J. Rail Rapid Transit. 2015, 229, 375–394. [Google Scholar] [CrossRef]
- Koh, C.G.; Ong, J.S.T.; Chua, D.K.H.; Feng, J. Moving element method for train-track dynamics. Int. J. Numer. Methods Eng. 2003, 56, 1549–1567. [Google Scholar] [CrossRef]
- Dimitrovová, Z. Two-layer model of the railway track: Analysis of the critical velocity and instability of two moving proximate masses. Int. J. Mech. Sci. 2022, 217, 107042. [Google Scholar] [CrossRef]
- Li, X.; Geng, J.; Wang, D. Dynamic responses of low medium speed maglev train-simply supported beam interaction system. Urban Rail Transit 2017, 3, 136–141. [Google Scholar] [CrossRef]
- Luong, V.H.; Cao, T.N.T.; Reddy, J.N.; Ang, K.K.; Tran, M.T.; Dai, J. Static and dynamic analyses of Mindlin plates resting on viscoelastic foundation by using moving element method. Int. J. Struct. Stab. Dyn. 2018, 18, 1850131. [Google Scholar] [CrossRef]
- Dai, J.; Ang, K.K.; Tran, M.T.; Luong, V.H.; Jiang, D. Moving element analysis of discretely supported high-speed rail systems. J. Rail Rapid Transit 2018, 232, 783–797. [Google Scholar] [CrossRef]
- Dai, J.; Han, M.; Ang, K.K. Moving element analysis of partially filled freight trains subject to abrupt braking. Int. J. Mech. Sci. 2019, 151, 85–94. [Google Scholar] [CrossRef]
- Hu, W.; Xu, M.; Zhang, F.; Xiao, C.; Deng, Z. Dynamic analysis of flexible hub-beam with step-variable cross-section. Mech. Syst. Signal Process. 2022, 180, 109423. [Google Scholar] [CrossRef]
- Huai, Y.; Hu, W.; Song, W.; Zheng, Y.; Deng, Z. Magnetic-field-responsive property of Fe3O4/polyaniline solvent-free nanofluid. Phys. Fluids 2023, 35, 01200125. [Google Scholar] [CrossRef]
- Dai, J.; Lim, J.G.Y.; Ang, K.K. Dynamic Response Analysis of High-Speed Maglev-Guideway System. J. Vib. Eng. Technol. 2023, 11, 2647–2658. [Google Scholar] [CrossRef]
- Ha, H.; Park, J.; Park, K.S. Advanced numerical analysis for vibration characteristics and ride comfort of ultra-high-speed maglev train. Microsyst. Technol. 2020, 26, 183–193. [Google Scholar] [CrossRef]
- Shi, J.; Fang, W.-S.; Wang, Y.-J.; Zhao, Y. Measurements and analysis of track irregularities on high speed Maglev lines. J. Zhejiang Univ. A 2014, 15, 385–394. [Google Scholar] [CrossRef]
- Wang, X.; Song, Y.; Yang, H.; Wang, H.; Lu, B.; Liu, Z. A time-frequency dual-domain deep learning approach for high-speed pantograph–catenary dynamic performance prediction. Mech. Syst. Signal Process. 2025, 238, 113258. [Google Scholar] [CrossRef]
- Tian, X.-F.; Xiang, H.-Y.; Chen, X.-L.; Li, Y.-L. Dynamic response analysis of high-speed maglev train–guideway system under crosswinds. J. Cent. South Univ. 2023, 30, 2261–2275. [Google Scholar] [CrossRef]
- Li, Z.; Wang, X.; Ding, Y.; Wang, J.; Liu, P.; Deng, Z. Study on the Dynamics Characteristics of HTS Maglev Train Considering the Aerodynamic Loads under Crosswinds. Sustainability 2023, 15, 16511. [Google Scholar] [CrossRef]
- Yan, Y.F.; Zhao, Y.H.; Zhang, Y.Z.; Wang, M.Q. Aerodynamic Performance of High-Speed Maglev Trains Under Crosswind Conditions: A Computational Simulation Study. J. Innov. Infrastruct. 2023, 1, 241–251. [Google Scholar] [CrossRef]
- Huang, Z.-D.; Kong, W.-K.; Wang, S.-M.; Zhou, Z.-B.; Ni, Y.-Q.; Chang, N. Dynamic and Stability Analysis of High-Speed Maglev Train–Guideway Coupled System under Crosswind. J. Sound Vib. 2025, 609, 119092. [Google Scholar] [CrossRef]
- Huang, J.Y.; Zhang, L. Dynamic simulation and analysis of a high-speed maglev train/guideway interaction system. In Advances in Environmental Vibration and Transportation Geodynamics; Lecture Notes in Civil Engineering; Tutumluer, E., Chen, X., Xiao, Y., Eds.; Springer: Berlin/Heidelberg, Germany, 2020; Volume 66, pp. 505–526. [Google Scholar]
- Dimitrovová, Z. Tailoring a Three-Layer Track Model to Delay Instability and Minimize Critical Velocity Effects at Very High Velocities. Infrastructures 2025, 10, 200. [Google Scholar] [CrossRef]
- Anand, R.; Tripathi, S.; De Oliveira, C.C.; Malla, R.B. Field-Test-Driven Sensitivity Analysis and Model Updating of Aging Railroad Bridge Structures Using Genetic Algorithm Optimization Approach. Infrastructures 2025, 10, 195. [Google Scholar] [CrossRef]
- Shi, J.; Wang, Y.-J. Dynamic response analysis of single span guideway caused by high speed maglev train. Lat. Am. J. Solids Struct. 2011, 8, 213–228. [Google Scholar] [CrossRef]
- Saadat, S.; Sherrock, E.; Zahaczewski, J. Autonomous Track Geometry Measurement Technology Design, Development, and Testing; Federal Railroad Administration, Office of Research, Development, and Technology: Washington, DC, USA, 2018.
- Wang, W.; Song, Y.; Xu, J.; Xu, Z.; Liu, Z. Track Irregularity Prediction and Effect on the Dynamic Response of the 600 km/h Maglev System. IEEE Trans. Veh. Technol. 2025. [Google Scholar] [CrossRef]
- Loprencipe, G.; Zoccali, P. Use of generated artificial road profiles in road roughness evaluation. J. Mod. Transport. 2017, 25, 24–33. [Google Scholar] [CrossRef]
- Song, Y.; Liu, Z.G.; Rønnquist, A.; Navik, P.; Liu, Z.D. Contact Wire Irregularity Stochastics and Effect on High-Speed Railway Pantograph–Catenary Interactions. IEEE Trans. Instrum. Meas. 2020, 69, 8196–8206. [Google Scholar] [CrossRef]
- Eisenbahn-Bundesamt. Magnetschnellbahn Ausführungsgrundlage: Fahrzeug Teil II; Eisenbahn-Bundesamt: Bonn, Germany, 2007. [Google Scholar]
Disclaimer/Publisher’s Note: The statements, opinions and data contained in all publications are solely those of the individual author(s) and contributor(s) and not of MDPI and/or the editor(s). MDPI and/or the editor(s) disclaim responsibility for any injury to people or property resulting from any ideas, methods, instructions or products referred to in the content. |
© 2025 by the authors. Licensee MDPI, Basel, Switzerland. This article is an open access article distributed under the terms and conditions of the Creative Commons Attribution (CC BY) license (https://creativecommons.org/licenses/by/4.0/).