Abstract
This paper presents a novel methodology for the optimal sizing of solar photovoltaic (PV) systems in distribution networks by determining the monthly optimum tilt and azimuth angles to maximize solar energy capture. Using one year of solar irradiation data, the Grey Wolf Optimizer (GWO) is employed to optimize the tilt and azimuth angles with the objective of maximizing monthly solar insolation. Unlike existing approaches that assume fixed azimuth angles, the proposed method calculates both tilt and azimuth angles for each month, allowing for a more precise alignment with solar trajectories. The optimized orientation parameters are subsequently utilized to determine the optimal number and placement of PV panels, as well as the optimal location and sizing of shunt capacitor (SC) banks, for the IEEE 69-bus distribution system. This optimization is performed under peak load conditions using the GWO, with the objectives of minimizing active power losses, enhancing voltage profile stability, and maximizing PV system penetration. The long-term impact of this approach is assessed through a 20-year energy and economic savings analysis, demonstrating substantial improvements in energy efficiency and cost-effectiveness.
1. Introduction
With the growing frequency and severity of extreme weather events, solar PV installations are being deployed at an accelerated rate to enhance the resilience and sustainability of power systems. In the United States, events such as Winter Storm Uri [1], which left over 4.5 million customers without power in Texas, and Hurricane Ida [2], which caused widespread outages across the Gulf Coast, have highlighted the vulnerability of centralized generation and underscored the critical role of distributed energy resources (DERs) in maintaining grid reliability. As the levelized cost of solar energy continues to decline, the capital cost of PV installations remains substantial, necessitating design optimization to maximize energy yield and economic return [3]. Among the key design parameters, the tilt angle plays a pivotal role in determining the amount of solar radiation captured. Several studies have demonstrated that improper tilt angle selection can result in annual energy losses ranging from 5% to 20%, depending on geographic location and climatic conditions [4,5,6]. The design of a PV system requires careful consideration of both system capacity and panel positioning to maximize energy production. Proper PV sizing ensures that the system can meet the energy demand without incurring unnecessary costs from oversizing [7]. Optimizing both the tilt angle and the system size has been shown to significantly improve the energy output and cost-effectiveness of PV systems, particularly for utility-scale applications and rooftop installations with constrained space. This makes both proper sizing and tilt angle optimization vital for efficient PV system design. In this context, this paper proposes an innovative methodology to determine the optimum tilt and azimuth angles of PV panels for both large-scale and distributed solar systems by employing GWO.
The tilt angle (the angle between the panel and the horizontal plane) influences how directly sunlight strikes the panel. If the tilt is too flat or too steep relative to the sun’s path, the panel will receive less solar irradiance, especially in early morning/late evening or winter/summer months. Many studies have shown that there is an optimum tilt angle (OTA) for a given location and time that maximizes solar energy capture [8]. Typically, the optimal fixed tilt for year-round installation in the Northern Hemisphere is close to the local latitude. A common rule of thumb is that the best annual tilt is approximately equal to the latitude of the site (with minor adjustments). Numerous studies have found that the OTA is within a few degrees of the latitude. For example, in Adrar (27.87° N), the optimal fixed tilt was found to be ~28°, essentially the same as the latitude [6]. However, the sun’s elevation changes over seasons, so a single fixed tilt is a compromise. During summer, a lower tilt (flatter panel) captures more direct overhead sun, whereas in winter, a steeper tilt captures the low-angle sun [8]. Therefore, monthly adjustment of the tilt angle can substantially increase the energy yield compared to a fixed annual tilt.
Adjusting the PV tilt periodically (e.g., monthly) allows the panels to more directly face the sun each month, maximizing incident radiation throughout the year. This approach is an effective compromise between a static system and an expensive solar tracking system. Numerous studies have quantified the gains from such adjustments. Khahro et al. [9] observed that setting the tilt monthly instead of yearly can save about 8% more energy over the year. Despotović and Nedić [10] performed a case study in Serbia and found that using monthly optimum tilt angles yields ~15.4% more annual energy than the building’s current roof tilt, whereas using a single yearly optimum tilt yields about 6% more. In [11], monthly and annual optimum tilt angles for Saudi Arabia were determined through MATLAB-based simulations that incorporated ambient temperature effects, concluding that monthly adjustments yield improved power output. These results illustrate that most of the potential gain is captured with just a few adjustments per year. Experiments conducted in Pakistan showed that monthly tilt adjustment increased output by up to 8% compared to even an eight times per year adjustment, indicating diminishing returns for very high adjustment frequency [9]. Božiková et al. [12] conducted experimental validation in Slovakia, revealing the seasonal significance of both tilt and azimuth adjustments. Ahmad and Tiwari [13] showed that annual optimum tilt generally approximates the location’s latitude, and Jin et al. [14] demonstrated that winter tilt angles in high-altitude regions exceed annual values due to variations in solar radiation characteristics. Several studies conclude that adjusting the tilt at least seasonally or monthly provides significant energy benefits, whereas adjusting more frequently (e.g., daily) yields only marginal gains relative to the effort.
Research in the past decade has produced a variety of methods to compute the optimal tilt angle for solar PV modules. These methods range from classical analytical calculations to modern artificial intelligence techniques. Hafez et al. [5] surveyed a wide range of methodologies, including isotropic and anisotropic models as well as artificial intelligence techniques such as neural networks and Genetic Algorithms. One straightforward approach to finding the optimum tilt angle is based on analytical models of solar geometry and radiation. In such methods, one uses mathematical formulas to calculate the solar radiation on a tilted surface as a function of the tilt angle, then finds the angle that maximizes this value (either for each month or for the year). This often requires integrating components of direct and diffuse solar irradiation over time. The authors in reference [10] demonstrated this approach by computing daily, monthly, seasonal, and annual optimal tilts for a location in Belgrade (44.8° N). They reported that adjusting the tilt monthly would yield about 15.42% more annual energy compared to the building’s current roof angle, whereas an optimal fixed tilt yields 5.98% more. A generalized methodology for determining optimum tilt angles using isotropic and anisotropic diffuse radiation models was proposed in [15], with model accuracy validated using R2, RMSE, and MAE metrics for various Ethiopian locations. A comparative evaluation of solar irradiance estimation models and optimum tilt angle detection methods was conducted in [16], where the author examined both direct and search-based techniques for estimating beam and diffuse components of solar radiation. In general, analytical studies confirm that the optimal tilt is highest in winter months and lowest in summer months, with differences on the order of 30–40° between winter and summer in mid-latitude locations [8].
Many studies use historical solar irradiance data (measured or from databases) to empirically determine the tilt angle that maximizes collected energy. For instance, Kaddoura et al. [17] analyzed solar radiation data for various cities in Saudi Arabia and derived the optimal tilt for each location, which closely tracked the latitude in each case. Nfaoui et al. performed a similar analysis for Morocco, finding latitude-dependent optimal angles for different cities (e.g., ~32° for Tangier in the north) [18]. Smith et al. [19] introduced a radiative transfer method leveraging satellite data (MODIS) and the DISORT code, enabling global applicability and future climate scenario predictions. This approach, validated against pyranometer data, demonstrated high accuracy but noted limitations in mountainous regions due to spatial resolution constraints. Chen et al. [20] proposed a generalized technique based on the ASHRAE clear-sky and Perez models, which effectively captured the roles of latitude and diffuse radiation, although its reliability diminished in short-term applications. Another empirical strategy is to adjust the tilt experimentally and record energy yields. For example, Abdelaal et al. [6] conducted an experiment with panels set at 28°, 30°, and 50° tilts over 181 days. They found that the 28° tilt consistently outperformed the others, yielding about 4.5% more energy than the 30° tilt and 59.3% more than the 50° tilt over the test period. This confirmed that even a few degrees of deviation from the optimum (28° vs. 30°) can cause a noticeable drop (~4–5%) in energy output, while a suboptimal tilt (50° in that location) can result in a loss of well over half the potential energy. Such empirical insights underscore why finding the correct tilt angle is critical. The consensus from numerous analytical/empirical studies worldwide is that the optimal tilt for maximizing annual energy is usually very close to the latitude angle (often within ±1–3°).
Recent efforts have focused on enhancing regional adaptability and leveraging computational tools. Alam et al. [21] applied a finite difference technique tailored to Indian climates, resulting in improved energy yields compared to prior methods. Soulayman and Hammoud [22] proposed a general algorithm suitable for mid-latitude applications with multiple adjustment intervals. Jamil et al. [23] confirmed the latitude–tilt correlation in humid subtropical India and reported measurable energy gains from seasonal calibration. Yadav et al. [24] addressed the challenges of mountainous topography by developing polynomial regression models, while Quinn and Lehman [25] used the clearness index to incorporate cloud cover effects, showing that optimal tilt angles may fall below latitude in overcast conditions. Sharma et al. [26] implemented real-time data acquisition to support quarterly angle adjustments, demonstrating improved energy efficiency and emission reductions. Together, these studies emphasize the importance of adaptive, site-specific tilt optimization strategies for maximizing the performance of solar energy systems. It is worth noting that a variety of software tools and databases are available to assist with analytical tilt optimization. Tools like NREL’s PVWatts or PVGIS allow users to simulate energy output at different tilt angles using long-term climate data.
In recent years, metaheuristic algorithms (inspired by natural processes or heuristics) have become popular for solving engineering optimization problems, including finding the optimal tilt angle of PV panels. These algorithms are attractive because they do not require a linear or differentiable model of the problem. They only need an objective function to evaluate (e.g., the annual or monthly energy output for a given tilt configuration) and can intelligently search for the maximum. This is useful if the optimization problem is complex or has many variables (for instance, simultaneously optimizing tilt and azimuth angles or optimizing tilt under constraints like building geometry or shared space). For example, the authors in reference [27] applied nonlinear GA-based optimization to find monthly tilt angles in Taiwan, reporting substantial energy gains with GA over a fixed tilt. PSO was employed to determine the monthly optimal tilt in Brunei, finding angles from 34.7° in December to −26.7° in September (negative indicating an orientation change, since it is near the equator) [28]. By adjusting the tilt each month as per PSO, a 5.94% increase in annual yield was achieved compared to a horizontal panel. Reference [29] utilized Particle Swarm Optimization (PSO) to identify optimal tilt angles for PV modules installed on pitched rooftops in equatorial regions, considering latitude and azimuth orientation, and highlighted the need for regional customization in installation guidelines. A novel bi-layer optimization algorithm was introduced in [30], enabling dynamic adjustment of tilt angles for short-term or multi-period operation. The vortex search algorithm was applied in [31] to estimate solar radiation on tilted PV surfaces and derive optimum tilt angles in Dhahran, Saudi Arabia. The proposed optimization technique effectively increased the solar radiation collected compared to horizontal configurations. While one could simply calculate the annual irradiation for each possible tilt, metaheuristics become more advantageous when the problem is combinatorial and not trivial to solve by brute force. By using a metaheuristic approach, one could determine the optimum tilt for a given time interval and optimal schedule of tilt adjustments that maximize energy capture while minimizing the frequency of adjustments [32,33]. These advanced optimization formulations demonstrate the versatility of metaheuristic algorithms. They are capable of handling multiple variables, such as monthly tilt angles or combined tilt and azimuth configurations, as well as various constraints, including limits on the number of adjustments or the requirement to maximize winter output while maintaining a minimum summer yield. Furthermore, metaheuristics can readily accommodate real-world complexities. For example, they allow for the inclusion of dust accumulation or partial shading effects in the objective function, even when such additions result in a non-analytical formulation.
With the advancement of machine learning techniques, several researchers have employed artificial intelligence models to estimate either solar radiation or the optimal tilt angle of PV panels. Several studies, including that of Mehleri et al. [34], demonstrated the benefits of periodic tilt adjustments using statistical models and neural networks. One common methodology involves the use of artificial neural networks (ANNs) to directly predict the optimal tilt angle based on input variables such as the day of the year, geographic latitude, and meteorological data. In reference [35], an ANN-based model was developed to estimate the optimum tilt angle across various regions of Turkey. By training the model on historical solar irradiance data, the network was able to determine the tilt angle that maximizes insolation for a specific location and time. A related study presented in reference [36] utilized ANNs to predict the solar radiation received at different tilt angles and subsequently inferred the most favorable angle based on these predictions. These data-driven methods are particularly valuable in scenarios where analytical modeling is challenging, such as in regions with complex microclimates or when accounting for site-specific factors like partial shading. In some cases, machine learning techniques have been integrated with optimization algorithms to enhance the estimation process. For example, logistic regression has been combined with a multi-layer perceptron model to estimate optimal tilt angles more efficiently, thereby accelerating the convergence of the optimization procedure, as discussed in reference [37]. Although machine learning is more frequently applied to other PV applications, such as energy forecasting or fault detection, its potential in tilt angle optimization has been demonstrated. It provides a promising avenue for capturing nonlinear dependencies and environmental variations that are often overlooked by purely geometrical models or heuristic rules.
The azimuth angle of a solar PV panel describes its horizontal orientation relative to a reference direction (usually true north or south). It is a crucial parameter alongside tilt angle, as it determines which part of the sky the panel faces and thus which portions of the sun’s path it can capture. Maximizing solar irradiance collection requires installing PV panels at appropriate tilt and azimuth angles for the site [4]. In general, for maximum annual energy, PV modules should face the equator (i.e., due south in the Northern Hemisphere, or due north in the Southern Hemisphere) [38]. Orienting toward the equator maximizes total incident solar radiation over the year, whereas facing east or west shifts generation toward morning or afternoon, respectively [39]. The impact of azimuth is especially pronounced at higher latitudes, where the sun’s path is skewed toward one side of the sky; at lower latitudes (tropical regions), the sun’s daily path is more symmetric, making orientation less critical [40]. Beyond pure energy capture, the azimuth angle influences the timing of PV power production. A south-facing array tends to produce a peak around midday, whereas an array facing southwest will produce slightly less total energy but more of it in the late afternoon. Overall, selecting the optimal azimuth is a trade-off between maximizing total insolation and meeting specific energy use or grid objectives.
Researchers have employed a variety of methodologies to determine the optimal azimuth angle for PV installations. These methodologies include analytical derivations, empirical simulations, and advanced optimization techniques. For instance, researchers have calculated the global irradiance on a panel for azimuth angles spanning the full range (east to west) in fine increments, for specific locations or multiple cities [41,42]. In reference [42], the authors evaluated energy from 3600+ actual PV systems in Yorkshire, UK, finding an optimal orientation around 39° tilt and −1° (slightly west of due south) azimuth for that region. Simulation-based methods can also consider economic metrics (revenue, Levelized Cost of Energy) instead of just energy, for example, optimizing azimuth for revenue given time-of-use electricity prices [43]. With increasing computational power, metaheuristic algorithms (inspired by natural processes) have been employed to find optimal tilt and azimuth settings. A notable example is Guo et al. [4], who used the harmony search (HS) algorithm to determine monthly optimal tilt and azimuth in various Chinese climates. The HS optimization confirmed that the best azimuth is usually due south for the tested cities.
The optimal sizing of a PV system involves determining the array capacity that best satisfies performance, economic, or reliability objectives within given constraints. This task requires balancing energy production with cost: larger systems generate more energy and enhance reliability, especially in off-grid scenarios, but incur higher capital costs, while smaller systems are more economical but may underperform. In off-grid applications, sizing often aims to minimize lifecycle cost while ensuring high supply reliability, typically quantified using Loss of Load Probability (LLP). Common targets include meeting 99% of demand by jointly optimizing PV array and battery capacities. For grid-connected systems, the objective may be to maximize financial metrics such as net present value or minimize payback period, considering constraints like available roof area, electricity tariffs, and net metering policies. At the utility scale, optimal sizing is influenced by land use and interconnection limits, with energy yield or profit maximization as typical goals. Across all configurations, PV sizing represents a nonlinear optimization problem involving discrete variables and multiple constraints. Early methods relied on heuristic approaches or simple rule of thumb calculations, such as sizing based on average daily load with seasonal adjustments. Tools like HOMER Grid allow simulation-based analysis of various system configurations. In recent years, however, there has been a growing emphasis on advanced optimization techniques, including linear programming, evolutionary algorithms, and metaheuristics, which offer greater precision and flexibility in identifying optimal sizes under complex and site-specific conditions.
Metaheuristic algorithms have been extensively applied to PV system sizing problems due to their ability to effectively handle multi-objective, nonlinear, and constrained optimization scenarios. In reference [7], the GWO was used to size a stand-alone PV-battery system with the objective of minimizing system cost while maintaining a Loss of Power Supply Probability (LPSP) below a predefined threshold. The study demonstrated that GWO could achieve a superior cost-reliability trade-off compared to conventional methods. Similarly, reference [44] presented a comparative analysis of Particle Swarm Optimization (PSO) and Genetic Algorithms (GAs) for grid-connected PV systems in Tunisia, where PSO outperformed GAs in terms of convergence speed and optimality of economic performance metrics such as net present value. Hybrid optimization approaches have also been investigated. In one study, a combined GA-PSO algorithm was applied to the sizing of an off-grid PV/wind/biomass hybrid system, utilizing the global search capability of Genetic Algorithms along with the fast convergence characteristics of Particle Swarm Optimization [45]. Hybrid metaheuristics offer enhanced performance but at the cost of greater implementation complexity. Other metaheuristics such as Simulated Annealing, Bacterial Foraging, Cuckoo Search, and Whale Optimization have also been utilized in hybrid PV–wind sizing studies, often outperforming deterministic or rule-based methods in terms of system cost or reliability. While deterministic methods such as mixed-integer linear programming (MILP) are effective when the problem can be formulated with linear relationships and constraints, most real-world PV sizing problems are inherently nonlinear and are more appropriately addressed using metaheuristic approaches.
Although numerous studies have investigated the determination of optimal tilt and azimuth angles for photovoltaic (PV) systems, relatively few have employed metaheuristic algorithms to simultaneously optimize both parameters. Moreover, most existing frameworks focus on fixed or seasonally averaged values and do not account for variations in solar irradiance at the specific time of peak system load. These approaches typically overlook the mismatch between energy demand and solar availability, resulting in suboptimal system sizing. Additionally, prior studies rarely evaluate the economic impact of PV system sizing based on dynamically optimized monthly orientation. In contrast, the present work introduces a comprehensive optimization framework that addresses these limitations in a fundamentally new way. The major contributions of the proposed work are summarized as follows.
- First, the optimal tilt and azimuth angles are determined for each month using one year of solar insolation data, which includes Global Horizontal Irradiance (GHI) and Diffuse Horizontal Irradiance (DHI). The GWO algorithm is applied with the objective of maximizing incident solar irradiance, thereby ensuring improved energy capture through monthly orientation adjustment.
- Second, the optimum number and placement of PV panels, along with the optimal location and rating of SCs, are determined for the IEEE 69-bus distribution system. A key innovation in this work lies in the sizing of the PV system using solar irradiance data that corresponds to the time of peak load. This approach ensures that the PV system is appropriately sized to meet a specified portion of the peak demand under actual solar availability conditions, rather than relying on generalized or average irradiance profiles. Optimization is performed using the GWO algorithm with the objectives of maximizing PV penetration, minimizing active power losses, and enhancing voltage profiles. The load data used in this analysis is obtained from the Pacific Gas and Electric (PG&E) database for a full year.
- Finally, the proposed framework evaluates the long-term performance of the system by computing the annual energy savings and associated economic benefits resulting from the integration of PV systems and SCs configured at the monthly optimal tilt and azimuth angles. This analysis highlights the technical and economic viability of the proposed PV integration strategy based on monthly orientation adjustments within distribution networks.
2. Materials and Methods
2.1. Mathematical Modeling of Solar Radiation and Photovoltaic Systems
This section presents the mathematical formulations used to estimate the different components of solar radiation, including direct beam, diffuse, and reflected radiation, as they are incident upon the inclined surface of PV panels. The total insolation received by the panel is then incorporated into a PV output power model that accounts for environmental and system specific factors such as temperature variations and power losses. These models form the basis of the optimization framework developed in this study by establishing the relationship between solar input and the key design parameters of the PV system.
2.1.1. Solar Collector Insolation
The total solar radiation incident on a solar panel comprises three components: direct beam radiation, which travels in a straight line from the sun through the atmosphere to the panel; diffuse radiation, which results from sunlight scattered by atmospheric molecules and aerosols; and reflected radiation, which is sunlight reflected off the ground or surrounding surfaces onto the panel.
2.1.2. Solar Beam Radiation
Solar direct beam radiation can be obtained by using the following equation:
where β is the altitude angle and θ is the incidence angle between the solar panel and the beam.
is the solar azimuth angle, is the collector azimuth angle, is the panel tilt angle, and H is the hour angle. The solar declination angle is represented by and LT is the latitude angle. These angles are illustrated in Figure 1.
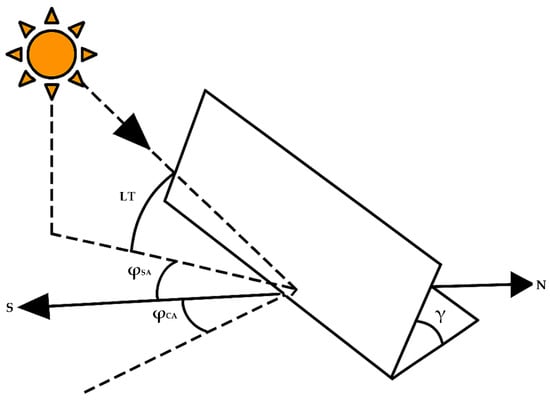
Figure 1.
Illustration of tilt and azimuth angles.
2.1.3. Diffusion Radiation
Solar radiation that reaches the ground, scattered from the particles of the atmosphere and clouds, is called diffusion radiation. The diffusion radiation collected by the solar PV panel can be modeled as a function of horizontal diffusion radiation and the cosine of the solar tilt angle.
2.1.4. Reflected Radiation
The radiation collected by the collector from the reflection of surfaces in front of the panel is known as reflected radiation.
The total radiation incident on the solar panel is given by the following equation:
2.1.5. Power Generated by Solar Photovoltaic System
The power generation capacity of the PV panel is modeled considering the efficiency of the panel, which depends on the insolation collected by the PV panel and is expressed by the following equation.
where is the number of PV panels, PVR is the rating of the PV panel at STC conditions, LC is the loss coefficient of the panel, and is the insolation collected by the PV panel. The PV panel loss coefficient mainly depends on the shading effect, temperature, losses of the inverter, AC, and DC cables. In this work, LC is 0.75, is the temperature coefficient, and and are PV panel current temperature and temperature at STC conditions.
2.2. Grey Wolf Optimization (GWO) Algorithm
The GWO algorithm is formulated by emulating the social hierarchy and cooperative hunting strategies of gray wolves [46]. The algorithm models four key phases observed in the hunting process: social coordination, tracking, encircling, and ultimately attacking the prey. These phases guide the optimization mechanism. Within the population, the top three candidate solutions, referred to as alpha, beta, and delta, lead the rest of the individuals in the search space toward the target. The positions of the remaining individuals are updated iteratively based on these leaders using the following set of equations.
where and are coefficient vectors, is the position vector of the prey, and indicates the position vector of a gray wolf.
where b is a value selected between 0 and 2 using a linearly decreasing function and and are the random values between 0 and 1. The three components for = 1, 2, 3 obtained from the three best solutions are used to update the population.
The GWO was selected for this study due to its effective balance between exploration and exploitation, minimal parameter tuning, and low computational complexity [47]. Unlike Particle Swarm Optimization (PSO), which can suffer from premature convergence, or Genetic Algorithm (GA), which often requires extensive tuning and exhibits slower convergence, GWO maintains population diversity and converges reliably to global optima. Its simplicity and robustness have led to successful applications in various power engineering problems, including distributed generation and capacitor sizing. Given the multi-dimensional and nonlinear nature of the simultaneous optimization of monthly tilt and azimuth angles, PV sizing, and capacitor placement, GWO offers an efficient and practical solution for this study.
2.2.1. Optimum Estimation of Tilt and Azimuth Angles Using GWO
In the first stage of the proposed methodology, the optimal tilt and azimuth angles of the solar panels are determined. These angles are calculated on a monthly basis, from January through December, with the objective of maximizing the total monthly solar insolation received by the panels. Data for global and diffuse solar radiation were obtained from the National Renewable Energy Laboratory (NREL) database. The beam radiation is subsequently derived by subtracting the diffuse radiation from the global radiation. Using the values of beam radiation, diffuse radiation, and reflected radiation, the total solar insolation incident on the collector is estimated based on Equation (4).
The total monthly solar insolation incident on the solar panel can be described by the following mathematical expression:
In the above equation, represents the total monthly solar insolation, while NDM denotes the number of days in the month. corresponds to the solar insolation for a specific day and hour considered in the computation. The objective function for determining the optimal tilt and azimuth angles for each month from January to December is defined as the maximization of total monthly solar insolation, as represented by Equation (11). This optimization is carried out using the GWO algorithm. The flowchart presented in Figure 2 illustrates the algorithm used in the optimization process for determining the optimal tilt and azimuth angles.
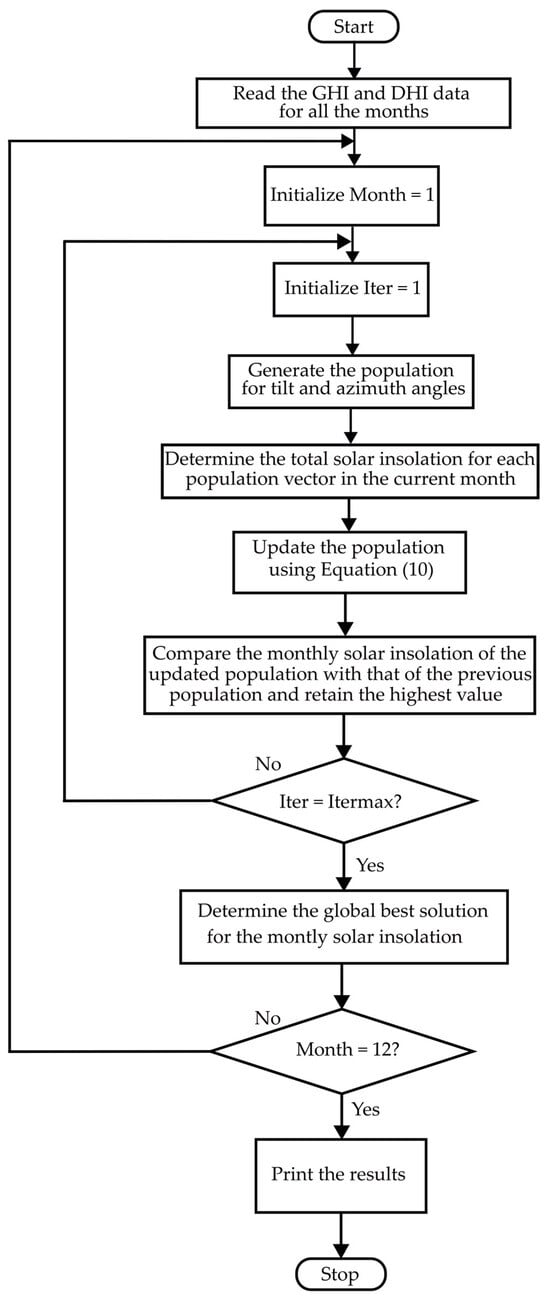
Figure 2.
Flowchart to determine optimum tilt and azimuth angles.
While daily or continuous reorientation of PV modules is impractical for most real-world installations due to cost and mechanical complexity, monthly or seasonal adjustments have been widely adopted as a practical alternative. Several experimental and simulation studies have demonstrated that adjusting the panel orientation once per month can capture most of the energy gains achievable with high-frequency tracking, while keeping operational overhead manageable [9,10,11]. The present work adopts monthly optimization as a technically feasible compromise between fixed-angle systems and expensive solar tracking setups. Furthermore, the additional maintenance effort associated with monthly adjustment was reflected in the annual operation and maintenance (O&M) cost included in the economic analysis (Section 3). It should also be noted that the orientation recommendations generated by this framework can be adapted for seasonal adjustment if mechanical constraints limit monthly reconfiguration.
2.2.2. Optimum Sizing of Solar PV Panels for Distribution Systems Using GWO Algorithm
In the second stage of the methodology, the optimal location and sizing of PVDGs and SCs are performed using the GWO technique, based on the previously determined optimal tilt and azimuth angles. A multi-objective optimization framework is developed, aiming to enhance overall system performance.
Multi-Objective Framework for PV Panel Optimum Sizing
- (i)
- Solar Power Capacity (SPC): This objective aims to ensure that the total real power injected by the solar PV distributed generation (PVDG) units is equal to a specified fraction of the total real power demand of the distribution system load.where is the real power load at the jth node of the distribution system, is the ith PVDG capacity, NL is the total load buses, and is the number of solar PV generation plants. is the fraction of total active power load chosen between 0 and 1.The value of is chosen as 30% in this study. Although higher PV penetration levels are feasible depending on available space and investment capacity, a 30% cap is adopted in this study to maintain grid stability and economic viability. Penetration beyond this level can lead to issues such as overvoltage, reverse power flow, voltage flicker, and increased power losses under light load conditions [48]. This limit is consistent with utility planning practices that aim to balance renewable integration with distribution system reliability. It also helps avoid the need for extensive infrastructure upgrades while aligning with hosting capacity constraints.
- (ii)
- Real power loss reduction factor (XPLJ): The objective of the real power loss reduction factor is to minimize the real power losses within the distribution system. This objective can be mathematically formulated as follows:where TLP is the total real power loss of the distribution system, considering the impact of DGs and SCs, and TLPB is the total real power loss without considering DGs and SCs.
- (iii)
- Voltage profile improvement factor (XVJ): This objective quantifies the extent to which the integration of PVDGs and SCs improves the voltage profile across the distribution system. Specifically, it measures the reduction in the sum of squared deviations of node voltages from the nominal value (1 pu) compared to the base case. The voltage profile improvement factor is defined by the following expression:where denotes the voltage at node k, considering the impact of DGs and SCs, represents the corresponding node voltage for the base case without the presence of DGs and SCs, and NB is the total number of nodes in the distribution system.
The sizing of PVDGs in conjunction with SCs is carried out to meet the maximum annual peak load. This is achieved by minimizing the multi-objective function formulated and presented in the above equation. The flowchart presented in Figure 3 describes the algorithm used in the optimization process to determine the optimum size and locations of PVDGs and SCs.
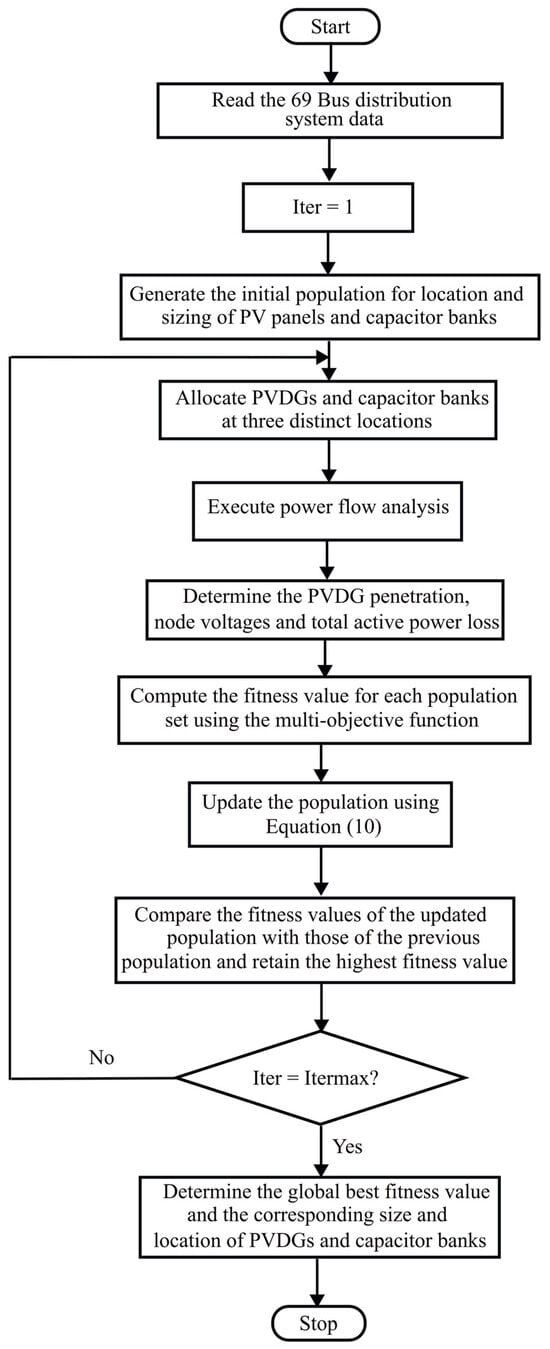
Figure 3.
Flowchart to determine optimum size and locations of PVDGs and SCs.
2.3. Assessment of Annual Economic Benefits from Solar PV Panel Installation
The annual energy savings are calculated by first determining, for each month, the difference between the substation active power output without and with solar integration at each hour from 6 a.m. to 6 p.m. and for every day in the month. These hourly differences are then summed across all days of the month for each hour, resulting in a vector of total hourly energy savings for each month. Stacking these vectors for all months yields a matrix that captures the distribution of energy savings throughout the year. Finally, the annual energy savings are obtained by summing the aggregated hourly energy savings across all operational hours (6 a.m. to 6 p.m.) and all months of the year, as shown in the following equation.
where
- is the total annual energy savings in kWh.
- m is the month index (1 to 12).
- h is the hour index (from 6 to 18, i.e., 6 a.m. to 6 p.m.).
- d is the day index in month m.
- is the number of days in month m.
- is the substation real power output without solar panels and capacitor banks.
- is the substation active power output with solar panels and capacitor banks.
The annual economic savings achieved through the integration of solar distributed generation are calculated by accounting for the varying electricity prices across different load types and time periods. Rather than employing a uniform energy rate as conducted in most of the existing literature, the methodology in this work distinguishes between residential and industrial loads and further differentiates between peak and off-peak tariff periods, thereby enhancing the accuracy of the economic assessment. The annual economic savings are computed as follows:
where denotes the aggregate energy savings (kWh) for month m and hour h, represented by the following equation:
and represent the residential and industrial load factors, respectively, and and are the corresponding electricity tariffs ($/kWh) for each load type and hour. The tariff assignment is governed by the prevailing time-of-use structure for PG&E, with off-peak rates applied for hours from 6:00 a.m. to 3:00 p.m. and peak rates for hours from 4:00 p.m. to 6:00 p.m.
The investment cost of solar PV panels and SCs is obtained using the following equation:
is the total number of PV panels and is the cost of a single solar PV panel unit. is the total reactive power capacity and is the cost of the capacitor bank per kVAr.
The annual installment AIP is the amount to be paid annually for the money borrowed by the distribution company for the installation of solar PV panels and SCs. is the capital recovery factor.
The annual installment payment (AIP) represents the yearly amount to be repaid by the distribution company for the capital invested in the installation of PV panels and SCs. This payment is calculated using the capital recovery factor determined using Equation (21) and accounts for the time value of money over the financing period.
In the above equation, Ny denotes the number of years, which is assumed to be 20 and represents the interest rate, taken as 5%.
The final annual economic savings from installing solar PV panels and SCs can be estimated from the above equation, where OMC is the annual operational and maintenance costs of solar PV panels and SCs.
3. Results and Discussions
The proposed multi-objective optimization framework presented in Figure 4 is validated using the IEEE 69 bus test system [49]. The optimization algorithm, based on GWO, is implemented in MATLAB 2024 on an Intel Core i7-13700K processor operating at 3.40 GHz with 64 GB of RAM, running on a 64-bit Windows operating system. The average simulation time per iteration, based on 20 valid runs, was approximately 3.8 s, indicating that the proposed method is computationally efficient and suitable for large-scale or real-time distribution system applications. As presented in Figure 4, the initial stage of the methodology focuses on determining the optimal tilt and azimuth angles of solar panels using the GWO algorithm. Subsequently, the optimal sizing and placement of PVDGs, the optimal number of PV panels, and the sizing and location of SCs are also determined using the GWO algorithm. Finally, the annual energy and economic analysis is performed on the distribution network integrated with PVDGs and SCs.
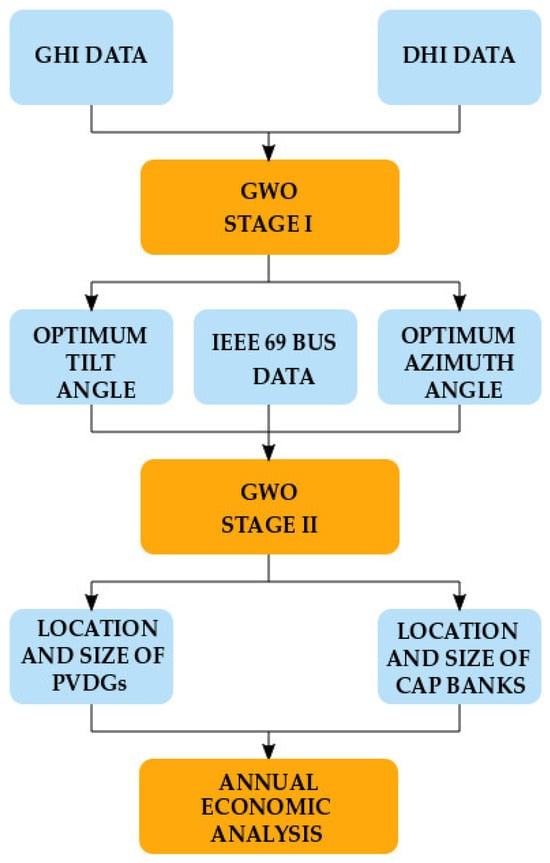
Figure 4.
Overview of proposed framework.
The simulations presented in this study utilize solar insolation data from the year 2023, obtained from the National Solar Radiation Database (NSRDB) provided by the National Renewable Energy Laboratory (NREL) [50]. Figure 5 and Figure 6 show the Global Horizontal Irradiance (GHI) and Diffuse Horizontal Irradiance (DHI) graphs plotted for the single clearest day of each month. They show typical daily patterns, with both values starting at zero at sunrise, peaking around noon, and returning to zero at sunset. GHI reaches its highest values in summer, with broader and taller curves due to longer days and stronger sunlight, while winter months have lower and narrower peaks. DHI values are generally much lower than GHI, but their relative contribution increases in winter. The curves are mostly symmetric, indicating similar conditions in the morning and afternoon.
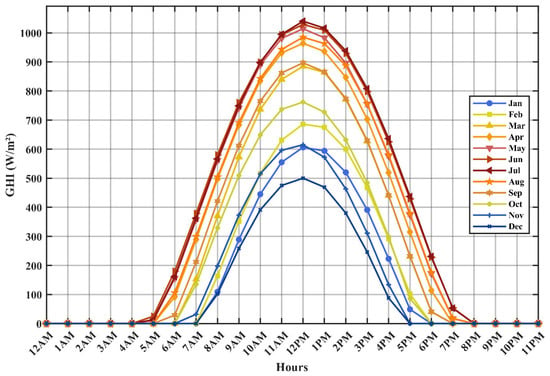
Figure 5.
Monthly GHI curves.
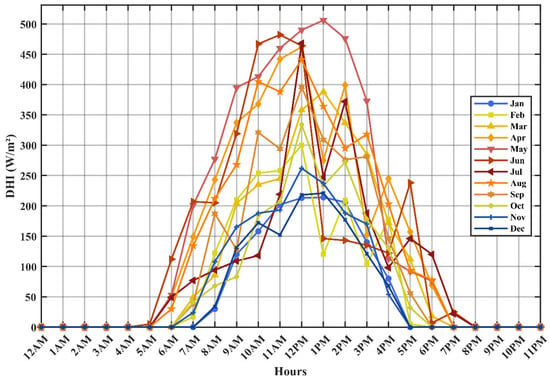
Figure 6.
Monthly DHI curves.
A multi-objective optimization framework is developed with the aim of minimizing power losses, enhancing voltage profiles, and maximizing the injection capacity of PVDGs. The sizing of the PVDGs is performed based on the peak load conditions and the corresponding solar insolation levels. The normalized average load profiles for each month of the year are presented in Figure 7, Figure 8, Figure 9 and Figure 10, categorized by season. These profiles were generated using hourly data obtained from the Pacific Gas and Electric (PG&E) database for the year 2023 [51]. For each month, the load demand is divided into residential and industrial categories. Across all months, the industrial load consistently exceeds the residential load, reflecting the higher energy consumption typical of commercial and manufacturing activities. The aggregate load profile is computed as the sum of the residential and industrial load factors and represents the total system demand. A seasonal analysis reveals that the summer months, particularly June, July, and August, exhibit the highest aggregate load factors, with peak values approaching unity in July.
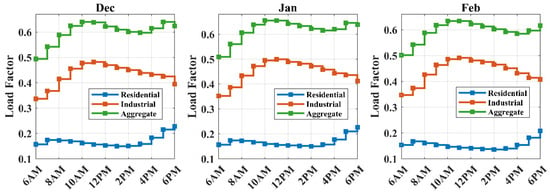
Figure 7.
Winter load profiles.
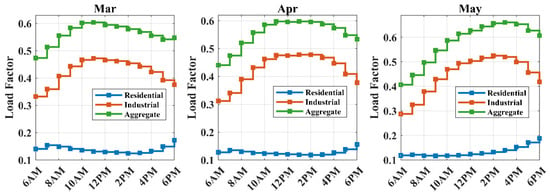
Figure 8.
Spring load profiles.
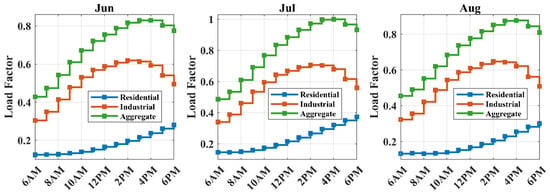
Figure 9.
Summer load profiles.
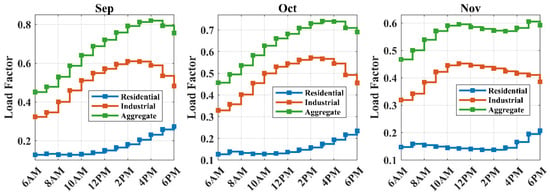
Figure 10.
Fall load profiles.
While many existing studies assume maximum solar insolation during distributed generation (DG) sizing, this work estimates PVDG capacities to satisfy 30% of the peak load demand at the actual solar insolation present at that time. According to the load profile analysis, the system peak load occurs at 4:00 p.m. during the month of July. Therefore, the average solar insolation measured at 4:00 p.m. for the month of July was used for the PVDG sizing process.
Table 1 presents the optimal tilt and azimuth angles corresponding to two distinct cases. In case 1, both tilt and azimuth angles are simultaneously optimized for each month using the GWO algorithm. In case 2, the monthly optimal tilt angles are determined by maintaining a fixed azimuth angle of zero degrees, which reflects the conventional orientation practice for solar panels installed in the Northern Hemisphere.

Table 1.
Optimum tilt and azimuth angles.
For both cases, the total monthly solar irradiation is computed at the respective optimal angles. The table also includes a comparative analysis expressed as a percentage difference in irradiation between the two cases, highlighting the performance impact of optimizing both orientation parameters versus optimizing only the tilt angle.
Although the percentage improvement in total irradiation due to simultaneous azimuth optimization is relatively small in certain months (e.g., April, May, June, September, and December), this is expected because the sun’s daily path during these periods is more symmetrical, and a south-facing orientation (0° azimuth) is already near-optimal. However, for months with more pronounced asymmetry in solar angles or in systems with non-standard orientations, optimizing azimuth can yield greater benefits. The inclusion of azimuth optimization in the proposed framework ensures flexibility and improved performance under varying site-specific conditions.
To qualitatively assess the consistency of the monthly optimum tilt angles derived in this study with broader spatial estimates, a comparison was conducted with recent high-resolution models by Liu et al. [52] and Lu and Qin [53]. Liu et al. [52] used satellite and ground-based data to construct an empirical model linking tilt angle to latitude and diffuse fraction, while Lu and Qin [53] employed long-term ERA5 reanalysis data to estimate fixed tilt angles across China. The monthly tilt angles derived in this study using NSRDB data and GWO-based optimization fall within the ranges reported in both works for comparable mid-latitude locations. For example, summer tilt angles (13–22°) and winter angles (50–61°) in our study closely align with those from the referenced datasets for eastern China. Minor deviations, particularly in winter, are due to differences in data sources, geographic context, and the inclusion of PV system losses in our optimization. Furthermore, unlike the referenced studies, which focused only on tilt, our approach also optimizes azimuth angles, offering a more comprehensive orientation strategy. Overall, this comparison supports the robustness and scalability of our methodology.
Table 2 presents the detailed configuration of the PVDGs, including their locations, the number of installed solar panels, their respective capacities, and the corresponding placement and ratings of SCs. The placement and sizing of the PVDGs are guided by the optimization objective, which constrains the total PVDG penetration to a maximum of 30% of the system’s peak active power demand. Additionally, the capacity of any individual PVDG is restricted to no more than 15% of the peak load, which is 570.33 kW.

Table 2.
Location and size of PVDGs and SCs.
As shown in the table, the total installed PVDG capacity closely approaches the specified 30% limit, while no individual PVDG exceeds the 15% threshold. This ensures adherence to the design constraints aimed at maintaining operational reliability and voltage stability. Furthermore, the sizing of the SCs follows a similar criterion, with the total reactive power compensation limited to 30% of the system’s total reactive load. This approach facilitates effective voltage regulation and supports power factor improvement within the distribution network.
To validate the effectiveness of the optimized parameters obtained through the two-stage optimization framework, several performance metrics were evaluated on the IEEE 69-bus system. The improvement in the voltage profile was assessed by comparing the minimum and maximum bus voltages before and after the integration of optimally sized and placed PV panels and shunt capacitor banks. These comparisons are illustrated through box plots and numerical values (Figure 11 and Table 3). Furthermore, total active power losses under peak load conditions were evaluated for both scenarios, and the results demonstrate a significant reduction in losses with the optimized configuration (Figure 12). In addition to the technical metrics, the proposed method was also validated economically by calculating the annual energy savings and associated cost savings over a 20-year period (Figure 13; Table 4 and Table 5). These results confirm the effectiveness of the optimized parameters in improving the performance, efficiency, and economic viability of the distribution network.
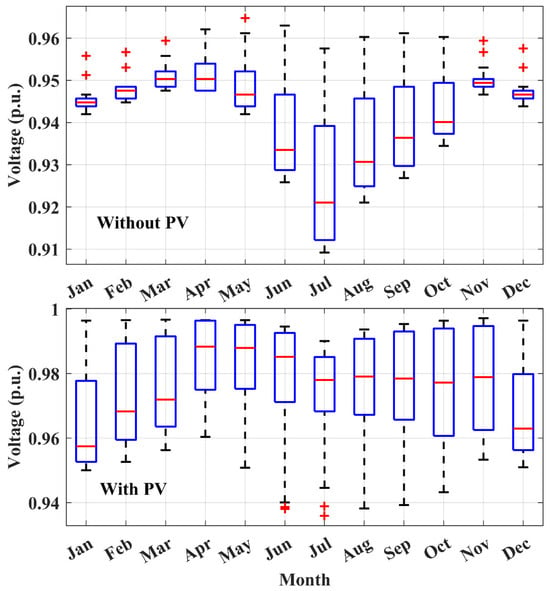
Figure 11.
Box plots comparing voltages without and with PVDGs. Red markers indicate statistical outliers in daily minimum voltages.

Table 3.
Voltage comparison.
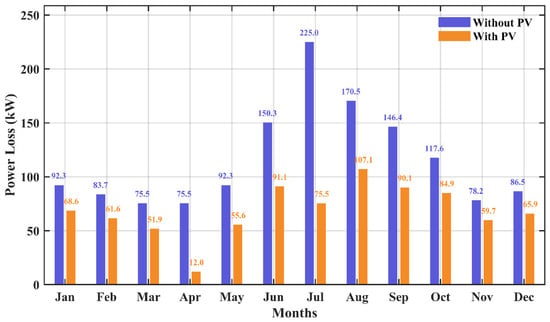
Figure 12.
Power loss comparison graph.
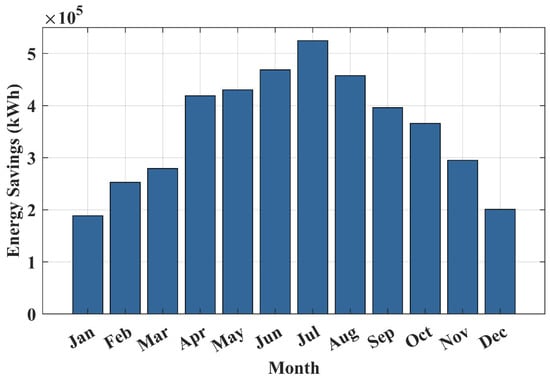
Figure 13.
Monthly energy savings.

Table 4.
Cost of PVDG and capacitor bank.

Table 5.
Annual economic savings due to the installation of PVDGs and SCs.
Figure 11 presents the comparison of box plots for minimum per-unit voltages across all months, highlighting a substantial improvement in voltage regulation with the integration of optimally placed and sized PVDGs and shunt capacitors. In the base case without PV, the minimum voltage for all months falls below the NERC recommended lower limit of 0.95 per unit, as seen in both the box plots and the numerical data in Table 3. This indicates that the base case voltage profile does not satisfy regulatory requirements, particularly under high-load conditions.
With the addition of PVDGs and SCs, the minimum voltages improve significantly across all months. The box plots shift upward and become more compact, indicating reduced variability and enhanced voltage stability. As shown in Table 3, with the addition of PVDGs and SCs, most of the minimum voltages now fall within the NERC recommended range of 0.95 to 1.05 per unit. However, for a few months, the minimum voltage remained slightly below 0.95 per unit even with PVDG integration. This can be attributed to periods of high load combined with reduced solar insolation, particularly in early morning or late afternoon hours.
Figure 12 illustrates a comparative analysis of power losses in the distribution system for scenarios with and without PVDGs and SCs, evaluated under peak load conditions and on the day with the minimum solar insolation for each month, thereby representing the worst-case operational scenario. The results clearly demonstrate that, across all months, the integration of optimally placed and sized PVDGs and SCs leads to a significant reduction in power losses compared to the base case. This reduction is consistently observed even under the most challenging conditions of high demand and limited solar insolation, demonstrating the effectiveness of PVDGs in enhancing system efficiency and reliability. The figure further highlights the seasonal variation in power losses, with the highest losses typically occurring during months with high load demand. Nevertheless, the presence of PVDGs and SCs consistently mitigates these losses, indicating their robust performance in supporting the distribution network throughout the year. The coordinated integration of PVDGs and optimally placed SCs significantly enhances system performance. While PVDGs contribute active power, the shunt capacitors provide localized reactive power support, which helps regulate voltage levels and reduce reactive power flow through the network. This complementary operation minimizes voltage deviations and reduces total power losses, thereby improving both voltage stability and energy efficiency across the distribution system.
Figure 13 presents the monthly energy savings resulting from the integration of PV panels and SCs within the distribution system, determined using Equation (18). The data clearly indicates that the summer months of June, July, and August yield the highest energy savings. This outcome is primarily attributed to the higher solar insolation during these months, which enhances the output power of the PV panels and leads to a substantial reduction in power losses, as also depicted in Figure 12.
Table 4 outlines the costs associated with the PV panels (Trinasolar, San Jose, CA, USA), inverters (Enphase Energy, Fremont, CA, USA), and SCs (EATON, Beachwood, OH, USA), while Table 5 summarizes the corresponding annual economic savings. As shown in Table 5, the integration of PVDGs and SCs leads to substantial economic benefits, with the total investment being recovered in approximately six years. It should be noted that the six-year payback period is location-dependent and may vary with changes in solar irradiance and load profiles across different regions.
4. Conclusions
This paper has presented a two-stage optimization framework for optimal sizing and location of PVDGs at monthly optimized tilt and azimuth angles using the GWO algorithm. In the first stage, the GWO algorithm is employed to determine the optimal tilt and azimuth angles for each month, based on the GHI and DHI data. In the second stage, the optimal locations and capacities of PVDGs and SCs are identified by considering the annual peak load and corresponding solar insolation levels. The proposed methodology was validated on the IEEE 69-bus radial distribution system. Comparative analysis indicates that the integration of optimally oriented PVDGs significantly improves the voltage profile across all months, with noticeable enhancement in both minimum and maximum voltage levels relative to the base case. Moreover, total active power losses are substantially reduced even under peak load and low solar irradiance conditions. An economic evaluation further demonstrates that the initial investment in PVDGs and SCs can be recovered in approximately six years, highlighting the effectiveness of monthly tilt and azimuth angle optimization in achieving considerable technical and financial benefits.
Author Contributions
Conceptualization, P.G., S.R.G., A.A., B.G. and K.J.; methodology, P.G., S.R.G., A.A., B.G. and D.D.; software, P.G. and S.R.G.; validation, A.A., B.G., K.J. and D.D., formal analysis, P.G., S.R.G., A.A., B.G. and K.J.; writing—original draft preparation, P.G., S.R.G. and D.D.; writing—review and editing, P.G., S.R.G., A.A. and D.D. All authors have read and agreed to the published version of the manuscript.
Funding
This research received no external funding.
Data Availability Statement
The original contributions presented in this study are included in the article. Further inquiries can be directed to the corresponding author.
Conflicts of Interest
The authors declare no conflicts of interest.
References
- Federal Energy Regulatory Commission (FERC). The February 2021 Cold Weather Outages in Texas and South Central United States. Available online: https://www.ferc.gov/news-events/news/final-report-february-2021-freeze-underscores-winterization-recommendations (accessed on 26 July 2025).
- U.S. Department of Energy (DOE). Hurricane Ida Situation Update #8. 2021. Available online: https://www.energy.gov/ceser/hurricane-ida-situation-reports (accessed on 26 July 2025).
- NREL. Documenting a Decade of Cost Declines for PV Systems. NREL, 10 February 2021. Available online: https://www.nrel.gov/news/detail/program/2021/documenting-a-decade-of-cost-declines-for-pv-systems (accessed on 26 July 2025).
- Guo, M.; Zang, H.; Gao, S.; Chen, T.; Xiao, J.; Cheng, L.; Wei, Z.; Sun, G. Optimal tilt angle and orientation of photovoltaic modules using HS algorithm in different climates of China. Appl. Sci. 2017, 7, 1028. [Google Scholar] [CrossRef]
- Hafez, A.Z.; Soliman, A.; El-Metwally, K.A.; Ismail, I.M. Tilt and azimuth angles in solar energy applications—A review. Renew. Sustain. Energy Rev. 2017, 77, 147–168. [Google Scholar] [CrossRef]
- Abdelaal, A.K.; Alhamahmy, A.I.A.; Attia, H.E.D.; El-Fergany, A.A. Maximizing solar radiations of PV panels using artificial gorilla troops reinforced by experimental investigations. Sci. Rep. 2024, 14, 3562. [Google Scholar] [CrossRef]
- Khalil, A.; Asheibi, A. Optimal sizing of stand-alone PV system using grey wolf optimization. In Proceedings of the 2019 International Conference on Electrical Engineering Research & Practice (ICEERP), Sydney, Australia, 24–28 November 2019; pp. 1–6. [Google Scholar]
- Teyabeen, A.A.; Mohamed, F. Estimation of the Optimum Tilt Angle of Solar PV Panels to Maximize Incident Solar Radiation in Libya. Energies 2024, 17, 5891. [Google Scholar] [CrossRef]
- Khahro, S.F.; Tabbassum, K.; Talpur, S.; Alvi, M.B.; Liao, X.; Dong, L. Evaluation of Solar Energy Resources by Establishing Empirical Models for Diffuse Solar Radiation on Tilted Surface and Analysis for Optimum Tilt Angle for a Prospective Location in Southern Region of Sindh, Pakistan. Renew. Sustain. Energy Rev. 2015, 45, 837–846. [Google Scholar] [CrossRef]
- Despotovic, M.; Nedic, V. Comparison of optimum tilt angles of solar collectors determined at yearly, seasonal and monthly levels. Energy Convers. Manag. 2015, 97, 121–131. [Google Scholar] [CrossRef]
- Khan, M.A.M.; Alsulaiman, F.A.; Ben Mansour, R. Optimizing the Solar PV Tilt Angle to Maximize the Power Output: A Case Study for Saudi Arabia. IEEE Access 2021, 9, 15914–15928. [Google Scholar] [CrossRef]
- Božiková, M.; Bilčík, M.; Madola, V.; Szabóová, T.; Kubík, Ľ.; Lendelová, J.; Cviklovič, V. The Effect of Azimuth and Tilt Angle Changes on the Energy Balance of Photovoltaic System Installed in the Southern Slovakia Region. Appl. Sci. 2021, 11, 8998. [Google Scholar] [CrossRef]
- Tiwari, G.N.; Ahmad, M.J. Optimization of Tilt Angle for Solar Collector to Receive Maximum Radiation. Open Renew. Energy J. 2009, 2, 19–24. [Google Scholar] [CrossRef]
- Jin, Y.; Xu, J.; Zhang, Y.; Xiao, Y.; Zhou, Y.; Long, E. Installation Optimization on the Tilt and Azimuth Angles of the Solar Heating Collectors for High Altitude Towns in Western Sichuan. Renew. Energy 2017, 113, 1040–1051. [Google Scholar] [CrossRef]
- Ashetehe, A.A.; Gessesse, B.B.; Shewarega, F. A Generalized Approach for the Determination of Optimum Tilt Angle for Solar Photovoltaic Modules with Selected Locations in Ethiopia as Illustration Examples. Sci. Afr. 2022, 18, e01433. [Google Scholar] [CrossRef]
- Danandeh, M.A.; Mousavi Gazafrudi, S.M. Solar Irradiance Estimation Models and Optimum Tilt Angle Approaches: A Comparative Study. Renew. Sustain. Energy Rev. 2018, 92, 319–330. [Google Scholar] [CrossRef]
- Kaddoura, T.O.; Ramli, M.A.; Al-Turki, Y.A. On the estimation of the optimum tilt angle of PV panel in Saudi Arabia. Renew. Sustain. Energy Rev. 2016, 65, 626–634. [Google Scholar] [CrossRef]
- Nfaoui, M.; El-Hami, K. Optimal tilt angle and orientation for solar photovoltaic arrays: Case of Settat city in Morocco. Int. J. Ambient. Energy 2020, 41, 214–223. [Google Scholar] [CrossRef]
- Smith, C.J.; Forster, P.M.; Crook, R. An all-sky radiative transfer method to predict optimal tilt and azimuth angle of a solar collector. Sol. Energy 2016, 132, 241–253. [Google Scholar] [CrossRef]
- Chen, Y.; Li, M.; Zhao, L.; Ma, T.; Wang, X. General Method to Obtain Recommended Tilt and Azimuth Angles for Photovoltaic Systems Worldwide. Appl. Energy 2018, 219, 11–20. [Google Scholar] [CrossRef]
- Alam, M.S.; Qadeer, M.A.; Afazal, M. Determination of the Optimum Tilt-Angles for Solar Panels in Indian Climates: A New Approach. Sol. Energy 2024, 265, 109638. [Google Scholar] [CrossRef]
- Soulayman, S.; Hammoud, M. Optimum Tilt Angle of Solar Collectors for Building Applications in Mid-Latitude Zone. Energy Rep. 2016, 2, 31–37. [Google Scholar] [CrossRef]
- Jamil, B.; Siddiqui, A.T.; Akhtar, N. Estimation of solar radiation and optimum tilt angles for south-facing surfaces in Humid Subtropical Climatic Region of India. Eng. Sci. Technol. Int. J. 2016, 19, 1826–1835. [Google Scholar] [CrossRef]
- Yadav, A.K.; Malik, H.; Chandel, S. Tilt Angle Calculation for Installation of PV Systems for Mountainous Regions of Himachal Pradesh India. Renew. Energy 2016, 89, 452–466. [Google Scholar]
- Quinn, D.J.; Lehman, B. A Simple Formula for Estimating the Optimum Tilt Angles of Photovoltaic Panels. Sol. Energy 2013, 86, 1557–1570. [Google Scholar]
- Sharma, V.; Kumar, A.; Dhundhara, S.; Gaur, A.; Verma, Y. Optimal Tilt Angle Determination for PV Panels Using Real Time Data Acquisition. Energy Rep. 2020, 6, 197–206. [Google Scholar] [CrossRef] [PubMed]
- Chang, Y.-P. Optimal the Tilt Angles for Photovoltaic Modules in Taiwan. Int. J. Electr. Power Energy Syst. 2010, 32, 956–964. [Google Scholar] [CrossRef]
- Kanianthara, N.S.; Ang, S.P.; Sulayman, A.F.K.; Hamid, Z.b.H.A. Optimising Monthly Tilt Angles of Solar Panels Using Particle Swarm Optimisation Algorithm. Indones. J. Electr. Eng. Comput. Sci. 2021, 23, 75–89. [Google Scholar] [CrossRef]
- Mukisa, N.; Zamora, R. Optimal Tilt Angle for Solar Photovoltaic Modules on Pitched Rooftops: A Case of Low Latitude Equatorial Region. Sustain. Energy Technol. Assess. 2022, 50, 101821. [Google Scholar] [CrossRef]
- Prunier, Y.; Chuet, D.; Nicolay, S.; Hamon, G.; Darnon, M. Optimization of Photovoltaic Panel Tilt Angle for Short Periods of Time or Multiple Reorientations. Energy Convers. Manag. X 2023, 20, 100417. [Google Scholar] [CrossRef]
- Ramli, M.A.; Bouchekara, H.R. Estimation of Solar Radiation on PV Panel Surface with Optimum Tilt Angle Using Vortex Search Algorithm. IET Renew. Power Gener. 2018, 12, 1138–1145. [Google Scholar] [CrossRef]
- Sarailoo, M.; Akhlaghi, S.; Rezaeiahari, M.; Sangrody, H. Residential solar panel performance improvement based on optimal intervals and optimal tilt angle. In Proceedings of the 2017 IEEE Power & Energy Society General Meeting, Chicago, IL, USA, 16–20 July 2017; pp. 1–5. [Google Scholar]
- Ramli, M.A.M.; Bouchekara, H.R.E.H.; Shahriar, M.S.; Milyani, A.H.; Rawa, M. Maximization of Solar Radiation on PV Panels With Optimal Intervals and Tilt Angle: Case Study of Yanbu, Saudi Arabia. Front. Energy Res. 2021, 9, 753998. [Google Scholar] [CrossRef]
- Mehleri, E.; Zervas, P.; Sarimveis, H.; Palyvos, J.; Markatos, N. Determination of the Optimal Tilt Angle and Orientation for Solar Photovoltaic Arrays. Renew. Energy 2010, 35, 2468–2475. [Google Scholar] [CrossRef]
- Şahin, M. Determining optimum tilt angles of photovoltaic panels by using artificial neural networks in turkey. Teh. Vjesn. 2019, 26, 596–602. [Google Scholar]
- Celik, A.N.; Muneer, T. Neural Network Based Method for Conversion of Solar Radiation Data. Energy Convers. Manag. 2012, 53, 164–172. [Google Scholar] [CrossRef]
- Al-Rousan, N.; Isa, N.A.M.; Desa, M.K.M.; Al-Najjar, H. Integration of logistic regression and multilayer perceptron for intelligent single and dual axis solar tracking systems. Int. J. Intell. Syst. 2021, 36, 5605–5669. [Google Scholar] [CrossRef]
- Abdelaal, A.K.; El-Fergany, A. Estimation of optimal tilt angles for photovoltaic panels in Egypt with experimental verifications. Sci. Rep. 2023, 13, 3268. [Google Scholar] [CrossRef] [PubMed]
- Hartner, M.; Ortner, A.; Hiesl, A.; Haas, R. East to west–The optimal tilt angle and orientation of photovoltaic panels from an electricity system perspective. Appl. Energy 2015, 160, 94–107. [Google Scholar] [CrossRef]
- Correa-Guamán, A.; Moreno-Salazar, A.; Paccha-Soto, D.; Jaramillo-Fierro, X. Impact of Azimuth Angle on Photovoltaic Energy Production: Experimental Analysis in Loja, Ecuador. Energies 2025, 18, 1998. [Google Scholar] [CrossRef]
- Al Garni, H.Z.; Awasthi, A.; Wright, D. Optimal orientation angles for maximizing energy yield for solar PV in Saudi Arabia. Renew. Energy 2019, 133, 538–550. [Google Scholar] [CrossRef]
- Dhimish, M.; Mather, P.; Holmes, V.; Sibley, M. CDF modelling for the optimum tilt and azimuth angle for PV installations: Case study based on 26 different locations in region of the Yorkshire UK. IET Renew. Power Gener. 2019, 13, 399–408. [Google Scholar] [CrossRef]
- Rowlands, I.H.; Kemery, B.P.; Beausoleil-Morrison, I. Optimal solar-PV tilt angle and azimuth: An Ontario (Canada) case-study. Energy Policy 2011, 39, 1397–1409. [Google Scholar] [CrossRef]
- Khenissi, I.; Fakhfakh, M.A.; Sellami, R.; Neji, R. A new approach for optimal sizing of a grid connected PV system using PSO and GA algorithms: Case of Tunisia. Appl. Artif. Intell. 2021, 35, 1930–1951. [Google Scholar] [CrossRef]
- Sawle, Y.; Gupta, S.; Bohre, A.K. Optimal sizing of standalone PV/Wind/Biomass hybrid energy system using GA and PSO optimization technique. Energy Procedia 2017, 117, 690–698. [Google Scholar] [CrossRef]
- Mirjalili, S.; Mirjalili, S.M.; Lewis, A. Grey wolf optimizer. Adv. Eng. Softw. 2014, 69, 46–61. [Google Scholar] [CrossRef]
- Shaikh, M.S.; Hua, C.; Jatoi, M.A.; Ansari, M.M.; Qader, A.A. Application of grey wolf optimisation algorithm in parameter calculation of overhead transmission line system. IET Sci. Meas. Technol. 2021, 15, 218–231. [Google Scholar] [CrossRef]
- Seguin, R.; Woyak, J.; Costyk, D.; Hambrick, J.; Mather, B. High-Penetration Photovoltaic Integration Handbook for Distribution Engineers; Technical Report; National Renewable Energy Laboratory: Golden, CO, USA, 2016. Available online: https://www.nrel.gov/grid/ieee-standard-1547/high-penetration-photovoltaic-integration-handbook (accessed on 18 August 2025).
- Savier, J.S.; Das, D. Impact of Network Reconfiguration on Loss Allocation of Radial Distribution Systems. IEEE Trans. Power Deliv. 2007, 22, 2473–2480. [Google Scholar] [CrossRef]
- NREL. NSRDB. Available online: https://nsrdb.nrel.gov/ (accessed on 27 July 2025).
- PGE. Understanding Energy Use and Prices. Pacific Gas & Electric—Tariffs. Available online: https://www.pge.com/assets/rates/tariffs/energy_use_prices.shtml (accessed on 27 July 2025).
- Liu, Y.; Yao, L.; Jiang, H.; Lu, N.; Qin, J.; Liu, T.; Zhou, C. Spatial estimation of the optimum PV tilt angles in China by incorporating ground with satellite data. Renew. Energy 2022, 189, 1249–1258. [Google Scholar] [CrossRef]
- Lu, N.; Qin, J. Optimization of tilt angle for PV in China with long-term hourly surface solar radiation. Renew. Energy 2024, 229, 120741. [Google Scholar] [CrossRef]
Disclaimer/Publisher’s Note: The statements, opinions and data contained in all publications are solely those of the individual author(s) and contributor(s) and not of MDPI and/or the editor(s). MDPI and/or the editor(s) disclaim responsibility for any injury to people or property resulting from any ideas, methods, instructions or products referred to in the content. |
© 2025 by the authors. Licensee MDPI, Basel, Switzerland. This article is an open access article distributed under the terms and conditions of the Creative Commons Attribution (CC BY) license (https://creativecommons.org/licenses/by/4.0/).