Abstract
This paper presents tea leaves moisture monitoring system based on RF reflectometry techniques. The system was divided into two parts which are the sensor and reflectometer parts. The large coaxial probe was used as a sensor for the system. The reflectometer part plays a role as signal generator and also data acquisition. The reflectometer-sensor system was operated with a graphical user interface at 1.529 GHz at room temperature. The system was able to measure the moisture content of tea leaves ranging 0% m.c to 50% m.c on a wet basis. In this study, up to five kinds of tea leaves bulk were tested. The mean of absolute errors in the moisture measurement for tea leaves was ±2.
1. Introduction
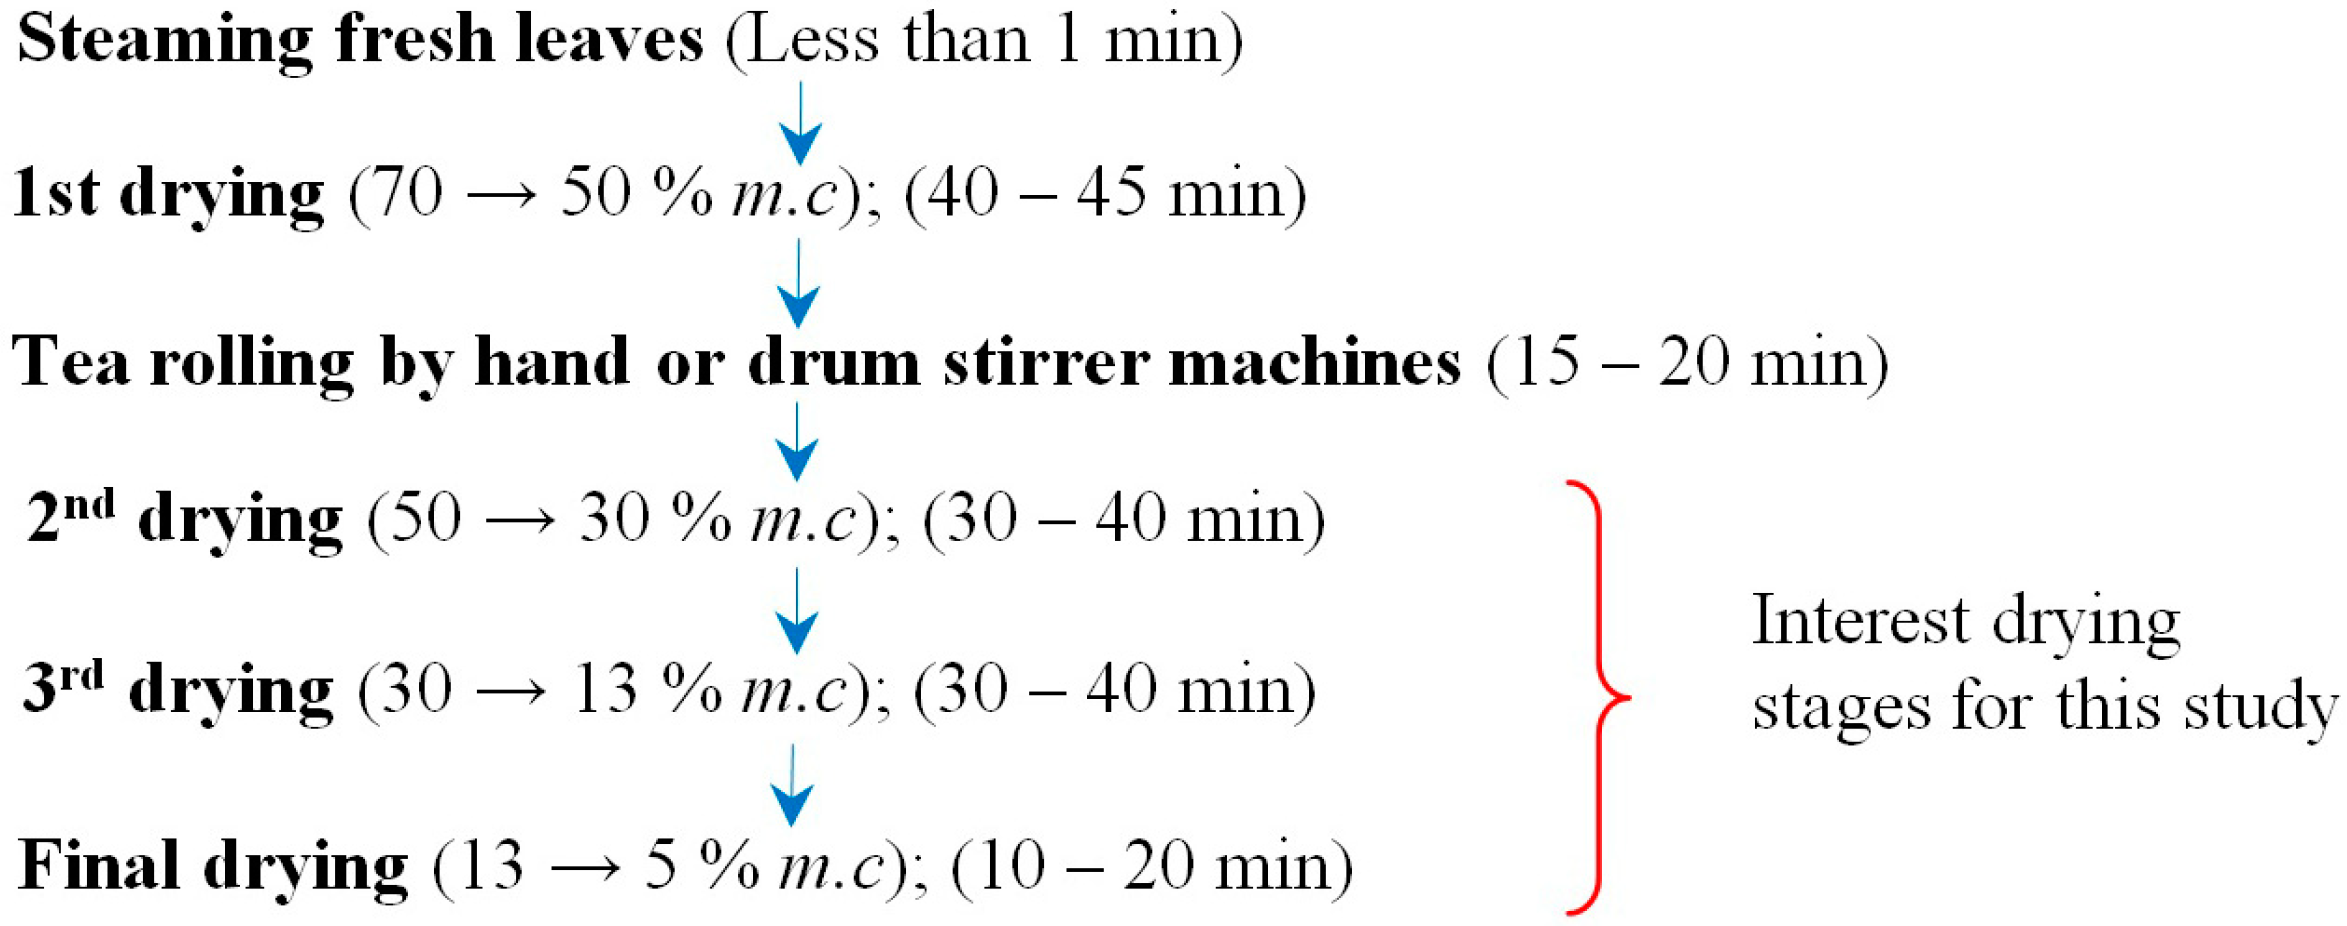
Generally, the production line of tea is mainly dependent on the moisture content, m.c to decide how long the tea leaves should be dried in every drying step (Figure 1). Traditionally, the m.c of tea leaves was estimated by the skilled workers. However, the significant percentage of measurement errors may be caused by the workers [1]. In fact, there are some accurate chemical methods (water extracted from tea sample) that were used to determine the moisture of tea [2], but these kinds of methods are time consuming and unsuitable for large-scale tea processing in manufacturing. In addition, most of the moisture meters only involve the DC circuit by using the concept of measuring the tea leaves resistance, conductivity or capacitance [3,4,5,6,7,8]. The ionic conductivity, σ, in the tea leaves interacts with the metal surface of the sensor (sample holder) to create a small amount of voltage in the meter. However, this measurement concept will cause less sensitivity to the dry tea leaves (<30% m.c) measurement, due to the lack of free ionic in the dry tea leaf Furthermore, these economical meters can only measure one type of tea leaf for a narrow measurement range of m.c (normally only 3% to 18% m.c). Besides, the sensitivity of measurement towards the water contained in the tea leaves requires extensive interaction between the sensor surface and tea bulk samples.
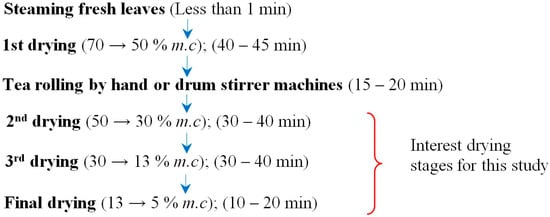
Figure 1.
Tea manufacturing processing.
Recently, the near-infrared spectroscopy (NIRS) [2,9] is the most common sensing method in biology and food processing whereby specimens can be in the form of solids, liquids, or gases. Besides the NIRS technique, the microwave method has been increasingly used for solid or liquid specimen measurements [10]. The m.c measurement using NIRS technique is based on the change in refractive index, n parameter of the tea sample (due to the change in m.c in the sample). On the other hand, the interaction between tea sample and microwave can be described by the parameter of relative complex permittivity, εr = εr’ − jεr”. Generally, both NIRS and microwave techniques use the equivalent principle and the relationship between n and εr is given as n2 = εr. Differentiations between microwave and NIRS methods are the application of operating frequency (Microwave: 300 MHz to 300 GHz; NIRS: 300 GHz to 430 THz) and excited source. In fact, the microwave method is particularly suitable for moisture measurements due to the natural tendency of water to absorb microwave energy and provide a significant response when the moisture content changes [11].
Microwave measurement techniques can be categorized into either resonant technique or non-resonant technique. Recently, most of the study measurements [12,13,14,15] are based on the resonant technique as the measurement principle is simple, in which the properties of the sample under test are characterized from the measurements of shifting resonance frequency and quality of factor Q. Although this method provides accurate measurements, it requires high resolution and frequency sweep instruments, as well as good environmental control measure. Therefore, this method is less suitable for large-scale product processing industries. In the past until now, there were two types of microwave sensors which have been reported and used in the monitoring of the tea drying process. The first type of sensor is one pair of horn antennas and its moisture measurement is based on the free-space transmission techniques [16,17]. The second type is a microstrip line sensor which is used for near field measurement [18,19]. Both methods have advantages and disadvantages, respectively. The first method is suitable for high temperature tea leaves bulk measurement due to the horn antennas sensor which does not come into direct contact with the tea leaves sample; thus, the RF circuit is safe from heat damage. Nevertheless, this method provides a less precise measurement due to the sensing field being highly dispersed. Furthermore, the distance between the tea leaves sample and the horn aperture is difficult to gauge precisely. The second method has a small sensor and portable feature which is capable to measure wider m.c range containing in the tea leaves sample. However, the microstrip line sensor has a thin sensing area above the microstrip line. Normally, the sensing area = (width of microstrip line)2. Thus, the m.c is mainly measured only for the tea leaves which are overlaid on the surface of the microstrip line. This situation leads to high uncertainty in the moisture measurement since the tea leaves are an inhomogeneous sample.
Hence, this paper attempts to introduce a simple and relatively low-cost portable microcontroller-based frequency domain microwave reflectometer for tea leaves moisture monitoring. A large open-ended coaxial probe was used as a moisture sensor, which is directly connected to the reflectometer. The applied system is based on a frequency domain reflectometer (FDR) method which is based on the dielectric property changes in the wet tea leaves. The obtained measurements are calibrated using the oven drying method. Up to five kinds of manufactured tea leaves were tested, namely Boh tea, Pu Erh tea, Green tea, Sabah tea, and Oolong tea. The study system has several advantages:
- Able to determine a wider range of m.c (0% to 50% on a wet basis) in tea leaves bulk.
- Provide a significant sensing volume (5 cm diameter × 2.5 cm depth); thus, the uncertainty in the moisture measurement due to inhomogeneous properties of the tea leaves bulk can be reduced.
- The probe aperture is directly contacted with tea leaves, thus the irregularity of the surface of the tea leaves can be tolerated.
Normally, the making process of tea in factory is divided into at least six sub-processes (Figure 1) [8]. However, this study is only interested in the moisture determination starting at the 2nd drying step until the final drying step.
2. Materials and Methods
The reflectometer part mainly consisting of ZX95-2150VW-S+ voltage-controlled oscillator (VCO), ZX30-17-5-S+ directional coupler (DC), ZX47-55LN-S+ power detector (PD), Arduino Nano Microcontroller 3.0, control circuit board, and 12 V DC power supply as shown in Figure 2. The large coaxial probe sensor whereby total weight is 2.6 kg, has operating bandwidth covered from 1 MHz to 2 GHz and its dimensions are shown in Figure 3. The moisture measurement is based on the principle of reflectometry and the probe aperture was firmly contacted with the tea leaves bulk. The contact pressure between the aperture probe and tea leaves bulk is a constant value (≈1.4 × 10⁴ N/m2). Arduino microcontroller is used to control the VCO in order to generate incident voltage signal, Vi to the wet tea leaves bulk via the probe aperture. The incident signal will partially reflect and travel back due to the discontinuity impedance at the probe aperture. The reflected signal will obtain the desired information about the volume of water in the wet tea leaves bulk. The reflected voltage, Vr signal from the probe aperture is detected by the power detector in the system.
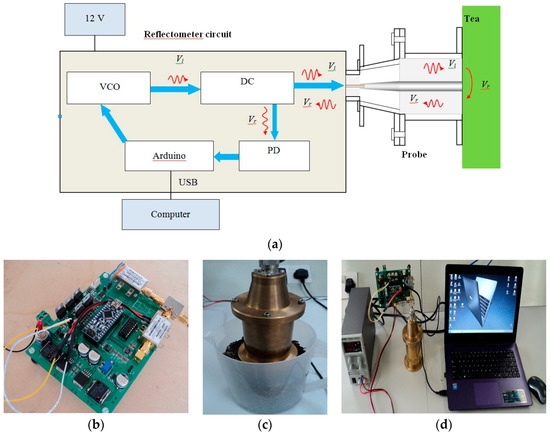
Figure 2.
(a) Reflectometer-probe system diagram. (b) Reflectometer’s circuit. (c) Coaxial probe for tea leaves bulk measurements. (d) Overall measurement system.
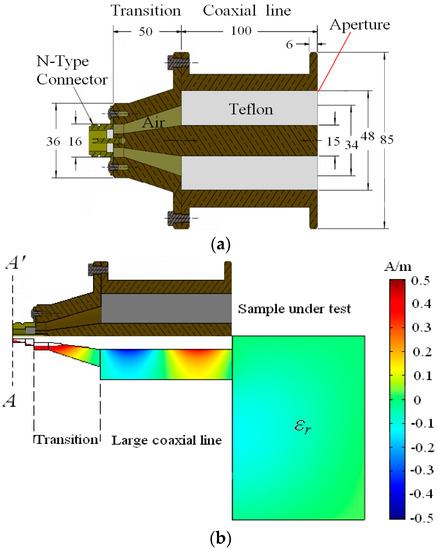
Figure 3.
(a) Cross-sectional view and dimensions (in millimeter) of the probe. (b) Half axial symmetry magnetic fields simulation for the probe using COMSOL Multiphysics with εr = 1 at 2 GHz.
The moisture content, m.c of the tea leaves bulk are measured at various operating frequencies. The used VCO is capable of generating a wide range of frequency signals based on input tuning voltage, in which the frequency values of the signal are measured using Mini-Circuits UFC-6000 RF frequency counter. The signal control and acquisition algorithms are created using Python software in order to extract the measured Vr, as well as to process raw measured Vr and tea moisture level display. The correlation formula between Vr and m.c is described in Section 4.
The maximum limit of the operating frequency, fmax propagating in the coaxial line of the probe is determined using TE11 cut-off as: fmax = (3 × 10⁸)/[π(b + a)√εc] ≈ 2 GHz (εc = 2.06, b = 0.024 m, a = 0.0075 m). The propagated magnetic field, Hϕ was simulated at 2 GHz using COMSOL Multiphysics simulator in order to ensure that only single TEM mode is propagated in the coaxial line as shown in Figure 3b. The performance of the probe was tested using E5071C network analyzer. The complex reflection coefficients (magnitude, |Γ| and phase, ϕ) were measured. The depth sensing distance, d of the probe is 2.5 cm, which is estimated based on the distance, whereby the measured |Γ| and ϕ at 2 GHz become constant when the metallic plate is moved away from the probe aperture in air as shown in Figure 4.
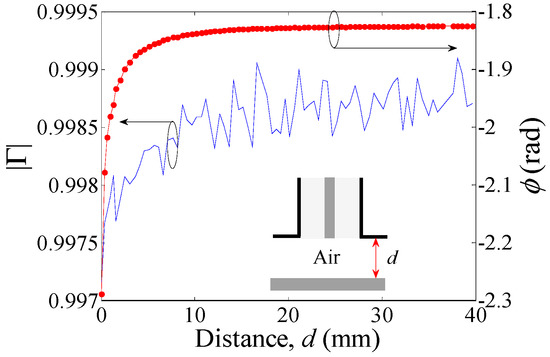
Figure 4.
Variation in magnitude and phase of reflection coefficient with distance at 2 GHz.
3. Moisture Measurements
The gravimetric moisture content, m.c of the five kinds of manufactured tea leaves was obtained by the wet basic oven-drying method, respectively. Up to 250 g of each tea leaf was mixed with an amount of water so that the total mass, mtotal of the wet tea leaves bulk reaches approximately 500 g. Then, the wet tea leaves bulk was left for 1 day in order to reach equilibrium water absorption (water distribution uniformity). After 1 day, the tea leaves sample in the initial condition was weighed at room temperature using digital balance, the initial mass, mtotal (mass of tea leaves, mtea + mass of water, mwater) of the tea sample was recorded. The corresponding reflected voltage, Vr of the tea sample was measured using the reflectometer-probe system. The tea sample was dried in an oven at 105 °C for 3–5 min to reduce the moisture containing in the sample. After oven drying, the mass, mtotal of the tea sample was re-weighed and recorded as soon as it was cooled to room temperature. The corresponding Vr for reduced mass, mtotal of tea sample was measured. The above experimental steps were repeated until the tea sample stopped losing weight after oven drying. The final constant weight is the mass of dry tea leaves, mtea. The actual m.c of the tea sample for each time after the drying process was carried out, and calculated as:
4. Results and Discussion
The wet tea leaves bulk is a composition of water (εr = ~80), dry tea leaves (εr = ~2.7), and air (εr = 1). The dielectric of water is much greater than these elements. Thus, the microwave energy can be easily absorbed by water and cause the polarization of water molecules present in the leaves bulk. For this reason, the proposed system is expected to exhibit more sensitivity towards changing m.c in the wet tea bulk.
The variations in reflected voltage, Vr of tea leaves bulk with the percentage of m.c at various operating frequencies, respectively, are plotted in Figure 5a–e. As expected, the reflected voltage, Vr of tea leaves increases exponentially with m.c, since relative permittivity, εr of agricultural product normally increases exponentially with its m.c [20] at higher operating frequencies. From Figure 5, we found that the measurement frequency at 1.529 GHz is able to provide stable and sensitive measurement with respect to m.c of the all tea leaves. In this study, the simple relationship between the Vr and m.c is achieved using an empirical semi-log expression as:
where α, β and γ are the fitting parameters. The solid line of reflected voltage, Vr in Figure 5 was the calculation of the Vr using Equation (2). The values of α, β, and γ for operating frequency of 1.529 GHz are obtained using regression method as listed in Table 1. The maximum deviation between the calculated and measured Vr are within ±0.04 V.
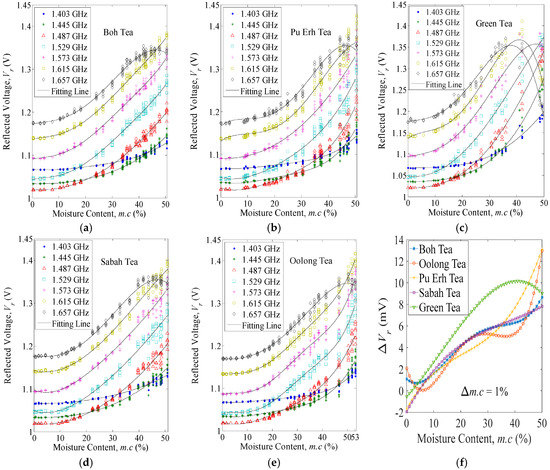
Figure 5.
(a–e) Variations in Vr and m.c (%) at (25 ± 1) °C. (f) Sensitivity of measured Vr respect to m.c.

Table 1.
Parameter Values of Equation (2).
The reflected voltage changes, ΔVr resulting from a change of 1% m.c in the five tea leaves bulk samples at 1.529 GHz, is shown in Figure 5f. As mentioned above, the polarization of water molecules contained in the tea leaves bulk has shown a significant response when exposed to microwaves. The more m.c in the tea leaves bulk, the more reaction will exist. Thus the sensitivity of the measurement is increased with m.c. Overall, tea leaves bulk containing high water content has high sensitivity of reflected voltage, Vr measurement. From (1) and parameter values in Table 1, the m.c (%) of the tea leaves bulk can be predicted as:
The mean deviation between the predicted and actual m.c are within the value of ±2. The deviation may be mainly caused by an inhomogeneous form of tea leaves bulk in which most of the tea products are in roll or crush form as shown in Figure 6. Different kinds of teas are manufactured by various techniques. Both tea and Sabah tea are crushed into small pieces. On the other hand, the green tea, Oolong tea and Pu Erh tea are rolled into round shape by hand or machinery.
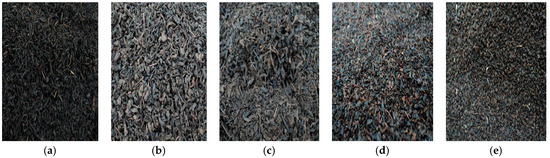
Figure 6.
Roll form (a) green tea, (b) Pu Erh tea, and (c) Oolong tea leaves. Crush form (d) Sabah tea and (e) Boh tea.
5. Conclusions
The tea moisture reflectometer-sensor system is developed successfully in which it is suitable for large scale tea processing manufacturing. The reflectometer has conceptualized a commercially viable product and this measurement system has several features including data storing capability and various types of tea measurement capability, namely Oolong tea, Boh tea, Sabah tea, green tea, and Pu Erh tea. Furthermore, in future, the applied system can also be used in other agricultural products and industries, such as moisture content monitoring for wood board industry.
Author Contributions
Conceptualization, K.Y.Y. and K.S.C.; Methodology, K.Y.Y.; Software, C.Y.L.; Validation, K.Y.L., E.M.C., and Y.S.L.; Formal Analysis, K.Y.Y.; Investigation, K.Y.Y.; Resources, K.S.C. and K.Y.Y.; Data Curation, K.Y.Y. and C.Y.L.; Writing-Original Draft Preparation, K.Y.Y.; Writing-Review & Editing, K.Y.Y.; Visualization, K.Y.Y. and C.Y.L.; Supervision, K.Y.Y.; Project Administration, K.Y.Y. and K.S.C.; Funding Acquisition, K.S.C.
Funding
i-Stone Technology and Research University Grant (GUP) from Universiti Teknologi Malaysia under project number Q.J130000.2523.15H30 and the Ministry of Higher Education of Malaysia (MOHE).
Acknowledgments
This study was supported by i-Stone Technology and Research University Grant (GUP) from Universiti Teknologi Malaysia under project number Q.J130000.2523.15H30 and the Ministry of Higher Education of Malaysia (MOHE). Authors also would like to thank to Kok-San Chan, Shau-Lim Ooi, Tze-Lok Eng, Cha-Heng Toh for their invaluable support.
Conflicts of Interest
The authors declare no conflict of interest.
References
- Chen, A.; Chen, H.Y.; Chen, C.C. Use of temperature and humidity sensors to determine moisture content of Oolong tea. Sensors 2014, 14, 15593–15609. [Google Scholar] [CrossRef] [PubMed]
- Hall, M.N.; Robertson, A.; Scotter, C.N.G. Near-infrared reflectance prediction of quality, theaflavin content and moisture content of black tea. Food Chem. 1988, 27, 61–75. [Google Scholar] [CrossRef]
- Hazarika, D.; Laskar, S.; Sarma, A.; Sarmah, P.K. PC-based instrumentation system for the detection of moisture content of tea leaves at its final stage. IEEE Trans. Instrum. Meas. 2006, 55, 1641–1647. [Google Scholar] [CrossRef]
- Javanmard, M.; Abbas, K.A.; Arvin, F. A microcontroller-based monitoring system for batch tea dryer. J. Agric. Sci. 2009, 1, 101–106. [Google Scholar] [CrossRef]
- Li, X.L.; Xie, C.Q.; He, Y.; Qiu, Z.J.; Zhang, Y.C. Characterizing the moisture content of tea with diffuse reflectance spectroscopy using wavelet transform and multivariate analysis. Sensors 2012, 12, 9847–9861. [Google Scholar] [CrossRef] [PubMed]
- Okamura, S.; Tomita, F. Microwave moisture sensing system in drying process for green tea production. In Proceedings of the Instrumentation and Measurement Technology Conference (IMTC/94), Hamamatsu, Japan, 10–12 May 1994. [Google Scholar]
- Rao, N.; Han, A.T. Research on non-destructive measuring moisture content for packaged tea based on the LC resonant sensor. In Proceedings of the 26th Chinese Control and Decision Conference (2014 CCDC), Changsha, China, 31 May–2 June 2014. [Google Scholar]
- Mizukami, Y.; Sawai, Y.; Yamaguchi, Y. Moisture content measurement of tea leaves by electrical impedance and capacitance. Biosyst. Eng. 2006, 93, 293–299. [Google Scholar] [CrossRef]
- Sinija, V.R.; Mishra, H.N. FTNIR spectroscopic method for determination of moisture content in green tea granules. Food Bioprocess Technol. 2011, 4, 136–141. [Google Scholar] [CrossRef]
- Goudos, S.K. Materials characterization using microwave waveguide system. In Microwave Systems and Applications; IntechOpen: London, UK, 2017; pp. 341–358. [Google Scholar]
- You, K.Y.; You, L.L.; Yue, C.S.; Mun, H.K.; Lee, C.Y. Physical and chemical characterization of rice using microwave and laboratory methods. In Rice; IntechOpen: London, UK, 2017; pp. 81–99. [Google Scholar]
- Jones, T.R.; Zarifi, M.H.; Mojgan, D. Miniaturized quarter-mode substrate integrated cavity resonators for humidity sensing. IEEE Microw. Wirel. Compon. Lett. 2017, 27, 612–614. [Google Scholar] [CrossRef]
- Memon, M.U.; Lim, S.J. Microfluidic high-Q circular substrate-integrated waveguide (SIW) cavity for radio frequency (RF) chemical liquid sensing. Sensors 2018, 18, 143. [Google Scholar] [CrossRef] [PubMed]
- Zarifi, M.H.; Gholidoust, A.; Abdolrazzaghi, M.; Shariaty, P.; Hashisho, Z.; Daneshmand, M. Sensitivity enhancement in planar microwave active-resonator using metal organic framework for CO2 detection. Sens. Actuators B Chem. 2018, 255, 1561–1568. [Google Scholar] [CrossRef]
- Peters, J.; Taute, W.; Döscher, C.; Meier, R.; Höft, M.; Knöchel, R.; Breitkreutz, J. From laboratory-to pilot-scale: Moisture monitoring in fluidized bed granulation by a novel microwave sensor using multivariate calibration approaches. Drug Dev. Ind. Pharm. 2018, 44, 961–968. [Google Scholar] [CrossRef] [PubMed]
- Zhang, Y.J.; Okamura, S. Moisture content measurement for green tea using phase shifts at two microwave frequencies. Subsurf. Sens. Technol. Appl. 2000, 1, 489–496. [Google Scholar] [CrossRef]
- Tein, S.Y.; Then, Y.L.; You, K.Y. Tea leaves moisture measurement and prediction using RF waveguide antenna. In Proceedings of the 2017 Asia Pacific Microwave Conference, Kuala Lumpur, Malaysia, 13–16 November 2017. [Google Scholar]
- Okamura, S.; Zhang, Y.; Tsukamoto, N. A new microstripline-type moisture sensor for heavily wet tea leaves. Meas. Sci. Technol. 2007, 18, 1022–1028. [Google Scholar] [CrossRef]
- Zhang, Y.J.; Okamura, S. A density independent method for high moisture content measurement using microstrip transmission line. J. Microw. Power Electromagn. Energy 2006, 40, 110–118. [Google Scholar] [CrossRef] [PubMed]
- Khaled, D.E.; Novas, N.; Gazquez, J.A.; Garcia, R.M.; Agugliaro, F.M. Fruit and vegetable quality assessment via dielectric sensing. Sensors 2015, 15, 15363–15397. [Google Scholar] [CrossRef] [PubMed]


© 2018 by the authors. Licensee MDPI, Basel, Switzerland. This article is an open access article distributed under the terms and conditions of the Creative Commons Attribution (CC BY) license (http://creativecommons.org/licenses/by/4.0/).