Abstract
The studied Ce0.5Y0.5−XTbXF3 (X = 0, 0.001, 0.002, 0.005, 0.01, and 0.05) nanoparticles were synthesized via the water-based co-precipitation method. All the samples demonstrated diameters in the 17–20 nm range and a hexagonal phase corresponding to the phase of CeF3. Under 266 nm excitation (4f–5d absorption band of Ce3+), the luminescence spectrum shape was notably dependent on temperature. The integrated luminescence intensity ratio (LIR) of Ce3+ and Tb3+ (5D4–7F3) peaks was chosen as a temperature-dependent parameter. It was shown that the LIR functions linearly decay. The rate of decay decreases with the increase in Tb3+ concentration. This was explained by the fact that in the case of low Tb3+ concentrations, the spectral temperature dependence is mostly based on effective thermal quenching of Ce3+ luminescence. At higher Tb3+ concentrations, there is a higher probability of Ce3+ to Tb3+ energy transfer. Here, the efficiency of the temperature dependence of this process is lower, and the rate of LIR decay is lower as well.
1. Introduction
Luminescence temperature sensing is a very powerful tool to measure the temperature of small objects (micro-devices, parts of microcircuits, living cells, etc.) with high spatial resolution. In this method, temperature-dependent parameters of the luminescence of special phosphors are analyzed [1,2,3,4]. Among a huge variety of organic and inorganic phosphors, rare earth-doped fluoride nanoparticles play a very important role due to a lack of photobleaching, bright luminescence, high mechanical and chemical stability, and low cytotoxicity [5,6,7,8]. In particular, Pr3+ [9], Dy3+ [10], and Er3+ [11] phosphors have been successfully utilized as luminescence temperature sensors due to the presence of thermally coupled electron levels. Here, the temperature sensitivity depends on an energy gap between these thermally coupled levels. However, it is almost impossible to affect the value of the energy gap because of the shielded nature of the rare earth ion f-electron shell. An approach allowing this limitation to be overcome is the use of double-doped phosphors. In this approach, the temperature-dependent energy transfer efficiency between donor and acceptor ions plays a crucial role in the temperature sensitivity of the luminescence (for f-f luminescence). For example, there are Tm3+/Yb3+ [12], Nd3+/Yb3+ [13], Pr3+/Yb3+, and Er3+/Yb3+ [14] down-conversion systems. However, this approach also has some limitations, including the spectral overlap of donor and acceptor and back energy transfer from acceptor to donor, which smooths the sensitivity [15].
It seems that the more efficient method of increasing the sensitivity is the use of double-doped phosphors, where the donor is excited via an allowed 4f–5d transition and the acceptor demonstrates f-f luminescence [16,17]. Here, an interesting example is Ce3+/Tb3+-doped phosphors. Indeed, the Ce3+ ion has a 4f1 configuration and demonstrates UV or blue luminescence due to the 5d–4f allowed transition. In turn, Tb3+ demonstrates bright f-f luminescence in the visible part of the spectrum due to transitions from the excited 5D3 and 5D4 states to the lower 7FJ (J = 0–6) ones. The Ce3+–Tb3+ energy transfer processes are described in [18,19]. Here, the luminescence intensity ratio (LIR) of Ce3+ and Tb3+ luminescence peaks is a temperature-dependent parameter due to the different thermal quenching efficiencies of Ce3+ and Tb3+. However, it seems that the physical mechanism of the luminescence of Ce3+/Tb3+-doped phosphors is more complicated due to the presence of Ce3+–Tb3+ energy transfer, Tb3+ multiphonon relaxation (5D3–5D4), and the cross-relaxation of Tb3+ [20]. It should also be noted that Ce3+/Tb3+ based phosphors are highly necessary in imaging technologies and the light-emitting diode industry [21,22,23,24].
In our previous works, we studied the spectral kinetic characteristics of CeF3-TbF3-YF3 nanoparticles, as considered here, in the ~300–500 K temperature range. Here, we perform a spectral characterization of the samples in the lower 80–320 K temperature range [20].
One of the main novelties of this work is that here we consider a double-doped system (Ce3+/Tb3+), where the donor ion (Ce3+) is optically excited via 4f–5d transition. This class of materials is significantly less studied compared to double-doped materials excited via f-f transitions (Nd3+/Yb3+, Tm3+/Yb3+, etc.). Due to the high sensitivity of 5d electrons to the surroundings, this class of materials has potentially higher temperature sensitivities. No less important is that we consider several samples having different Tb3+ concentrations in order to manipulate and maximize the thermometer performances.
The objective of this paper was to study the physical mechanism of the luminescence temperature sensitivity of the synthesized CeF3-TbF3-YF3 nanoparticles in the ~80–320 K temperature range.
2. Results
2.1. Physical Characterization of the Samples
The TEM image of Ce0.5Y0.49Tb0.01F3 nanoparticles is presented in Figure 1. It can be seen that the synthesized particles are not perfectly spherical. In addition, the Tb3+ concentration does not affect the nanoparticle morphology.
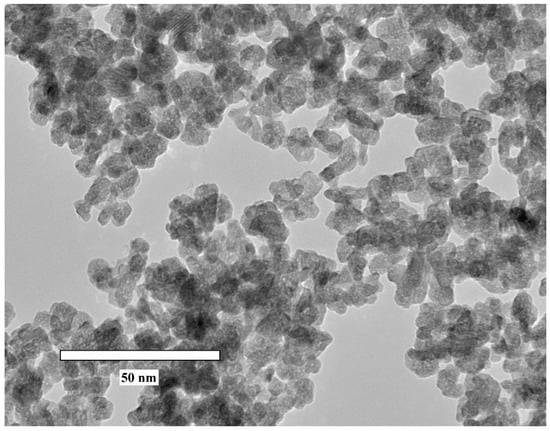
Figure 1.
TEM image of Ce0.5Y0.49Tb0.01F3 nanoparticles (magnification ×300 k).
The size distribution histogram is presented in Figure 2.
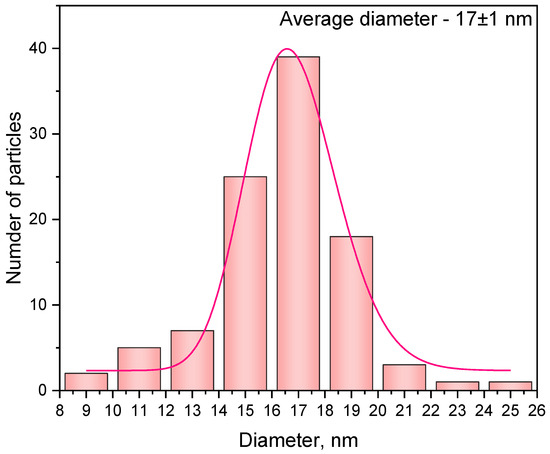
Figure 2.
Size distribution diagram of Ce0.5Y0.49Tb0.01F3 nanoparticles approximated by LogNormal function.
The average diameter of the samples is in the 17−19 nm range. The XRD patterns of the samples are presented in Figure 3.
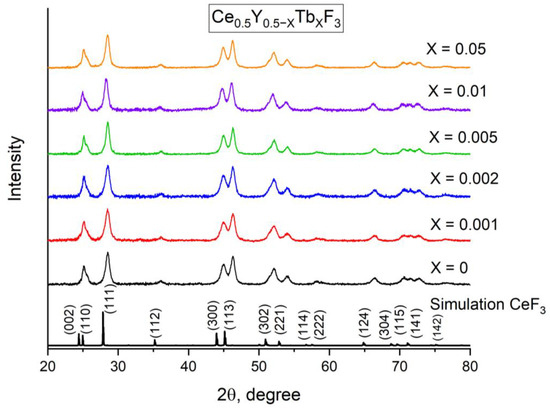
Figure 3.
XRD patterns of the Ce0.5Y0.5−XTbXF3 (X = 0, 0.001, 0.002, 0.005, 0.01, and 0.05) nanoparticles. The simulation was performed for CeF3 because of the samples.
It can be seen that all the samples demonstrate a hexagonal phase corresponding to the CeF3 host (COD ID—1011350, Space group P63/mcm). The impurity peaks and amorphous phase were not detected. We calculated the sizes of the coherent stuttering domain (CSD) according to the well-known Scherrer equation [25]:
where K is a shape-factor (we took 0.94 as the value); λ—X-ray wavelength (Kα = 0.154 nm); β—full width at half maximum (FWHM); and θ is an angle extracted from the 2θ peak position. In addition, we calculated the lattice parameters. All the calculated values are listed in Table 1.

Table 1.
Structural parameters of the samples depending on the Tb3+ concentration (X). Here. 2θ is an XRD peak position; FWHM—full width at half maximum; CSD—coherent stuttering domain; d is a physical diameter obtained from the TEM image.
It can be seen that the peak position weakly depends on Tb3+ content, probably because Tb3+ and Y3+ have similar ionic radii. The CSD sizes are slightly smaller than the physical diameters (d). This can be explained by the fact that the Scherrer equation takes into consideration size effects only. However, in the obtained samples, Ce3+ and Y3+ have different ionic radii, and the samples probably contain tensions. These tensions, additionally, broaden the XRD peaks. The room temperature luminescence spectra of the Ce0.5Y0.5−XTbXF3 (X = 0.001; 0.002; 0.005; 0.01; 0.05) samples are presented in Figure 4. The spectra are normalized at the 544 nm peak of Tb3+. The 266 nm excitation wavelength corresponds to the 4f–5d absorption band of Ce3+.
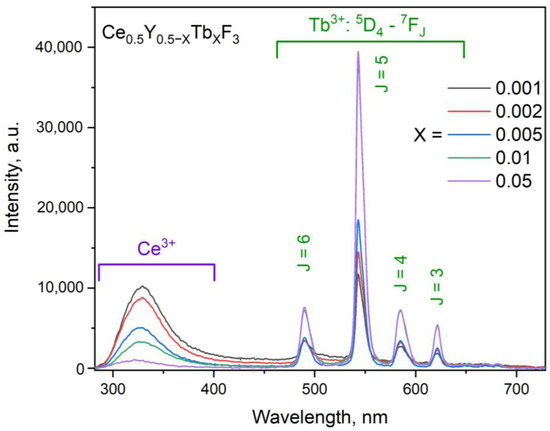
Figure 4.
The room temperature luminescence spectra of the Ce0.5Y0.5−XTbXF3 (X = 0.001; 0.002; 0.005; 0.01; 0.05) nanoparticles. The 266 nm excitation wavelength corresponds to the 4f–5d absorption band of Ce3+.
All the luminescence peaks were interpreted as radiative transitions from the excited states of both Ce3+ and Tb3+. In particular, four intense 5D4–7FJ (J = 6, 5, 4, and 3) Tb3+ peaks are clearly observed. The intensity of Tb3+ peaks increases with the increase in its concentration. Finally, it can be concluded that the synthesized samples are 17–21 nm nanoparticles in diameter. The nanoparticles demonstrated the expected hexagonal phase. Impurity peaks and the amorphous phase were not detected. The luminescence spectra show the presence of both Ce3+ and Tb3+ peaks.
2.2. Temperature-Dependent Spectral Characterization of the Samples
The normalized at 266 nm luminescence spectra of Ce0.5Y0.5−XTbXF3 (X = 0) (without Tb3+) under 266 nm excitation (4f–5d absorption band of Ce3+ ions) are presented in Figure 5. The spectra were recorded in the 80–320 K temperature range.
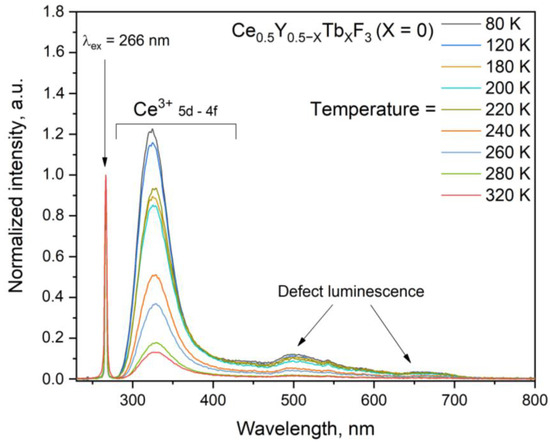
Figure 5.
Luminescence spectra of Ce0.5Y0.5−XTbXF3 (X = 0) (without Tb3+) under 266 nm excitation (4f–5d absorption band of Ce3+ ion) in the 80–320 K temperature range. The spectra are normalized at 266 nm excitation wavelength.
It can be seen that the Ce3+ luminescence significantly decreases with the increase in temperature compared to excitation. There is also a broadband luminescence in the approximately 450–600 nm spectral range. This broadband luminescence can be ascribed to defects. It should also be noted that the intensity of this broadband luminescence sharply decreases with the temperature increase. The normalized integrated intensity values of the Ce3+ peak of Ce0.5Y0.5−XTbXF3 (X = 0) (without Tb3+) in the 80–320 K temperature range are presented in Figure 6. Note that integrated intensities were calculated according to Figure 5.
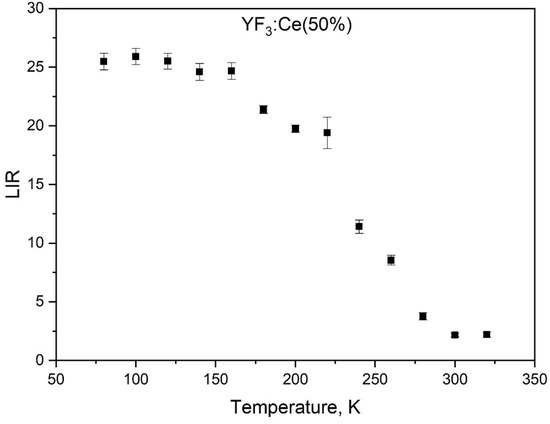
Figure 6.
The normalized at 266 nm excitation wavelength integrated intensity values of the Ce3+ peak of Ce0.5Y0.5−XTbXF3 (X = 0) (without Tb3+) in the 80–320 K temperature range.
As Figure 7 shows, the Ce3+ intensity weakly decreases in the 80–150 K range, and then sharply decreases from ~150 to 320 K (note that the LIR does not have units). The mechanism of Ce3+ luminescence thermal quenching is complex and described in the literature [26,27]. It can be explained by the conventional configurational coordinate diagram (Figure 7).
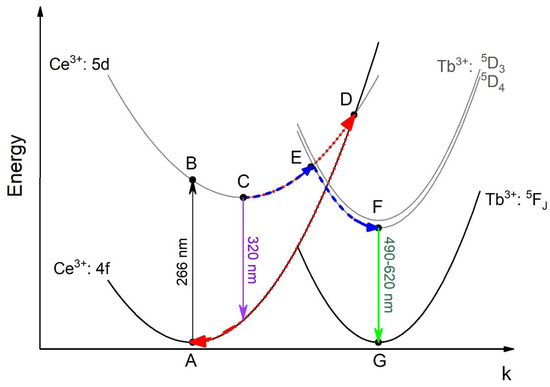
Figure 7.
The configurational coordinate diagram of the ground states and the excited states of Ce3+ and Tb3+.
There is an activation energy for the Ce3+ luminescence quenching process. Suggestively, this energy corresponds to a temperature around 150 K, after which the efficiency of Ce3+ quenching increases sharply. In particular, the lift part of the 5d curve of Ce3+ only has one crossing point D (Figure 7), which is the crossing point of the excited and ground state of Ce3+. The increase in the environmental temperature gives excited electrons the extra energy to move from C to D. The quantity of electrons in D increases, which allows more electrons to return to the ground state non-radiatively through the path ABCDA. In the case of Ce3+/Tb3+ ion pairs, the temperature dependence of the spectral characteristics is more complicated. The normalized at 544 nm (Tb3+ peak) luminescence spectra of Ce0.5Y0.5−XTbXF3 (X = 0.001, 0.002, 0.005, 0.01, and 0.05) nanoparticles detected in the 80–320 K temperature range are presented in Figure 8a–e, respectively.
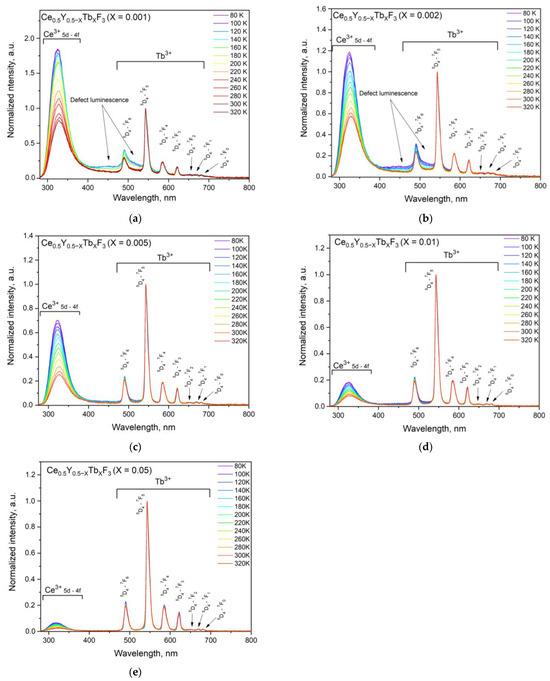
Figure 8.
Normalized at 544 nm (Tb3+ peak) luminescence spectra of Ce0.5Y0.5−XTbXF3 (X = 0.001 (a), 0.002 (b), 0.005 (c), 0.01 (d), and 0.05 (e)) nanoparticles detected in the 80–320 K temperature range.
It can be seen that the shape of the spectra notably depends on temperature. The relative change in Ce3+ and Tb3+ intensities takes place. In particular, the Ce3+ intensity gradually decreases with the increase in Tb3+ concentration (Figure 8a–e). On the other hand, the above-mentioned broadband luminescence is also observed for Ce0.5Y0.5−XTbXF3 (X = 0.001 and 0.002) samples. The same broadband we observed in [25]. The difference in broadband intensities for different samples can be explained by the intense Tb3+ luminescence compared to the broadband intensity. In order to realize the ratiometric luminescence thermometry approach, the luminescence intensity ratio (LIR) of Ce3+ and Tb3+ peaks should be calculated. However, this broadband can be a notable drawback for the LIR calculation. In turn, the broadband does not affect the Tb3+ peak at 621 nm corresponding to the 5D4–7F3 transition. Thus, we calculated the LIR of Ce3+ (250–350 nm) and Tb3+ (615–625 nm). The LIR functions are presented in Figure 9.
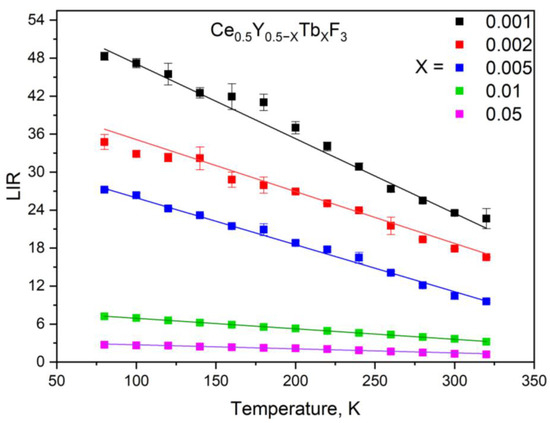
Figure 9.
The LIR function of the Ce0.5Y0.5−XTbXF3 (X = 0, 0.001, 0.002, 0.005, 0.01, and 0.05) nanoparticles in the 80–320 K temperature range. The LIR is calculated for the Ce3+ (250–350 nm) and Tb3+ (615–625 nm) luminescence peaks.
As Figure 9 shows, all the LIR functions decrease with the increase in temperature. In addition, the decay rate of the LIR functions decreases with the increase in temperature. It can be seen that the decay rates of two samples, Ce0.5Y0.5−XTbXF3 (X = 0 and 0.001) without Tb3+ and with the lowest concentration, demonstrated almost the same decay rate. Particularly, Δ = LIR (80 K) − LIR (320 K) = ~30. Indeed, the Ce3+ thermal quenching is highly efficient due to efficient electron–phonon coupling. Hence, the Ce3+ intensity in Ce0.5Y0.5−XTbXF3 (X = 0, without Tb3+) can operate as a luminescent thermometer based on the analysis of intensity. However, this approach is not reliable because the luminescence intensity also depends on the fluctuation of excitation power. Here, the double-doped ratiometric Ce3+/Tb3+ systems are independent of this disadvantage.
The decreasing character of the LIR functions can be explained by the different efficiencies of Ce3+ and Tb3+ thermal luminescence quenching. Indeed, as was mentioned above, due to the 5d–4f nature of Ce3+ luminescence, it has stronger electron–phonon coupling compared to Tb3+ f–f luminescence. However, the decay rates of the LIR functions notably depend on the Tb3+ concentration. Specifically, the rate decreases with the increase of Tb3+ concentration. Discussion of the obtained results necessitates an analysis of the chemical composition. Indeed, the chemical composition of the studied samples is complex. As was mentioned above, since the phase of the sample corresponds to CeF3, both Y3+ and Tb3+ substitute Ce3+ positions. In the case of the samples with lower Tb3+ concentrations (Ce0.5Y0.5−XTbXF3 (X = 0.001, 0.002, 0.005), it can be suggested that the majority of Ce3+ ions do not interact with Tb3+ ones. Hence, we observe the luminescence of “pure” Ce3+ without interaction with Tb3+, and the luminescence of Ce3+ that is in contact with Tb3+. In the case of Tb3+ luminescence, the Tb3+ excitation goes through ABEFG path (Figure 7). Finally, the dependence of LIR functions on Tb3+ content can be explained by the competition between the more temperature-dependent ABDA (Ce3+ thermal quenching) and the less temperature-dependent ABEFG paths. In order to obtain the quantity characteristic of the obtained samples, we calculated relative temperature sensitivity plots according to the convenient equation below:
The Sr plots are presented in Figure 10.
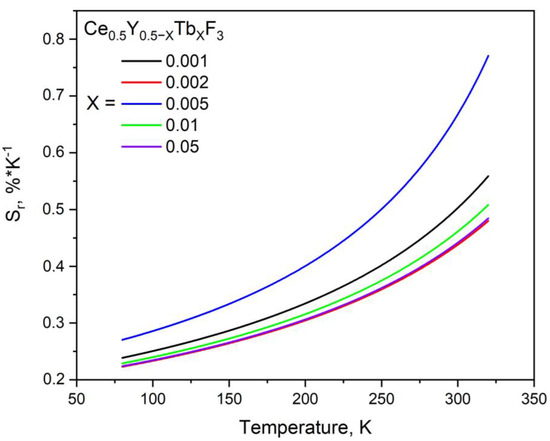
Figure 10.
Sr plots of the Ce0.5Y0.5−XTbXF3 (X = 0, 0.001, 0.002, 0.005, 0.01, and 0.05) nanoparticles in the 80–320 K temperature range.
One of the most important characteristics is temperature uncertainty. This performance is determined as follows:
where σ(LIR) is the standard deviation, T0 is the temperature at which uncertainty was calculated by repetitive measurements (8 times), and Sr is the relative temperature sensitivity [%·K−1]. Since the LIR functions are linear, the temperature uncertainty values are constant in the whole temperature range. In particular, δT (X = 0.001) ≈ 0.05 K, δT (X = 0.002) ≈ 0.07 K, δT (X = 0.005) = 0.07766 ≈ 0.08 K, δT (X = 0.01) ≈ 0.35 K, and δT (X = 0.05) ≈ 0.90 K. It can be seen that we achieved competitive values. In particular, the maximum Sr was around 0.7%/K at 300 K. In turn, the LaOBr:Ce3+/Tb3+ exhibited Sr = 0.4 at 300 K [27]. In turn, LiScSiO4: Ce3+/Tb3+ showed Sr around 0.5 at 300 K [28]. The interesting material YBO3: Ce3+/Tb3+ showed a linear increase in the Sr from 0.41 (at 290 K) to 0.5%/K (at 330 K) [29]. Finally, Ce3+/Tb3+ in the fluoride host of Na1.5Y2.5F9 demonstrated Sr around 0.5%/K ar 300 K. The majority of the papers do not deal with concentration series.
3. Materials and Methods
The studied Ce0.5Y0.5−XTbXF3 (X = 0, 0.001, 0.002, 0.005, 0.01, and 0.05) nanoparticles were synthesized via the water-based co-precipitation method. The synthesis procedure is described in our previous work [20]. The morphology of the samples (shape and average diameter) was studied by means of transmission electron microscopy (TEM) using a Hitachi HT7700 Exalens transmission electron microscope (Tokyo, Japan). The phase composition of Ce0.5Y0.5−XTbXF3 was investigated via the X-ray diffraction (XRD) method (Bruker D8 X-ray diffractometer (conventional Cu Kα radiation at 0.154 nm)) (Billerica, MA, USA). The XRD simulation was carried out using VESTA software, version 3 (Ibaraki, Japan). The schematic diagram of the experimental setup for measuring the luminescent properties of the nanoparticles is shown in Figure 11.

Figure 11.
Schematic diagram of the experimental setup.
The luminescence excitation was carried out via a 266 nm pulse laser (the 4th harmonic of the YAG:Nd laser from Lotis TII LS-2147, Lotis Tii, Minsk, Belarus). Pulse duration and pulse repetition were 10 ns and 10 Hz, respectively). The photoinduced luminescence spectra of Ce0.5Y0.5−XTbXF3 were recorded using the EPP2000, StellarNet spectrometer (Tampa, FL, USA) (~0.5–1.0 nm spectral resolution). We kept the same integration time of 3 s. The spectral characterization was carried out in the 80–320 K temperature range via the so-called “cold finger” method. The control of temperature was performed via “CRYO industries” thermostatic cooler equipped with the LakeShore Model 325 temperature controller (Lake Shore Cryotronics, Inc., Westerville, OH, USA). The temperature setting accuracy was 0.2 K according to the description. Liquid nitrogen was used as a cooling agent. The samples were deposited as a thin layer onto a copper substrate and subsequently loaded into a cryostat. All the calculations were carried out using the Origin Pro 9.0 software.
4. Conclusions
The studied Ce0.5Y0.5−XTbXF3 (X = 0, 0.001, 0.002, 0.005, 0.01, and 0.05) nanoparticles were synthesized via the water-based co-precipitation method. All the samples demonstrated diameters in the 17–20 nm range. The nanoparticles exhibited the expected hexagonal phase corresponding to the phase of CeF3. Under 266 nm excitation (4f–5d absorption band of Ce3+), the luminescence peaks of both Ce3+ (5d–4f) and Tb3+ (5D4–7FJ, J = 3, 4, 5, and 6) were clearly observed. Spectral characterization of the samples showed that the samples’ luminescence spectral shape was notably dependent on temperature. The integrated luminescence intensity ratio (LIR) of the Ce3+ and Tb3+ (5D4–7F3) peaks was chosen as a temperature-dependent parameter. It was shown that the LIR functions linearly decay. However, the rate of decay decreases with the increase of Tb3+ concentration. This was explained by the fact that in the case of low Tb3+ concentrations, the spectral temperature dependence is mostly based on the effective thermal quenching of Ce3+ luminescence. At higher Tb3+ concentrations, there is a higher probability of Ce3+ to Tb3+ energy transfer. Here, the efficiency of the temperature dependence of this process is lower, and the rate of LIR decay is lower as well.
Author Contributions
Conceptualization, investigation, data curation, and writing—original draft preparation—M.P. and S.K.; project administration and funding—M.P. All authors have read and agreed to the published version of the manuscript.
Funding
The research was funded by the subsidy allocated to Kazan Federal University for the state assignment in the sphere of scientific activities (FZSM-2025-0004).
Data Availability Statement
The original contributions presented in the study are included in the article; further inquiries can be directed to the corresponding author.
Conflicts of Interest
The authors declare no conflicts of interest.
References
- Brites, C.D.; Marin, R.; Suta, M.; Carneiro Neto, A.N.; Ximendes, E.; Jaque, D.; Carlos, L.D. Spotlight on luminescence thermometry: Basics, challenges, and cutting-edge applications. Adv. Mater. 2023, 35, 2302749. [Google Scholar] [CrossRef]
- Santos, E.P.; Pugina, R.S.; Hilário, E.G.; Carvalho, A.J.; Jacinto, C.; Rego-Filho, F.A.; Canabarro, A.; Gomes, A.S.; Caiut, J.M.A.; Moura, A.L. Towards accurate real-time luminescence thermometry: An automated machine learning approach. Sens. Actuators A Phys. 2023, 362, 114666. [Google Scholar] [CrossRef]
- Dramićanin, M.D. Trends in luminescence thermometry. J. Appl. Phys. 2020, 128, 040902. [Google Scholar] [CrossRef]
- Brites, C.D.S.; Millán, A.; Carlos, L.D. Lanthanides in luminescent thermometry. In Handbook on the Physics and Chemistry of Rare Earths; Elsevier: Amsterdam, The Netherlands, 2016; Volume 49, pp. 339–427. [Google Scholar] [CrossRef]
- Pudovkin, M.S.; Zelenikhin, P.V.; Shtyreva, V.V.; Evtugyn, V.G.; Salnikov, V.V.; Nizamutdinov, A.S.; Semashko, V.V. Cellular uptake and cytotoxicity of unmodified Pr3+: LaF3 nanoparticles. J. Nanoparticle Res. 2019, 21, 184. [Google Scholar] [CrossRef]
- Fedorov, P.P.; Luginina, A.A.; Kuznetsov, S.V.; Osiko, V.V. Nanofluorides. J. Fluor. Chem. 2011, 132, 1012–1039. [Google Scholar] [CrossRef]
- Rahman, P.; Green, M. The synthesis of rare earth fluoride based nanoparticles. Nanoscale 2009, 1, 214–224. [Google Scholar] [CrossRef] [PubMed]
- Pudovkin, M.S.; Shamsutdinov, N.I.; Zelenikhin, P.V.; Nizamutdinov, A.S. Transmission electron microscopy and flow cytometry study of cellular uptake of unmodified Pr3+: LaF3 nanoparticles in dynamic. J. Nanoparticle Res. 2021, 23, 124. [Google Scholar] [CrossRef]
- Zhou, S.; Jiang, G.; Wei, X.; Duan, C.; Chen, Y.; Yin, M. Pr3+-Doped β-NaYF4 for temperature sensing with fluorescence intensity ratio technique. J. Nanosci. Nanotechnol. 2014, 14, 3739–3742. [Google Scholar] [CrossRef] [PubMed]
- Bu, Y.Y.; Cheng, S.J.; Wang, X.F.; Yan, X.H. Optical thermometry based on luminescence behavior of Dy3+-doped transparent LaF3 glass ceramics. Appl. Phys. A 2015, 121, 1171–1178. [Google Scholar] [CrossRef]
- Jia, M.; Sun, Z.; Lin, F.; Hou, B.; Li, X.; Zhang, M.; Wang, H.; Xu, Y.; Fu, Z. Prediction of thermal-coupled thermometric performance of Er3+. J. Phys. Chem. Lett. 2019, 10, 5786–5790. [Google Scholar] [CrossRef]
- Khadiev, A.R.; Korableva, S.L.; Ginkel, A.K.; Morozov, O.A.; Nizamutdinov, A.S.; Semashko, V.V.; Pudovkin, M.S. Down-conversion based Tm3+: LiY1−XYbXF4 temperature sensors. Opt. Mater. 2022, 134, 113118. [Google Scholar] [CrossRef]
- Pudovkin, M.; Oleynikova, E.; Kiiamov, A.; Cherosov, M.; Gafurov, M. Nd3+, Yb3+: YF3 optical temperature nanosensors operating in the biological windows. Materials 2022, 16, 39. [Google Scholar] [CrossRef]
- Kaczmarek, A.M.; Kaczmarek, M.K.; Van Deun, R. Er3+-to-Yb3+ and Pr3+-to-Yb3+ energy transfer for highly efficient near-infrared cryogenic optical temperature sensing. Nanoscale 2019, 11, 833–837. [Google Scholar] [CrossRef] [PubMed]
- Maciejewska, K.; Bednarkiewicz, A.; Marciniak, L.N.I.R. NIR luminescence lifetime nanothermometry based on phonon assisted Yb3+–Nd3+ energy transfer. Nanoscale Adv. 2021, 3, 4918–4925. [Google Scholar] [CrossRef]
- Dai, W.; Hu, J.; Liu, G.; Xu, S.; Huang, K.; Zhou, J.; Xu, M. Thermometer of stable SrAl2Si2O8: Ce3+, Tb3+ based on synergistic luminescence. J. Lumin. 2020, 217, 116807. [Google Scholar] [CrossRef]
- Ding, M.; Lu, C.; Chen, L.; Ji, Z. Ce3+/Tb3+ co-doped β-NaYF4 dual-emitting phosphors for self-referencing optical thermometry. J. Alloys Compd. 2018, 763, 85–93. [Google Scholar] [CrossRef]
- Chiriu, D.; Stagi, L.; Carbonaro, C.M.; Corpino, R.; Ricci, P.C. Energy transfer mechanism between Ce and Tb ions in sol-gel synthesized YSO crystals. Mater. Chem. Phys. 2016, 171, 201–207. [Google Scholar] [CrossRef]
- Ke, L.; Jiang, Y.; Cai, X.; Nie, Z.; Wei, D.; Xu, Y.; Zhang, Y. Color tunable emission and enhance green light emission in oxyfluoride glass ceramics containing Ce3+/Tb3+: Na5Y9F32 nanocrystals. J. Mater. Sci. Mater. Electron. 2024, 35, 536. [Google Scholar] [CrossRef]
- Pudovkin, M.S.; Kalinichenko, S.I.; Nizamutdinov, A.S. CeF3-TbF3-YF3 nanoparticles for ratiometric temperature sensing. Opt. Mater. 2024, 148, 114831. [Google Scholar] [CrossRef]
- Solodov, A.N.; Shayimova, J.R.; Gataullina, R.M.; Zagidullin, A.A.; Amirov, R.R.; Leontyev, A.V.; Shmelev, A.G.; Nurtdinova, L.A.; Nikiforov, V.G.; Saifina, A.F.; et al. Hydrophilization of Core-Shell NaYF4: Yb/Er@ NaGdF4: Ce/Tb Nanostructures Using Polyethylenimine for Multimodal Imaging. Colloids Surf. A Physicochem. Eng. Aspects 2025, 721, 137183. [Google Scholar] [CrossRef]
- Zhao, Y.; Zheng, Z.; Li, Z.; Shi, Z.; Song, Y.; Zou, B.; Zou, H. Ba3Lu (BO3)3: Ce3+, Tb3+/Mn2+: Dual-functional material for WLEDs and optical pressure sensing. Inorg. Chem. 2024, 63, 4288–4298. [Google Scholar] [CrossRef]
- Solodov, A.N.; Zimin, K.; Gataullina, R.M.; Zagidullin, A.A.; Leontyev, A.V.; Shmelev, A.G.; Nurtdinova, L.A.; Nikiforov, V.G.; Khasanov, O.K.; Amirova, L.M.; et al. Fluorescent polymer composites based on core-shell NaYF4: Yb/Er@ NaGdF4: Ce/Tb structures for temperature monitoring and anti-counterfeiting protection. Opt. Mater. 2025, 159, 116511. [Google Scholar] [CrossRef]
- Li, X.B.; Dai, W.B.; Nie, K.; Li, S.P.; Xu, M. Investigation on optical properties of borate Sr3Y2B4O12: Ce/Tb/Sm and its application in wLEDs. J. Lumin. 2023, 263, 120038. [Google Scholar] [CrossRef]
- Pudovkin, M.S.; Koryakovtseva, D.A.; Lukinova, E.V.; Korableva, S.L.; Khusnutdinova, R.S.; Kiiamov, A.G.; Nizamutdinov, A.S.; Semashko, V.V. Characterization of Pr-Doped LaF3 Nanoparticles Synthesized by Different Variations of Coprecipitation Method. J. Nanomater. 2019, 2019, 7549325. [Google Scholar] [CrossRef]
- Lin, Y.C.; Bettinelli, M.; Karlsson, M. Unraveling the mechanisms of thermal quenching of luminescence in Ce3+-doped garnet phosphors. Chem. Mater. 2019, 31, 3851–3862. [Google Scholar] [CrossRef]
- Zhang, X.; Wu, Z.C.; Mo, F.; Li, N.; Guo, Z.; Zhu, Z. Insight into temperature-dependent photoluminescence of LaOBr: Ce3+, Tb3+ phosphor as a ratiometric and colorimetric luminescent thermometer. Dye. Pigment. 2017, 145, 476–485. [Google Scholar] [CrossRef]
- Wu, Q.; Zhou, X.; Ye, S.; Ding, J. Visual ratiometric optical thermometer with high sensitivity and excellent signal discriminability based on LiScSiO4: Ce3+, Tb3+ thermochromic phosphor. Spectrochim. Acta Part A Mol. Biomol. Spectrosc. 2023, 294, 122534. [Google Scholar] [CrossRef] [PubMed]
- Li, M.; You, F.; Liang, C.; He, Z. Ratiometric thermal sensing based on dual emission of YBO3: Ce3+, Tb3+. J. Alloys Compd. 2020, 833, 155011. [Google Scholar] [CrossRef]
Disclaimer/Publisher’s Note: The statements, opinions and data contained in all publications are solely those of the individual author(s) and contributor(s) and not of MDPI and/or the editor(s). MDPI and/or the editor(s) disclaim responsibility for any injury to people or property resulting from any ideas, methods, instructions or products referred to in the content. |
© 2025 by the authors. Licensee MDPI, Basel, Switzerland. This article is an open access article distributed under the terms and conditions of the Creative Commons Attribution (CC BY) license (https://creativecommons.org/licenses/by/4.0/).