
Assessing the Impacts of Aquaculture Soundscapes on the Growth, Physiology and Behavior of Micropterus salmoides


 , ,
, , 
Abstract

1. Introduction
2. Materials and Methods
2.1. Fish
2.2. Experimental System Setup
2.3. Experimental Design
2.4. Data Collection and Analysis
2.4.1. Growth
2.4.2. Physiological Performance
2.4.3. Behavioral Traits
2.4.4. Data Analysis
3. Results
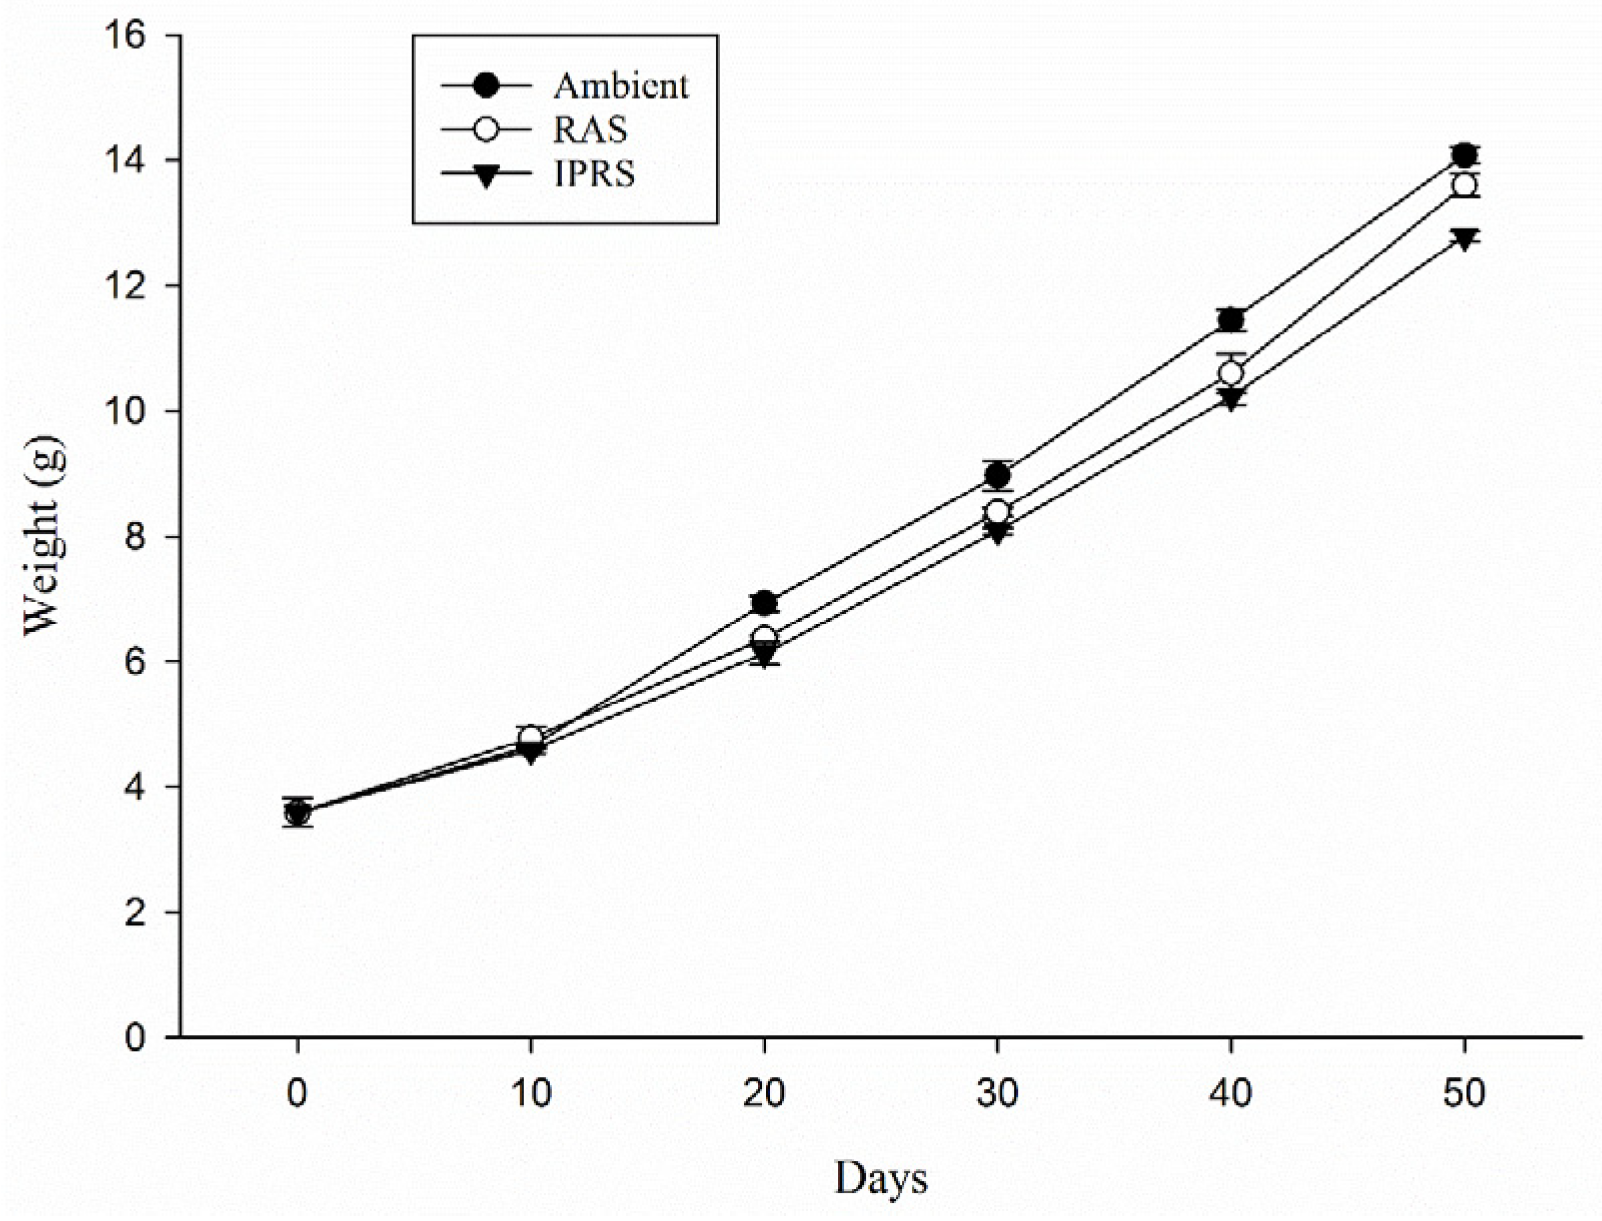
3.1. Growth
3.2. Physiological Performance
3.3. Behavior
4. Discussion
4.1. Fish Growth
4.2. Physiological Performance
4.3. Schooling Ability
5. Conclusions
Author Contributions
Funding
Institutional Review Board Statement
Data Availability Statement
Acknowledgments
Conflicts of Interest
References
- Ahmed, N.; Thompson, S.; Glaser, M. Global aquaculture productivity, environmental sustainability, and climate change adaptability. Environ. Manag. 2019, 63, 159–172. [Google Scholar] [CrossRef]
- Delgado, C.L.; Wada, N.; Rosegrant, M.W.; Meijer, S.; Ahmed, M. Outlook for Fish to 2020: Meeting Global Demand; Food Policy Report; International Food Policy Research Institute: Washington, DC, USA, 2003; Volume 15. [Google Scholar]
- Beveridge, M.C.M.; Phillips, M.J.; Macintosh, D.J. Aquaculture and the environment: The supply of and demand for environmental goods and services by Asian aquaculture and the implications for sustainability. Aquac. Res. 1997, 28, 797–807. [Google Scholar] [CrossRef]
- Islam, M.; Yasmin, R. Impact of aquaculture and contemporary environmental issues in Bangladesh. Int. J. Fish. Aquat. Stud. 2017, 5, 100–107. [Google Scholar]
- Reid, A.J.; Carlson, A.K.; Creed, I.F.; Eliason, E.J.; Gell, P.A.; Johnson, P.T.; Kidd, K.A.; MacCormack, T.J.; Olden, J.D.; Ormerod, S.J.; et al. Emerging threats and persistent conservation challenges for freshwater biodiversity. Biol. Rev. 2019, 94, 849–873. [Google Scholar] [CrossRef] [PubMed]
- Quiñones, R.A.; Fuentes, M.; Montes, R.M.; Soto, D.; León-Muñoz, J. Environmental issues in Chilean salmon farming: A review. Rev. Aquac. 2019, 11, 375–402. [Google Scholar] [CrossRef]
- Hawkins, A.D.; Pembroke, A.E.; Popper, A.N. Information gaps in understanding the effects of noise on fishes and invertebrates. Rev. Fish Biol. Fish. 2015, 25, 39–64. [Google Scholar] [CrossRef]
- Hatch, L.; Wahle, C.; Gedamke, J.; Harrison, J.; Laws, B.; Moore, S.; Stadler, J.; Van Parijs, S. Can you hear me here? Managing acoustic habitat in US waters. Endanger. Species Res. 2016, 30, 171–186. [Google Scholar] [CrossRef]
- Fantini-Hoag, L.; Hanson, T.; Chappell, J. Production trials of in-pond raceway system growing stocker and foodsize hybrid Catfish plus Nile tilapia. Aquaculture 2022, 561, 738582. [Google Scholar] [CrossRef]
- Badiola, M.; Mendiola, D.; Bostock, J. Recirculating Aquaculture Systems (RAS) analysis: Main issues on management and future challenges. Aquac. Eng. 2012, 51, 26–35. [Google Scholar] [CrossRef]
- Hang, S.; Zhao, J.; Ji, B.; Li, H.; Zhang, Y.; Peng, Z.; Zhou, F.; Ding, X.; Ye, Z. Impact of underwater noise on the growth, physiology and behavior of Micropterus salmoides in industrial recirculating aquaculture systems. Environ. Pollut. 2021, 291, 118152. [Google Scholar] [CrossRef]
- Filiciotto, F.; Cecchini, S.; Buscaino, G.; Maccarrone, V.; Piccione, G.; Fazio, F. Impact of aquatic acoustic noise on oxidative status and some immune parameters in gilthead sea bream Sparus aurata (Linnaeus, 1758) juveniles. Aquac. Res. 2017, 48, 1895–1903. [Google Scholar] [CrossRef]
- Wysocki, L.E.; Davidson, J.W., III; Smith, M.E.; Frankel, A.S.; Ellison, W.T.; Mazik, P.M.; Popper, A.N.; Bebak, J. Effects of aquaculture production noise on hearing, growth, and disease resistance of rainbow trout Oncorhynchus mykiss. Aquaculture 2007, 272, 687–697. [Google Scholar] [CrossRef]
- Davidson, J.; Bebak, J.; Mazik, P. The effects of aquaculture production noise on the growth, condition factor, feed conversion, and survival of rainbow trout, Oncorhynchus mykiss. Aquaculture 2009, 288, 337–343. [Google Scholar] [CrossRef]
- Anderson, P.A.; Berzins, I.K.; Fogarty, F.; Hamlin, H.J.; Guillette, L.J., Jr. Sound, stress, and seahorses: The consequences of a noisy environment to animal health. Aquaculture 2011, 311, 129–138. [Google Scholar] [CrossRef]
- Bart, A.N.; Clark, J.; Young, J.; Zohar, Y. Underwater ambient noise measurements in aquaculture systems: A survey. Aquac. Eng. 2001, 25, 99–110. [Google Scholar] [CrossRef]
- Slater, M.; Fricke, E.; Weiss, M.; Rebelein, A.; Bögner, M.; Preece, M.; Radford, C. The impact of aquaculture soundscapes on whiteleg shrimp Litopenaeus vannamei and Atlantic salmon Salmo salar. Aquac. Environ. Interact. 2020, 12, 167–177. [Google Scholar] [CrossRef]
- Davidson, J.; Frankel, A.S.; Ellison, W.T.; Summerfelt, S.; Popper, A.N.; Mazik, P.; Bebak, J. Minimizing noise in fiberglass aquaculture tanks: Noise reduction potential of various retrofits. Aquac. Eng. 2007, 37, 125–131. [Google Scholar] [CrossRef]
- Amoser, S.; Ladich, F. Are hearing sensitivities of freshwater fish adapted to the ambient noise in their habitats? J. Exp. Biol. 2005, 208, 3533–3542. [Google Scholar] [CrossRef] [PubMed]
- Hawkins, A.D.; Johnstone, A.D.F. The hearing of the Atlantic salmon, Salmo salar. J. Fish Biol. 1978, 13, 655–673. [Google Scholar] [CrossRef]
- Popper, A.N. Pure-tone auditory thresholds for the carp, Cyprinis carpio. J. Acoust. Soc. Am. 1972, 52, 1714–1717. [Google Scholar] [CrossRef]
- Radford, C.; Slater, M. Soundscapes in aquaculture systems. Aquac. Environ. Interact. 2019, 11, 53–62. [Google Scholar] [CrossRef]
- Wolff, D.L. Das Hörvermögen des Flußbarsches (Perca fluviatilis L.). Biol. Zent. Bl. 1967, 86, 449–460. [Google Scholar]
- Lugli, M.; Fine, M.L. Acoustic communication in two freshwater gobies: Ambient noise and short-range propagation in shallow streams. J. Acoust. Soc. Am. 2003, 114, 512–521. [Google Scholar] [CrossRef]
- Barber, J.R.; Crooks, K.R.; Fristrup, K.M. The costs of chronic noise exposure for terrestrial organisms. Trends Ecol. Evol. 2010, 25, 180–189. [Google Scholar] [CrossRef]
- Slabbekoorn, H.; Bouton, N.; van Opzeeland, I.; Coers, A.; ten Cate, C.; Popper, A.N. A noisy spring: The impact of globally rising underwater sound levels on fish. Trends Ecol. Evol. 2010, 25, 419–427. [Google Scholar] [CrossRef]
- Zhang, X.; Zhou, J.; Xu, W.; Zhan, W.; Zou, H.; Lin, J. Transcriptomic and Behavioral Studies of Small Yellow Croaker (Larimichthys polyactis) in Response to Noise Exposure. Animals 2022, 12, 2061. [Google Scholar] [CrossRef] [PubMed]
- Butler, J.M.; Maruska, K.P. Noise during mouthbrooding impairs maternal care behaviors and juvenile development and alters brain transcriptomes in the African cichlid fish Astatotilapia burtoni. Genes Brain Behav. 2021, 20, e12692. [Google Scholar] [CrossRef]
- Passos, M.F.; Beirão, M.V.; Midamegbe, A.; Duarte RH, L.; Young, R.J.; de Azevedo, C.S. Impacts of noise pollution on the agonistic interactions of the saffron finch (Sicalis flaveola Linnaeus, 1766). Behav. Process. 2020, 180, 104222. [Google Scholar] [CrossRef]
- Zhang, X.; Guo, H.; Chen, J.; Song, J.; Xu, K.; Lin, J.; Zhang, S. Potential effects of underwater noise from wind turbines on the marbled rockfish (Sebasticus marmoratus). J. Appl. Ichthyol. 2021, 37, 514–522. [Google Scholar] [CrossRef]
- Popper, A.N.; Hawkins, A.D. An overview of fish bioacoustics and the impacts of anthropogenic sounds on fishes. J. Fish Biol. 2019, 94, 692–713. [Google Scholar] [CrossRef]
- Wang, Y.; Ni, J.; Nie, Z.; Gao, J.; Sun, Y.; Shao, N.; Li, Q.; Hu, J.; Xu, P.; Xu, G. Effects of stocking density on growth, serum parameters, antioxidant status, liver and intestine histology and gene expression of largemouth bass (Micropterus salmoides) farmed in the in-pond raceway system. Aquac. Res. 2020, 51, 5228–5240. [Google Scholar] [CrossRef]
- He, K.; Gkioxari, G.; Dollâr, P.; Girshick, R. R-CNN Mask 2020. IEEE Trans. Pattern Anal. Mach. Intell. 2020, 42, 386–397. [Google Scholar] [CrossRef] [PubMed]
- Ashraf, I.; Bradshaw, H.; Ha, T.T.; Halloy, J.; Godoy-Diana, R.; Thiria, B. Simple phalanx pattern leads to energy saving in cohesive fish schooling. Proc. Natl. Acad. Sci. USA 2017, 114, 9599–9604. [Google Scholar] [CrossRef] [PubMed]
- Kent, M.I.; Lukeman, R.; Lizier, J.T.; Ward, A.J. Speed-mediated properties of schooling. R. Soc. Open Sci. 2019, 6, 181482. [Google Scholar] [CrossRef] [PubMed]
- Papoutsoglou, S.E.; Karakatsouli, N.; Louizos, E.; Chadio, S.; Kalogiannis, D.; Dalla, C.; Polissidis, A.; Papadopoulou-Daifoti, Z. Effect of Mozart’s music (Romanze-Andante of “Eine Kleine Nacht Musik”, sol major, K525) stimulus on common carp (Cyprinus carpio L.) physiology under different light conditions. Aquac. Eng. 2007, 36, 61–72. [Google Scholar] [CrossRef]
- Papoutsoglou, S.E.; Karakatsouli, N.; Papoutsoglou, E.S.; Vasilikos, G. Common carp (Cyprinus carpio) response to two pieces of music (“Eine Kleine Nachtmusik” and “Romanza”) combined with light intensity, using recirculating water system. Fish Physiol. Biochem. 2010, 36, 539–554. [Google Scholar] [CrossRef]
- Papoutsoglou, S.E.; Karakatsouli, N.; Skouradakis, C.; Papoutsoglou, E.S.; Batzina, A.; Leondaritis, G.; Sakellaridis, N. Effect of musical stimuli and white noise on rainbow trout (Oncorhynchus mykiss) growth and physiology in recirculating water conditions. Aquac. Eng. 2013, 55, 16–22. [Google Scholar] [CrossRef]
- Filiciotto, F.; Giacalone, V.M.; Fazio, F.; Buffa, G.; Piccione, G.; Maccarrone, V.; Di Stefano, V.; Mazzola, S.; Buscaino, G. Effect of acoustic environment on gilthead sea bream (Sparus aurata): Sea and onshore aquaculture background noise. Aquaculture 2013, 414, 36–45. [Google Scholar] [CrossRef]
- Dooling, R.J.; Leek, M.R.; Popper, A.N. Effects of noise on fishes: What we can learn from humans and birds. Integr. Zool. 2015, 10, 29–37. [Google Scholar] [CrossRef]
- Crovo, J.A.; Mendonça, M.T.; Holt, D.E.; Johnston, C.E. Stress and auditory responses of the otophysan fish, Cyprinella venusta, to road traffic noise. PLoS ONE 2015, 10, e0137290. [Google Scholar] [CrossRef]
- Scholik, A.R.; Yan, H.Y. Effects of underwater noise on auditory sensitivity of a cyprinid fish. Hear. Res. 2001, 152, 17–24. [Google Scholar] [CrossRef] [PubMed]
- Voellmy, I.K.; Purser, J.; Flynn, D.; Kennedy, P.; Simpson, S.D.; Radford, A.N. Acoustic noise reduces foraging success in two sympatric fish species via different mechanisms. Anim. Behav. 2014, 89, 191–198. [Google Scholar] [CrossRef]
- Purser, J.; Radford, A.N. Acoustic noise induces attention shifts and reduces foraging performance in three-spined sticklebacks (Gasterosteus aculeatus). PLoS ONE 2011, 6, e17478. [Google Scholar] [CrossRef] [PubMed]
- Bracciali, C.; Campobello, D.; Giacoma, C.; Sara, G. Effects of nautical traffic and noise on foraging patterns of Mediterranean damselfish (Chromis chromis). PLoS ONE 2012, 7, e40582. [Google Scholar] [CrossRef]
- Xiong, D.; Fang, T.; Yu, L.; Sima, X.; Zhu, W. Effects of nano-scale TiO2, ZnO and their bulk counterparts on zebrafish: Acute toxicity, oxidative stress and oxidative damage. Sci. Total Environ. 2011, 409, 1444–1452. [Google Scholar] [CrossRef] [PubMed]
- Choi, J.E.; Kim, S.; Ahn, J.H.; Youn, P.; Kang, J.S.; Park, K.; Yi, J.; Ryu, D.-Y. Induction of oxidative stress and apoptosis by silver nanoparticles in the liver of adult zebrafish. Aquat. Toxicol. 2010, 100, 151–159. [Google Scholar] [CrossRef]
- Zhang, J.; Shen, H.; Wang, X.; Wu, J.; Xue, Y. Effects of chronic exposure of 2, 4-dichlorophenol on the antioxidant system in liver of freshwater fish Carassius auratus. Chemosphere 2004, 55, 167–174. [Google Scholar] [CrossRef]
- Farombi, E.O.; Adelowo, O.A.; Ajimoko, Y.R. Biomarkers of oxidative stress and heavy metal levels as indicators of environmental pollution in African cat fish (Clarias gariepinus) from Nigeria Ogun River. Int. J. Environ. Res. Public Health 2007, 4, 158–165. [Google Scholar] [CrossRef]
- Rombout, J.H.; Abelli, L.; Picchietti, S.; Scapigliati, G.; Kiron, V. Teleost intestinal immunology. Fish Shellfish Immunol. 2011, 31, 616–626. [Google Scholar] [CrossRef]
- Salinas, I.; Zhang, Y.A.; Sunyer, J.O. Mucosal immunoglobulins and B cells of teleost fish. Dev. Comp. Immunol. 2011, 35, 1346–1365. [Google Scholar] [CrossRef]
- Wang, L.G.; Li, E.C.; Qin, J.G.; Du, Z.Y.; Yu, N.; Kong, Y.Q.; Feng, D.X.; Chen, L.Q. Effect of oxidized fish oil and α-tocopherol on growth, antioxidation status, serum immune enzyme activity and resistance to Aeromonas hydrophila challenge of Chinese mitten crab Eriocheir sinensis. Aquac. Nutr. 2015, 21, 414–424. [Google Scholar] [CrossRef]
- Picos-Garcıa, C.; Garcıa-Carreno, F.L.; Serviere-Zaragoza, E. Digestive proteases in juvenile Mexican green abalone, Haliotis fulgens. Aquaculture 2000, 181, 157–170. [Google Scholar] [CrossRef]
- Allert, S.; Ernest, I.; Poliszczak, A.; Opperdoes, F.R.; Michels, P.A. Molecular cloning and analysis of two tandemly linked genes for pyruvate kinase of Trypanosoma brucei. Eur. J. Biochem. 1991, 200, 19–27. [Google Scholar] [CrossRef]
- Laiz-Carrión, R.; Sangiao-Alvarellos, S.; Guzmán, J.M.; Martín del Río, M.P.; Míguez, J.M.; Soengas, J.L.; Mancera, J.M. Energy metabolism in fish tissues related to osmoregulation and cortisol action. Fish Physiol. Biochem. 2002, 27, 179–188. [Google Scholar] [CrossRef]
- Marqueze, A.; Kucharski, L.C.; Da Silva, R.S.M. Effects of anoxia and post-anoxia recovery on carbohydrate metabolism in the jaw muscle of the crab Chasmagnathus granulatus maintained on carbohydrate-rich or high-protein diets. J. Exp. Mar. Biol. Ecol. 2006, 332, 198–205. [Google Scholar] [CrossRef]
- Chen, S.Y.; Fei YH, J.; Chen, Y.C.; Chi, K.J.; Yang, J.T. The swimming patterns and energy-saving mechanism revealed from three fish in a school. Ocean Eng. 2016, 122, 22–31. [Google Scholar] [CrossRef]
- Wang, Z.-T.; Akamatsu, T.; Nowacek, D.P.; Yuan, J.; Zhou, L.; Lei, P.-Y.; Li, J.; Duan, P.-X.; Wang, K.-X.; Wang, D. Soundscape of an Indo-Pacific humpback dolphin (Sousa chinensis) hotspot before windfarm construction in the Pearl River Estuary, China: Do dolphin engage in noise avoidance and passive eavesdropping behavior? Mar. Pollut. Bull. 2019, 140, 509–522. [Google Scholar] [CrossRef]
- Sabet, S.S.; Van Dooren, D.; Slabbekoorn, H. Son et lumiere: Sound and light effects on spatial distribution and swimming behavior in captive zebrafish. Environ. Pollut. 2016, 212, 480–488. [Google Scholar] [CrossRef] [PubMed]
- Carroll, A.G.; Przeslawski, R.; Duncan, A.; Gunning, M.; Bruce, B. A critical review of the potential impacts of marine seismic surveys on fish & invertebrates. Mar. Pollut. Bull. 2017, 114, 9–24. [Google Scholar]
- Weilgart, L.S. The impacts of anthropogenic ocean noise on cetaceans and implications for management. Can. J. Zool. 2007, 85, 1091–1116. [Google Scholar] [CrossRef]
- Simpson, S.D.; Radford, A.N.; Nedelec, S.L.; Ferrari, M.C.; Chivers, D.P.; McCormick, M.I.; Meekan, M.G. Anthropogenic noise increases fish mortality by predation. Nat. Commun. 2016, 7, 10544. [Google Scholar] [CrossRef] [PubMed]
- Popper, A.N.; Hastings, M.C. The effects of anthropogenic sources of sound on fishes. J. Fish Biol. 2009, 75, 455–489. [Google Scholar] [CrossRef] [PubMed]
- Clark, C.W.; Mangel, M. The evolutionary advantages of group foraging. Theor. Popul. Biol. 1986, 30, 45–75. [Google Scholar] [CrossRef]
- Creel, S.; Creel, N.M. Communal hunting and pack size in African wild dogs, Lycaon pictus. Anim. Behav. 1995, 50, 1325–1339. [Google Scholar] [CrossRef]
- Pitcher, T.J.; Magurran, A.E.; Winfield, I.J. Fish in larger shoals find food faster. Behav. Ecol. Sociobiol. 1982, 10, 149–151. [Google Scholar] [CrossRef]
- Nedelec, S.L.; Mills, S.C.; Lecchini, D.; Nedelec, B.; Simpson, S.D.; Radford, A.N. Repeated exposure to noise increases tolerance in a coral reef fish. Environ. Pollut. 2016, 216, 428–436. [Google Scholar] [CrossRef]
- Fels, D.; Ap Rhisiart, A.; Vollrath, F. The selfish crouton. Behaviour 1995, 132, 49–55. [Google Scholar] [CrossRef]
- Ranta, E.; Lindstroem, K. Behaviour of fish-ecological consequences. Ann. Zool. Fenn. 1990, 27, 50. [Google Scholar]
- Treherne, J.E.; Foster, W.A. Group transmission of predator avoidance behaviour in a marine insect: The Trafalgar effect. Anim. Behav. 1981, 29, 911–917. [Google Scholar] [CrossRef]
- Killen, S.S.; Marras, S.; Steffensen, J.F.; McKenzie, D.J. Aerobic capacity influences the spatial position of individuals within fish schools. Proc. R. Soc. B Biol. Sci. 2012, 279, 357–364. [Google Scholar] [CrossRef]
- Marras, S.; Killen, S.S.; Lindström, J.; McKenzie, D.J.; Steffensen, J.F.; Domenici, P. Fish swimming in schools save energy regardless of their spatial position. Behav. Ecol. Sociobiol. 2015, 69, 219–226. [Google Scholar] [CrossRef] [PubMed]
- Jacobsen, L.; Baktoft, H.; Jepsen, N.; Aarestrup, K.; Berg, S.; Skov, C. Effect of boat noise and angling on lake fish behaviour. J. Fish Biol. 2014, 84, 1768–1780. [Google Scholar] [CrossRef] [PubMed]
- Westneat, D.F.; Walters, A.; McCarthy, T.M.; Hatch, M.I.; Hein, W.K. Alternative mechanisms of nonindependent mate choice. Anim. Behav. 2000, 59, 467–476. [Google Scholar] [CrossRef] [PubMed]
- Neo, Y.Y.; Hubert, J.; Bolle, L.; Winter, H.V.; Ten Cate, C.; Slabbekoorn, H. Sound exposure changes European seabass behaviour in a large outdoor floating pen: Effects of temporal structure and a ramp-up procedure. Environ. Pollut. 2016, 214, 26–34. [Google Scholar] [CrossRef]


| Growth Parameters | Ambient | RAS | IPRS |
|---|---|---|---|
| Initial body weight (g) | 3.59 ± 0.30 | 3.59 ± 0.30 | 3.59 ± 0.30 |
| Final weight (g) | 14.08 ± 0.13 b | 13.60 ± 0.03 b | 12.79 ± 0.08 a |
| Feed consumption (g) | 368.82 ± 5.52 b | 352.47 ± 8.83 ab | 335.60 ± 4.99 a |
| WG (g) | 10.49 ± 0.13 b | 10.01 ± 0.03 b | 9.20 ± 0.08 a |
| FCR | 1.17 ± 0.03 | 1.17 ± 0.03 | 1.22 ± 0.02 |
| SGR (%) | 2.73 ± 0.02 b | 2.66 ± 0.01 b | 2.54 ± 0.01 a |
| PER (%) | 1.61 ± 0.04 | 1.61 ± 0.04 | 1.55 ± 0.02 |
| HIS (%) | 0.23 ± 0.01 | 0.23 ± 0.01 | 0.19 ± 0.02 |
| CF (%) | 1.31 ± 0.06 | 1.37 ± 0.04 | 1.34 ± 0.04 |
| Variable | RAS | IPRS | Ambient | |
|---|---|---|---|---|
| Anti-oxidation and Immune | CAT U/mgprot | 3.56 ± 0.62 | 3.79 ± 1.44 | 4.67 ± 0.14 |
| MDA mg/mL | 1.04 ± 0.03 b | 1.21 ± 0.04 a | 0.92 ± 0.02 c | |
| Glu mmol/L | 9.43 ± 0.84 ab | 11.28 ± 0.10 a | 8.68 ± 0.55 b | |
| IgM mg/mL | 0.99 ± 0.21 | 0.78 ± 0.15 | 1.02 ± 0.17 | |
| LZM U/mgprot | 9.16 ± 1.35 | 9.41 ± 2.69 | 11.16 ± 1.77 | |
| POX ng/mL | 16.92 ± 2.31 | 14.73 ± 0.92 | 16.81 ± 1.13 | |
| Digestive enzymes | LPS U/gprot | 0.54 ± 0.24 | 0.66 ± 0.13 | 0.56 ± 0.10 |
| AMS U/mgprot | 1.03 ± 0.14 | 0.99 ± 0.06 | 1.05 ± 0.06 | |
| PEP U/mgprot | 4.78 ± 0.01 a | 3.67 ± 0.12 b | 4.92 ± 1.12 a | |
| CE U/gprot | 6.41 ± 0.34 | 5.47 ± 0.62 | 5.73 ± 0.67 | |
| Metabolic enzymes | HK U/gprot | 2.51 ± 0.37 | 3.26 ± 1.48 | 1.68 ± 0.38 |
| PK U/gprot | 146.37 ± 12.48 | 107.28 ± 16.53 | 149.32 ± 9.85 | |
| SDH U/mgprot | 5.71 ± 0.83 | 4.90 ± 0.65 | 4.24 ± 0.58 | |
| LDH U/gprot | 389.62 ± 39.9 | 356.56 ± 61.22 | 346.15 ± 85.15 |
| Days | Ambient Angle (°) | RAS Angle (°) | IPRS Angle (°) | Ambient Distance (mm) | RAS Distance (mm) | IPRS Distance (mm) |
|---|---|---|---|---|---|---|
| 1–10 | 41.05 ± 3.12 ab | 47.89 ± 0.70 a | 50.47 ± 0.38 b | 85.07 ± 1.56 | 93.10 ± 7.25 | 90.15 ± 8.54 |
| 11–20 | 41.85 ± 3.70 | 47.33 ± 4.37 | 47.96 ± 1.59 | 92.22 ± 3.47 | 107.63 ± 7.21 | 87.51 ± 5.96 |
| 21–30 | 44.35 ± 7.96 | 46.62 ± 2.44 | 46.82 ± 1.10 | 88.31 ± 0.57 a | 108.22 ± 2.30 b | 87.86 ± 4.10 a |
| 31–40 | 44.46 ± 7.76 | 49.53 ± 1.58 | 46.88 ± 1.37 | 80.60 ± 5.19 | 96.37 ± 1.44 | 84.39 ± 5.49 |
| 41–50 | 42.89 ± 5.62 | 47.51 ± 2.05 | 48.21 ± 3.73 | 84.44 ± 11.77 | 91.45 ± 5.16 | 88.86 ± 11.93 |
| 1–50 | 42.76 ± 1.42 a | 47.79 ± 2.34 ab | 48.04 ± 0.70 b | 85.74 ± 1.57 a | 98.52 ± 3.22 b | 87.70 ± 7.31 ab |
Disclaimer/Publisher’s Note: The statements, opinions and data contained in all publications are solely those of the individual author(s) and contributor(s) and not of MDPI and/or the editor(s). MDPI and/or the editor(s) disclaim responsibility for any injury to people or property resulting from any ideas, methods, instructions or products referred to in the content. |
© 2023 by the authors. Licensee MDPI, Basel, Switzerland. This article is an open access article distributed under the terms and conditions of the Creative Commons Attribution (CC BY) license (https://creativecommons.org/licenses/by/4.0/).
Share and Cite
Zhang, Y.; Shitu, A.; Hang, S.; Ye, Z.; Xu, W.; Zhao, H.; Zhao, J.; Zhu, S. Assessing the Impacts of Aquaculture Soundscapes on the Growth, Physiology and Behavior of Micropterus salmoides. Fishes 2023, 8, 377. https://doi.org/10.3390/fishes8070377
Zhang Y, Shitu A, Hang S, Ye Z, Xu W, Zhao H, Zhao J, Zhu S. Assessing the Impacts of Aquaculture Soundscapes on the Growth, Physiology and Behavior of Micropterus salmoides. Fishes. 2023; 8(7):377. https://doi.org/10.3390/fishes8070377
Chicago/Turabian StyleZhang, Yadong, Abubakar Shitu, Shengyu Hang, Zhangying Ye, Wen Xu, Hangfang Zhao, Jian Zhao, and Songming Zhu. 2023. "Assessing the Impacts of Aquaculture Soundscapes on the Growth, Physiology and Behavior of Micropterus salmoides" Fishes 8, no. 7: 377. https://doi.org/10.3390/fishes8070377
APA StyleZhang, Y., Shitu, A., Hang, S., Ye, Z., Xu, W., Zhao, H., Zhao, J., & Zhu, S. (2023). Assessing the Impacts of Aquaculture Soundscapes on the Growth, Physiology and Behavior of Micropterus salmoides. Fishes, 8(7), 377. https://doi.org/10.3390/fishes8070377