Article

Rockfish Species Trends in Puget Sound, Washington, USA, 2009–2023

1
Seattle Aquarium, 1483 Alaskan Way, Seattle, WA 98101, USA
2
Independent Researcher, Ollala, WA 98359, USA
3
Point Defiance Zoo and Aquarium, 5400 N Pearl St, Tacoma, WA 98407, USA
4
Independent Researcher, Seattle, WA 98133, USA
*
Authors to whom correspondence should be addressed.
Fishes 2023, 8(10), 508; https://doi.org/10.3390/fishes8100508
Submission received: 16 August 2023 / Revised: 27 September 2023 / Accepted: 5 October 2023 / Published: 11 October 2023
(This article belongs to the Special Issue Temperate Reef Fish Ecology)

Abstract

:
Rockfishes (Sebastes spp.) are a long-lived, understudied, multi-species fish assemblage in inland Washington (USA) waters. Driven by large-scale fishery removals in the 1970s, their numbers declined and have yet to recover, perhaps due to slow maturation and rare recruitment success. Since then, rockfish fishing restrictions have increased within Puget Sound, culminating in a 2010 total ban. Here, we analyze rockfish community trends (abundance and Shannon Diversity) within Puget Sound from 2009 to 2023. Our dataset includes 157 recorded dive transects from nine rocky or artificial reef habitats at depths 5–24 m throughout four Puget Sound basins: Admiralty Inlet (2 sites), Central Puget Sound (4 sites), Hood Canal (2 sites), and South Puget Sound (1 site). Significant differences in community species composition between basins were observed; we noted more Black (S. melanops), Yellowtail (S. flavidus), and Puget Sound (S. emphaeus) rockfish and fewer Brown rockfish (S. auriculatus) at sites in Admiralty Inlet vs. Central Puget Sound. Adult rockfish counts and Shannon Diversity varied seasonally, with higher rockfish counts and diversity indices in summer/autumn vs. winter/spring. Notably, we observed that total adult rockfish count per survey tended downward over time, driven partly by significant downward trends in Hood Canal Copper rockfish (S. caurinus) counts. We recommend continued monitoring and additional investigation into what factors besides fishing may be driving the trends reported here.
Key Contribution: Rockfish counts by scientific divers in the Puget Sound have declined over 2009–2023 despite a moratorium on fishing. Trends over time vary by species and basin within Puget Sound, with Copper rockfish (S. caurinus) in Hood Canal displaying the most dramatic decrease while simultaneously increasing in South Puget Sound.

1. Introduction

Rockfishes (Sebastes spp.) are an important multi-species fish assemblage within the Puget Sound. They comprise twenty-eight species that occupy different but often overlapping niches throughout Puget Sound’s nearshore and deep shelf habitats [1,2]. Over their lifetime, rockfish consume plankton, crustaceans, and other fishes and serve as food for marine mammals, birds, and other fish, including lingcod [2]. In addition to their ecological importance, rockfish support commercial, recreational, and tribal fisheries [3]. As important meso-predators, rockfish provide recreational value to divers, and they feature in artwork [1,4]. Their life history has evolved to accommodate the highly variable conditions in the Pacific Northwest; they are long-lived to improve individual fitness, as larval survival and successful recruitment depend on ideal but inconsistent combinations of water temperature, food supply, and upwelling intensity [1]. Rockfish species display interspecific variation in their lifespans and age-at-maturation; for example, Puget Sound rockfish (S. emphaeus) [5] mature within 1–2 years and live to about 19, while only 50% of Yelloweye rockfish (S. ruberrimus) [6] mature by age 22, and they can live for more than a century [1,2,7]. Collectively, rockfishes are characterized as long-lived, site-fidelic fish with irregular recruitment [1,2].
A decline in rockfish abundance within Puget Sound was observed beginning in the 1970s and 1980s [2,3], which was a time of change in coastal fisheries. Many non-tribal Washington-based fisheries pivoted to rockfish in Puget Sound as they were diverted from (a) rockfish-abundant waters off the coast of Canada and (b) 50% of harvestable salmon in Washington waters. These diversions were due to the United Nations Convention on the Law of the Sea, for which international agreement Canada claimed its 200 nm Exclusive Economic Zone, and the Boldt Decision, which affirmed Tribal Treaty rights to 50% of the harvestable salmon [2,3,8,9]. The Boldt decision motivated non-tribal governmental organizations to encourage fishing and eating rockfish as an appealing non-salmon option in Puget Sound. Gradually, a cultural shift led to increased recreational targeting of rockfish. Rockfish landings increased, as did the number of rockfish recipes in regional cookbooks [3]. Additionally, innovations in vessel technology, like motorized vessels, widened the range where recreational fishers could access Puget Sound, and advances in fish-finding technology eased locating the fish once at a site [3,10]. These combined events led to widespread declines in rockfish throughout the region by the early 2000s [11], with an estimated 69–76% of total adult rockfish lost from 1977 to 2014 [12].
Petitions were submitted as early as 1999 to list fourteen different species of rockfish in the Puget Sound on the Endangered Species list, although NOAA’s National Marine Fisheries Service (NMFS) deemed there to be insufficient data in many cases to support review, much less listing [3]. NOAA did eventually list Boccacio rockfish (S. paucispinis) [13] as endangered and Yelloweye (S. ruberrimus) and Canary rockfish (S. pinniger) [14] as threatened in 2009 [15]. Boccacio and Yelloweye rockfish remain listed today. Canary rockfish were delisted once formal genetic analysis revealed that Canary rockfish found in Puget Sound were not a distinct population segment from Canary rockfish on the outer coast of Washington; thus, while they remain locally depleted, the population as a whole is not at immediate risk of extinction [16].
Various fishing and management approaches have been employed to promote the recovery of rockfish species. The Washington Department of Fish and Wildlife (WDFW) instituted the first bag limit on recreational fisheries in 1983 with the publication of their first-ever rockfish management plan [3]. In the early 2000s, WFDW went further with the establishment of several Marine Protected Areas [3]. In 2010, the most restrictive regulation went into effect, with a total ban on fishing for or retaining rockfish in the Puget Sound, Port Angeles/Port Townsend, and the San Juan Island marine areas [15,17]. Since discovering the decline, and especially given NMFS’s verdict of insufficient data to consider listing, many agencies have prioritized rockfish research [2,15]. However, rockfish remain understudied today, especially when compared with salmon, another fish of profound socio-ecological importance in Puget Sound. To date, the most continuous data sources for rockfish distribution in Puget Sound come from knowledge holders within the recreational fishing industry [3,10,16,18]. Management is only as good as the research on which it is based, and data deficiency slows or halts effective management; thus, there is a continued need for long-term rockfish monitoring in Puget Sound.
Long-term monitoring programs are an important tool for conservation and management efforts. Because rockfish have a generation range that can vary from 2 to 22 years, it is important to have a correspondingly long dataset. In this research, we analyze trends of rockfish communities in rocky reef habitats or similar within Puget Sound over a period of 14 years. Our dataset includes filmed dive transects from 9 sites throughout Puget Sound from 2009 to 2023, reaching a total of 157 recorded transects, with depths ranging from 5 to 24 m. Given the 2010 ban on fishing rockfish in Puget Sound, we hypothesized observing greater numbers of fish per sampling unit over time.

2. Materials and Methods

Our region of interest is the sheltered estuarine inlet of the Puget Sound. We surveyed 9 rocky or artificial reef sites (Figure 1, Table 1), starting with Rockaway in 2009 and gradually adding sites through the addition of Edmonds Dive Park in 2019; this paper focuses on surveys through February 2023. Three sites were surveyed annually via boat (Possession Point, Saltwater, and Z’s Reef), while the other six (Rockaway, Point Whitney, Sund Rock, Keystone, Point Hudson, and Edmonds) were surveyed quarterly since 2017 through shore-based dives. Sites were selected based on habitat type (rocky or artificial reef), diver accessibility, and reported rockfish presence. They represented 4 basins within the Puget Sound: Admiralty Inlet, Central Puget Sound, Hood Canal, and South Puget Sound [19]. For our analysis, we treated these sites collectively to determine overarching trends and individually by basin to assess more localized patterns.
Surveys employed 100-m dive transects as executed in Larson et al. 2022 [21]. Point Hudson was the one exception, as this site only had habitat suitable for a 50 m transect. One diver filmed the transect, and the other diver deployed the transect tape. From 2009–2010, divers used a Sony™ VX2100 mini DV camera with a Light and Motion™ Bluefin Compact Monitor (VX2100) and a Light and Motion™ UWA 100° Wide Angle Lens; and from 2011–2023, a Sony αNEX 5N, α5000, or α6500 Digital camera with a Sony SEL16F28 16 mm f2.8 and VCL-ECU2 close up adapter (100° angle of view). With the change in video equipment, the recorded resolution increased from 480i to 4k/24p, although the ability to identify rockfish accurately remained unchanged. The video output included the visual transect from each site as well as an audio recording of the divers’ observations in real time. A trained observer then reviewed this video and audio at reduced speed in VLC media player to identify and count fish captured in frame. Groundfish of interest included the following: rockfish [Black (S. melanops), Deacon (S. diaconus) or Blue (S. mystinus), Brown (S. auriculatus), Canary (S. pinniger), China (S. nebulosus), Copper (S. caurinus), Quillback (S. maliger), Tiger (S. nigrocinctus), Widow (S. entomelas), Yelloweye (S. ruberrimus), Yellowtail (S. flavidus), Vermillion (S. miniatus), Puget Sound (S. emphaeus), and Young-of-the-Year (YOY)], Greenling (Hexagrammidae sp.), Lingcod (Ophiodon elongatus), Painted Greenling (Oxylebius pictus), and Wolfeel (Anarrhichthys ocellatus). Fish species were identified based on distinct physical characteristics (size, color, morphology) [22], with YOY identified similarly by their body type and size [23]. YOY were not identified to species level but rather counted together as total YOY.
Data manipulation, graphing, and analysis were completed using R 4.3.0 in R.Studio. For each site and sampling date, we calculated total adult rockfish count and Shannon Diversity Index from species observed [24]. Shannon Diversity Index was calculated using the vegan package in R [25]. Given the non-normal distribution of adult rockfish count data, we used Kendall’s rank correlation in base-R to examine the trend in rockfish count over time [26]. In our analyses, we use p < 0.05 as our significance threshold, although findings where p < 0.1 are also noted.
Preliminary visualizations of the data using ggplot2 and tidyverse revealed variation based on season, basin, and species [27,28]. Seasons were defined by month as follows: winter (December–February), spring (March–May), summer (June–August), and autumn (September–November). To statistically analyze independence of summary parameters on season, we employed a two-way ANOVA [29] where assumptions were met for the Shannon Diversity Index distribution and a non-parametric Kruskal–Wallis rank sum test [26] on log-transformed adult rockfish count data. Both statistical tests are included in base-R stats package [30]; post hoc diagnostics relied on functions from the R packages FSA and PMCMRplus [31,32]. Seasonal analysis was completed using 2017–2023 data from Keystone Jetty, Point Hudson, Point Whitney, Rockaway, Sund Rock, and Edmonds Underwater Park, which were the years and sites with seasonal sampling (Figure A1).
Inter-basin variation was explored by applying Kendall’s rank correlation to ‘year’-‘rockfish count’ relationships within each basin as well as conducting multivariate analysis using non-metric multidimensional scaling of community structures within each basin and comparing basins using adonis2 from the vegan R package [25]. Trends in species counts within each basin were analyzed with Kendall’s rank correlation. Publication-ready figures were generated using commands from the ggpubr and cowplot packages in R [33,34].
To gain information on basin water column parameters, we obtained vertical water column profile data from the Washington Department of Ecology’s Puget Sound and marine monitoring program [35]. Their database includes monthly information on salinity, temperature, dissolved oxygen, turbidity, fluorescence, chlorophyll a, pH, dissolved inorganic carbon, total alkalinity, nutrients, total nitrogen, total organic carbon, particulate carbon, and particulate nitrogen from a total of 75 locations. All data are publicly available on their website and were downloaded for this work in April 2023. For the sake of our study, we downloaded data on salinity, temperature, and dissolved oxygen and included only sites within the Puget Sound (n = 29) at depths from 1–25 m. While water quality sampling sites did not correspond perfectly with our rockfish survey site locations, we grouped sites by basin (Admiralty Inlet, Central Puget Sound, South Puget Sound, Hood Canal) and ran correlations within these groups. Basins within the Puget Sound have distinct bathymetry and vary in the influence of freshwater vs. saltwater over time [19], so the water quality parameters would be expected to differ as well and, indeed, may differ in suitability for rockfishes. Moreover, climate change is projected to have variable effects on the basins [19], so grouping the data as such allowed us to explore whether we may already see differences in water quality over time.

3. Results

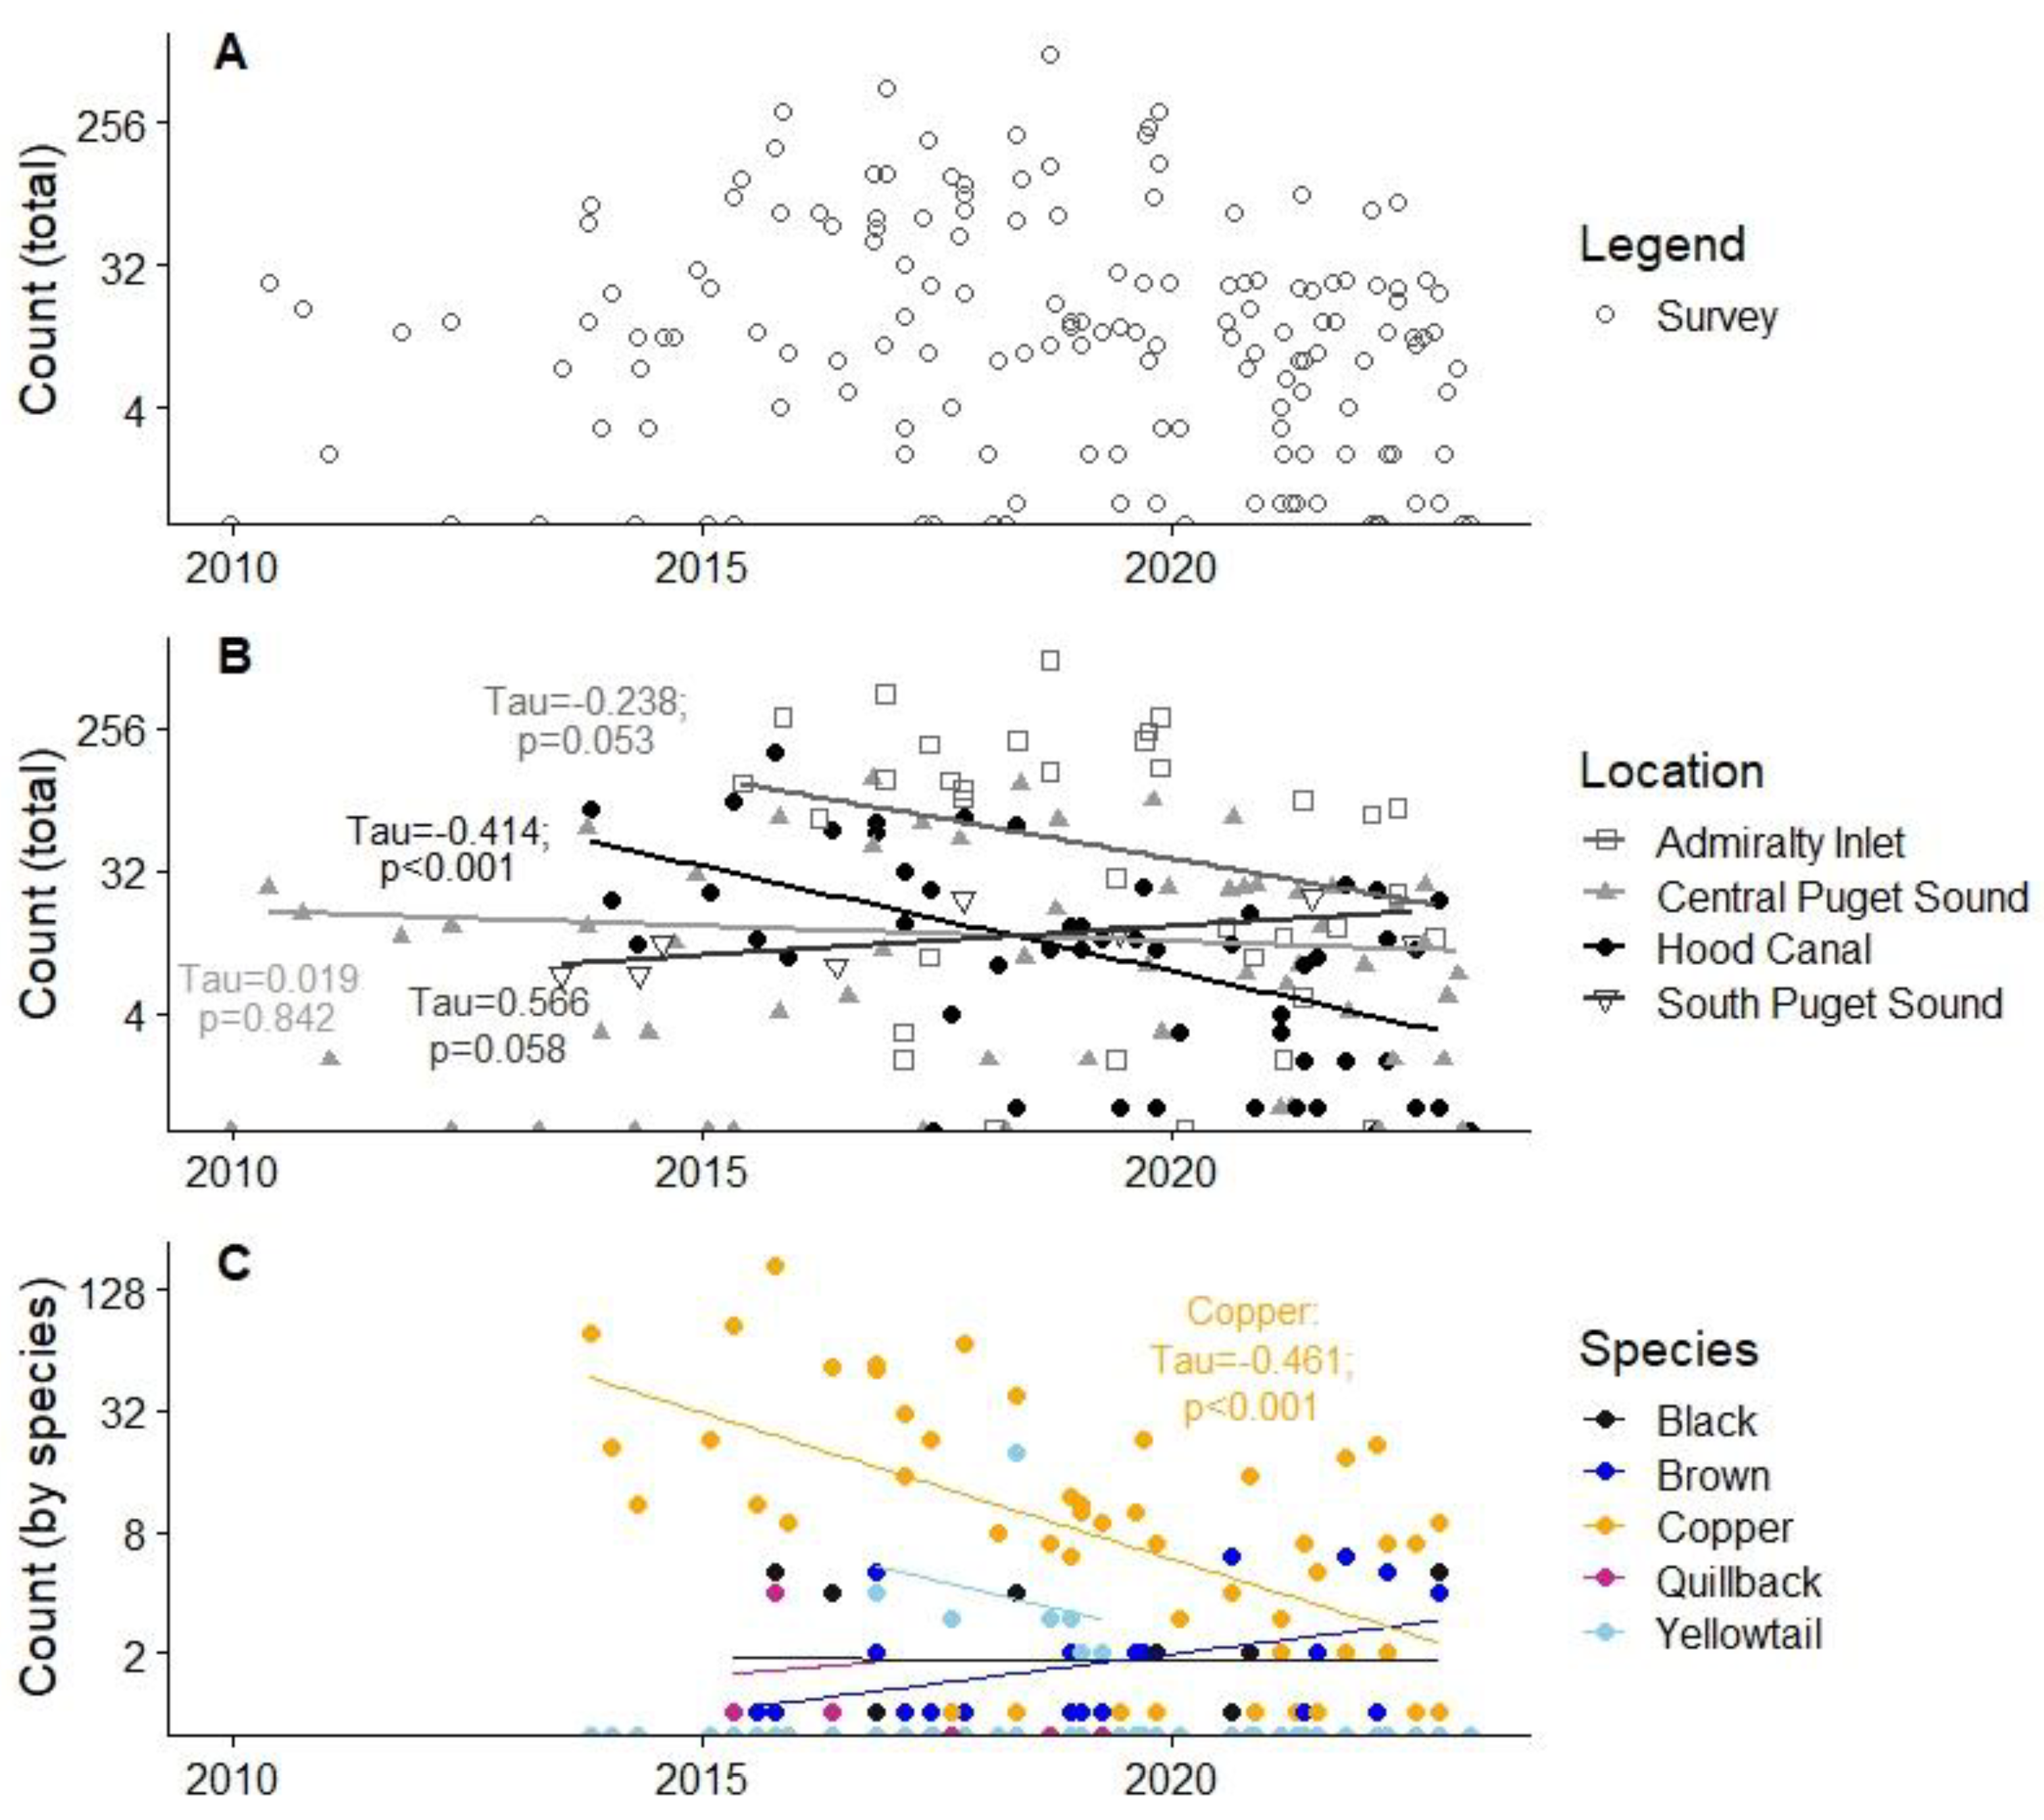
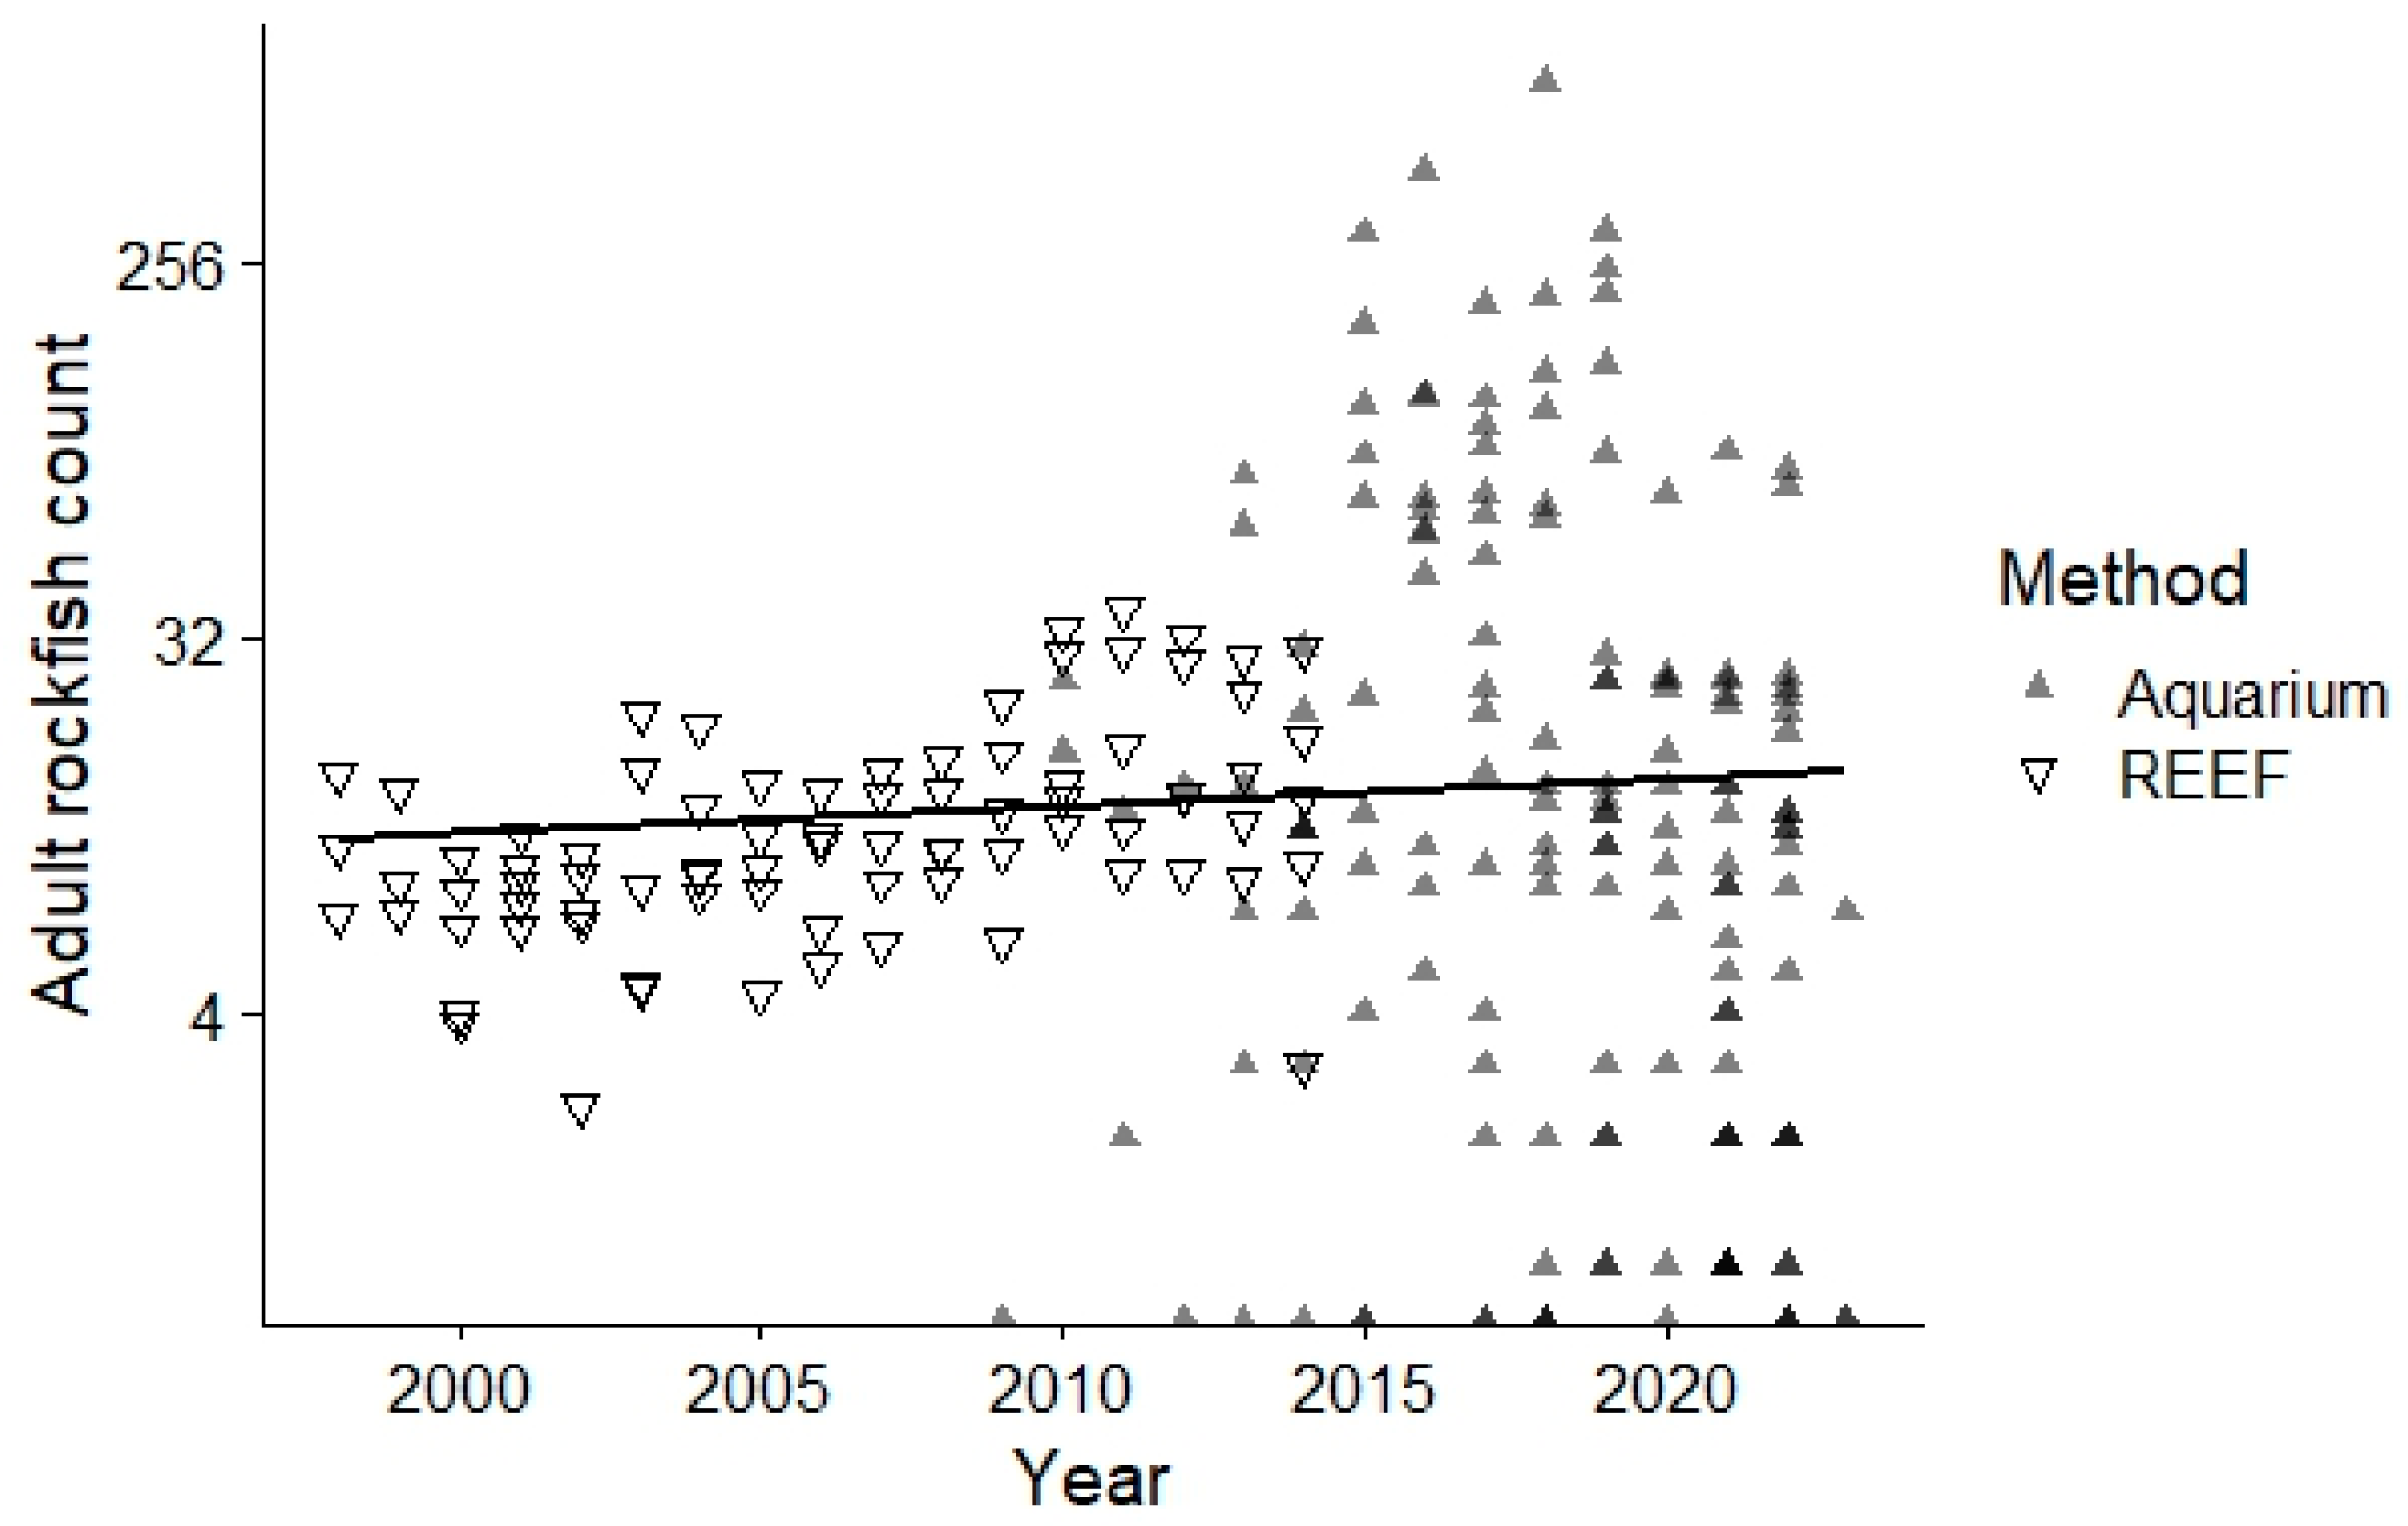
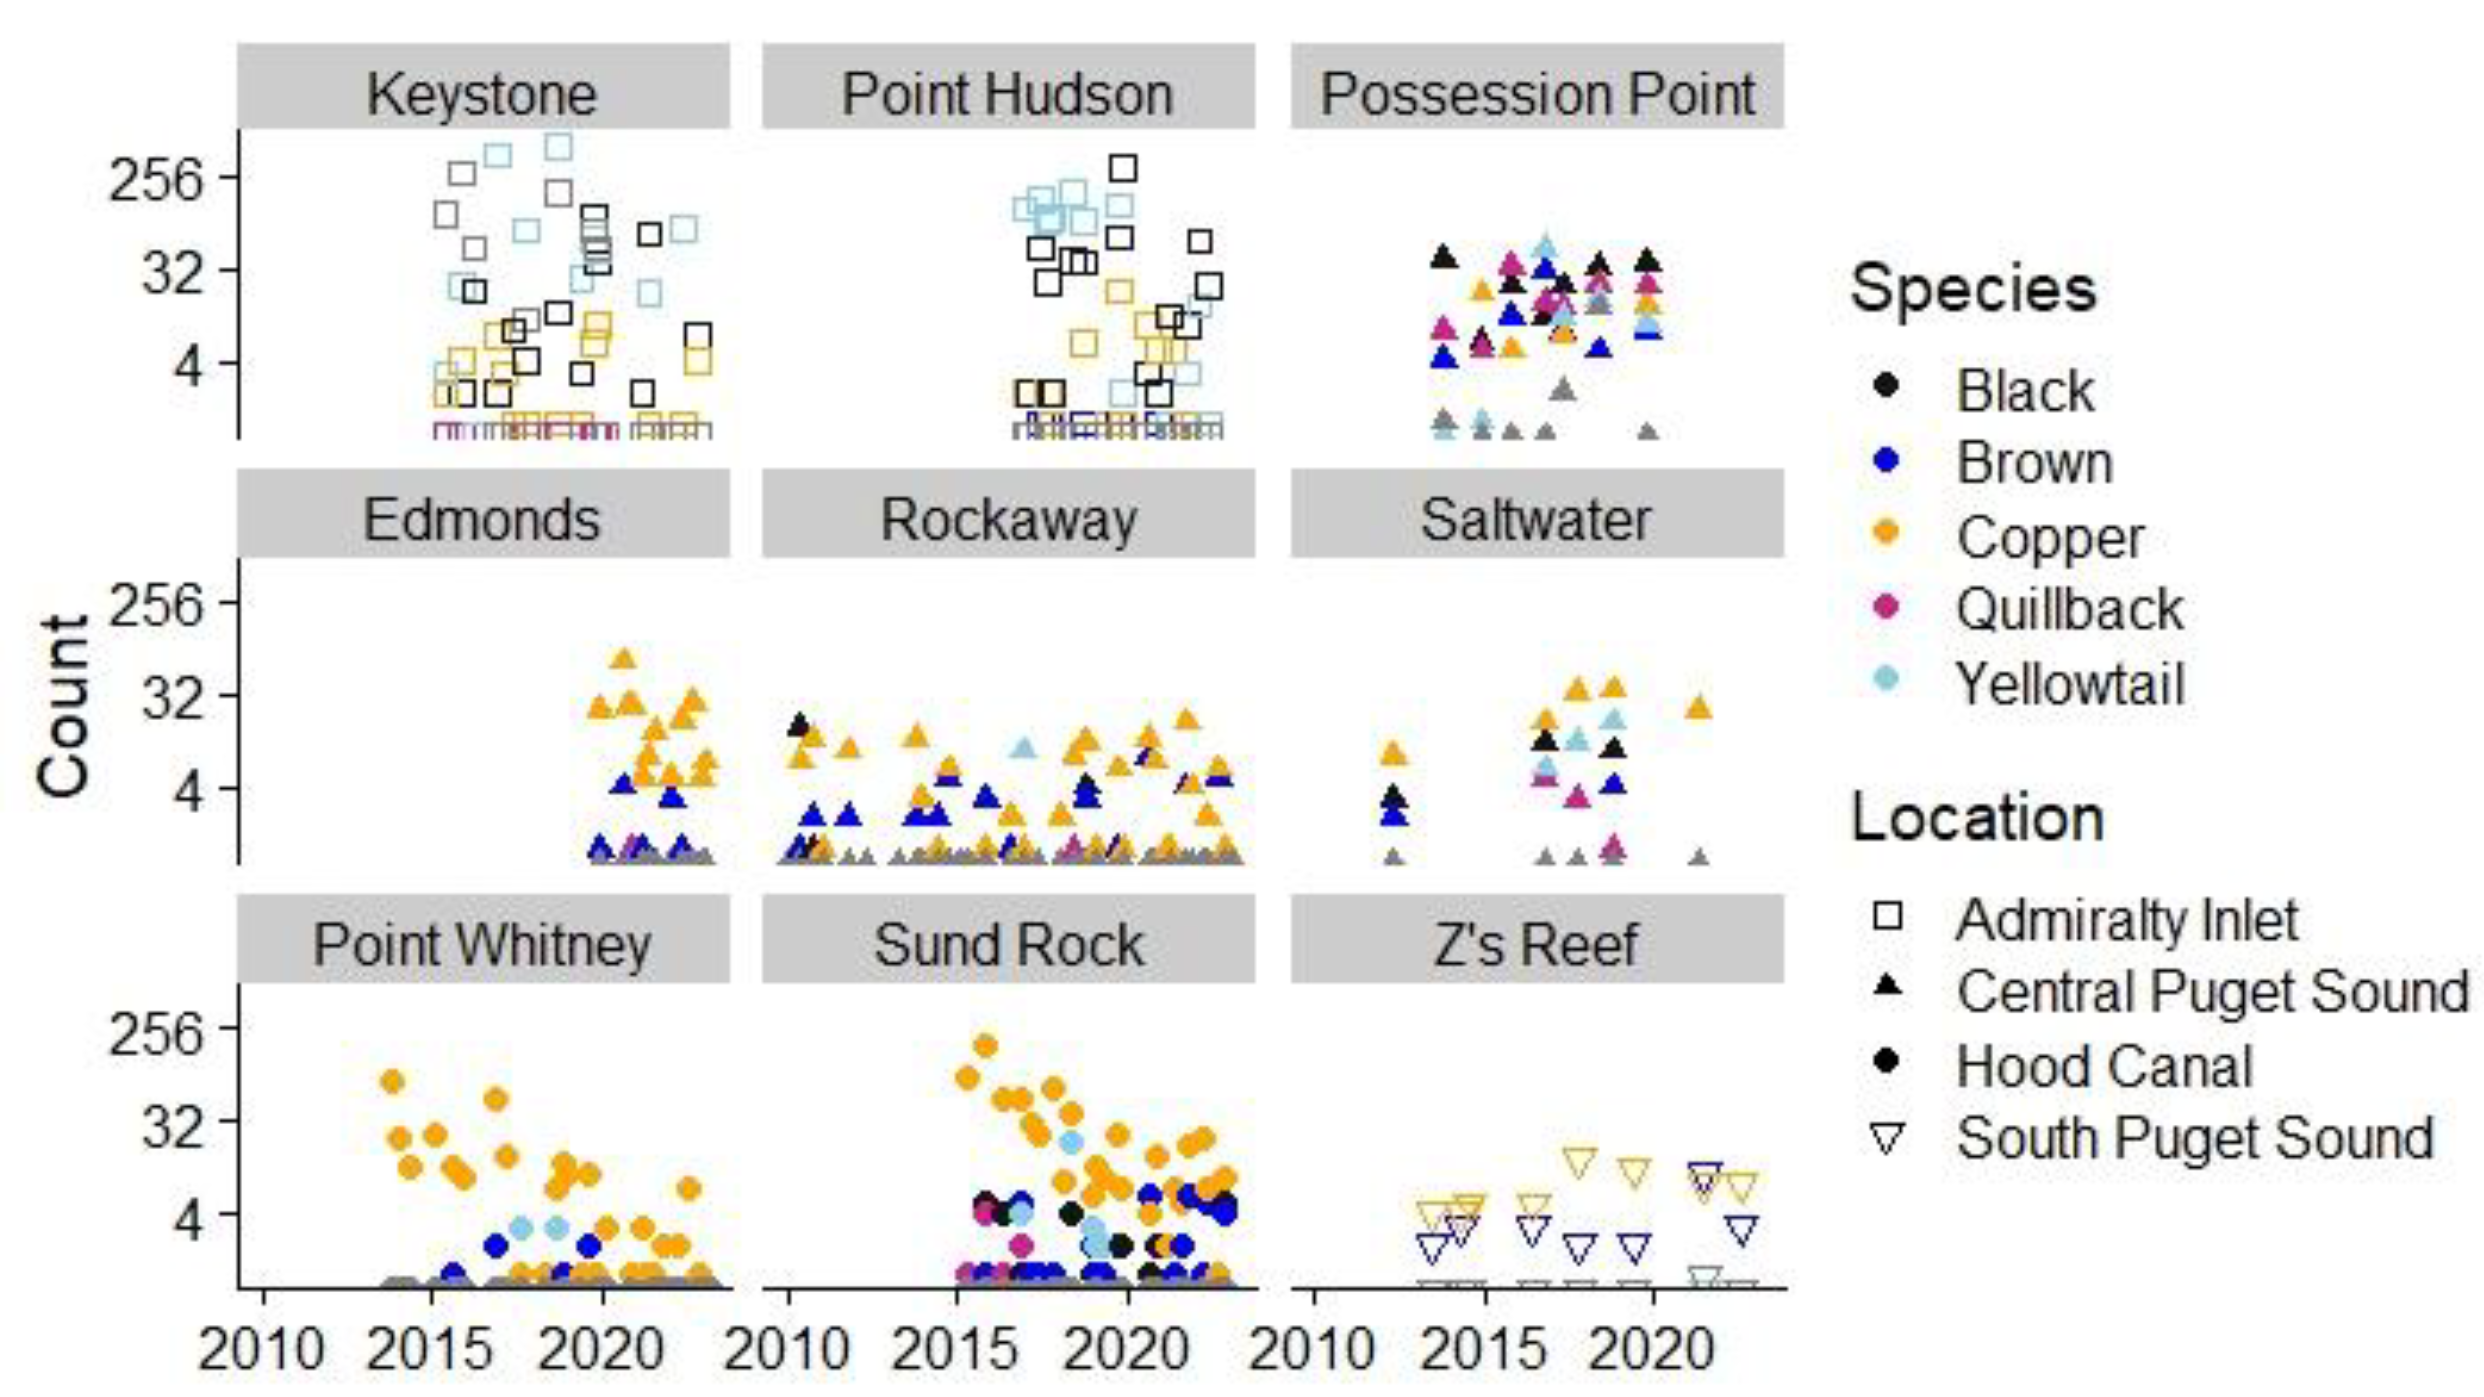
3.1. Trends in Total Rockfish Observed over Time

Over the course of all sampling dates and study locations, we observed Yellowtail, Copper, Black, Puget Sound, Brown, Quillback, Vermillion, and Young-of-the-Year rockfish. Young-of-the-Year (YOY) were observed exclusively at Keystone Jetty and Edmonds Underwater Park sites, with recruitment events of more than 100 YOY observed at Keystone Jetty in winter 2016 and spring 2022 (Table A1). Other fish tracked and observed were Lingcod, Greenling, Painted Greenling, Wolfeel, and Cabezon. The maximum number of adult rockfish observed during a single transect was 685 rockfish observed at Keystone Jetty in September 2018, while a minimum of zero adult rockfish was observed during 17 different surveys (11% of the total). Species counts over time by site are visualized in Figure 2, while total adult rockfish counts per survey are visualized in Figure A2.
The number of adult rockfish observed per survey declined slightly over the study period. When subdivided into basins, Hood Canal displayed a significant negative correlation between adult rockfish counts per sampling and survey year (Figure 3B; t = −0.414, p < 0.001, n = 53), while sites within Admiralty Inlet showed a marginal negative correlation between adult rockfish count and year (Figure 3B; tau = −0.238, p = 0.053, n = 36), and Z’s Reef in South Puget Sound had a marginal positive correlation between adult rockfish and year (Figure 3B; tau = 0.566, p = 0.058, n = 8). Central (n = 60) sites had no significant or marginal correlations between total adult rockfish count and year. Individual rockfish species varied in direction and significance of their count vs. year correlations (Table A2). Brown and Quillback rockfish counts were significantly negatively correlated with year (p < 0.05), and Copper rockfish were marginally negatively correlated (p < 0.1). Within rockfish species observed at Hood Canal sites (Figure 3C), Copper and Quillback rockfish counts were both significantly and negatively correlated with year (p < 0.001). Copper rockfish in South Puget Sound had a marginal positive correlation with year (p = 0.074). In Admiralty Inlet, Yellowtail rockfish counts correlated marginally and negatively with year (p = 0.075), and in Central Puget Sound, Black rockfish counts exhibited a significant negative correlation (p = 0.012).

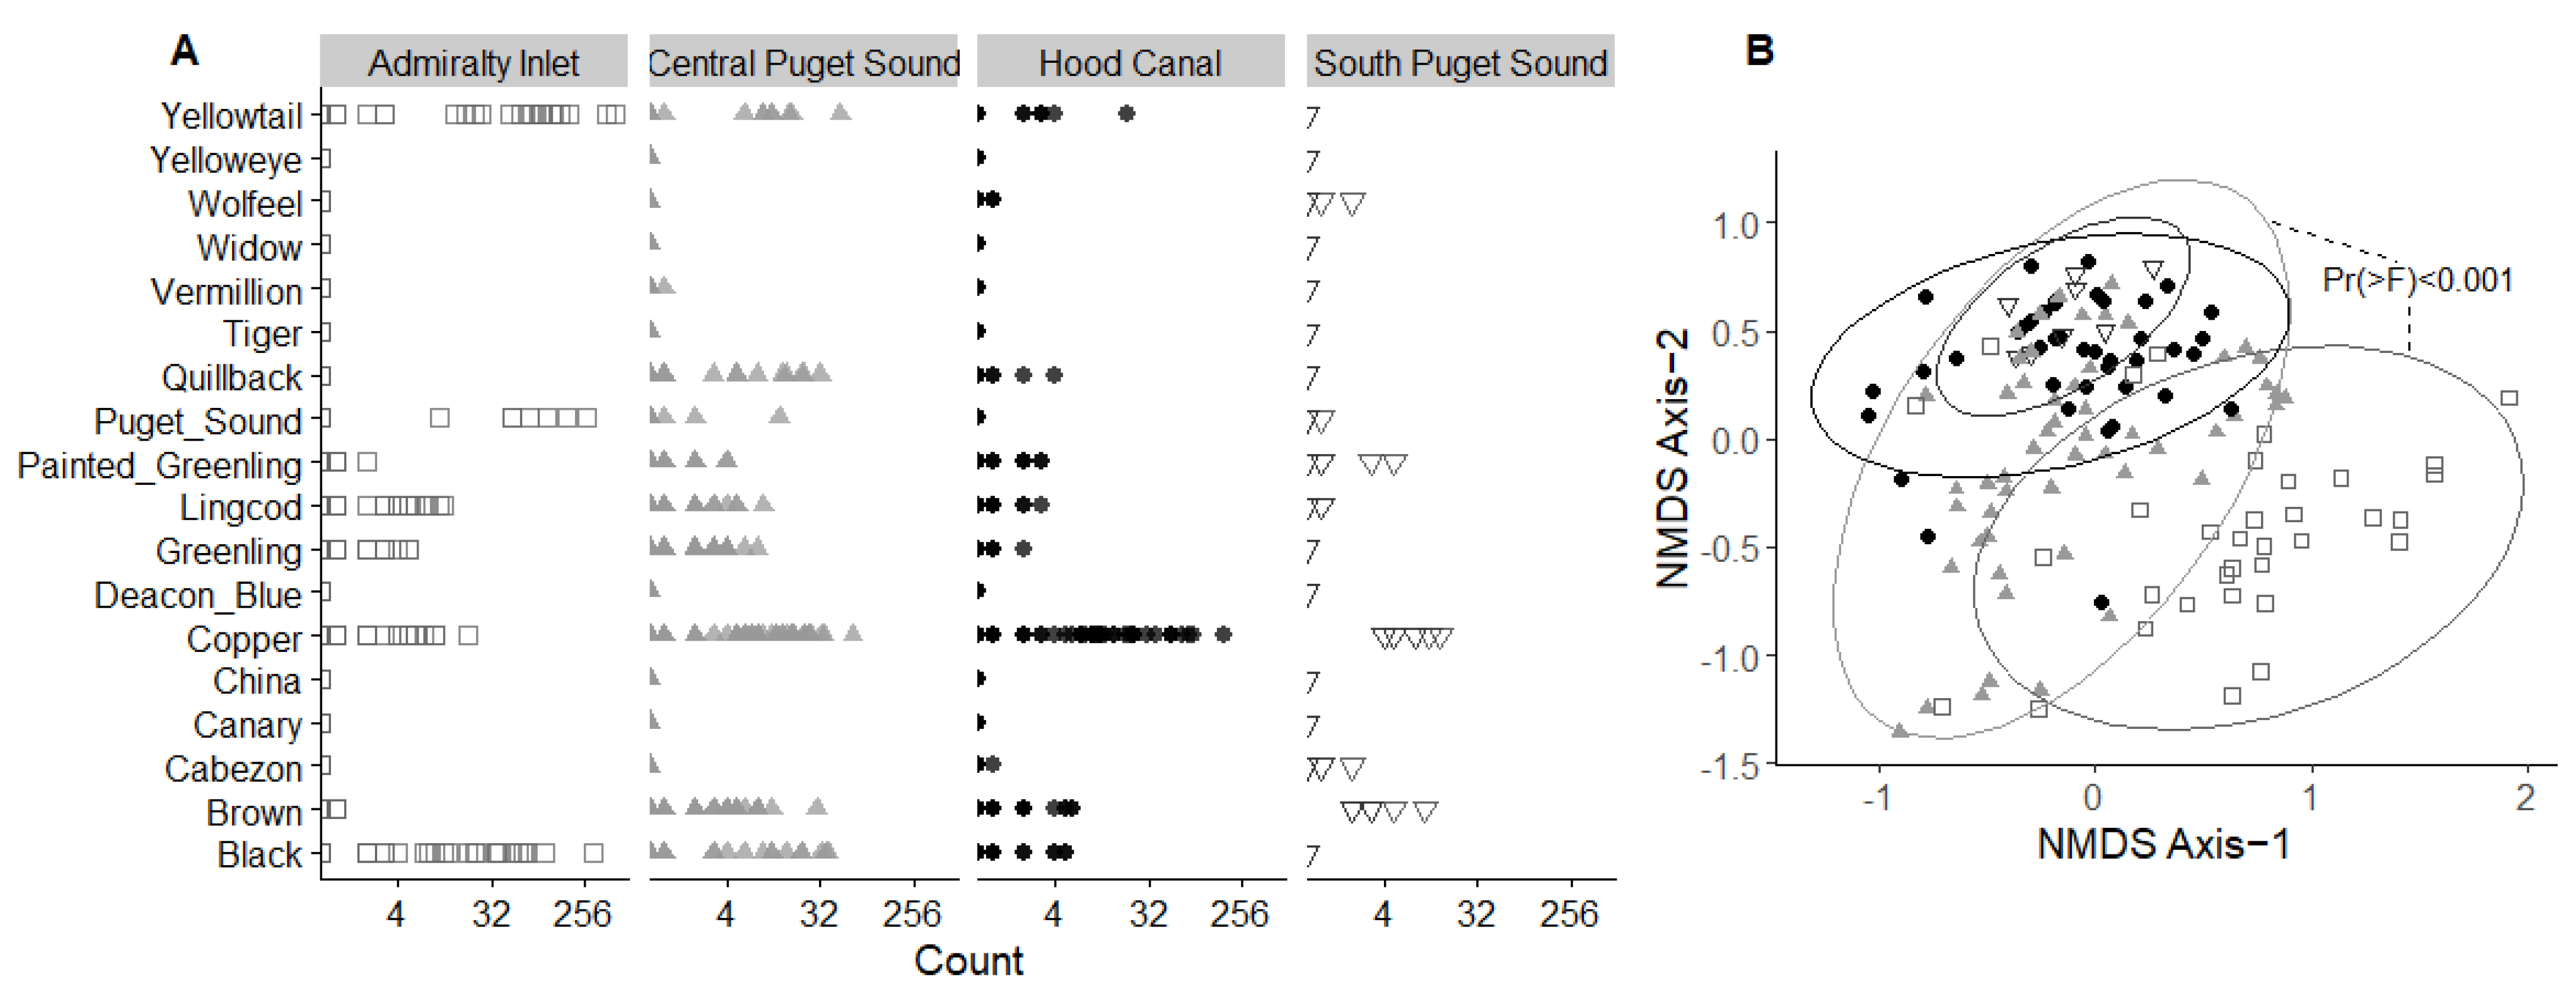
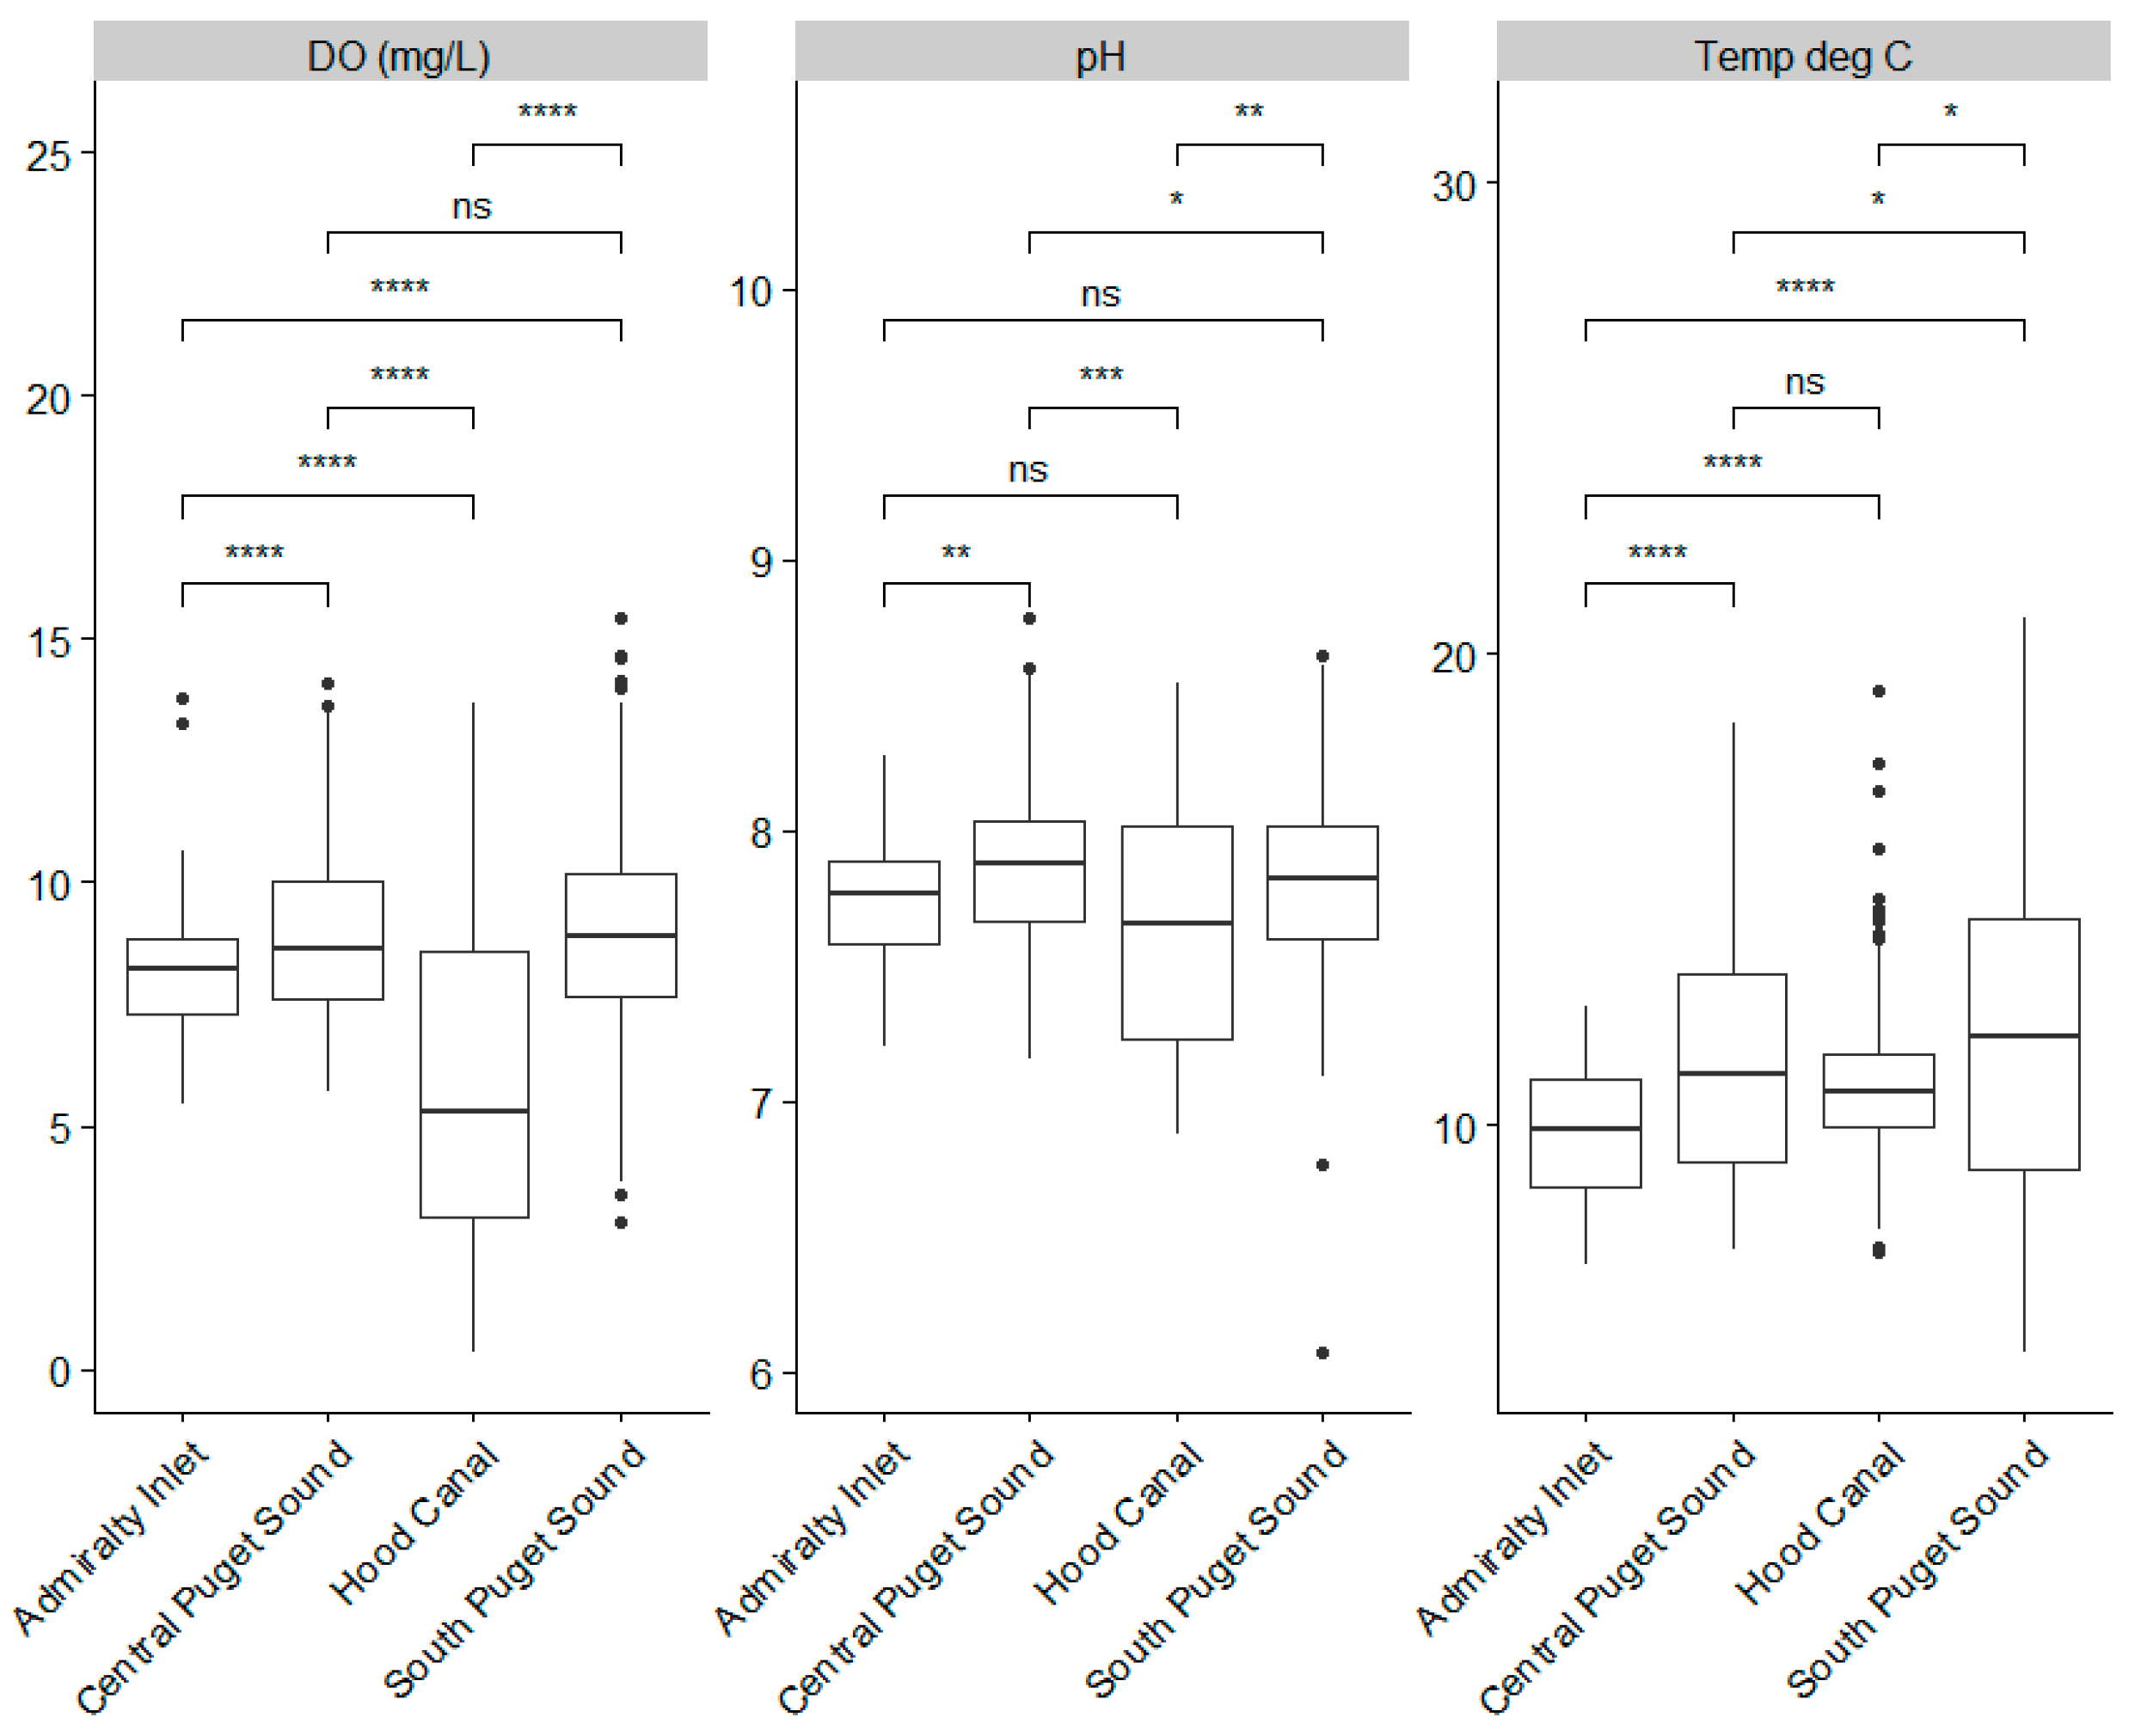
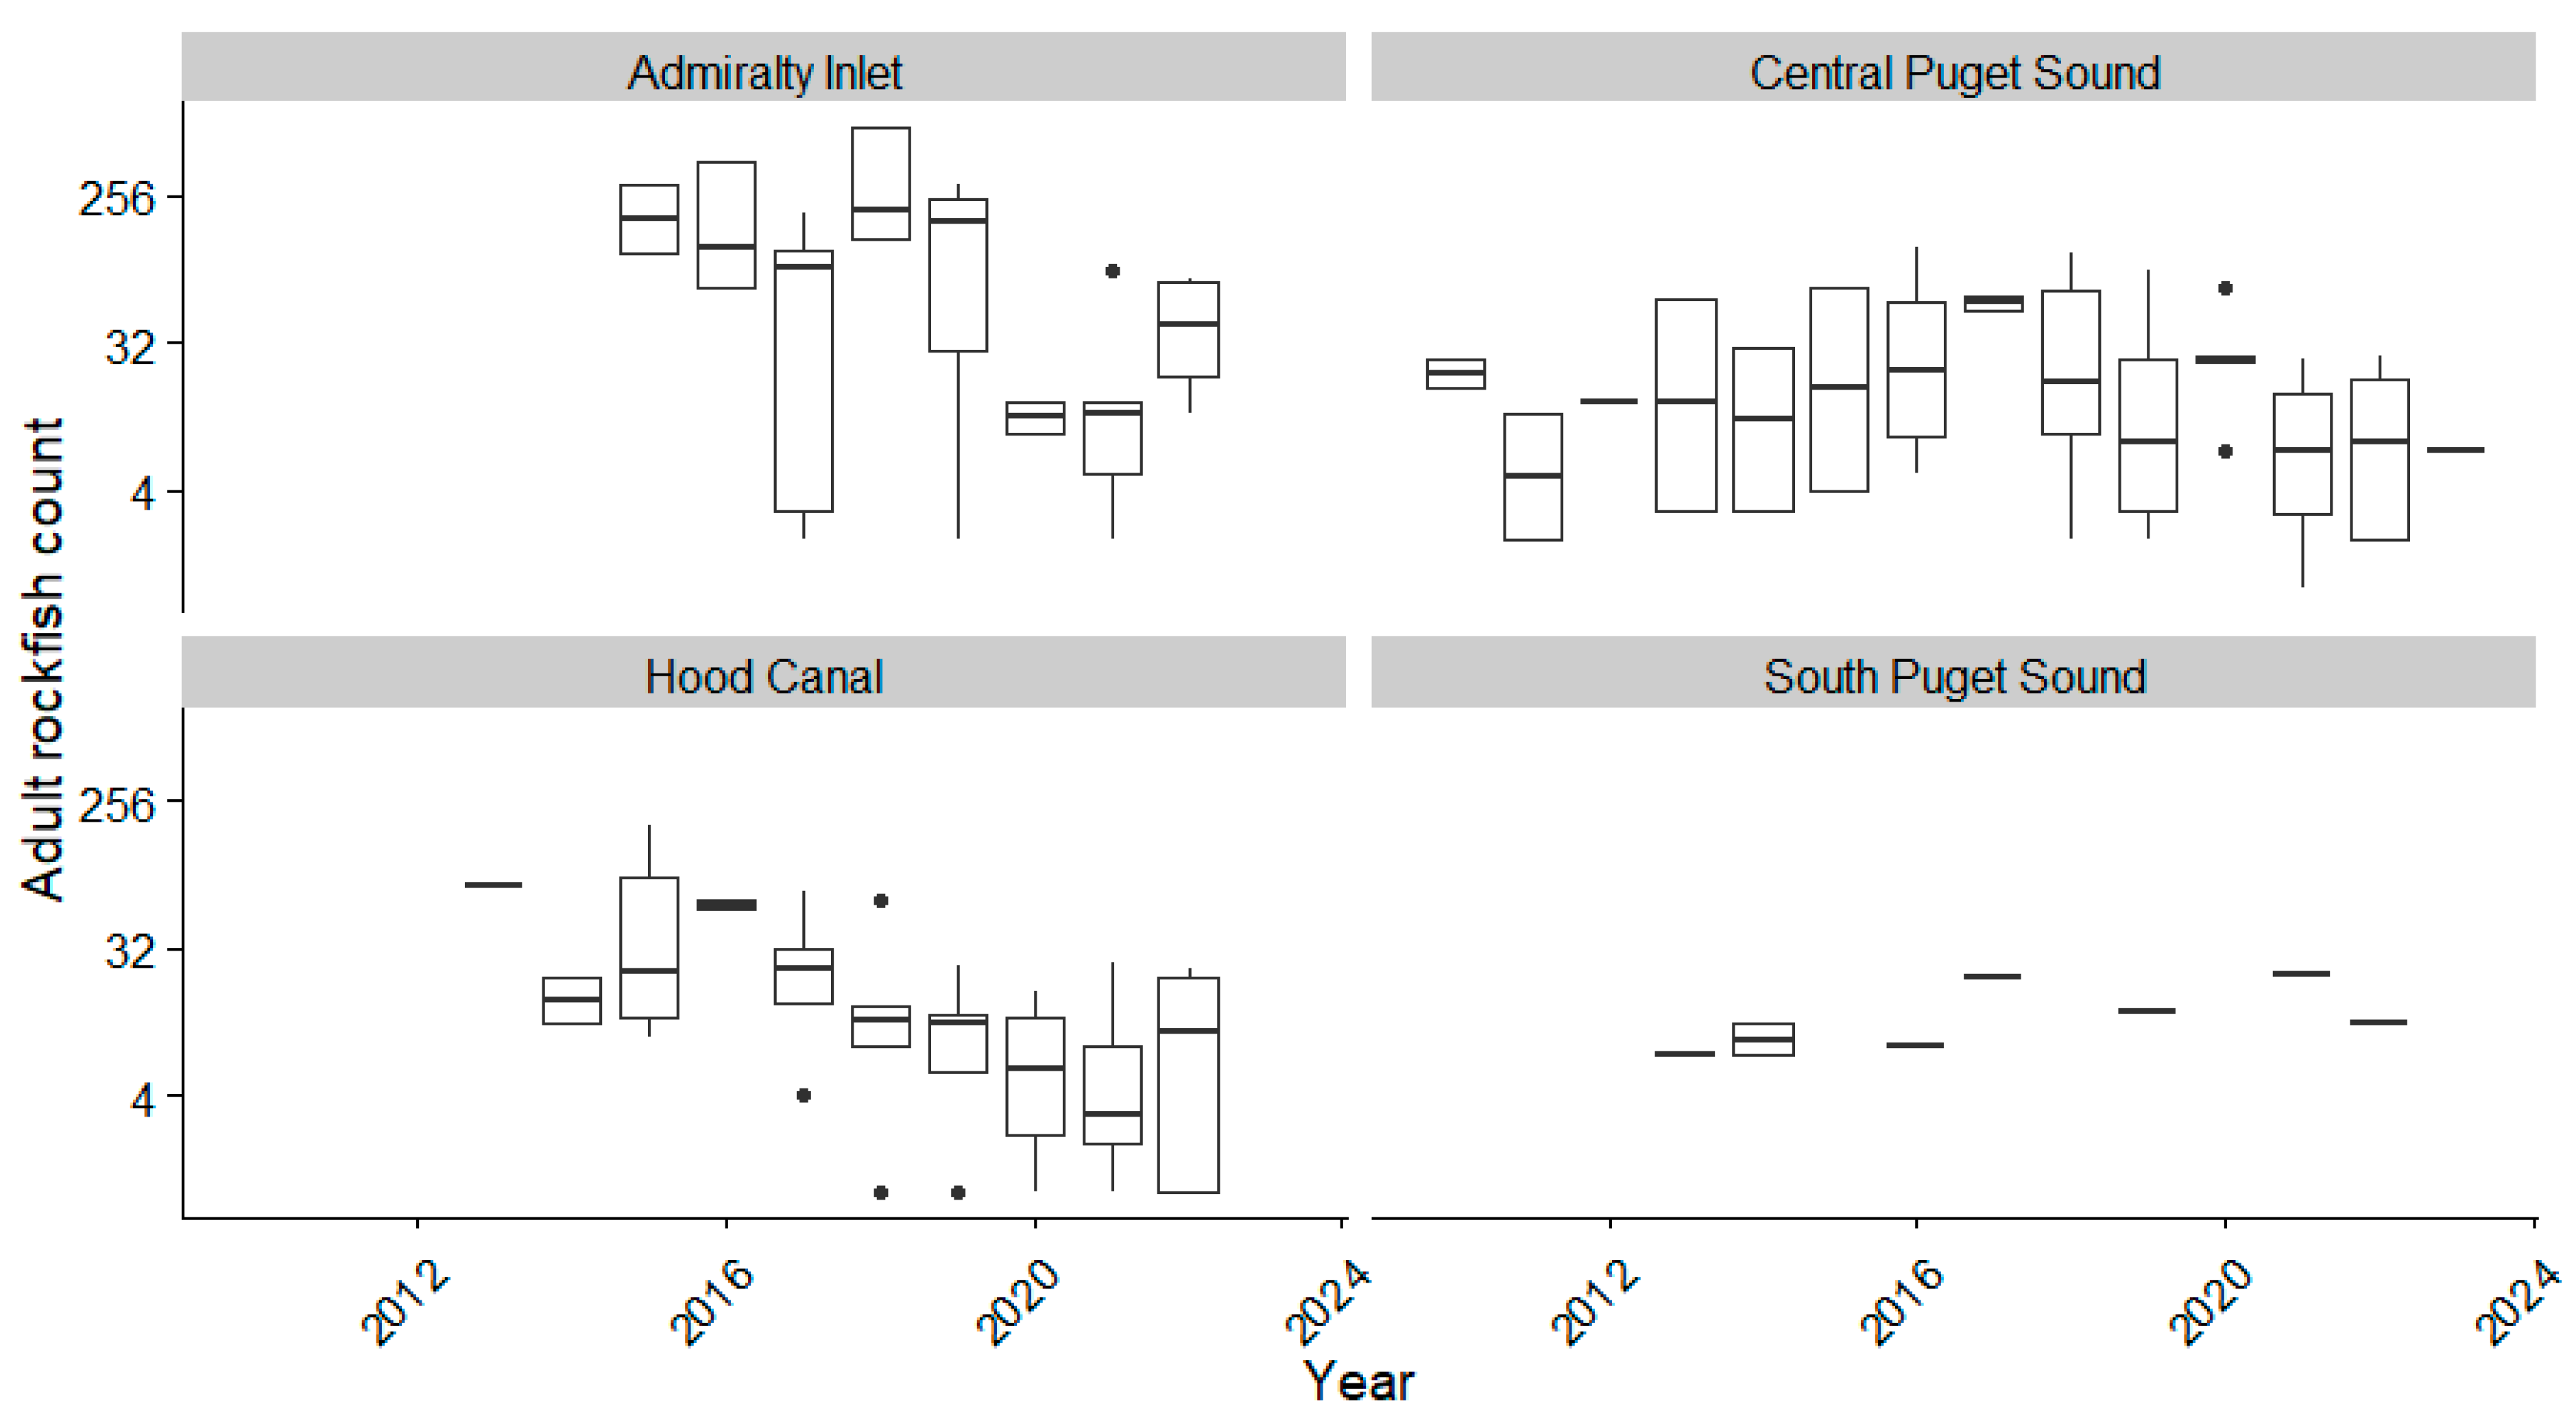
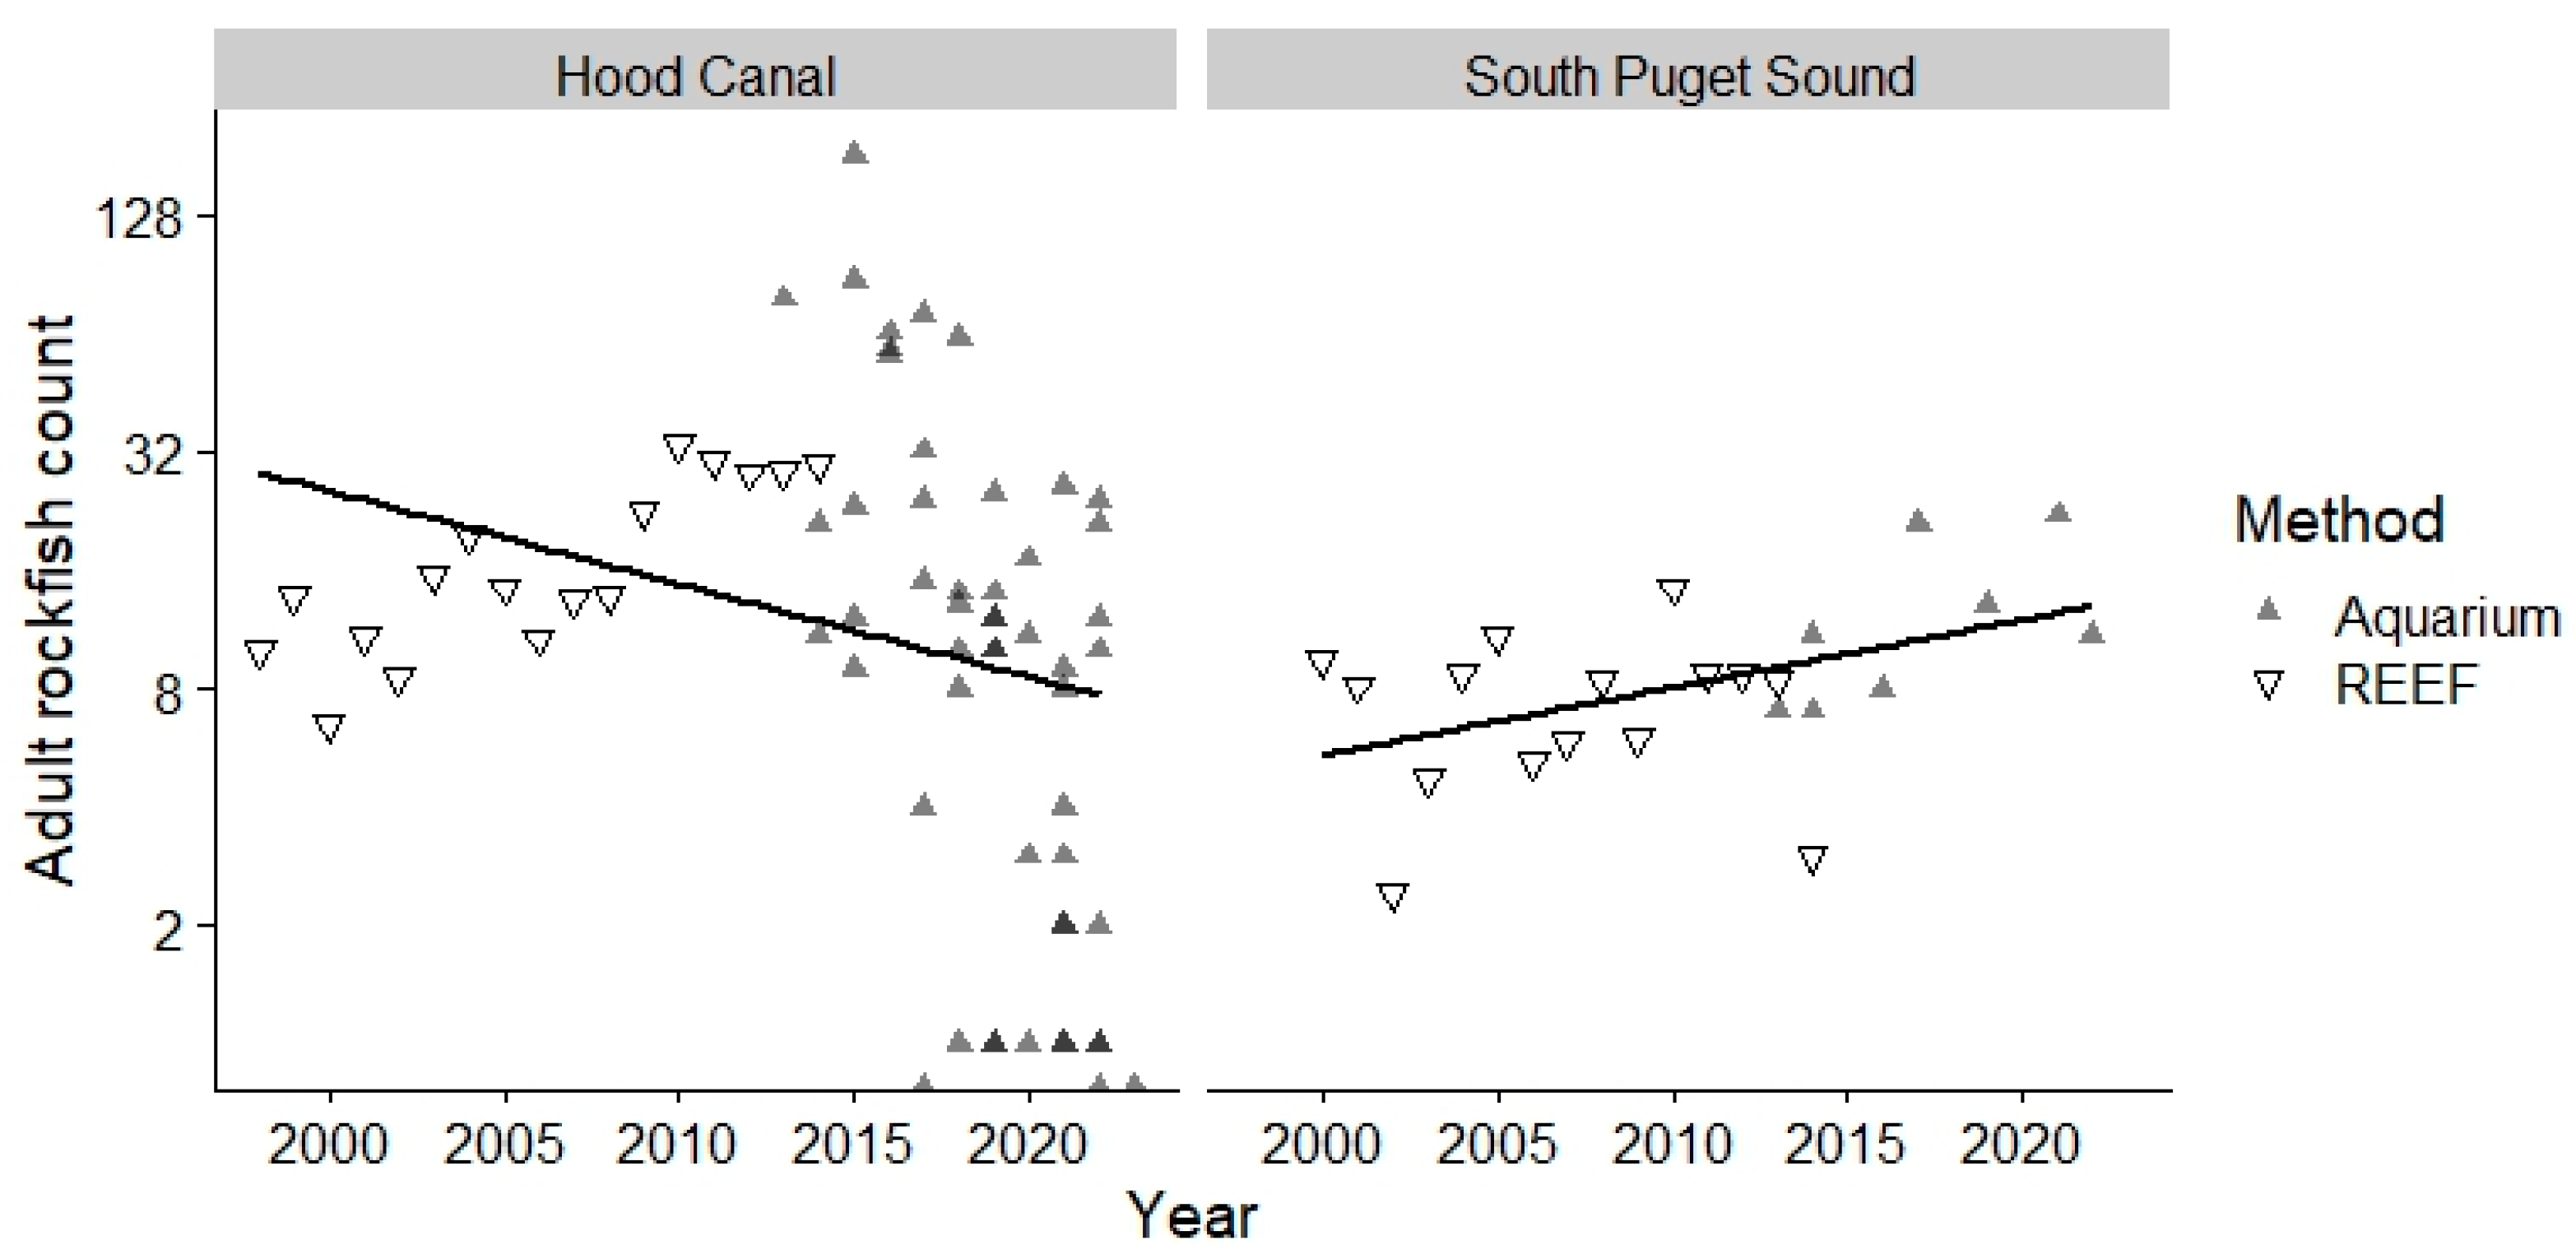
3.2. Differences between Basins

In addition to the differences in trends between basins, we also observed differences in community structure (Figure 4). For example, Yellowtail, Black, and Puget Sound rockfish were observed in higher abundance at our sites in Admiralty Inlet, where we did not often observe Brown rockfish (Figure 2 and Figure 4A). Community structures between the basins differed significantly, although in most cases, this may be attributed to significant deviance in the point dispersion between groups. Pairwise comparisons of groupings revealed statistically significant differences in point dispersion between all basins except Admiralty Inlet and Central Puget Sound. PERMANOVA analysis including just these basins (Admiralty Inlet vs. Central Puget Sound) revealed a significant difference in community structure between the two (Figure 4B; Pseudo F = 18.3, R2 = 0.169, Pr(>F) < 0.001).
When looking at potential environmental drivers for these differences, there were no significant trends in water quality parameters over time for 2009–2017. However, there were clear differences in baseline parameters between basins (Figure A3). Hood Canal experienced lower values of dissolved oxygen (range = 0.37–13.70 mg/L) compared with the primary channel of Central Puget Sound (range = 5.72–14.09 mg/L) during the study period. Admiralty Inlet and Central Puget Sound also differed significantly (p < 0.05) for temperature, pH, and DO, although the only notable difference in range for these parameters was for temperatures, with Central Puget Sound experiencing warmer water temperatures (7.33–18.5 °C) compared to temperatures measured in Admiralty Inlet (7.02–12.52 °C).

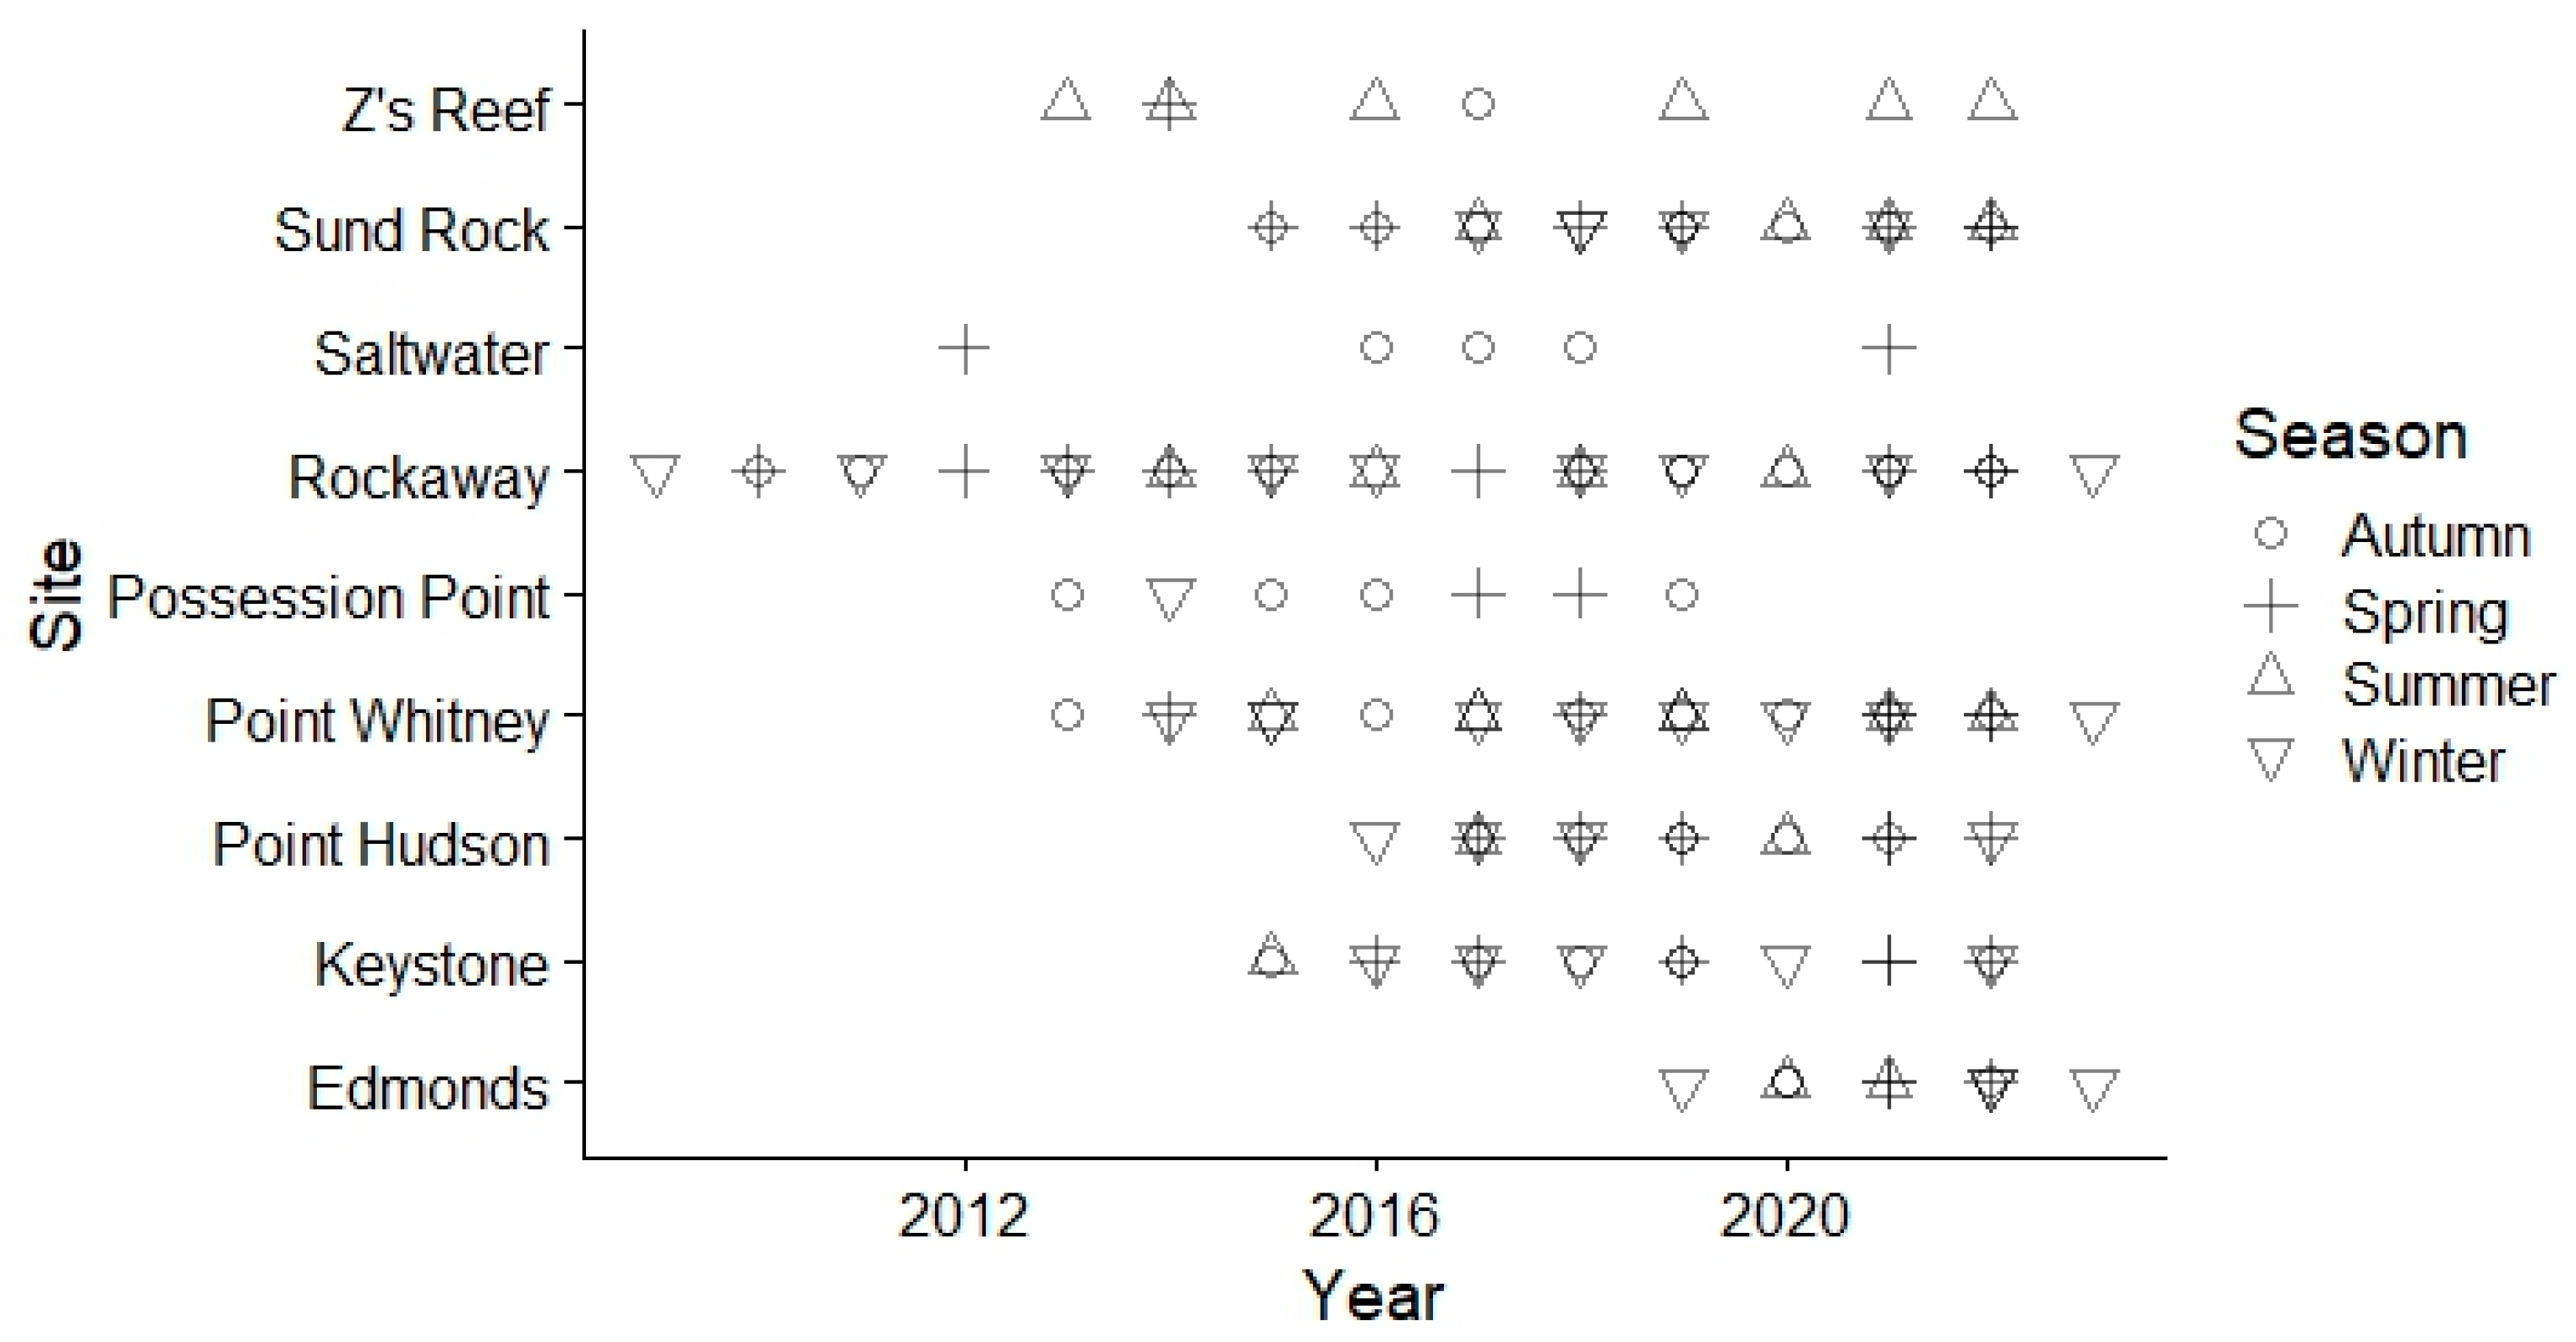
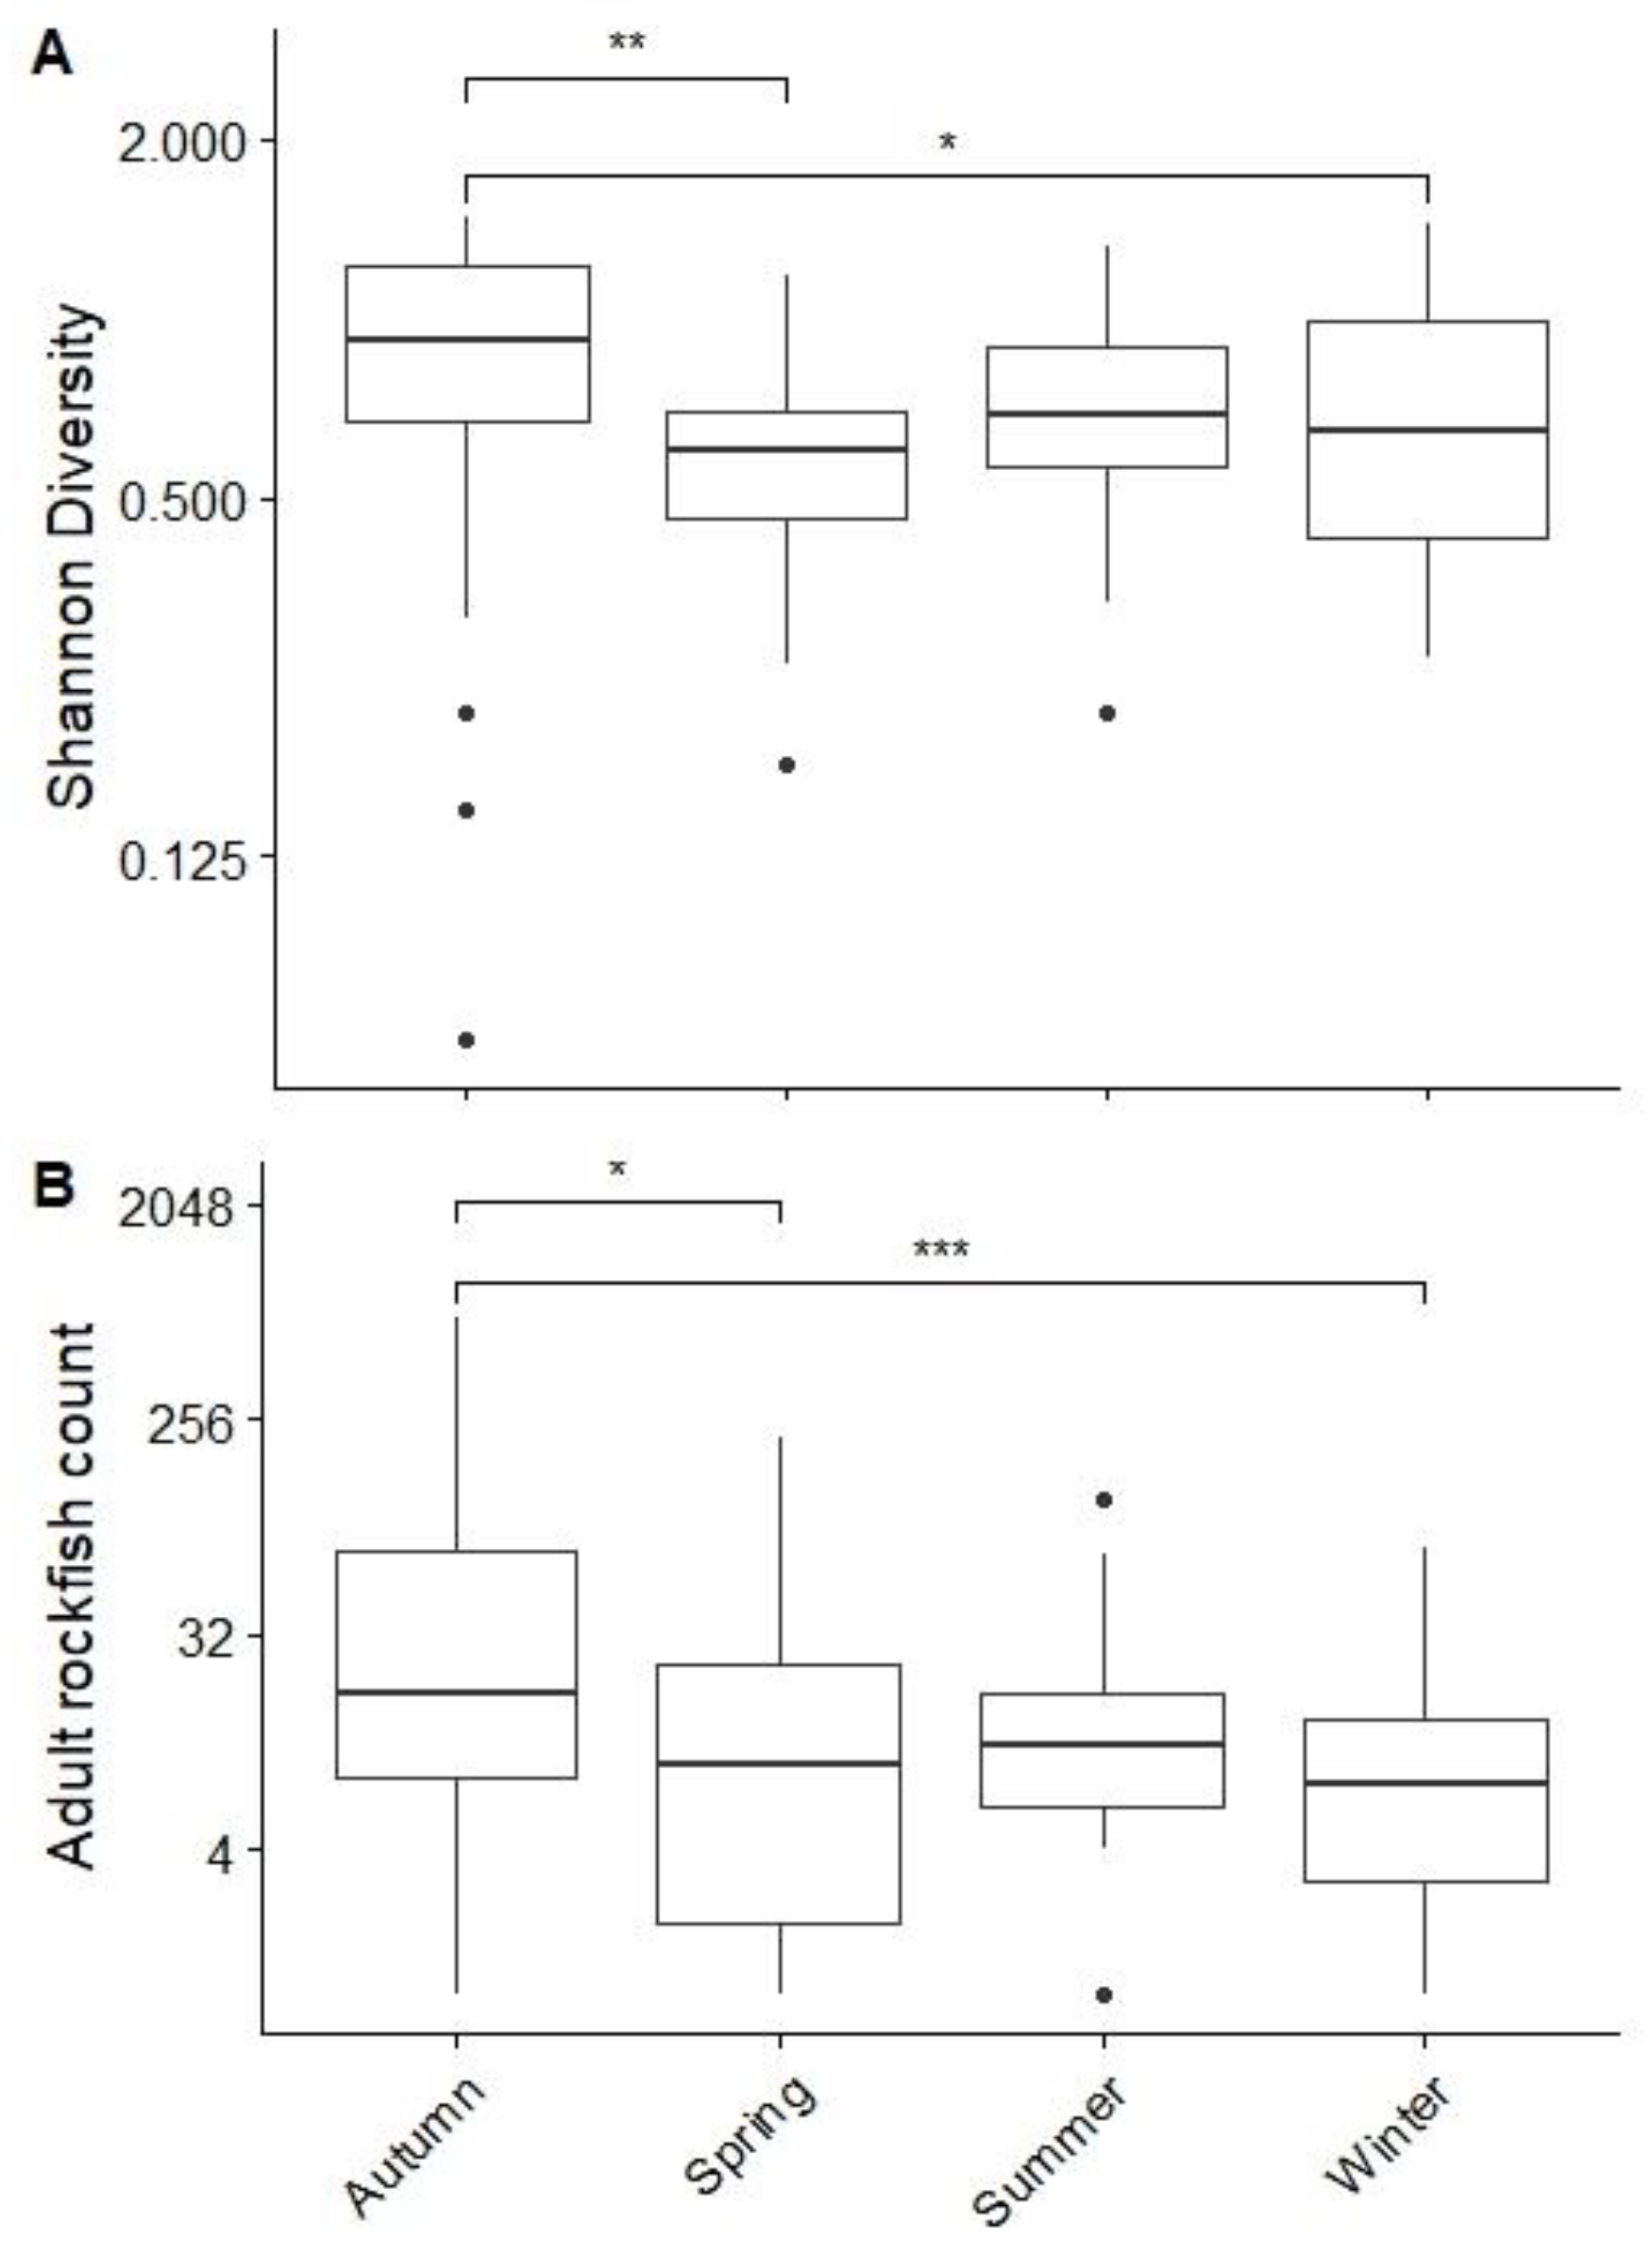
3.3. Differences between Seasons

Neither the Shannon Diversity Index nor adult rockfish count varied independently of season. According to a Two-Way ANOVA and post-hoc Tukey test, diversity indices differed significantly between autumn and spring (Figure 5; p < 0.05). Autumn and winter diversity indices differed marginally (Figure 5; p < 0.1). Additionally, autumn and winter counts differed significantly according to Kruskal–Wallace ranked sums test and post-hoc Dunn’s and DSCF tests (Figure 5; p < 0.01), and autumn and spring differed marginally (Figure 5; p < 0.1).

4. Discussion

4.1. Rockfish Demographics

In this study, we found location-based distinctions in rockfish assemblages. At our two sites in Admiralty Inlet, we observed higher counts of Black and Yellowtail rockfish relative to the other site groupings. These are both pelagic rockfish species that tend to school in the open water [1,2]; the proximity of these sites to the opening of the Strait of Juan de Fuca may explain some of this result, although previous work has found Yellowtail and Black rockfish distributed throughout Puget Sound [2]. We also observed more Puget Sound rockfish at these sites relative to further south in Puget Sound and Hood Canal. This finding agrees with Palsson et al. [2], which reports Puget Sound rockfish to be more commonly observed in northern Puget Sound relative to further south. The scarcity of Brown rockfish, a low current species, at Admiralty Inlet sites is likely due to the high current in Admiralty Inlet relative to Hood Canal or Puget Sound’s main channel.
We also observed seasonality in both adult rockfish count and Shannon Diversity index, with fewer rockfish observed and lower diversity in winter/spring compared with summer/autumn. This is based on 26–51 surveys per season, with autumn most well-represented and summer least well-represented in our sample. There are known seasonal shifts in the movement of the frequently observed species in our study. Puget Sound rockfish have been observed retreating into caves during the winter [1], Copper rockfish have been observed leaving shallow rocks in late autumn through early spring in the Puget Sound [1], Black rockfish are migratory off the coast of Oregon [36] and around the San Juan Islands [37], and Yellowtail rockfish have inshore to offshore migration, potentially associated with when they mature rather than seasonality [37]. While we did not observe seasonality in individual species but rather collectively, some of these species’ behaviors may have contributed to our findings.

4.2. Rockfish Decline and Recovery

We found a geographically selective decline in rockfish, specifically Copper rockfish, at sites in Hood Canal. There was a slight decrease in total adult rockfish observed over time at sites in Admiralty Inlet, stability in rockfish in Central Puget Sound, and slight increases in South Puget Sound. Hood Canal has been characterized by low dissolved oxygen (DO) concentration, particularly in southern Hood Canal [38]. Indeed, episodic cases of extremely low oxygen have been observed in Hood Canal, which has led to past fish die-offs [39]. Based on environmental data obtained from the Department of Ecology, we observed relatively low DO but did not find any significant correlation between our copper rockfish counts in Hood Canal and DO levels. Copper rockfish are characterized by small home ranges and having relatively high site fidelity [1,2,37]. Thus, they may simply have relocated slightly, swimming just below or above our survey sites, a possibility supported by anecdotal observations at Sund Rock from our field team. Interspecific competition is unlikely to be the root cause of this relocation, as there was no corresponding increase in any other species at Hood Canal sites. Early observations may have been part of a transient behavior change in Copper rockfish behavior. Or, our findings may reflect a true continued decline in Copper rockfish in the Hood Canal region, regardless of low oxygen impact, interspecific interactions, or behavior changes.
Anecdotally, Seattle Aquarium divers have reported an increase in rockfish, particularly Black rockfish, observed over the last decade [40]; however, our data only support a positive trend in rockfish counts within South Puget Sound, specifically for Copper rockfish. Even within Admiralty Inlet sites where Black rockfish were most frequently observed, there was no significant relationship between Black rockfish count and year. Vermilion rockfish have also been reported to be observed at greater frequency since 2008 [40]; we observed one Vermilion rockfish at Saltwater State Park in 2012, which is not enough to draw any conclusions beyond presence/absence.
Given the increased protection afforded to rockfish in Puget Sound from fishing regulations since 2010, the lack of an upward trend observed in our data is concerning. Some possible explanations include the study timeframe or sampling coverage being insufficient to capture recovery or other variables preventing recovery. Previously identified stressors for rockfish include fishery removals, derelict gear, hypoxia, and food web interactions [2]. While direct fishery removals have been reduced dramatically through the commercial moratorium in 1999 and subsequent policies restricting all recreational fishing, rockfish still interact and are caught incidentally with derelict gear and gear from other fisheries. For example, Copper and Quillback rockfish were the most frequently observed rockfish species caught in derelict gear from spot prawn traps [41], and an estimated 4317 rockfish were trapped annually by the derelict nets removed from 2002 to 2014 [42].
Fourteen years of seasonal 100-m transects may be insufficient spatiotemporally to track rockfish abundance gains. Temporally, even though many of the rockfish we observed mature earlier than Yelloweye rockfish, such as the Copper rockfish, which mature around 7 years [1], given their irregular recruitment events, it may not be enough time to observe population growth. We observed just two major recruitment events at one survey site, with large schools of Yellowtail YOY at Keystone Jetty in Admiralty Inlet in 2016 and 2022. Yellowtail rockfish mature between 5–8 years [43,44]; thus, while Yellowtail adults from the first recruitment event may now be contributing to the population, we would not expect adults from the second event to be reproductively viable until 2027–2030. That said, previous studies have observed positive trends in similar or even narrower time scales. For example, Thompson et al. [45] found an increase in rockfish larval abundances for ten out of fifteen species studied from 1998 to 2013 in California’s Cowcod Conservation Areas. Their study overlapped with good environmental conditions for rockfish reproduction, which may have contributed to their positive results [45]. Moreover, their focus on larvae rather than mature rockfish may make their study more sensitive to fine-scale recovery.
As another example, Tolimieri et al. [46] found different trends in rockfish counts based on method and time scale. WDFW recreational surveys observed a decline in log-abundance indices of rockfish catch per unit effort from 1970 to 2010s, while REEF citizen science dive surveys from 2000 to 2010s observed improved log-abundance indices for average minimum abundance of rockfish over time [12,46]. Of these two approaches, the REEF surveys were more like our methods and, therefore, more directly comparable. The REEF surveys identified an increased abundance of rockfish in South Puget Sound (called Marine Catch Area 13), a trend which our observation of mild gains in South Puget Sound for 2009–2023 continues. However, they also found an increasing trend for rockfish abundance in Hood Canal for 2000–2010, and our data revealed decreased counts in this region for 2009–2023. When we combine our data with the raw data used by Tolimieri et al. [46], clearer trends emerge. Total Puget Sound rockfish counts stabilize, South Puget Sound trends significantly upward, and Hood Canal maintains the downward trend (Figure A4 and Figure A5). This is a very rough comparison, as the citizen science surveys rely on abundance estimates for a given dive in situ rather than video recordings of a 100-m transect; however, it suggests that a timescale closer to 20 years would be more appropriate to assess rockfish trends. It also suggests opportunities to standardize methods and collate data for future research.

4.3. Study Limitations and Future Directions

Sites were selected based on reported rockfish presence and representing a wide spatial range of the Puget Sound rather than based on equal numbers of sites per basin. This was most limiting in terms of representing South Puget Sound. South Puget Sound sites showed mild gains in rockfish over time; however, with only eight surveys, there was not enough statistical power to find more than a marginal correlation. Over time, as we continue sampling at this site, we should gain enough data to validate or invalidate this trend. Our sites were also selected to reflect a specific habitat type, that is, rocky reefs or similar structures. This selects against more highly mobile, non-site specific aggregating mid-water rockfish species. Researchers who are interested in assessing the status of these species would likely need to select different sites from the ones we observed. Similarly, our depth restricts us from observing deeper swimming rockfish species, such as Yelloweye.
There are opportunities to expand this study’s depth range through advanced diving or ROV (remotely operated vehicle) methods, which may be able to capture species and interactions occurring at greater depths. Quarterly sampling is demanding on resources, and future research could instead sample biannually, once in winter/spring and again in summer/autumn. Doing so would reduce sampling effort while still capturing seasonal fluctuations according to the pattern that we have observed thus far. In addition, adding more consistent habitat (water quality, bottom type, current speed, etc.) monitoring and analysis associated with rockfish assemblages may add insights into the environmental drivers that facilitate rockfish recovery.
While we can make assertions about the rockfish we observe over time, we are unable to link our findings to fishing regulations. Our study began in 2009, which means we have only one year of data that pre-dates the 2010 fishing ban. This and our lack of still-fished sites as controls prevent looking at causal relationships. It would be scientifically useful to compare our findings against regions with active fishing, although it is not a practically viable option in this ecosystem. It would be interesting to conduct a more formal analysis of dive survey data, including our surveys as well as the REEF citizen science surveys, which pre-date the moratorium on rockfish take in Puget Sound [46].

5. Conclusions

In this study, we observed inter-basin variation in rockfish trends over the study period, most notably a significant negative relationship between Copper rockfish (S. caurinus) counts vs. year at sites in Hood Canal and no significant gains for total rockfish in any basin. This may indicate too short a study timeframe compared with recovery time or that other variables are preventing rockfish recovery in Puget Sound. Significant differences in community structure between basins were also observed when comparing assemblages in Admiralty Inlet vs. Central Puget Sound; we noted more Black (S. melanops), Yellowtail (S. flavidus), and Puget Sound (S. emphaeus) rockfish at sites in Admiralty Inlet and fewer Brown rockfish (S. auriculatus). This study revealed seasonal variation in adult rockfish counts and Shannon Diversity, with possibly more rockfish observed and higher diversity in summer/autumn compared with winter/spring. We recommend continued systematic monitoring of rockfish in Puget Sound.

Author Contributions

Conceptualization, S.L. and J.C.; methodology, S.L. and J.C.; software, K.N.S., A.Y.O. and M.H.W.; validation, S.L.; formal analysis, K.N.S.; investigation, A.T., A.Y.O., M.H.W., J.C., H.W., C.V.D., S.L. and K.N.S.; resources, S.L.; data curation, S.L., A.T., A.Y.O., H.W. and K.N.S.; writing—original draft preparation, K.N.S.; writing—review and editing, S.L., M.H.W., A.Y.O., A.T., J.C., H.W. and C.V.D.; visualization, K.N.S. and M.H.W.; supervision, S.L.; project administration, S.L.; funding acquisition, S.L. and H.W. All authors have read and agreed to the published version of the manuscript.

Funding

This research was funded under the Seattle Aquarium operating budget, with additional funding through Pacific Northwest Zoos & Aquariums for underwater video equipment and the Foley Frischkorn Conservation Fund. South Sound data collection was supported by funding from the Holly Reed Conservation Fund/Point Defiance Zoo Society.

Institutional Review Board Statement

Not applicable.

Data Availability Statement

Acknowledgments

We would like to thank the Aquarium staff and volunteers who participated in and supported this research. Special thanks to Zachary Randell for his coding support, the dive safety teams and divers at Seattle Aquarium and Point Defiance Zoo & Aquarium, and Erin Meyer and Jim Wharton for keeping this research on the operating budget. Thank you to the four reviewers of this manuscript for their feedback.

Conflicts of Interest

The authors declare no conflict of interest.

Appendix A

Table A1. Survey dates and locations with Young-of-the-Year (YOY) rockfish observed.
BasinSiteDateSeasonCount
Admiralty InletKeystone Jetty2016-12-13Winter409 *
Admiralty InletKeystone Jetty2019-11-13Autumn1
Central Puget SoundEdmonds Underwater Park2020-10-06Autumn3
Central Puget SoundEdmonds Underwater Park2021-08-03Summer1
Admiralty InletKeystone Jetty2022-10-18Autumn21
Admiralty InletKeystone Jetty2022-05-25Spring377 *
* Recruitment event.
Figure A1. Sampling effort by site and season. Points indicate that a site was sampled for a given year in a given season.
Fishes 08 00508 g0a1
Figure A2. Boxplots of adult rockfish count per survey, grouped by year and basin. Y-axes are log-transformed for better visualization of low values.
Fishes 08 00508 g0a2
Table A2. Cor.test Kendall’s rank correlation test results comparing adult rockfish count with year for species listed. Tests run for species for all surveys and for surveys within each basin; results with p-value < 0.1 are displayed.
Rockfish SpeciesCor.test Result ParameterAll SitesAdmiralty InletCentral Puget SoundSouth Puget SoundHood Canal
BlackTau −0.262
p-value 0.012 *
BrownTau−0.154
p-value0.017 *
CopperTau−0.097 0.539−0.461
p-value0.099 0.0745.37 × 10−6 **
QuillbackTau−0.197 −0.307
p-value0.004 ** 0.009 **
YellowtailTau −0.229
p-value 0.075
* denotes p-value < 0.05; ** denotes p-value < 0.01.
Figure A3. Boxplot of environmental parameters by basin, displaying signifance thresholds from pairwise Kruskal-Wallace tests. Significance thresholds are as follows: p < 0.05 *, p < 0.01 **, p < 0.001 *** and p < 0.0001 ****. Environmental parameters included are dissolved oxygen (DO) in mg/L (n = 1202), pH (n = 728), and temperature (Temp) in degrees Celsius (n = 1212). Note that low p-values are likely associated with high sample sizes, so only visually obvious patterns are noted in the text.
Fishes 08 00508 g0a3
Figure A4. Scatterplot of adult rockfish counts and abundance estimates per year (discrete), combining REEF citizen science surveys [46] with our data, with log-transformed y-axis for improved visualization of low values. No significant correlation.
Fishes 08 00508 g0a4
Figure A5. Scatterplot of adult rockfish counts and abundance estimates per year (discrete) for South Puget Sound and Hood Canal Basins, combining REEF citizen science surveys [46] with our data. y-axis is log-transformed for better visualization of low values. In Hood Canal, adult rockfish count correlates significantly negatively with year (p < 0.001, tau = −0.307), and in South Puget Sound, adult rockfish count correlates significantly positively with year (p < 0.05, tau = 0.316).
Fishes 08 00508 g0a5

References

  1. Love, M.S.; Yoklavich, M.; Thorsteinson, L.K. The Rockfishes of the Northeast Pacific; University of California Press: Berkeley, CA, USA, 2002. [Google Scholar]
  2. Palsson, W.A.; Tsou, T.-S.; Bargmann, G.G.; Buckley, R.M.; West, J.E.; Mills, M.L.; Cheng, Y.W.; Pacunski, R.E. The Biology and Assessment of Rockfishes in Puget Sound; Washington Department of Fish and Wildlife: Olympia, WA, USA, 2009. Available online: https://wdfw.wa.gov/sites/default/files/publications/00926/wdfw00926.pdf (accessed on 15 April 2023).
  3. Williams, G.D.; Levin, P.S.; Palsson, W.A. Rockfish in Puget Sound: An Ecological Historiy of Exploitation. Mar. Policy 2010, 34, 1010–1020. [Google Scholar] [CrossRef]
  4. Ray, T. Fishes of the Salish Sea. Artwork: Crylic on Canvas, 7 by 15 ft. 2011. Available online: https://www.trollart.com/2011/10/14/fishes-of-the-salish-sea-mural-at-uw/ (accessed on 15 April 2023).
  5. Starks, E.C. Results of an Ichthyological Survey about the San Juan Islands, Washington. Ann. Carnegie Mus. 1911, 7, 162–213. [Google Scholar] [CrossRef]
  6. Cramer, F. On the Cranial Characters of the Genus Sebastodes (Rock-Fish). In Proceedings of the California Academy of Sciences, San Francisco, CA, USA, 4 October 1895; Volume 2, pp. 57–70. [Google Scholar]
  7. National Marine Fisheries Service. Rockfish Recovery Plan: Puget Sound/Georgia Basin Yelloweye Rockfish (Sebastes Ruberrimus) and Bocaccio (Sebastes Paucispinis); National Marine Fisheries Service: Seattle, WA, USA, 2017. [Google Scholar]
  8. Court Case: United States v. Washington, 384 F. Supp. 312, aff’d, 520 F.2d 676 (9th Cir. 1974). Available online: https://casetext.com/case/united-states-v-state-of-washington-6 (accessed on 15 April 2023).
  9. 1833 U.N.T.S. 397 (Entered into Force 1 November 1994); Convention on the Law of the Sea: Montego Bay, Jamaica, 1982.
  10. Beaudreau, A.H.; Whitney, E.J. Historical Patterns and Drivers of Spatial Changes in Recreational Fishing Activity in Puget Sound, Washington. PLoS ONE 2016, 11, e0152190. [Google Scholar] [CrossRef] [PubMed]
  11. Washington Department of Fish and Wildlife. Final Puget Sound Rockfish Conservation Plan Policies, Strategies and Actions Including Preferred Range of Actions; Washington Department of Fish and Wildlife: Olympia, WA, USA, 2011. Available online: https://wdfw.wa.gov/sites/default/files/publications/00035/apr2011_rockfish_conservation_plan.pdf (accessed on 10 May 2023).
  12. Daniel, T.; Bhuthimethee, M.; Sawchuk, J.H.; Tolimieri, N.; Andrews, K.; Nichols, K. Yelloweye Rockfish (Sebastes ruberrimus), Canary Rockfish (Sebastes pinniger), and Bocaccio (Sebastes paucispinis) of the Puget Sound/Georgia Basin 5-Year Review: Summary and Evaluation Published; NOAA’s National Marine Fisheries Service: Silver Spring, MD, USA, 2016. Available online: https://repository.library.noaa.gov/view/noaa/17805 (accessed on 10 May 2023).
  13. Ayres, W.O. Description of New Fishes from California. The Pacific, 4th ed. 1854; Volume 3. [Google Scholar]
  14. Gill, T.N. Critical Remarks on the Genera Sebastes and Sebastodes of Ayres. Proc. Acad. Nat. Sci. Phila. 1864, 16, 145–147. [Google Scholar]
  15. Drake, J.S.; Berntson, E.A.; Gustafson, R.G.; Holmes, E.E.; Levin, P.S.; Tolimieri, N.; Waples, R.S.; Sogard, S.M.; Williams, G.D.; Cope, J.M. Status Review of Five Rockfish Species in Puget Sound, Washington: Bocaccio (Sebastes paucispinis), Canary Rockfish (S. pinniger), Yelloweye Rockfish (S. ruberrimus), Greenstriped Rockfish (S. elongatus), and Redstripe Rockfish (S. proriger); NOAA: Silver Spring, MD, USA, 2010. Available online: https://repository.library.noaa.gov/view/noaa/3777 (accessed on 10 May 2023).
  16. Andrews, K.; Nichols, K.; Harvey, C.; Tolimieri, N.; Obaza, A.; Garner, R.; Tonnes, D. All Hands on Deck: Local Ecological Knowledge and Expert Volunteers Contribute to the First Delisting of a Marine Fish Species under the Endangered Species Act. Citiz. Sci. Theory Pract. 2019, 4, 37. [Google Scholar] [CrossRef]
  17. Washington State Legislation. Possession Limits—Bottomfish, § 220-314-020 (n.d.). Available online: https://app.leg.wa.gov/WAC/default.aspx?cite=220-314-020 (accessed on 15 August 2023).
  18. Sawchuk, J.H.; Beaudreau, A.H.; Tonnes, D.; Fluharty, D. Using Stakeholder Engagement to Inform Endangered Species Management and Improve Conservation. Mar. Policy 2015, 54, 98–107. [Google Scholar] [CrossRef]
  19. Walker, S.; Mozaria-Luna, H.N.; Kaplan, I.; Petatán-Ramírez, D. Future Temperature and Salinity in Puget Sound, Washington State, under CMIP6 Climate Change Scenarios. J. Water Clim. Chang. 2022, 13, 4255–4272. [Google Scholar] [CrossRef]
  20. NOAA National Centers for Environmental Information (NCEI). Digital Elevation Models Global Mosaic; NOAA National Centers for Environmental Information: Silver Spring, MD, USA, 2017. [Google Scholar]
  21. Larson, S.; Christiansen, J.; Olsen, A.Y.; Walsh, W.J.; Teague, C.H.; Tissot, B.; Randell, Z. A Unique 100 Meter Underwater Survey Method Documents Changes in Abundance, Richness, and Community Structure of Hawai’i Reef Fishes. Front. Mar. Sci. 2022, 9, 892261. [Google Scholar] [CrossRef]
  22. Andrew, L.; Edgell, P. Coastal Fishes of the Pacific Northwest; Harbour Publisher: Pender Harbour, BC, Canada, 1986. [Google Scholar]
  23. Young-of-Year Rockfishes Citizen Science Survey Guide. NOAA, n.d. Available online: https://media.fisheries.noaa.gov/dam-migration/rockfish_guide_reduced.pdf (accessed on 1 April 2023).
  24. Fisher, R.A.; Corbet, A.S.; Williams, C.B. The Relation between the Number of Species and the Number of Individuals in a Random Sample of Animal Population. J. Anim. Ecol. 1943, 12, 42–58. [Google Scholar] [CrossRef]
  25. Oksanen, J.; Blanchet, F.G.; Kindt, R.; Legendre, P.; O’hara, R.B.; Simpson, G.L.; Solymos, P.; Stevens, M.H.H.; Wagner, H. Vegan: Community Ecology Package, R Package Version. 2.6-4. 2022. Available online: https://CRAN.R-project.org/package=vegan (accessed on 1 May 2023).
  26. Myles, H.; Wolfe, D.A. Nonparametric Statistical Methods; John Wiley & Sons: New York, NY, USA, 1973. [Google Scholar]
  27. Wickham, H. Ggplot2: Elegant Graphics for Data Analysis; Springer: New York, NY, USA, 2016. [Google Scholar]
  28. Wickham, H.; Averick, M.; Bryan, J.; Chang, W.; McGowan, L.D.A.; François, R.; Grolemund, G.; Hayes, A.; Henry, L.; Hester, J.; et al. Welcome to the Tidyverse. J. Open Source Softw. 2019, 4, 1686. [Google Scholar] [CrossRef]
  29. Chambers, J.M.; Freeny, A.; Heiberger, R.M. Analysis of Variance; Designed Experiments. In Statistical Models in S; Wadsworth & Brooks/Cole: New York, NY, USA, 1992. [Google Scholar]
  30. R Core Team. R: A Language and Environment for Statistical Computing; R Foundation for Statistical Computing: Vienna, Austria, 2023; Available online: https://www.R-project.org/ (accessed on 1 August 2023).
  31. Ogle, D.H.; Doll, J.C.; Wheeler, A.P.; Dinno, A. FSA: Simple Fisheries Stock Assessment Methods, R package version 0.9.4; 2023. Available online: https://CRAN.R-project.org/package=FSA (accessed on 4 June 2023).
  32. Pohlert, T. PMCMRplus: Calculate Pairwise Multiple Comparisons of Mean Rank Sums Extended, R package version 1.9.6; 2022. Available online: https://CRAN.R-project.org/package=PMCMRplus (accessed on 4 June 2023).
  33. Kassambara, A. Ggpubr: ‘ggplot2’ Based Publication Ready Plots, R package version 0.6.0; 2023. Available online: https://CRAN.R-project.org/package=ggpubr (accessed on 23 May 2023).
  34. Wilke, C. Cowplot: Streamlined Plot Theme and Plot Annotations for ‘Ggplot2’, R package version 1.1.1; 2020. Available online: https://CRAN.R-project.org/package=cowplot (accessed on 23 May 2023).
  35. Washington State Department of Ecology. Long-Term Marine Water Column Monitoring 1999-Present. (Transitional Data That Has Not Yet Been through a Documented Data Entry Review Process Can Be Found in EIM Study ID ‘MarineWater-P’). Environmental Information Management System, 4 June 2019. Available online: https://ecology.wa.gov/Research-Data/Monitoring-assessment/Puget-Sound-and-marine-monitoring (accessed on 31 March 2023).
  36. Parker, S.J.; Rankin, P.S.; Olson, J.M.; Hannah, R.W. Movement Patterns of Black Rockfish (Sebastes Melanops) in Oregon Coastal Waters. In Biology, Assessment, and Management of North Pacific Rockfishes; Alaska Sea Grant College Program: Fairbanks, AK, USA, 2007. [Google Scholar]
  37. Mathews, S.B.; Barker, M.W. Movements of Rockfish (Sebastes) Tagged in Northern Puget Sound, Washington. Fish. Bull. 1983, 82, 916–922. [Google Scholar]
  38. Keister, J.E.; Winans, A.K.; Herrmann, B. Zooplankton Community Response to Seasonal Hypoxia: A Test of Three Hypotheses. Diversity 2020, 12, 21. [Google Scholar] [CrossRef]
  39. Newton, J.; Bassin, C.; Devol, A.; Kawase, M.; Ruef, W.; Warner, M.; Hannafious, D.; Rose, R. Hypoxia in Hood Canal: An Overview of Status and Contributing Factors; University of Washington: Seattle, WA, USA, 2007; Available online: https://www.researchgate.net/publication/237254567_Hypoxia_in_Hood_Canal_An_overview_of_status_and_contributing_factors/citations#fullTextFileContent (accessed on 2 August 2023).
  40. Christiansen, J. Personal Communication; Independent Researcher: Ollala, WA, USA, 2023. [Google Scholar]
  41. Antonelis, K.; Selleck, J.; Drinkwin, J.; Saltman, A.; Tonnes, D.; June, J. Bycatch of Rockfish in Spot Prawn Traps and Estimated Magnitude of Trap Loss in Washington Waters of the Salish Sea. Fish. Res. 2018, 208, 105–115. [Google Scholar] [CrossRef]
  42. Joan, D.; Antonelis, K. Observed Impacts of Derelict Fishing Nets on Rocky Reef Habitats and Associated Species in Puget Sound. In Proceedings of the Salish Sea Ecosystem Conference, Seattle, WA, USA, 5 February 2014; Available online: https://cedar.wwu.edu/ssec/2014ssec/Day3/124/ (accessed on 2 August 2023).
  43. Eldridge, M.B.; Whipple, J.A.; Bowers, M.J.; Jarvis, B.M.; Gold, J. Reproductive Performance of Yellowtail Rockfish, Sebastes Flavidus. Environ. Biol. Fishes 1991, 30, 91–102. [Google Scholar] [CrossRef]
  44. Six, L.D.; Horton, H.F. Analysis of Age Determination Methods for Yellowtail Rockfish, Canary Rockfish, and Black Rockfish off Oregon. Fish. Bull. 1997, 75, 405–414. [Google Scholar]
  45. Thompson, A.R.; Chen, D.C.; Guo, L.W.; Hyde, J.R.; Watson, W. Larval Abundances of Rockfishes that Were Historically Targeted by Fishing Increased over 16 Years in Association with a Large Marine Protected Area. R. Soc. Open Sci. 2017, 4, 170639. [Google Scholar] [CrossRef]
  46. Tolimieri, N.; Holmes, E.E.; Williams, G.D.; Pacunski, R.; Lowry, D. Population Assessment Using Multivariate Time-Series Analysis: A Case Study of Rockfishes in Puget Sound. Ecol. Evol. 2017, 7, 2846–2860. [Google Scholar] [CrossRef] [PubMed]
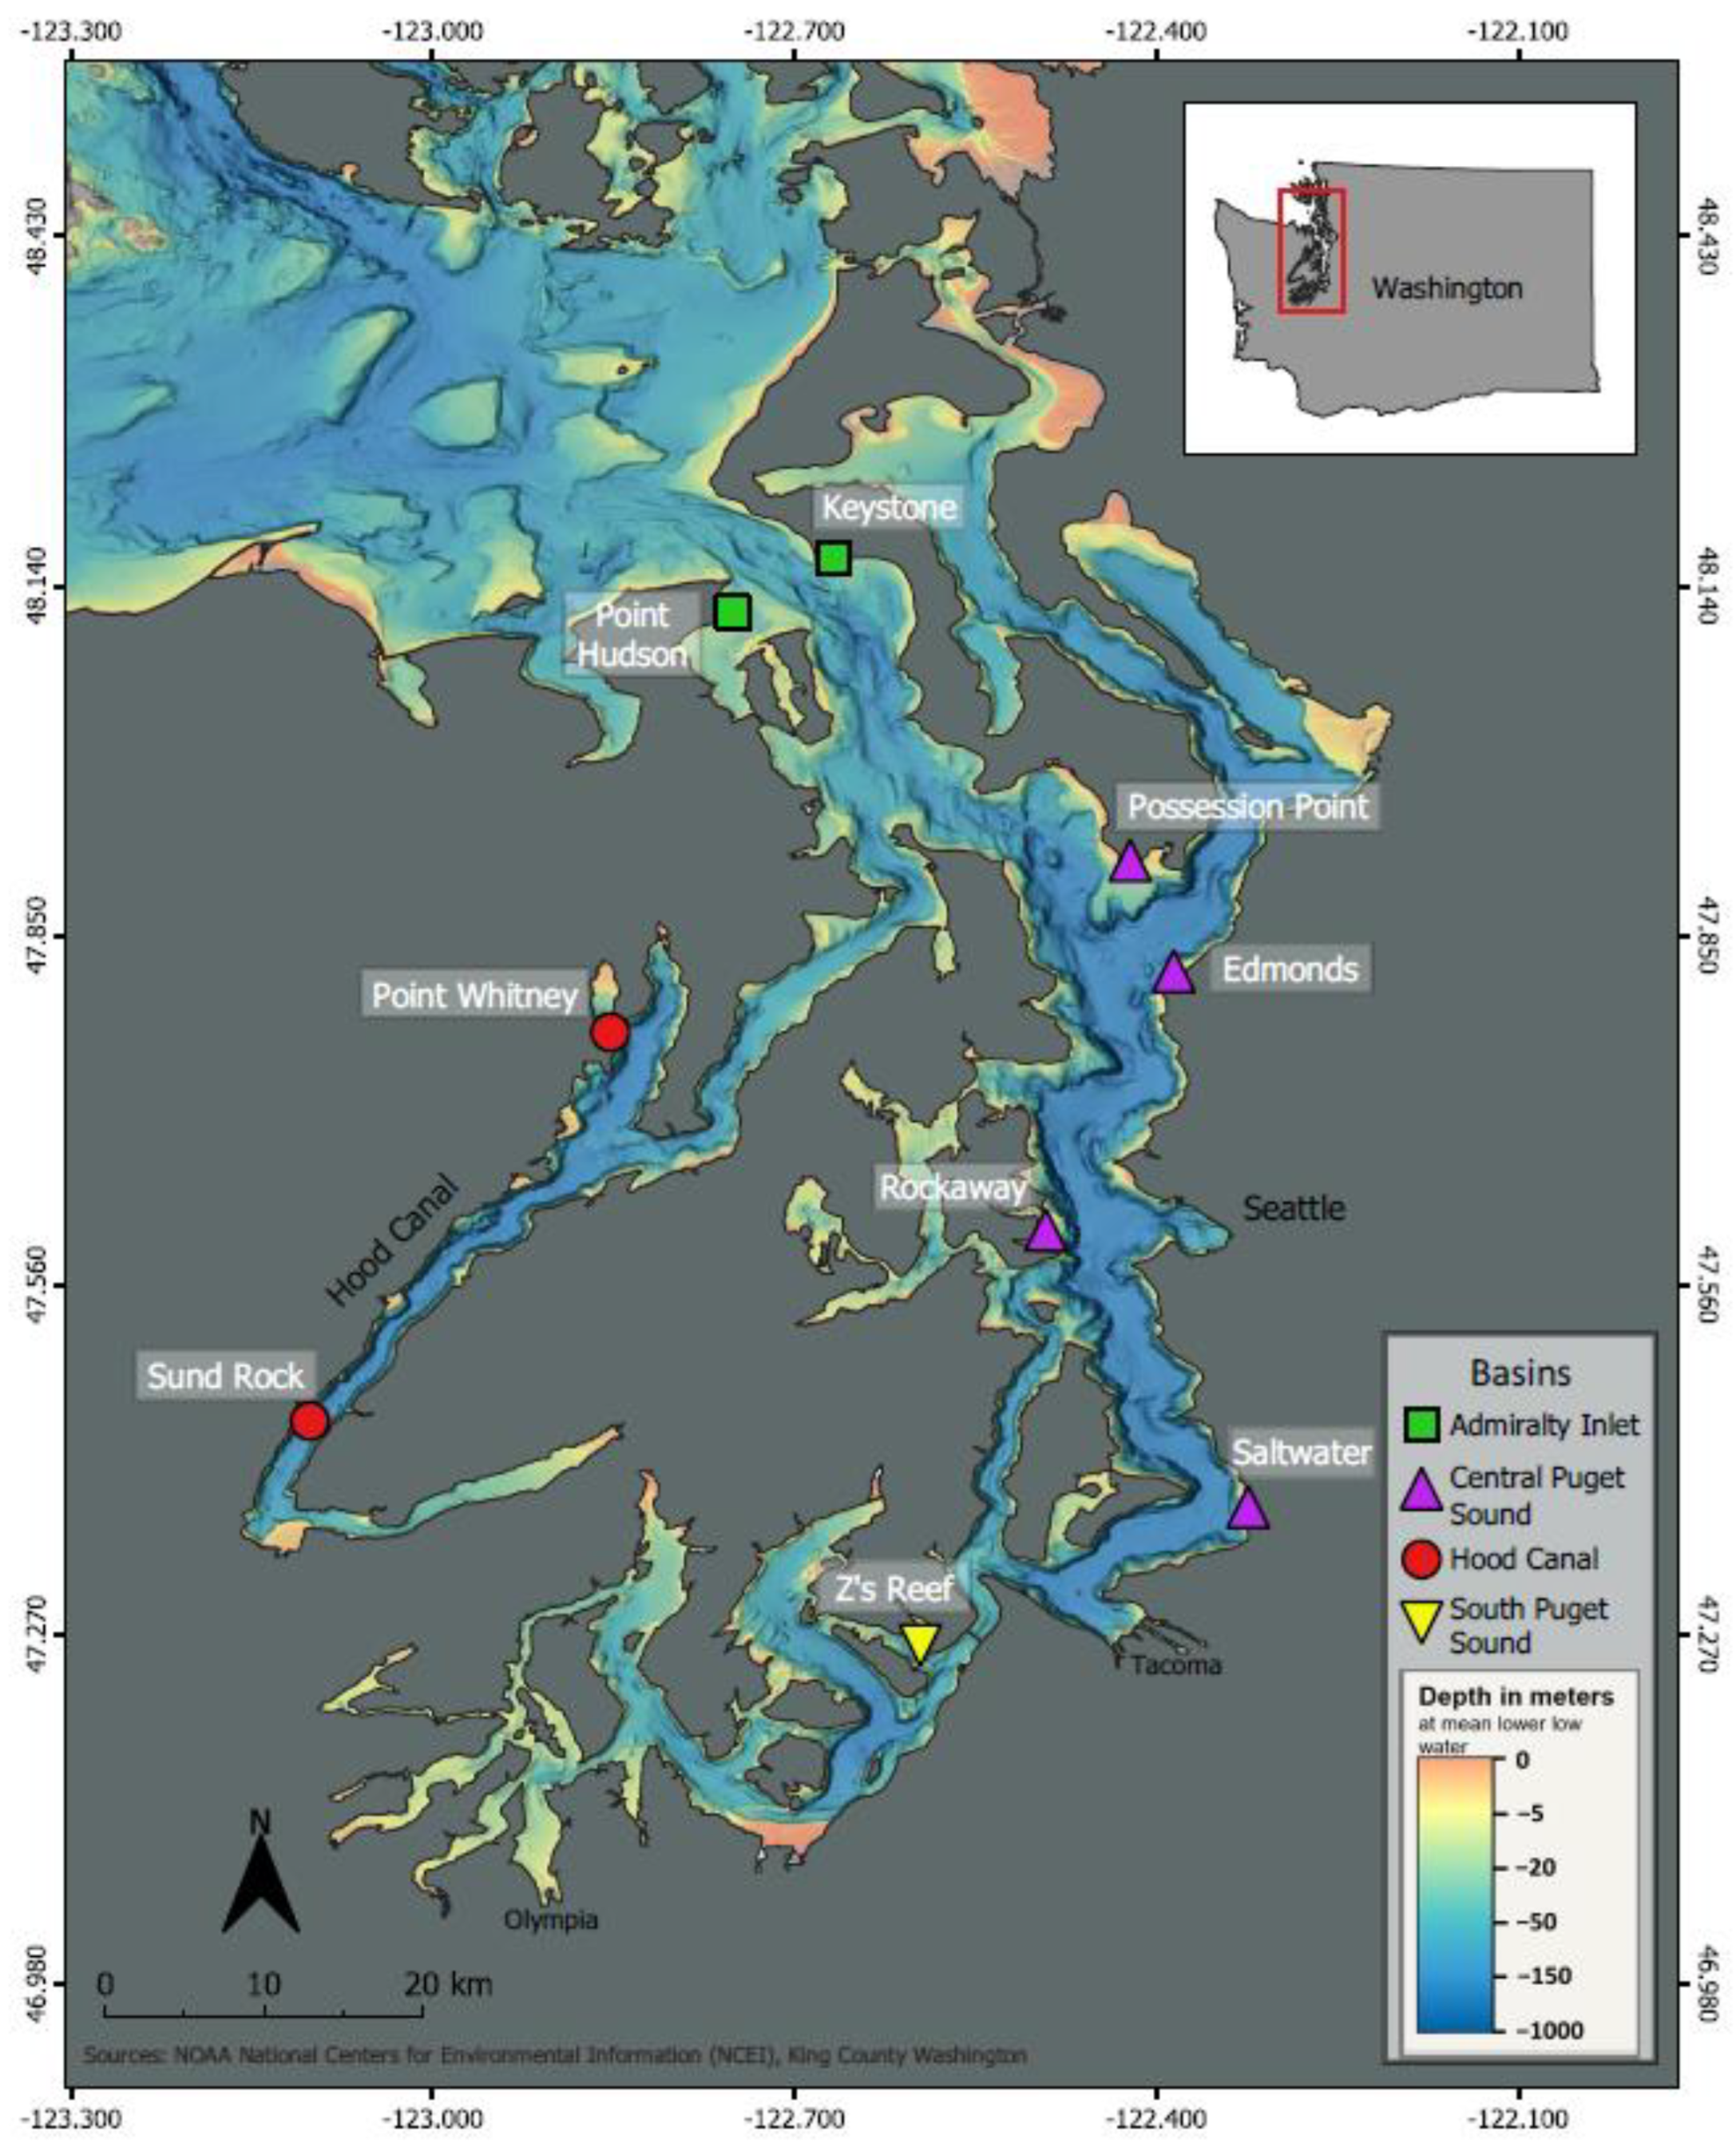
Figure 1. Location of the 9 survey sites color-coded by the basin each site resides in. Digital Elevation Model Global Mosaic layer overlayed to display the bathymetry of the Puget Sound [20].
Fishes 08 00508 g001
Figure 2. Scatterplot of adult rockfish count by species over time (2009–2023) at each site, with log-transformed y-axis for improved visualization of low count values. Point shape corresponds with basin and color with species, according to the legend provided. Only the five most frequently observed species are included in this figure.
Fishes 08 00508 g002
Figure 3. Scatterplot with line of best fit for adult rockfish counts, with log-transformed y-axes for improved visualization of low count values. (A) Total adult rockfish counts from all surveys; (B) Total adult rockfish counts from all surveys by basin, with Kendall’s rank correlation results shown for each basin. Shape and color correspond to the basin as follows: Hood Canal—black closed circles; South Puget Sound—dark grey open inverted triangles; Admiralty Inlet—grey open squares; Central Puget Sound—light grey closed triangles; (C) Hood Canal sites only: Adult rockfish counts for each species at each survey; Kendall’s rank correlation test shown for Copper rockfish. In this panel, each data point corresponds to a count for a single rockfish species at a given site and date.
Fishes 08 00508 g003
Figure 4. Community structure by location. Grayscale color and shapes correspond with basin for Hood Canal (filled circles), South Puget Sound (inverted open triangles), Central Puget Sound (filled triangles), and Admiralty Inlet (open squares), in order from darkest to lightest shade. (A) Dotplot of species observed by location grouping, with log-transformed x-axes for improved visualization of low count values; (B) Two-dimensional nMDS ordination for community structure by location group, with probability of F-statistic for PERMANOVA analysis comparing Central Puget Sound and Admiralty Inlet.
Fishes 08 00508 g004
Figure 5. Boxplots for (A) Shannon Diversity Index by season, with post-hoc pairwise adjusted p-values displayed where significant, and (B) Adult Rockfish count by season, with post-hoc pairwise adjusted p-values displayed where significant. For both (A,B), significance thresholds are as follows: p < 0.1 *, p < 0.05 **, and p < 0.01 ***. Sample sizes are as follows: Autumn (n = 51), Spring (n = 43), Summer (n = 26), and Winter (n = 37). Y-axes are log-transformed for improved visualization.
Fishes 08 00508 g005
Table 1. Location and sampling information for sites surveyed.
SiteBasinLatitude (N)Longitude (W)Depth (m)Years SurveyedTotal No. Surveys
RockawayCentral P.S.47.598−122.49510–122009–202336
Point WhitneyHood Canal47.762−122.8558–242012–202229
Possession Point FerryCentral P.S.47.907−122.423202013–20197
Saltwater State ParkCentral P.S.47.372−122.32610–202013–2018; 20215
Z’s ReefSouth P.S.47.252−122.60016–232013–2017; 2019; 2021–20228
Sund RockHood Canal47.446−123.10316–222015–202224
Keystone JettyAdmiralty Inlet48.156−122.6707–152015–202218
Point HudsonAdmiralty Inlet48.116−122.7495–162016–202218
Edmonds Underwater ParkCentral P.S.47.815−122.3825–62019–202312
P.S. = Puget Sound.
Disclaimer/Publisher’s Note: The statements, opinions and data contained in all publications are solely those of the individual author(s) and contributor(s) and not of MDPI and/or the editor(s). MDPI and/or the editor(s) disclaim responsibility for any injury to people or property resulting from any ideas, methods, instructions or products referred to in the content.

