Abstract
Assessing fish biodiversity is essential for freshwater ecosystem conservation. This study compares environmental DNA (eDNA) metabarcoding and traditional morphological surveys to investigate fish communities in the Gaya River, China. A total of 42 fish species were identified, with 13 detected only by eDNA, 7 exclusively by morphology, and 11 by both methods. A comparative analysis of species composition, functional diversity, and phylogenetic diversity revealed significant differences between the two approaches. Notably, eDNA data indicated higher phylogenetic diversity (PD), while morphological surveys captured greater functional evenness (FEve). Multivariate analyses indicated that total phosphorus (TP), total suspended solids (TSS), electrical conductivity (EC), temperature (T), and pH significantly influenced fish community composition, while dissolved oxygen (DO) was a key driver of species richness (SR), functional richness (FRic), and PD. These findings highlight the methodological differences and complementary strengths of eDNA and morphological approaches in biodiversity assessments. By providing comparative insights into fish diversity patterns, this study underscores the importance of using multi-method approaches to improve freshwater biodiversity monitoring and conservation strategies.
Keywords:
environmental DNA (eDNA); fish biodiversity assessment; functional diversity; morphological survey; phylogenetic diversity Key Contribution:
This study is the first to comprehensively and multidimensionally assess the fish community composition and diversity of the Gaya River, a border river in China, by combining environmental DNA (eDNA) and traditional morphological methods. It highlights the complementary advantages of the two methods in the dimensions of taxonomy, function, and phylogenetic diversity, and emphasizes the importance of the integrated application of multiple methods for monitoring freshwater fish diversity in ecologically sensitive border areas.
1. Introduction
Fish play a critical role in nutrient cycling and energy flow, and fish biodiversity serves as an important indicator of ecosystem health []. However, anthropogenic activities such as agricultural runoff, industrial pollution, overfishing, and habitat degradation have led to significant declines in fish biodiversity worldwide [,]. Accurate and efficient biodiversity monitoring is therefore essential for freshwater conservation and sustainable management.
Traditional fish biodiversity assessments rely on field sampling methods, including electrofishing, netting, and angling. Although these approaches provide valuable species-level identification, they are time-consuming, invasive, and often biased toward larger or more easily captured species []. Additionally, their accuracy depends on habitat accessibility and taxonomic expertise, potentially leading to incomplete biodiversity assessments []. These limitations have driven the need for more efficient, non-invasive, and comprehensive biodiversity monitoring techniques.
Environmental DNA (eDNA) metabarcoding has emerged as a powerful alternative for biodiversity assessment, allowing species detection through DNA fragments suspended in water []. This method enhances the detection of rare, cryptic, and migratory species that might be missed by traditional surveys []. However, eDNA-based monitoring also presents challenges, including its inability to estimate species abundance, as DNA concentrations do not always correlate with biomass []. Additionally, environmental factors such as temperature, pH, and water flow influence DNA degradation and transport, potentially introducing false positives or negatives in species detection []. Hydrological transport may also introduce DNA from non-local species, complicating identification []. Despite these limitations, eDNA has been increasingly recognized as a complementary tool that, when integrated with traditional morphological surveys, provides a more comprehensive assessment of fish biodiversity [].
While both eDNA metabarcoding and traditional morphological surveys have been widely applied in aquatic monitoring, most comparative studies to date have focused primarily on taxonomic richness and species composition []. Few have evaluated their performance across multiple biodiversity dimensions—particularly functional and phylogenetic diversity—under varying environmental conditions []. This gap is especially evident in cold–temperate river systems of East Asia, where such multidimensional comparisons remain rare. Addressing this shortfall is essential for improving ecological understanding and informing biomonitoring practices.
This study investigates fish community composition and diversity in the Gaya River Basin, a major tributary of the Tumen River in northeastern China. The river exhibits a gradient of ecological conditions along its course, ranging from minimally disturbed forested headwaters to downstream sections heavily impacted by anthropogenic activities [,]. Although the river plays a crucial role in regional freshwater biodiversity, previous research has primarily focused on riparian vegetation, with aquatic fauna—particularly fish community structure and diversity—remaining largely understudied [].
To fill this gap, this study integrates eDNA metabarcoding and traditional morphological identification to assess fish diversity in the Gaya River. Specifically, we aim to (1) compare fish community structures identified by both methods, (2) evaluate the complementarity of eDNA and morphological surveys, and (3) analyze key environmental drivers influencing fish community composition. Our findings provide critical insights into the strengths and complementarities of eDNA and morphological approaches and highlight their combined potential for advancing freshwater biodiversity assessment and conservation efforts.
2. Materials and Methods
2.1. Study Area
This study was conducted along the Gaya River, China. The Gaya River extends approximately 206 km, serving as a major tributary of the Tumen River. In June 2023, thirty sampling sites were established at 10 km intervals to achieve adequate spatial coverage. All sampling took place under stable weather conditions to minimize environmental fluctuations (Figure 1).
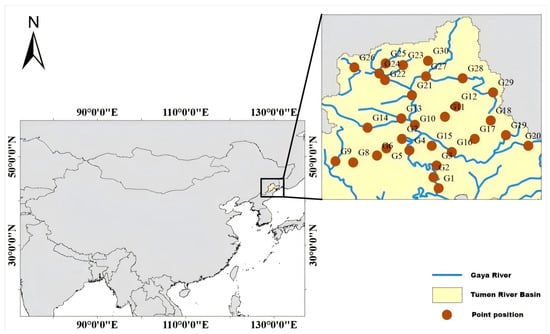
Figure 1.
Distribution map showing sampling locations for both eDNA and morphological surveys conducted in the Gaya River.
2.2. Sample Collection
For eDNA sampling, 5 L of surface water was collected at each site using sterile polyethylene bottles, which were pre-treated with a 1:10 bleach solution and rinsed thoroughly with ultrapure water. Field equipment, including forceps and filtration devices, was decontaminated sequentially using a 10 min bleach soak, followed by rinsing with tap water and ultrapure water to eliminate potential cross-contamination. Water samples were stored in light-proof containers at −20 °C and transported to the laboratory within 6 h for further processing.
Morphological sampling was conducted simultaneously using electrofishing and gill netting. Electrofishing was performed in shallow water areas (<1 m) within a 500 m river stretch, with a total sampling duration of 30 min. For deeper water sites (>1 m), gill nets were deployed for 60 min, with intermittent retrieval to reduce fish mortality []. Captured fish were identified, measured, and released on-site whenever possible, while unidentified specimens were preserved in 10% formalin and transported to the laboratory for taxonomic identification. Each sample species was identified by referring to the relevant reference books and Fish Base Search (www.fishbase.se/home.htm, accessed on 19 April 2025).
2.3. Environmental Parameter Measurement
Water quality parameters were recorded in situ using a multiparameter water quality meter (Taiwan AZ86031, AZ Instruments, Taichung City, Taiwan). Measurements included pH, dissolved oxygen (DO), electrical conductivity (EC), and water temperature (T). Additional water samples were collected for laboratory analysis to determine total nitrogen (TN), total phosphorus (TP), and total suspended solids (TSS).
2.4. eDNA Extraction and PCR Amplification
eDNA filtration was conducted using a 0.45 μm cellulose nitrate membrane filter, with three replicates collected per site to ensure consistency. Negative controls were incorporated at each step to monitor contamination. DNA extraction and PCR setup were performed in a dedicated trace-DNA laboratory, which was physically isolated from any areas handling PCR amplicons to prevent cross-contamination.
Using the DNeasy Blood & Tissue Kit from the Qiagen Company (Hilden, Germany), eDNA was extracted from the filter membrane. All operations were carried out strictly in accordance with the instructions. Negative controls were set for each batch of samples, and the extracted DNA solutions were stored in sterile centrifuge tubes. The extracted DNA samples were stored at −80 °C for subsequent analysis. After the extraction of genomic DNA was completed, 1% agarose gel electrophoresis was performed to detect the quality of the extracted DNA to ensure its integrity and purity.
To ensure the addition of an appropriate amount of template DNA in the PCR reaction, the extracted genomic DNA was accurately quantified first using the Qubit® 4.0 DNA quantification kit (Thermo Fisher Scientific, Waltham, MA, USA). Subsequently, the mitochondrial 12S rRNA gene fragment was amplified using specific primers of the connector sequence of the fusion sequencing platform. The primer sequences were Fish-F4 (5′-GTACCTTTTGCATCATGATTTAG-3′) and Fish-R4 (5′-CCACTCTTTTGCCACAGAGACG-3′), designed to amplify a 170 bp fragment [].
Each sample underwent two rounds of PCR amplification to improve the detection sensitivity. The total volume of the first-round PCR reaction system was 30 μL, which was prepared in a sterile 200 μL PCR tube. Specifically, it included 2× Hieff® Robust PCR Master Mix, 15 μL; forward primer (10 μM), 1 μL; reverse primer (10 μM), 1 μL; template DNA, 10–20 ng; and ddH2O supplementation to 30 μL. After mixing and brief centrifugation, the reaction was carried out in a PCR instrument under amplification conditions: pre-denaturation at 94 °C for 3 min. Then, five cycles of the following were carried out: denaturation at 94 °C for 30 s, annealing at 45 °C for 20 s, and extension at 65 °C for 30 s. Then, 20 cycles of the following were carried out: denaturation at 94 °C for 20 s, annealing at 55 °C for 20 s, and extension at 72 °C for 30 s. Finally, extension for 5 min at 72 °C was performed, followed by storage at 10 °C. First-round PCR products were examined via 2% agarose gel electrophoresis to verify that the observed bands corresponded to the expected amplicon size. Products were used for downstream analyses only if band sizes matched expectations and no target bands were detected in the negative controls. The products of the first round were purified and used as templates for the second round of amplification to introduce the bridge PCR connector sequence compatible with the Illumina platform. The second-round PCR reaction system was also 30 μL, consisting of 2× Hieff® Robust PCR Master Mix, 15 μL; forward primer (10 μM), 1 μL; Index-PCR reverse primer (10 μM), 1 μL; 20–30 ng of the first-round PCR product; and ddH2O supplemented to 30 μL. After mixing and centrifugation, amplification was carried out as follows: pre-denaturation at 95 °C for 3 min; then, five cycles of the following were performed: denaturation at 94 °C for 20 s, annealing at 55 °C for 20 s, extension at 72 °C for 30 s; extension for 5 min at 72 °C; and storage at 10 °C. The amplification products were detected by 2% agarose gel electrophoresis to verify whether the amplification was successful and confirm whether the length of the library fragments was in line with expectations (approximately 170 bp). To ensure result reliability, all PCR experiments included negative controls to detect possible contamination. Samples showing amplification in their corresponding negative controls were excluded from subsequent analyses.
2.5. Sequencing
For sequencing, all libraries were quantified using a Qubit® 4.0 fluorometer to ensure uniform cluster generation and high-quality sequencing output. The final sequencing was performed on an Illumina MiSeq™ platform (2 × 250 bp, paired-end sequencing) (San Diego, CA, USA) [], with all libraries sequenced at equal concentrations. Adapter sequences and low-quality reads were removed before subsequent bioinformatics analysis.
2.6. Data Processing and Quality Control
The data obtained by offline sequencing were paired-end (PE) data, which included sample-specific barcode sequences, as well as sequencing primer and connector sequences. To ensure the accuracy of the subsequent analysis, the raw paired-end sequencing data underwent a series of preprocessing steps, including primer and adapter removal, merging of paired reads based on sequence overlap, demultiplexing according to barcode sequences to distinguish samples, and quality filtering to retain high-quality, informative reads for each sample.
Using Cutadapt software [] to sub-sequence to remove the original data, Read1 and Read2, respectively, were removed for 3′ sequences; the Read1 joint sequence was AGATCGGAAGAGCACACGTCTGAACTCCAGTCA, and the Read2 joint sequence was AGATCGGAAGAGCGTCGTGTAGGGAAAGAGTGT. The PEAR software [] was used to merge the paired PE reads into a continuous high-quality sequence based on the overlap relationship between the sequencing data at both ends.
After the splicing was completed, based on the pre-designed barcode sequence and amplification primer sequence, the sequences for each sample were accurately identified and split from the spliced data, and at the same time the sequence direction was corrected to ensure the accuracy of downstream analysis.
In the quality control steps, the PRINSEQ software [] was used to optimize the quality of the spliced reads. The specific parameter settings were as follows: Perform quality trimming on the tail of the reads, using a 10 bp sliding window. If the average quality value within the window is lower than Q20, all subsequent bases are truncated from the starting position of this window. Furthermore, uncertain sequences containing N bases, sequences with overly short lengths, and reads with overly low sequence complexity are filtered out, and finally high-quality valid sequence data for each sample are obtained.
2.7. Bioinformatics and Taxonomic Identification
Raw sequencing reads were first demultiplexed and trimmed to remove adapter sequences using Cutadapt []. Paired-end reads were merged using PEAR [], and low-quality sequences (Q < 20) and singletons were filtered out. Operational taxonomic units (OTUs) were clustered at a 97% similarity threshold using UPARSE []. Taxonomic assignments were performed by BLASTn searches [] against a reference database with ≥90% sequence identity and ≥90% query coverage criteria.
For eDNA data, we adopted a conservative approach to remove the low abundance threshold in order to minimize potential sequencing errors. The final species inventory was validated by cross-referencing with morphological identifications from traditional fish surveys. Community composition matrices were constructed based on species presence–absence and relative abundance, and downstream analyses were conducted to assess differences between eDNA and morphological methods.
2.8. Data Processing
The fish community composition was assessed using both eDNA metabarcoding and morphological identification. The relative abundance of fish species detected via morphological surveys was calculated based on individual counts, whereas the eDNA-based species abundance was standardized using Total Sum Scaling (TSS) to mitigate sequencing depth variations [].
To assess species diversity, both α-diversity and β-diversity indices were calculated. Species richness (SR), Shannon–Wiener diversity, Pielou’s evenness, and Simpson’s diversity were used to quantify α-diversity, following established methodologies []. β-diversity was assessed using Bray–Curtis dissimilarity, with community structure differences visualized via Principal Coordinate Analysis (PCoA) and Non-Metric Multidimensional Scaling (NMDS). To test for significant differences in community composition across sites, Permutational Multivariate Analysis of Variance (PERMANOVA) and Analysis of Similarities (ANOSIM) were employed [].
Functional trait selection followed Villéger, S. et al. [,] to characterize ecological strategies of fish species. The selected traits included body shape, maximum total length, relative eye diameter, eye position, feeding guild, water column preference, habitat type, temperature range, lifespan, and age/length at first maturity []. Trait data were compiled from both field measurements and FishBase, with missing values imputed using phylogenetic mean estimation. Functional diversity indices, including functional richness (FRic), functional evenness (FEve), functional divergence (FDiv), and functional redundancy (FRed), were computed following previously established methods []. Functional trait distances were derived using the Gower distance metric.
A phylogenetic tree was constructed according to the results of the OTU table comments in the NCBI public database (https://www.ncbi.nlm.nih.gov, accessed on 19 April 2025) downloaded for fish nucleic acids or protein sequences. To ensure that the sequence data format was compatible with MEGA11 [], we modified the sequence format file to FASTA format. The data were imported into MEGA11, and sequences were aligned using ClustalW. Phylogenetic analysis was used to select the appropriate evolutionary model for sequence types. The Neighbor-Joining (NJ) method was selected as the method for constructing the evolutionary tree. In the evolutionary tree construction interface, the bootstrap value was set to 1000 to evaluate the reliability of the evolutionary tree. Phylogenetic diversity includes the phylogenetic diversity index (PD), the phylogenetic difference index (Delta), the weighted phylogenetic difference index (Delta*), the phylogenetic homogeneity index (Lambda+), and the phylogenetic dispersion index (Delta+), and the index construction system was established following the indicators of Liu [] and Gomes [].
To generate a more comprehensive representation of fish community composition, a combined relative abundance index was developed, integrating data from both approaches []. This integration was achieved using a weighted relative abundance model, where RAMerged(i,j) represents the combined abundance, calculated as follows:
where RAeDNA(i,j) and RAMorphology(i,j) denote the relative abundances of species detected by eDNA and morphological methods, respectively.
Environmental drivers of fish community composition were explored using Redundancy Analysis (RDA) and Mantel tests, which examined the relationships between species composition and environmental parameters such as TN, TP, DO, pH, water temperature, and electrical conductivity.
Relative abundance was calculated using Excel 2000, while ImageJ 1.54g was employed to measure fish morphological traits []. Species diversity indices, community structure analyses, Redundancy Analysis (RDA), Analysis of Similarities (ANOSIM), and Mantel tests were performed using the “vegan” package in R 4.4.1 []. The “ggplot2” package [] was used to visualize relative abundance heatmaps, diversity index boxplots, and phylogenetic diversity (PD) vs. species richness (SR) scatter plots. Multivariate analyses, including Principal Coordinate Analysis (PCoA) and Non-Metric Multidimensional Scaling (NMDS), were conducted using the “ade4” package []. Data handling and processing were performed with the “dplyr” package [], while functional diversity indices (FRic, FEve, and FDiv) were computed using the “betapart,” “FD,” and “cluster” packages []; FRed was calculated using Excel 2000, with visualizations generated via “ggplot2” []. Phylogenetic diversity metrics were calculated using the “picante” and “tidytree” packages [], and phylogenetic trees were constructed using MEGA11 [].
2.9. Statistical Analysis
For statistical validation, SPSS 27.0 [] was used to conduct normality tests for species, functional, and phylogenetic diversity indices. An independent t-test was used to compare the diversity changes of eDNA and morphology in the Gaya River. Statistical significance was defined as p < 0.05. Significant differences are denoted by asterisks (* p < 0.05, ** p < 0.01, *** p < 0.001, **** p < 0.0001), consistent with the figure legends. Radar charts were generated using Origin 2024 [] to illustrate functional trait distributions across sites.
3. Results
3.1. Taxonomic Composition of Fish Communities
A total of 42 fish species were identified using both eDNA metabarcoding and morphological surveys. The eDNA method detected 24 species across 5 orders and 6 families, whereas the morphological approach identified 18 species from 4 orders and 5 families [] (Figure 2). Notably, 13 species were exclusively detected by eDNA, whereas 7 species were only identified through morphological surveys. Both methods identified 11 overlapping species, including Carassius auratus, Rhynchocypris percnurus, and Misgurnus anguillicaudatus (Figure 3).
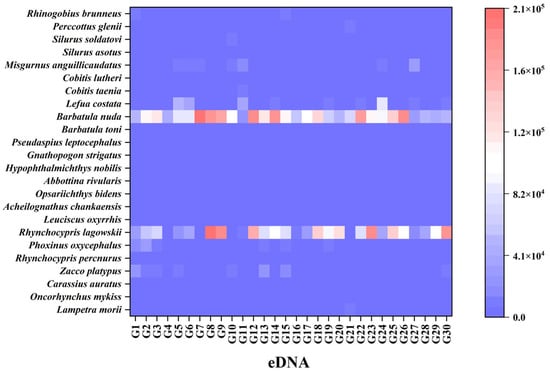
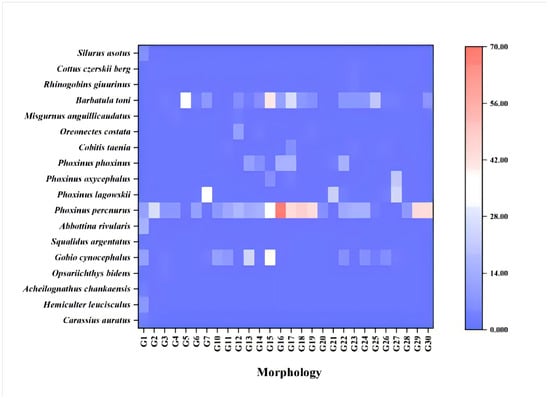
Figure 2.
Comparative taxonomic composition of fish species in the Gaya River as revealed by eDNA metabarcoding versus morphological surveys.
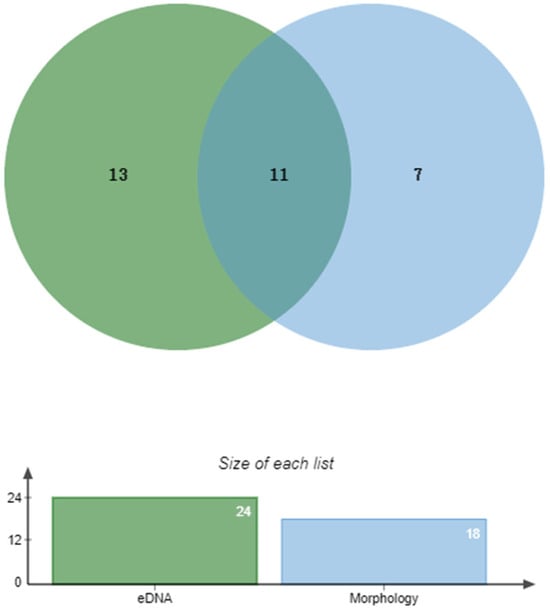
Figure 3.
Venn diagram illustrating species overlap between eDNA and morphological survey methods in the Gaya River.
3.2. Species Diversity Patterns and Community Structure Variability
α-diversity indices revealed significant differences between the two methods (Figure 4). Morphological surveys yielded significantly higher species evenness (Pielou, p < 0.0001) and a lower species richness (SR, p < 0.0001) compared to eDNA analysis, whereas no significant differences were observed in Shannon and Simpson diversity indices (p > 0.05).
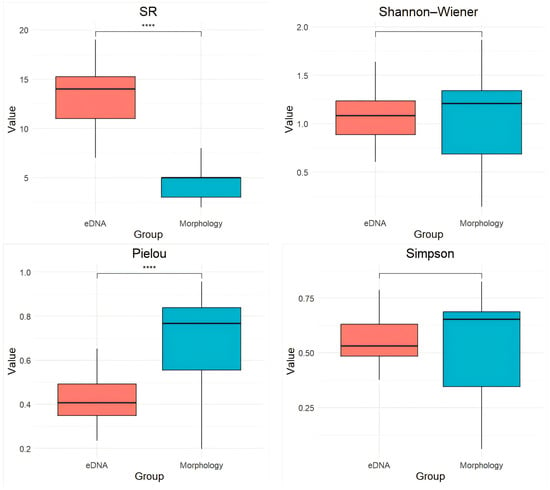
Figure 4.
Comparison of species richness (SR), Shannon–Wiener index, Pielou’s evenness, and Simpson index values between eDNA and morphological surveys. **** denotes a highly significant difference between groups (p < 0.0001).
β-diversity analyses performed using NMDS and PCoA (Figure 5) showed distinct community structures detected by the two methods. NMDS ordination demonstrated separation along NMDS1, while PCoA analysis showed clustering differences between eDNA and morphological surveys. Partial overlap along NMDS2 in Jaccard-based ordination indicated some shared species composition.
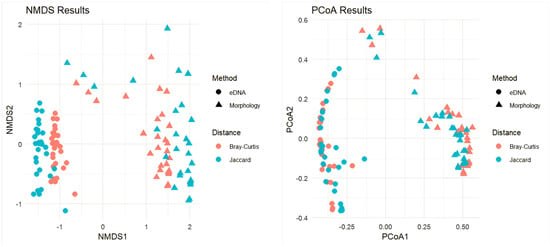
Figure 5.
Non-Metric Multidimensional Scaling (NMDS) and Principal Coordinate Analysis (PCoA), based on Bray–Curtis and Jaccard dissimilarity indices, were applied to analyze fish community β-diversity patterns under different survey methods.
3.3. Contrasting Functional Diversity Patterns Derived from eDNA and Morphological Surveys
Functional diversity indices revealed significant methodological differences (Figure 6). Morphological surveys indicated a significant increase in functional evenness (FEve; p < 0.0001), while functional divergence (FDiv), functional richness (FRic), and functional redundancy (FRed) also increased, though not significantly.
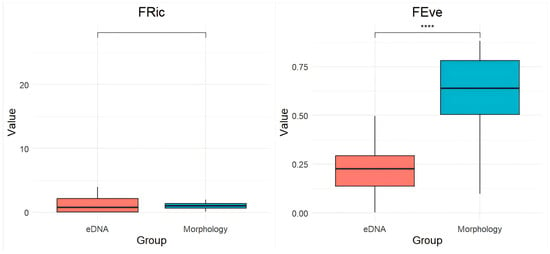
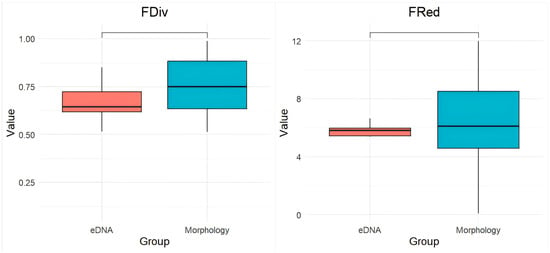
Figure 6.
Comparison of Fric, Feve, Fdiv, and Fred indices between eDNA and morphological surveys. **** denotes a highly significant difference between groups (p < 0.0001).
3.4. Phylogenetic Diversity Disparities Between eDNA and Morphological Surveys
Phylogenetic diversity indices further supported differences between the two methods. The PD and species richness (SR) indices were significantly higher in eDNA-based assessments compared to morphological surveys. SR is highly significantly positively correlated with PD (p < 0.01) (Table 1). The Delta, Delta+, and Lambda+ indices were also elevated in eDNA assessments; Delta* showed an increase in morphological identification (Figure 7). Statistical analyses indicated that the differences in Lambda+ indices between the two methods were highly significant (p < 0.001).

Table 1.
Comparison of phylogenetic diversity (PD) and species richness (SR) metrics between eDNA and morphological surveys.
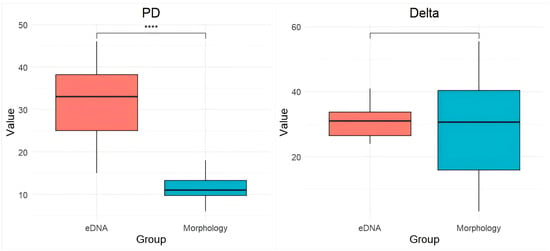
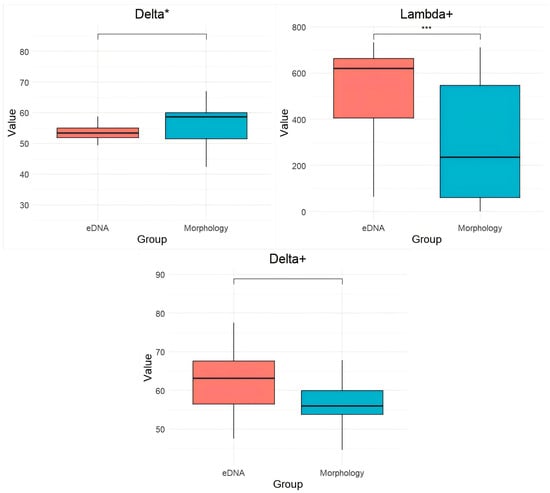
Figure 7.
Comparison of PD, Delta, Delta*, Lambda+, and Delta+ indices between eDNA and morphological surveys. *** denotes a highly significant difference between groups (p < 0.001). **** denotes a highly significant difference between groups (p < 0.0001).
Phylogenetic analysis (Figure 8) showed that most species clustered in accordance with established taxonomic classifications, revealing clear lineage patterns within each dataset. In both eDNA and morphology-based phylogenetic trees, species from the same genus—such as Barbatula toni and Barbatula nuda, or Rhynchocypris percnurus and Rhynchocypris oxycephalus—formed distinct clades consistent with recognized taxonomies. A few discrepancies were observed; for example, Misgurnus anguillicaudatus was grouped with Cobitis taenia in the eDNA tree despite their belonging to different genera. The eDNA tree also contained species absent from morphological surveys (e.g., Hypophthalmichthys nobilis and Zacco platypus), whereas the morphological tree included species undetected by eDNA (e.g., Gobio cynocephalus and Hemiculter leucisculus). Additionally, branch lengths were generally greater in the eDNA tree, suggesting larger genetic distances between species compared to the morphology-based tree.
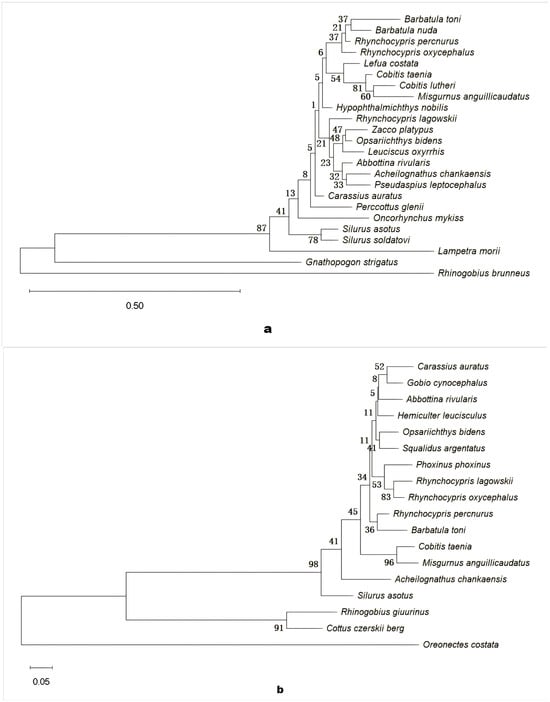
Figure 8.
Phylogenetic relationships of fish species detected by eDNA (a) and morphological (b) surveys. In the phylogenetic trees, branches represent evolutionary relationships among species and nodes correspond to divergence events. Numbers indicate bootstrap support values, reflecting branch reliability. Scale bars represent genetic distance: (a) 0.50 and (b) 0.05.
Correlation analysis of PD and species richness (SR) showed a significant positive relationship (Figure 9), indicating that increased taxonomic richness corresponds to higher phylogenetic diversity.
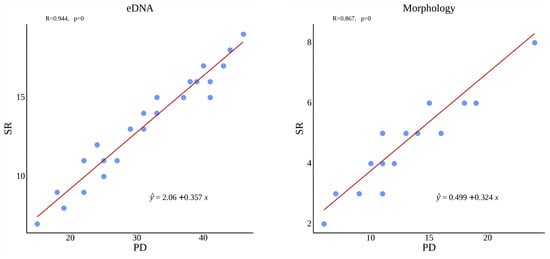
Figure 9.
Relationship between phylogenetic diversity (PD) and species richness (SR) across survey methods.
3.5. Integrating eDNA and Morphological Methods for Comprehensive Fish Diversity Assessment
Correlation analysis between species abundance and sequencing read counts revealed no statistically significant positive relationship (p > 0.05) (Figure 10).
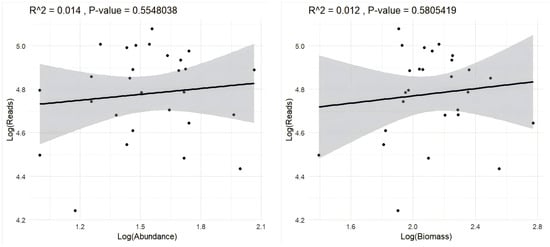
Figure 10.
Relationship between log-transformed sequencing reads, species abundance, and biomass in eDNA and morphology-based surveys. Black dots indicate measurements from 30 sampling sites, and the shaded gray areas represent the 95% confidence intervals.
The diversity index analysis revealed distinct patterns among the three different methods (eDNA, morphology, and integrated methods; Figure 11). The Shannon diversity index showed the highest value (1.64) in the integrated method, compared to the eDNA (1.08) and morphology (1.01) methods, suggesting that the integrated approach captured greater species diversity and evenness.

Figure 11.
The radar charts exhibit the different diversity indices obtained via eDNA, morphological, and integrated methods.
For the functional diversity metrics, the morphology method demonstrated higher values in FRic (2.71) and FRed (6.89) compared to both eDNA (FRic: 1.93; FRed: 5.56) and integrated methods (FRic: 0.58; FRed: 4.04). This indicates that morphological identification detected greater functional richness and redundancy in the fish community. However, functional divergence (FDiv) remained relatively consistent across all three methods (0.66–0.76).
For phylogenetic diversity, our results showed that the integrated approach maintained high PD and Lambda+ values (31.10; 608.38) and that those of the eDNA method (31.40; 526.30) were similar and significantly higher than those obtained via morphological investigation alone (11.68; 274.04).
3.6. Environmental Influences on Fish Community Structure
Redundancy Analysis (RDA) identified key environmental factors shaping fish community composition (Figure 12). Total phosphorus (TP), pH, water temperature (T), and total suspended solids (TSS) significantly influenced eDNA-derived communities, whereas total nitrogen (TN) and electrical conductivity (EC) were more strongly associated with morphological survey results. Species such as Rhynchocypris lagowskii and Barbatula nuda showed weak environmental associations in eDNA-derived communities, whereas Misgurnus anguillicaudatus and Lefua costata exhibited strong responses to multiple environmental factors in morphological survey results.
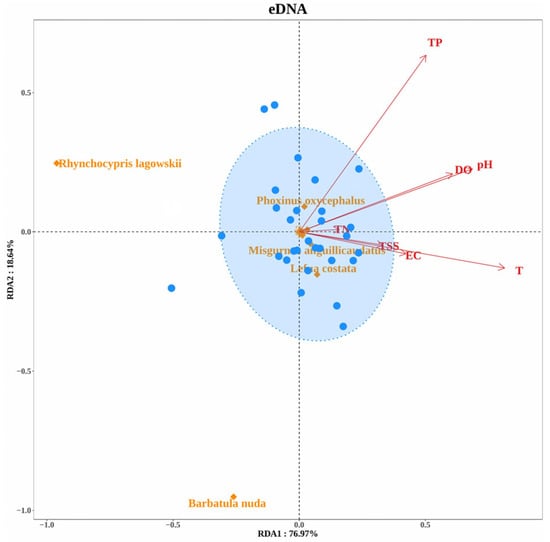
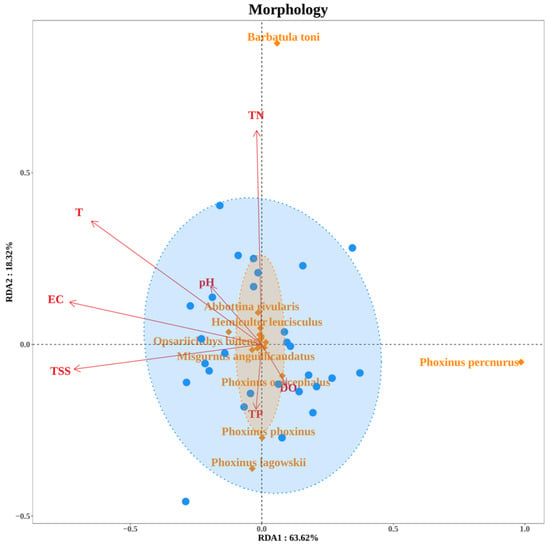
Figure 12.
Redundancy Analysis (RDA) of environmental factors influencing fish community structure. Blue circles represent the 30 sampling sites, while orange diamonds denote specific species.
Regarding the diversity of the Integrated Fish Community Structure, Mantel test results (Figure 13) indicated that Shannon diversity did not show any statistically significant correlation with individual environmental factors (p ≥ 0.05). Regarding functional richness (FRic), dissolved oxygen (DO) had a highly significant positive effect (p < 0.01). Other factors, including temperature (T), total nitrogen (TN), and total suspended solids (TSS), also exhibited positive correlations with FRic, but these relationships were not statistically significant. Phylogenetic diversity (PD) was significantly influenced by dissolved oxygen (DO) (p < 0.05).
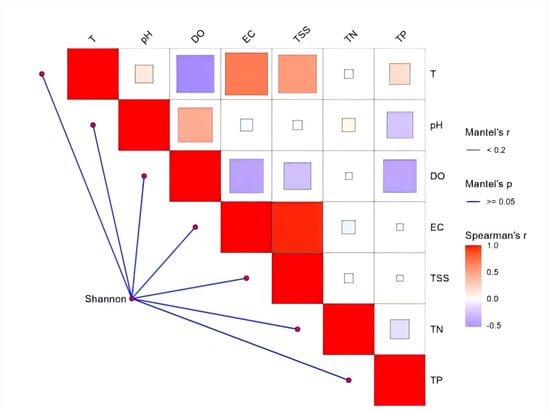
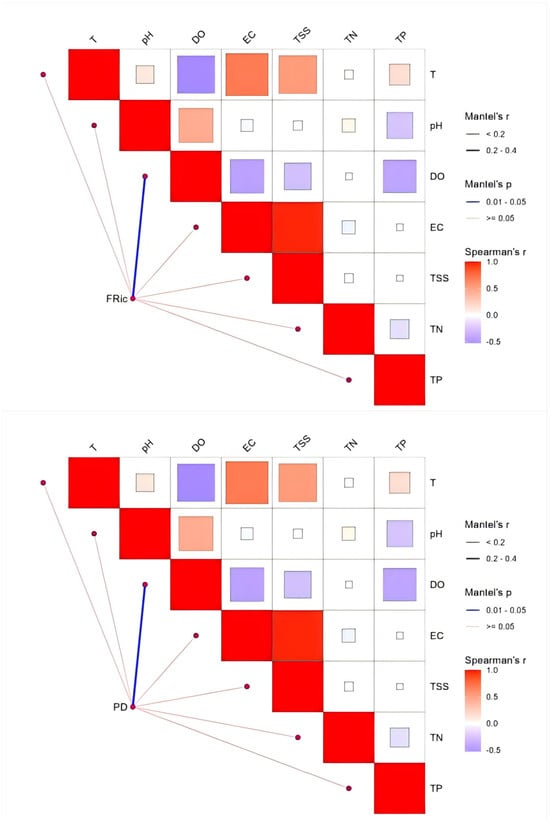
Figure 13.
Analysis of correlation of multidimensional indices—taxonomic α-diversity (Shannon), functional α-diversity (FRic), and phylogenetic α-diversity (PD)—with environmental variables.
4. Discussion
4.1. Comparison of eDNA and Morphological Methods for Assessing Fish Diversity
The comparison between eDNA metabarcoding and traditional morphological surveys reveals the advantages and limitations in assessing the fish diversity of the Gaya River. A total of 42 fish species were identified using both eDNA metabarcoding and morphological surveys. The eDNA method detected 24 species across 5 orders and 6 families, whereas the morphological approach identified 18 species from 4 orders and 5 families (Figure 2). Thirteen species were exclusively detected by eDNA, whereas seven species were only identified through morphological surveys. Both methods identified 11 overlapping species; the species detected by the two methods showed a certain degree of overlap as well as significant differences. eDNA was particularly effective in detecting species such as Hypophthalmichthys nobilis and Barbatula nuda, which were absent in morphological surveys but have been reported in previous studies of the Tumen River Basin []. Conversely, species such as Phoxinus phoxinus and Hemiculter leucisculus [] were identified morphologically but not detected by eDNA. These discrepancies may reflect differences in detection sensitivity, habitat specificity, and species abundance []. Comparisons with earlier surveys [] indicated that eDNA not only captured most historically recorded species but also revealed species not previously documented, suggesting possible range expansion or improved detection of rare or transient taxa.
eDNA shows a higher species detection rate, especially for latent species and low-abundance and migratory species [,], such as the species Gnathopogon striigatus and Rhinogobius brunneus. Because DNA collection is passive, eDNA can capture DNA fragments released in the water column. Therefore, it shows higher sensitivity in detecting species not found in morphological surveys, making it especially suitable for identifying those species that are scattered in their distribution, covert in their activity, nocturnal, or difficult to sample by traditional methods [,,].
However, eDNA cannot directly reveal the functional roles or ecological characteristics of species. In contrast, morphology allows for the direct observation and identification of species by reference to features such as body size, feeding strategies, and reproductive behaviors. This is crucial for the analysis of functional diversity []. In our study, morphology has made significant contributions to understanding functional diversity, especially through indicators such as functional homogeneity (FEve), which reflects the uniform distribution of functional roles throughout the community and is crucial for understanding the stability and resilience of the ecosystem [].
Phylogenetic trees were largely consistent with taxonomic expectations, with most species clustering according to their classification. For example, in the eDNA tree (Figure 8a), Barbatula toni and Barbatula nuda were grouped together, and Rhynchocypris species (e.g., Rhynchocypris percnurus and Rhynchocypris oxycephalus) consistently formed well-supported clades in both trees, corroborating established intrageneric relationships. However, discrepancies occurred—for instance, Misgurnus anguillicaudatus clustered with Cobitis taenia in the eDNA tree despite their belonging to different genera, possibly due to convergent benthic adaptations, incomplete lineage sorting, or environmental DNA cross-contamination []. Coverage also differed between methods: the eDNA tree contained species absent from the morphological tree (e.g., Hypophthalmichthys nobilis and Zacco platypus), whereas the morphological tree included species not detected by eDNA (e.g., Gobio cynocephalus and Hemiculter leucisculus).
Compared with morphology, eDNA metabarcoding captured a broader evolutionary spectrum of fish species and significantly increased phylogenetic diversity (PD) values. This discovery indicates that eDNA is more effective in detecting a greater variety of evolutionary lineages. Higher PD also indicates that eDNA is more sensitive to species with distant phylogenetic relationships, which are often overlooked by morphology, especially when the species are rare or have a low abundance [].
Community composition analysis further revealed method-dependent differences in β-diversity patterns. The β-diversity analysis, based on both Bray–Curtis and Jaccard indices, highlighted that eDNA detected a more diverse array of species across sites, particularly rare species that morphology missed [], such as Lampetra morii, Leuciscus oxyrrhis, Gnathopogon strigatus, and Pseudaspius leptocephalus. The NMDS and PCoA ordinations confirmed this finding, showing that eDNA detected a more nuanced variation in community composition across spatial gradients. This indicates that eDNA is better suited for capturing spatial turnover of species, particularly those that are cryptic or patchily distributed [], such as Lampetra morii, Perccottus glenii, and Rhinogobius brunneus. In contrast, morphological surveys provided a more stable representation of species composition across sites, as they primarily detected more abundant and easily sampled species [].
4.2. Integration of eDNA and Morphological Methods for Fish Diversity Assessment
The integration of eDNA metabarcoding and morphological methods provides a more comprehensive understanding of biodiversity in the Gaya River, highlighting the complementary strengths of these approaches. Our results demonstrated that combining both methods significantly improved species detection, with a total of 42 fish species identified—11 species shared by both methods, 13 species uniquely detected by eDNA, and 7 species exclusively identified through morphological surveys. This confirms the advantage of integrating eDNA’s high detection sensitivity with morphological assessments of ecological traits and biomass estimation.
Shannon diversity analysis further revealed that the integrated approach yielded the highest diversity values (1.64) compared to either eDNA (1.08) or morphological methods (1.01) alone. This enhanced detection capability indicates that its capture of community biodiversity is more comprehensive []. However, functional diversity patterns did not show a simple additive effect from method integration. While morphological surveys showed higher functional richness (FRic: 2.71) and functional redundancy (FRed: 6.89) compared to eDNA (FRic: 1.93; FRed: 5.56), the integrated approach showed lower values (FRic: 0.58; FRed: 4.04). Although the integration of hints increases the detection rate of species, it does not necessarily enhance the understanding of the functional dimension. The reason might be that morphology can directly observe ecological traits [], while eDNA only provides information on species existence [].
In terms of phylogenetic diversity, the integrated approach maintained the high PD and Lambda+ values observed in eDNA data (PD: 31.10; Lambda+: 608.38), significantly outperforming morphological surveys alone (PD: 11.68; Lambda+: 274.04). This result highlights the advantage of eDNA in detecting species in a broader phylogenetic spectrum []. The integration method retains the extensive taxonomic resolution of eDNA and the species-level accuracy of morphological methods, generating more phylogenetic diversity in community profiles.
4.3. Environmental Drivers Shaping Fish Community Structure
Redundancy Analysis (RDA) indicates that there are differences in environmental associations between eDNA and morphological methods, reflecting their respective detection advantages. eDNA is more sensitive to water chemical parameters (TP and pH) and physical conditions (temperature and TSS) [], while morphology is more strongly associated with nutrient levels (TN) and electrical conductivity []. This complementarity indicates that a single approach may underestimate the complexity of the environment–community relationship in river systems.
In our comprehensive analysis, there is a strong positive correlation between dissolved oxygen and functional richness, indicating the fundamental role of oxygen in maintaining the functional strategies of fish community diversity [], reflecting the different oxygen requirements of different functional groups []. Furthermore, the significant impact of DO on phylogenetic diversity suggests its role as an evolutionary filter.
Interestingly, there was no significant correlation between environmental factors and Shannon diversity (p ≥ 0.05), challenging the general assumption that community species diversity is directly affected by the environmental gradient [,]. This indicates that the community aggregation of the Gaya River may be driven by more complex mechanisms, such as species interaction or habitat heterogeneity, rather than a single environmental gradient [].
5. Conclusions
In this study, we investigated the fish community structure and diversity in the Gaya River by integrating environmental DNA (eDNA) and traditional morphological survey methods. A total of 24 and 18 fish species were identified using eDNA and morphological approaches, respectively. Compared to the morphological method, eDNA showed a significant advantage in detecting higher taxonomic and phylogenetic diversity. Conversely, the morphological method outperformed eDNA analysis in assessing functional diversity. The combined application of both methods effectively improved species detection rates and provided complementary insights into phylogenetic and functional diversity. Total phosphorus (TP), total suspended solids (TSS), electrical conductivity (EC), water temperature (T), and pH were identified as key environmental factors influencing fish community distribution, while dissolved oxygen (DO) emerged as a critical driver of fish diversity patterns. This study provides essential baseline data for understanding fish community structure and biodiversity in transboundary rivers of northeastern China.
To our knowledge, this study represents the first systematic assessment of fish diversity in the Gaya River, providing a baseline inventory of its ichthyofauna. These findings have important implications for biodiversity monitoring and conservation in transboundary rivers of northeastern China. In particular, eDNA metabarcoding offers a non-invasive, highly sensitive, and cost-effective approach for long-term monitoring of fish communities, enabling detection of rare, cryptic, or migratory species that might be overlooked by morphological surveys. Integrating eDNA-based monitoring into fisheries management could enhance species conservation, guide habitat restoration, and support sustainable resource use in the Gaya River Basin.
Author Contributions
Material preparation data analysis and the first draft of the manuscript were completed by J.X., pictures were completed by W.L., sample collection was completed by Q.G., and the work was critically revised by M.W. All authors have read and agreed to the published version of the manuscript.
Funding
This study received funding from the Ministry of Science and Technology Special Project on Basic Scientific Resources Investigation “Survey of Water Resources and Aquatic Biodiversity in the Tumen River Basin” (2019FY101704).
Institutional Review Board Statement
Ethical approval for animal experiments was granted under approval number 41977193 by the Laboratory Animal Ethics Committee of Dalian Ocean University.
Informed Consent Statement
Not applicable.
Data Availability Statement
The datasets generated or analyzed during the study are available from the corresponding author upon reasonable request.
Acknowledgments
We sincerely appreciate the editor and all reviewers for their meticulous reading and comprehensive evaluation of our manuscript.
Conflicts of Interest
The authors have no financial or non-financial conflicts of interest related to this article.
References
- Shen, M.; Xiao, N.; Zhao, Z.; Guo, N.; Luo, Z.; Sun, G.; Li, J. eDNA metabarcoding as a promising conservation tool to monitor fish diversity in Beijing water systems compared with ground cages. Sci. Rep. 2022, 12, 11113. [Google Scholar] [CrossRef] [PubMed]
- Chakraborty, S.K. River Pollution and Perturbation: Perspectives and Processes; Springer International Publishing: Cham, Switzerland, 2021. [Google Scholar]
- Fang, L.; Wang, L.; Chen, W.; Sun, J.; Cao, Q.; Wang, S.; Wang, L. Identifying the impacts of natural and human factors on ecosystem service in the Yangtze and Yellow River Basins. J. Clean. Prod. 2021, 314, 127995. [Google Scholar] [CrossRef]
- De Haan, D.; Fosseidengen, J.E.; Fjelldal, P.G.; Burggraaf, D.; Rijnsdorp, A.D. Pulse trawl fishing: Characteristics of the electrical stimulation and the effect on behaviour and injuries of Atlantic cod (Gadus morhua). ICES J. Mar. Sci. 2016, 73, 1557–1569. [Google Scholar] [CrossRef]
- Rivot, W.B. Fish taxonomy in the digital age challenges and opportunities. FishTaxa-J. Fish Taxon. 2023, 30, 1–13. [Google Scholar]
- Wang, L.; Wan, F.; Qian, W. Research and prospects of environmental DNA (eDNA) for detection of invasive aquatic species in East Asia. Front. Mar. Sci. 2023, 10, 1284953. [Google Scholar] [CrossRef]
- Bessey, C.; Neil Jarman, S.; Simpson, T.; Miller, H.; Stewart, T.; Kenneth Keesing, J.; Berry, O. Passive eDNA collection enhances aquatic biodiversity analysis. Commun. Biol. 2021, 4, 236. [Google Scholar] [CrossRef]
- Rourke, M.L.; Walburn, J.W.; Broadhurst, M.K.; Fowler, A.M.; Hughes, J.M.; Fielder, D.S.; DiBattista, J.D.; Furlan, E.M. Poor utility of environmental DNA for estimating the biomass of a threatened freshwater teleost; but clear direction for future candidate assessments. Fish. Res. 2023, 258, 106545. [Google Scholar] [CrossRef]
- McCartin, L.J.; Vohsen, S.A.; Ambrose, S.W.; Layden, M.; McFadden, C.S.; Cordes, E.E.; McDermott, J.M.; Herrera, S. Temperature controls eDNA persistence across physicochemical conditions in seawater. Environ. Sci. Technol. 2022, 56, 8629–8639. [Google Scholar] [CrossRef]
- Jo, T.; Murakami, H.; Yamamoto, S.; Masuda, R.; Minamoto, T. Effect of water temperature and fish biomass on environmental DNA shedding, degradation, and size distribution. Ecol. Evol. 2019, 9, 1135–1146. [Google Scholar] [CrossRef]
- Li, Z.; Jiang, P.; Wang, L.; Liu, L.; Li, M.; Zou, K. A comparison of seasonal composition and structure of fish community between environmental DNA technology and gillnetting in the Pearl River Estuary, China. Ecol. Indic. 2023, 147, 109915. [Google Scholar] [CrossRef]
- Kim, S.Y.; Cheon, S.; Park, C.; Soh, H.Y. Integrating DNA metabarcoding and morphological analysis improves marine zooplankton biodiversity assessment. Sci. Rep. 2025, 15, 7283. [Google Scholar] [CrossRef]
- Li, S.; Huang, Y.; Li, F.; Liu, Y.; Ma, H.; Zhang, X.; Wang, X.; Chen, W.; Cui, G.; Wang, T. Functional alpha and beta diversity of fish communities and their relationship with environmental factors in the Huanghe River (Yellow River) Estuary and Adjacent Seas, China. Fishes 2024, 9, 222. [Google Scholar] [CrossRef]
- Huo, T.; Hu, G.; Wang, J. Current Status of Aquatic Biological Resources and Habitats in the Tumen River Basin; China Agriculture Press: Beijing, China, 2022. [Google Scholar]
- Wang, H.X.; Wu, W.; Wang, Q.K.; Yang, X.Q.; Yin, X.W. Impact of land use pattern on water quality under different riparian buffer zone scales in Gaya River Basin, Northeast China. Ying Yong Sheng Tai Xue Bao J. Appl. Ecol. 2023, 34, 3203–3213. [Google Scholar] [CrossRef]
- Meng, G.; Li, C.; Zheng, X.; Yin, X.; Li, X. Riparian Plant Community Diversity of the Gaya River Basin of Tumen Jiang. Mod. Agric. Sci. Technol. 2023, 2023, 124–130, 142. [Google Scholar] [CrossRef]
- Tang, J. The Study on Fish Community Structure and Biodiversity Characteristics in the Hongqi River Basin and the Upstream of the Tumen River. Master’s Thesis, Dalian Ocean University, Dalian, China, 2024. [Google Scholar] [CrossRef]
- Yang, J.; Zhang, X. A Freshwater Fish Mitochondrial 12S Universal Macro Barcode Amplification Primer and an Application Method Thereof. CN109943645A, 28 June 2019. [Google Scholar]
- Djurhuus, A.; Port, J.; Closek, C.J.; Yamahara, K.M.; Romero-Maraccini, O.; Walz, K.R.; Goldsmith, D.B.; Michisaki, R.; Breitbart, M.; Boehm, A.B.; et al. Evaluation of filtration and DNA extraction methods for environmental DNA biodiversity assessments across multiple trophic levels. Front. Mar. Sci. 2017, 4, 314. [Google Scholar] [CrossRef]
- Martin, M. Cutadapt removes adapter sequences from high-throughput sequencing reads. EMBnet. J. 2011, 17, 10–12. [Google Scholar] [CrossRef]
- Zhang, J.; Kobert, K.; Flouri, T.; Stamatakis, A. PEAR: A fast and accurate Illumina Paired-End reAd mergeR. Bioinformatics 2014, 30, 614–620. [Google Scholar] [CrossRef]
- Schmieder, R.; Edwards, R. Quality control and preprocessing of metagenomic datasets. Bioinformatics 2011, 27, 863–864. [Google Scholar] [CrossRef]
- Edgar, R.C. UPARSE: Highly accurate OTU sequences from microbial amplicon reads. Nat. Methods 2013, 10, 996–998. [Google Scholar] [CrossRef]
- Altschul, S.F.; Madden, T.L.; Schäffer, A.A.; Zhang, J.; Zhang, Z.; Miller, W.; Lipman, D.J. Gapped BLAST and PSI-BLAST: A new generation of protein database search programs. Nucleic Acids Res. 1997, 25, 3389–3402. [Google Scholar] [CrossRef]
- Melendy, S.A.; Olson, J.R. Identifying Key Environmental Drivers of Reach-Scale Salmonid eDNA Recovery with Random Forest. Environ. DNA 2024, 6, e70001. [Google Scholar] [CrossRef]
- Gonzalez-Martinez, A.; Margareto, A.; Rodriguez-Sanchez, A.; Pesciaroli, C.; Diaz-Cruz, S.; Barcelo, D.; Vahala, R. Linking the effect of antibiotics on partial-nitritation biofilters: Performance, microbial communities and microbial activities. Front. Microbiol. 2018, 9, 354. [Google Scholar] [CrossRef] [PubMed]
- Somerfield, P.J.; Clarke, K.R.; Gorley, R.N. Analysis of similarities (ANOSIM) for 2-way layouts using a generalised ANOSIM statistic, with comparative notes on Permutational Multivariate Analysis of Variance (PERMANOVA). Austral. Ecol. 2021, 46, 911–926. [Google Scholar] [CrossRef]
- Villéger, S.; Mason, N.W.; Mouillot, D. New multidimensional functional diversity indices for a multifaceted framework in functional ecology. Ecology 2008, 89, 2290–2301. [Google Scholar] [CrossRef] [PubMed]
- Villéger, S.; Brosse, S.; Mouchet, M.; Mouillot, D.; Vanni, M.J. Functional ecology of fish: Current approaches and future challenges. Aquat. Sci. 2017, 79, 783–801. [Google Scholar] [CrossRef]
- Su, G.; Mertel, A.; Brosse, S.; Calabrese, J.M. Species invasiveness and community invasibility of North American freshwater fish fauna revealed via trait-based analysis. Nat. Commun. 2023, 14, 2332. [Google Scholar] [CrossRef]
- Hall, B.G. Building phylogenetic trees from molecular data with MEGA. Mol. Biol. Evol. 2013, 30, 1229–1235. [Google Scholar] [CrossRef]
- Liu, H.; Qu, X.; Xia, W.; Chen, Y. Taxonomic, functional, and phylogenetic diversity patterns reveal different processes shaping river fish assemblages in the Eastern Huai River Basin, China. Water Biol. Secur. 2023, 2, 100078. [Google Scholar] [CrossRef]
- Gomes, M.M.D.C.C. Estrutura e Composição em Espécies da Comunidade Zooplanctônica de Lagoas Naturais da Região de Lagoa Santa, Minas Gerais; Universidade Federal de Minas Gerais: Belo Horizonte, Brazil, 2013. [Google Scholar]
- Wang, B.; Jiao, L.; Ni, L.; Wang, M.; You, P. Bridging the gap: The integration of eDNA techniques and traditional sampling in fish diversity analysis. Front. Mar. Sci. 2024, 11, 1289589. [Google Scholar] [CrossRef]
- Somerfield, P.J.; Clarke, K.R.; Warwick, R.M.; Dulvy, N.K. Average functional distinctness as a measure of the composition of assemblages. ICES J. Mar. Sci. 2008, 65, 1462–1468. [Google Scholar] [CrossRef]
- He, Y. Longitudinal Gradient Patterns of Taxonomic, Functional and Phylogenetic Diversity of Fish Communities in the Qiupu River. Master’s Thesis, Anhui Normal University, Anhui, China, 2021. [Google Scholar] [CrossRef]
- Wang, N.; Li, Y.; Han, S.; Zhang, Y.; Yang, J.; Yin, Z.; Deng, C.; Liu, Z.; Wu, Y.; Wu, W.; et al. CFViSA: A comprehensive and free platform for visualization and statistics in omics-data. Comput. Biol. Med. 2024, 171, 108206. [Google Scholar] [CrossRef]
- Fietto, L.S.; Schoereder, J.H.; Gerheim, I.; Paolucci, L.N. Dam failure disrupts Atlantic Rainforest ant communities and their interactions with seeds. J. Insect Conserv. 2024, 28, 1307–1318. [Google Scholar] [CrossRef]
- Cao, L.J.; Zhu, W.L. Comparative analysis of latitudinal variations in physiological indicators between Rodentia and Chiroptera mammals. Life Res 2025, 8, 17. [Google Scholar] [CrossRef]
- Keat-Chuan Ng, C.; Aun-Chuan Ooi, P.; Wong, W.L.; Khoo, G. A review of fish taxonomy conventions and species identification techniques. J. Surv. Fish. Sci. 2017, 4, 54–93. [Google Scholar] [CrossRef]
- Jin, X.; Sheng, L.; Wen, Y.; Chen, W.; Liu, H.; Li, Z. Distribution changes of fish populations in Tumen River Basin and main influencing factors. Environ. Ecol. 2022, 4, 69–75+84. [Google Scholar]
- Stoeckle, M.Y.; Soboleva, L.; Charlop-Powers, Z. Aquatic environmental DNA detects seasonal fish abundance and habitat preference in an urban estuary. PLoS ONE 2017, 12, e0175186. [Google Scholar] [CrossRef] [PubMed]
- Keck, F.; Blackman, R.C.; Bossart, R.; Brantschen, J.; Couton, M.; Hürlemann, S.; Kirschner, D.; Locher, N.; Zhang, H.; Altermatt, F. Meta-analysis shows both congruence and complementarity of DNA and eDNA metabarcoding to traditional methods for biological community assessment. Mol. Ecol. 2022, 31, 1820–1835. [Google Scholar] [CrossRef]
- Joydas, T.V.; Manokaran, S.; Gopi, J.; Rajakumar, J.P.; Yu-Jia, L.; Heinle, M.; Nazal, M.K.; Manikandan, K.P.; Qashqari, M.; Mohandas, S.P.; et al. Advancing ecological assessment of the Arabian Gulf through eDNA metabarcoding: Opportunities, prospects, and challenges. Front. Mar. Sci. 2024, 11, 1276956. [Google Scholar] [CrossRef]
- Li, W.; Xu, J.; Huang, Q.; Wang, M. Study on the biodiversity of macroinvertebrate in the Dayang River Basin during summer based on environmental DNA and morphological analysis. J. Freshw. Ecol. 2024, 39, 2358071. [Google Scholar] [CrossRef]
- Mouillot, D.; Loiseau, N.; Grenié, M.; Algar, A.C.; Allegra, M.; Cadotte, M.W.; Casajus, N.; Denelle, P.; Guéguen, M.; Maire, A.; et al. The dimensionality and structure of species trait spaces. Ecol. Lett. 2021, 24, 1988–2009. [Google Scholar] [CrossRef]
- Aragon, C.M. Effects of Forest Management on Understory Plant Traits and Biodiversity; Examensarbeten/SLU, Institutionen for Skogens Ekologi och Skötsel: Umea, Sweden, 2024. [Google Scholar]
- McGee, M.D.; Wainwright, P.C. Convergent evolution as a generator of phenotypic diversity in threespine stickleback. Evolution 2013, 67, 1204–1208. [Google Scholar] [CrossRef]
- Jiang, P.; Zhang, S.; Xu, S.; Xiong, P.; Cao, Y.; Chen, Z.; Li, M. Comparison of environmental DNA metabarcoding and bottom trawling for detecting seasonal fish communities and habitat preference in a highly disturbed estuary. Ecol. Indic. 2023, 146, 109754. [Google Scholar] [CrossRef]
- McElroy, M.E.; Dressler, T.L.; Titcomb, G.C.; Wilson, E.A.; Deiner, K.; Dudley, T.L.; Eliason, E.J.; Evans, N.T.; Gaines, S.D.; Lafferty, K.D.; et al. Calibrating environmental DNA metabarcoding to conventional surveys for measuring fish species richness. Front. Ecol. Evol. 2020, 8, 276. [Google Scholar] [CrossRef]
- Penaluna, B.E.; Cronn, R.; Hauck, L.L.; Weitemier, K.A.; Garcia, T.S. Uncovering the hidden biodiversity of streams at the upper distribution limit of fish. J. Biogeogr. 2023, 50, 1151–1162. [Google Scholar] [CrossRef]
- Maiello, G.; Bellodi, A.; Cariani, A.; Carpentieri, P.; Carugati, L.; Cicala, D.; Ferrari, A.; Follesa, C.; Ligas, A.; Sartor, P.; et al. Fishing in the gene-pool: Implementing trawl-associated eDNA metaprobe for large scale monitoring of fish assemblages. Rev. Fish Biol. Fish. 2024, 34, 1293–1307. [Google Scholar] [CrossRef]
- Corenblit, D.; Piégay, H.; Arrignon, F.; González-Sargas, E.; Bonis, A.; Ebengo, D.M.; Garófano, G.V.; Gurnell, A.M.; Henry, A.L.; Hortobágyi, B.; et al. Interactions between vegetation and river morphodynamics. Part II: Why is a functional trait framework important? Earth-Sci. Sci. Reviews 2024, 253, 104709. [Google Scholar] [CrossRef]
- Qiu, S.; Ooi, J.L.S.; Chen, W.; Poong, S.W.; Zhang, H.; He, W.; Su, S.; Luo, H.; Hu, W.; Affendi, Y.A.; et al. Heterogeneity of fish taxonomic and functional diversity evaluated by eDNA and Gillnet along a mangrove–seagrass–coral reef continuum. Animals 2023, 13, 1777. [Google Scholar] [CrossRef] [PubMed]
- Saccò, M.; Campbell, M.A.; Aguilar, P.; Salazar, G.; Berry, T.E.; Heydenrych, M.J.; Lawrie, A.; White, N.E.; Harrod, C.; Allentoft, M.E. Metazoan diversity in Chilean hypersaline lakes unveiled by environmental DNA. Front. Ecol. Evol. 2025, 13, 1504666. [Google Scholar] [CrossRef]
- Qian, M.M.; Wang, Z.Y.; Zhou, Q.; Wang, J.; Shao, Y.; Qiao, Q.; Fan, J.T.; Yan, Z.G. Environmental DNA unveiling the fish community structure and diversity features in the Yangtze River basin. Environ. Res. 2023, 239, 117198. [Google Scholar] [CrossRef]
- Mamun, M.; Jargal, N.; Atique, U.; An, K.G. Ecological river health assessment using multi-metric models in an Asian temperate region with land use/land cover as the primary factor regulating nutrients, organic matter, and fish composition. Int. J. Environ. Res. Public Health 2022, 19, 9305. [Google Scholar] [CrossRef]
- Herrera, D.L.; Navarrete, S.A.; Labra, F.A.; Castillo, S.P.; Opazo Mella, L.F. Functional biogeography of coastal marine invertebrates along the south-eastern Pacific coast reveals latitudinally divergent drivers of taxonomic versus functional diversity. Ecography 2023, 2023, e06476. [Google Scholar] [CrossRef]
- Lai, H.; Bi, S.; Yi, H.; Li, H.; Wei, X.; Wang, G.; Guo, D.; Liu, X.; Chen, J.; Chen, Q.; et al. Characteristics of demersal fish community structure during summer hypoxia in the Pearl River Estuary, China. Ecol. Evol. 2024, 14, e11722. [Google Scholar] [CrossRef]
- Mohammed, M.; Blasius, B.; Ryabov, A. Coexistence patterns and diversity in a trait-based metacommunity on an environmental gradient. Theor. Ecol. 2022, 15, 51–63. [Google Scholar] [CrossRef]
- Kaarlejärvi, E.; Itter, M.; Tonteri, T.; Hamberg, L.; Salemaa, M.; Merilä, P.; Vanhatalo, J.; Laine, A.L. Inferring ecological selection from multidimensional community trait distributions along environmental gradients. Ecology 2024, 105, e4378. [Google Scholar] [CrossRef]
- Kou, X.; Huang, S.; Bian, R.; Tang, Q.; Wang, H.; Liu, S.; Li, W.; Qi, W.; Cao, X.; Lan, H.; et al. Evidence of sewage discharge on the coalescence mechanism of aquatic microbial communities during high amplitude hydrological periods. Sci. Total Environ. 2025, 959, 178223. [Google Scholar] [CrossRef]
Disclaimer/Publisher’s Note: The statements, opinions and data contained in all publications are solely those of the individual author(s) and contributor(s) and not of MDPI and/or the editor(s). MDPI and/or the editor(s) disclaim responsibility for any injury to people or property resulting from any ideas, methods, instructions or products referred to in the content. |
© 2025 by the authors. Licensee MDPI, Basel, Switzerland. This article is an open access article distributed under the terms and conditions of the Creative Commons Attribution (CC BY) license (https://creativecommons.org/licenses/by/4.0/).