Article

Phosphorus Pools Associated with Fish in the Archipelago Sea

Centre for Economic Development, Transport and the Environment, 20800 Turku, Finland
Fishes 2025, 10(7), 328; https://doi.org/10.3390/fishes10070328
Submission received: 6 June 2025 / Revised: 25 June 2025 / Accepted: 1 July 2025 / Published: 3 July 2025
(This article belongs to the Section Biology and Ecology)

Abstract

This study compiles and updates data to construct the phosphorus budget of the Archipelago Sea (northern Baltic Sea, Europe), with a particular focus on estimating phosphorus pools associated with fish populations. Biomass data and species-specific phosphorus content were utilized, and a bioenergetic modeling approach was applied to Baltic herring (Clupea harengus membras) and European perch (Perca fluviatilis) to estimate species-specific food consumption and nutrient excretion. Between 2001 and 2024, average total phosphorus concentrations were 28% higher than during the baseline period of 1983–1989. From 1998 to 2023, the annual average fish catch in the Archipelago Sea was 15,516.5 tons (16.3 kg/ha), with 73.1% consisting of commercially harvested herring. Other abundant catch species included, for example, pikeperch (Sander lucioperca), northern pike (Esox lucius), and European smelt (Osmerus eperlanus). On average, the annual catch contained 83.4 tons of phosphorus. Fishing may have annually removed an amount of phosphorus equivalent to approximately 0.6% of the total phosphorus pool in the water column and surface sediment, or 1.4% of the estimated total phosphorus load to the Archipelago Sea. The contribution of fish to phosphorus turnover is minor, as nutrient recycling is dominated by plankton. Planktivorous fish and their prey recycle nutrients already present in the water column and are therefore not the primary drivers of eutrophication.
Key Contribution: Assessing the size of phosphorus pools associated with fish populations in the Archipelago Sea. Fishing in the Archipelago Sea between 1980 and 2023 may have annually removed an amount of phosphorus equivalent to approximately 0.6% of the total phosphorus pool in the water column and the surface layer of the sediment. The eutrophying effect of phosphorus—namely, the stimulation of primary production—occurs prior to its transfer to higher trophic levels, and therefore, its removal through fish harvest does not mitigate the initial ecological impacts. The contribution of fish to phosphorus turnover in marine ecosystems is small: plankton dominates the recycling of this nutrient because the turnover rates of planktonic organisms are higher than those of fishes.

1. Introduction

Eutrophication is widely recognized as the greatest threat to freshwater and coastal marine ecosystems globally [1], due to its well-documented adverse effects on aquatic ecosystem structure and functioning. This is also reflected in the current ecological status of the Baltic Sea, with particular emphasis on the Archipelago Sea, located in the northern Baltic Sea [2]. The average total phosphorus concentration in the surface water of the Archipelago Sea was approximately 21 µg/L from 2000 to 2024, indicating a moderate ecological status [3]. Achieving improved conditions often requires substantial reductions in nutrient loading [4]. However, since such reductions are often difficult to achieve, various action plans have proposed the removal of nutrients bound in aquatic biomass as a complementary measure. The underlying idea is that this could partially compensate for the required nutrient reductions. This approach has also been considered in efforts to improve the ecological status of the Archipelago Sea [5].
An alternative strategy that has been proposed involves intensifying fishing activities to facilitate the removal of nutrients—primarily phosphorus and nitrogen—bound in fish biomass. However, it has also been suggested that, in many cases, retaining fish populations in the ecosystem may be more beneficial for the marine nutrient cycle. More effective reductions in nutrient availability in eutrophic systems plausibly favor the ‘protection’ rather than removal of fish to allow sequestration of internal nutrients into the biomass of macrobiota rather than microphytic organisms [6,7].
All living organisms inherently contain nutrients incorporated into their biomass, collectively forming internal nutrient pools within ecosystem sinks [8]. Unless physically or biologically translocated, these biomass-stored nutrients return to the surrounding environment upon death and decomposition. In aquatic ecosystems, fish can function both as temporary nutrient sinks and as potential sources of phosphorus, due to the accumulation of nutrients in their biomass. Although fish often serve as a significant internal nutrient pool or ‘sink’ [9], their role in nutrient recycling may be minor due to slow biomass turnover—367 days for fish compared to 3.2 days for phytoplankton [7,8].
Evaluations of eutrophication mitigation measures often rely on overly simplistic comparisons, such as contrasting phosphorus removal via fish harvesting with inputs from riverine sources [10]. However, impact assessments should also consider what would happen to the nutrients contained in fish if they remained within the ecosystem’s biogeochemical cycles instead of being extracted through fishing. Additionally, it is important to assess how fish-derived substances—such as fecal matter and excretions—affect the ecological status of the marine environment. In all cases, establishing a comprehensive and detailed nutrient budget for the target area is essential. This budget should be appropriately linked to the nutrient dynamics of fish populations within the specific ecological context.
The present study entailed the compilation and revision of datasets employed in developing the phosphorus budget for the Archipelago Sea. Total phosphorus (TP) was used as a proxy for the nutrients available to planktonic organisms, as in previous studies [3,11,12]. Emphasis was placed on assessing the size of phosphorus pools associated with fish populations using biomass data and species-specific phosphorus content. The results provide insight into the role of fish in the phosphorus budget of the Archipelago Sea and underscore their significance in long-term nutrient storage.
To support the assessment, a bioenergetic modeling approach [13] was employed for Baltic herring (Clupea harengus membras) and European perch (Perca fluviatilis) to estimate species-specific food consumption. Herring has long been the most abundant catch in the Archipelago Sea, with perch as the most common predator. Therefore, their food consumption and nutrient recycling were studied in detail. The difference between the phosphorus intake via diet and the phosphorus retained in somatic growth was used to quantify the annual phosphorus recycling mediated by these fish. Bioenergetics models are commonly used to study fish growth and resource use under specific environmental conditions. When combined with population dynamics, these models can be scaled up to the ecosystem or community level [14].
The conclusions of this study provide valuable input for water management, particularly in guiding the planning of protection and restoration efforts in the coastal areas of the Baltic Sea. For example, fish farming is claimed to be load-neutral if fish are fed with feed made from Baltic Sea fish, representing ecological compensation. However, this claim lacks strong justification and has not been evaluated within the marine ecosystem’s nutrient cycles.

2. Material and Methods

2.1. Study Area

The Archipelago Sea is located between the Baltic proper and the Bothnian Bay (Figure 1). The total area of the Archipelago Sea is about 9500 km2, and the water volume is 213 km3. The combined surface area of the mainland-side water bodies of the Archipelago Sea is 6191 km2 [10]. The average water depth is only 23 m, with the deepest trench reaching 146 m. Detailed descriptions of its characteristics, and water quality trends are presented in my previous articles [3,11,12].
The most important catch species in commercial fishing in the Archipelago Sea is the Baltic herring (Clupea harengus). Cod (Gadus morhua) was still abundant in the 1980s, but since then, the species has become rare. Commonly occurring fish species in the Archipelago Sea include perch (Perca fluviatilis), pikeperch (Sander lucioperca), pike (Esox lucius), smelt (Osmerus eperlanus), and three-spined stickleback (Gasterosteus aculeatus). Various cyprinid species, such as roach (Rutilus rutilus), bream (Abramis brama), and ide (Leuciscus idus), are also prevalent. Less frequently represented in commercial catches are sprat (Sprattus sprattus), flounder (Platichthys flesus), burbot (Lota lota), Atlantic salmon (Salmo salar), and sea trout (Salmo trutta trutta).

2.2. Phosphorus and Water Quality Analytics

Over long periods, phosphorus can be considered the ultimate limiting nutrient of phytoplankton production in the Baltic Sea because atmospheric nitrogen is an endless source for N-fixing species [3,15]. Nitrogen fixation brings more nitrogen to the system, leading to phosphorus limitation. Sediments in the relatively shallow Baltic Sea play a key role in transforming organic phosphorus into inorganic forms and, over long periods, in removing phosphorus from biochemical cycling in the water column [16]. In the marine phosphorus (P) cycle, dissolved inorganic phosphorus (DIP), particulate inorganic (PIP) and organic phosphorus (POP), and dissolved organic phosphorus (DOP) are the main P pools [17]. Total phosphorus (TP) was used as a proxy for nutrients available to planktonic organisms. The basis for this assumption was that in a nutrient-constrained environment with a significant turnover of N and P, like during the summer season in the northern Baltic Sea, inorganic nutrients are rapidly (within hours) assimilated by organisms [18].
Water quality of the Archipelago Sea has been monitored for an extended period with standard methods, and the data are available through the open data service VESLA of the Finnish Environment Institute (https://www.syke.fi/en/environmental-data/maps-and-information-services/open-environmental-information-systems, accessed on 25 June 2025). VESLA includes physio-chemical measurement results of national and regional monitoring, carried out by regional environment centers, as well as local statutory monitoring results conducted by private companies and water protection associations. The VESLA service also includes the phytoplankton and test fishing registers, the latter of which requires login credentials.
In general, the basic analytical methods and chemistries that are used to determine concentrations of inorganic nutrients in seawater are well established [10,19]. The dataset used in this study is based on the analysis conducted in accredited laboratories, in accordance with the accreditation standard [20]. In laboratories, nutrients were usually analyzed from unfiltered samples within 5–8 h after sampling. The effects of turbidity and color on absorbance readings were taken into account in all analyses. Samples for total P were digested with K2S2O8 in acidic conditions and measured spectrophotometrically as ammonium molybdate blue complex [21].

2.3. Phosphorus Budget of the Archipelago Sea

Helminen [3] reported that the phosphorus load to the Archipelago Sea (6191 km2)—including diffuse sources, natural leaching, point sources, and atmospheric deposition—has averaged 575 t/a between 2000 and 2023 (SD 164; median: 585 t/a; range 324–990 t/a). Based on river water measurements, 27.6% of the total phosphorus is in dissolved inorganic form (DIP).
Estimates of internal phosphorus loading have varied greatly depending on the source and calculation method [3,22,23]. Helminen [3] examined in more detail the reasons why the estimates of internal load can be very different. For example, Lignell et al. [23] estimated internal P load to be as high as 3553 tons per year in the FICOS model. According to Helminen [3], this mainly represents an estimate of the gross phosphorus load originating from the sediment. In his study [3], the internal phosphorus load of the Archipelago Sea was estimated at 1403 tons per year (t/a) and during the biological production season, 269 tons, or 19%, of this load is transported to the surface layer (0–10 m). Furthermore, during the spring bloom, an estimated 1518 tons of phosphorus is removed from the surface layer with the sinking plankton mass.
Estimates of the background phosphorus load coming from other marine areas also depend on the definition and the modeling approach used. Helminen et al. [24] estimated the net inflows of simulated phosphorus into the Archipelago Sea to have been 584 t/a (SD 295; range 139–922 t/a) during the period 1993–1997. In the new 2024 model simulations [11], the net phosphorus load for the years 2000–2014 was estimated at approximately 425 t/a, of which 120 tons was directed to the southern Archipelago Sea during the summer. According to the model, the situation changed significantly in 2015 as surface currents began to flow southward from the Archipelago Sea [11]. In their model publication (Table 2 in [23]), Lignell et al. reported that during the years 2006–2014, the background phosphorus load entering the Archipelago Sea via the southern boundary was 2460 tons per year. Meanwhile, 845 tons per year flowed out through the northern boundary, resulting in a net input of 1615 tons per year. In this respect, the result differs significantly from the estimates published by Helminen [11].
The water volume of the Archipelago Sea has previously been estimated at approximately 220 km3, and the size of its phosphorus pool varies seasonally [3]. However, the size of the pool has not been calculated in detail. Quantitative analysis of phosphorus in the water phase of the Archipelago Sea was conducted for three time intervals: winter (1 January–31 March), the early summer minimum (15 May–15 June), and the ecological classification period (1 July–7 September), across different archipelago zones with known surface areas. The volumes of the different depth zones were presented in a previous study (Table 2 in [3]).
The monitoring stations included Turm 205 in the inner archipelago (Figure 1), whose phosphorus concentrations are known from previous research [14] to represent the average levels in the area. The intermediate archipelago was represented by the Seili intensive monitoring station, and the outer archipelago by the intensive stations at Utö and Brändö (Figure 1). The data covered the years 2001–2024.
Phosphorus concentrations in the Archipelago Sea were lower in the 1980s than in the 2000s, when the rising trend began to level off [25]. Unfortunately, water quality data needed to estimate the size of the phosphorus budget at the southern and northern edges (Utö and Brändö) have only been collected since around the turn of the 2000s. However, comprehensive data have been available from the intensive monitoring station at Seili since 1983. Based on these data, total phosphorus concentrations in the Inner Archipelago could be calculated using the same method as in the 2000s. Using the results, the change in the total phosphorus reservoir of the entire Archipelago Sea was assessed for the periods 1983–1989 and 2001–2024. In addition, the wintertime (1 Jan–31 Mar) average total phosphorus concentration of the entire water column (0–50 m) at the Seili station was used as a proxy to represent the size of the phosphorus reservoir when examining the relationship between the herring catch and the phosphorus levels in the Archipelago Sea.
According to studies by Puttonen [26,27], the top 2 cm layer of accumulation bottoms in the Archipelago Sea’s seabed contains 3.5 g of potentially mobile phosphorus per square meter (or tons per square kilometer). Of the Archipelago Sea’s 9300 km2 marine area, 61% consists of accumulation bottoms. Therefore, the potential reservoir of mobile phosphorus in the surface layer of the sediment in the Archipelago Sea is estimated to be 19,856 tons [26].

2.4. Catch Statistics

The catch data for various fish species in commercial fishing, starting from the year 1980, has been obtained from the official statistics produced by the Natural Resources Institute Finland (LUKE) [28]. Recreational fishing catch data has been available starting from 1998 and has been collected every other year [29]. The missing data for the intermediate years were estimated as the average of the preceding and following years.
The data for the Archipelago Sea was compiled from grids 47 (50H1), 50 (49H0), 51 (49H1), and 52 (49H2) (Figure 1). The numbers in parentheses refer to the grid codes used by LUKE. Grid 47 is classified under the Bothnian Sea according to the ICES division [30]. However, in practice it largely belongs to the Archipelago Sea, as the majority of the herring and perch catches are obtained from its southern edge.
Supplementary test fishing data from the Brunskär station (N6668589-E194444, ETRS-TM35FIN) within the Archipelago Sea were obtained from the VESLA test fishing registry, covering the period 2002–2023. Gear type used in fisheries independent surveys is the Nordic coastal multi-mesh gillnet [31].

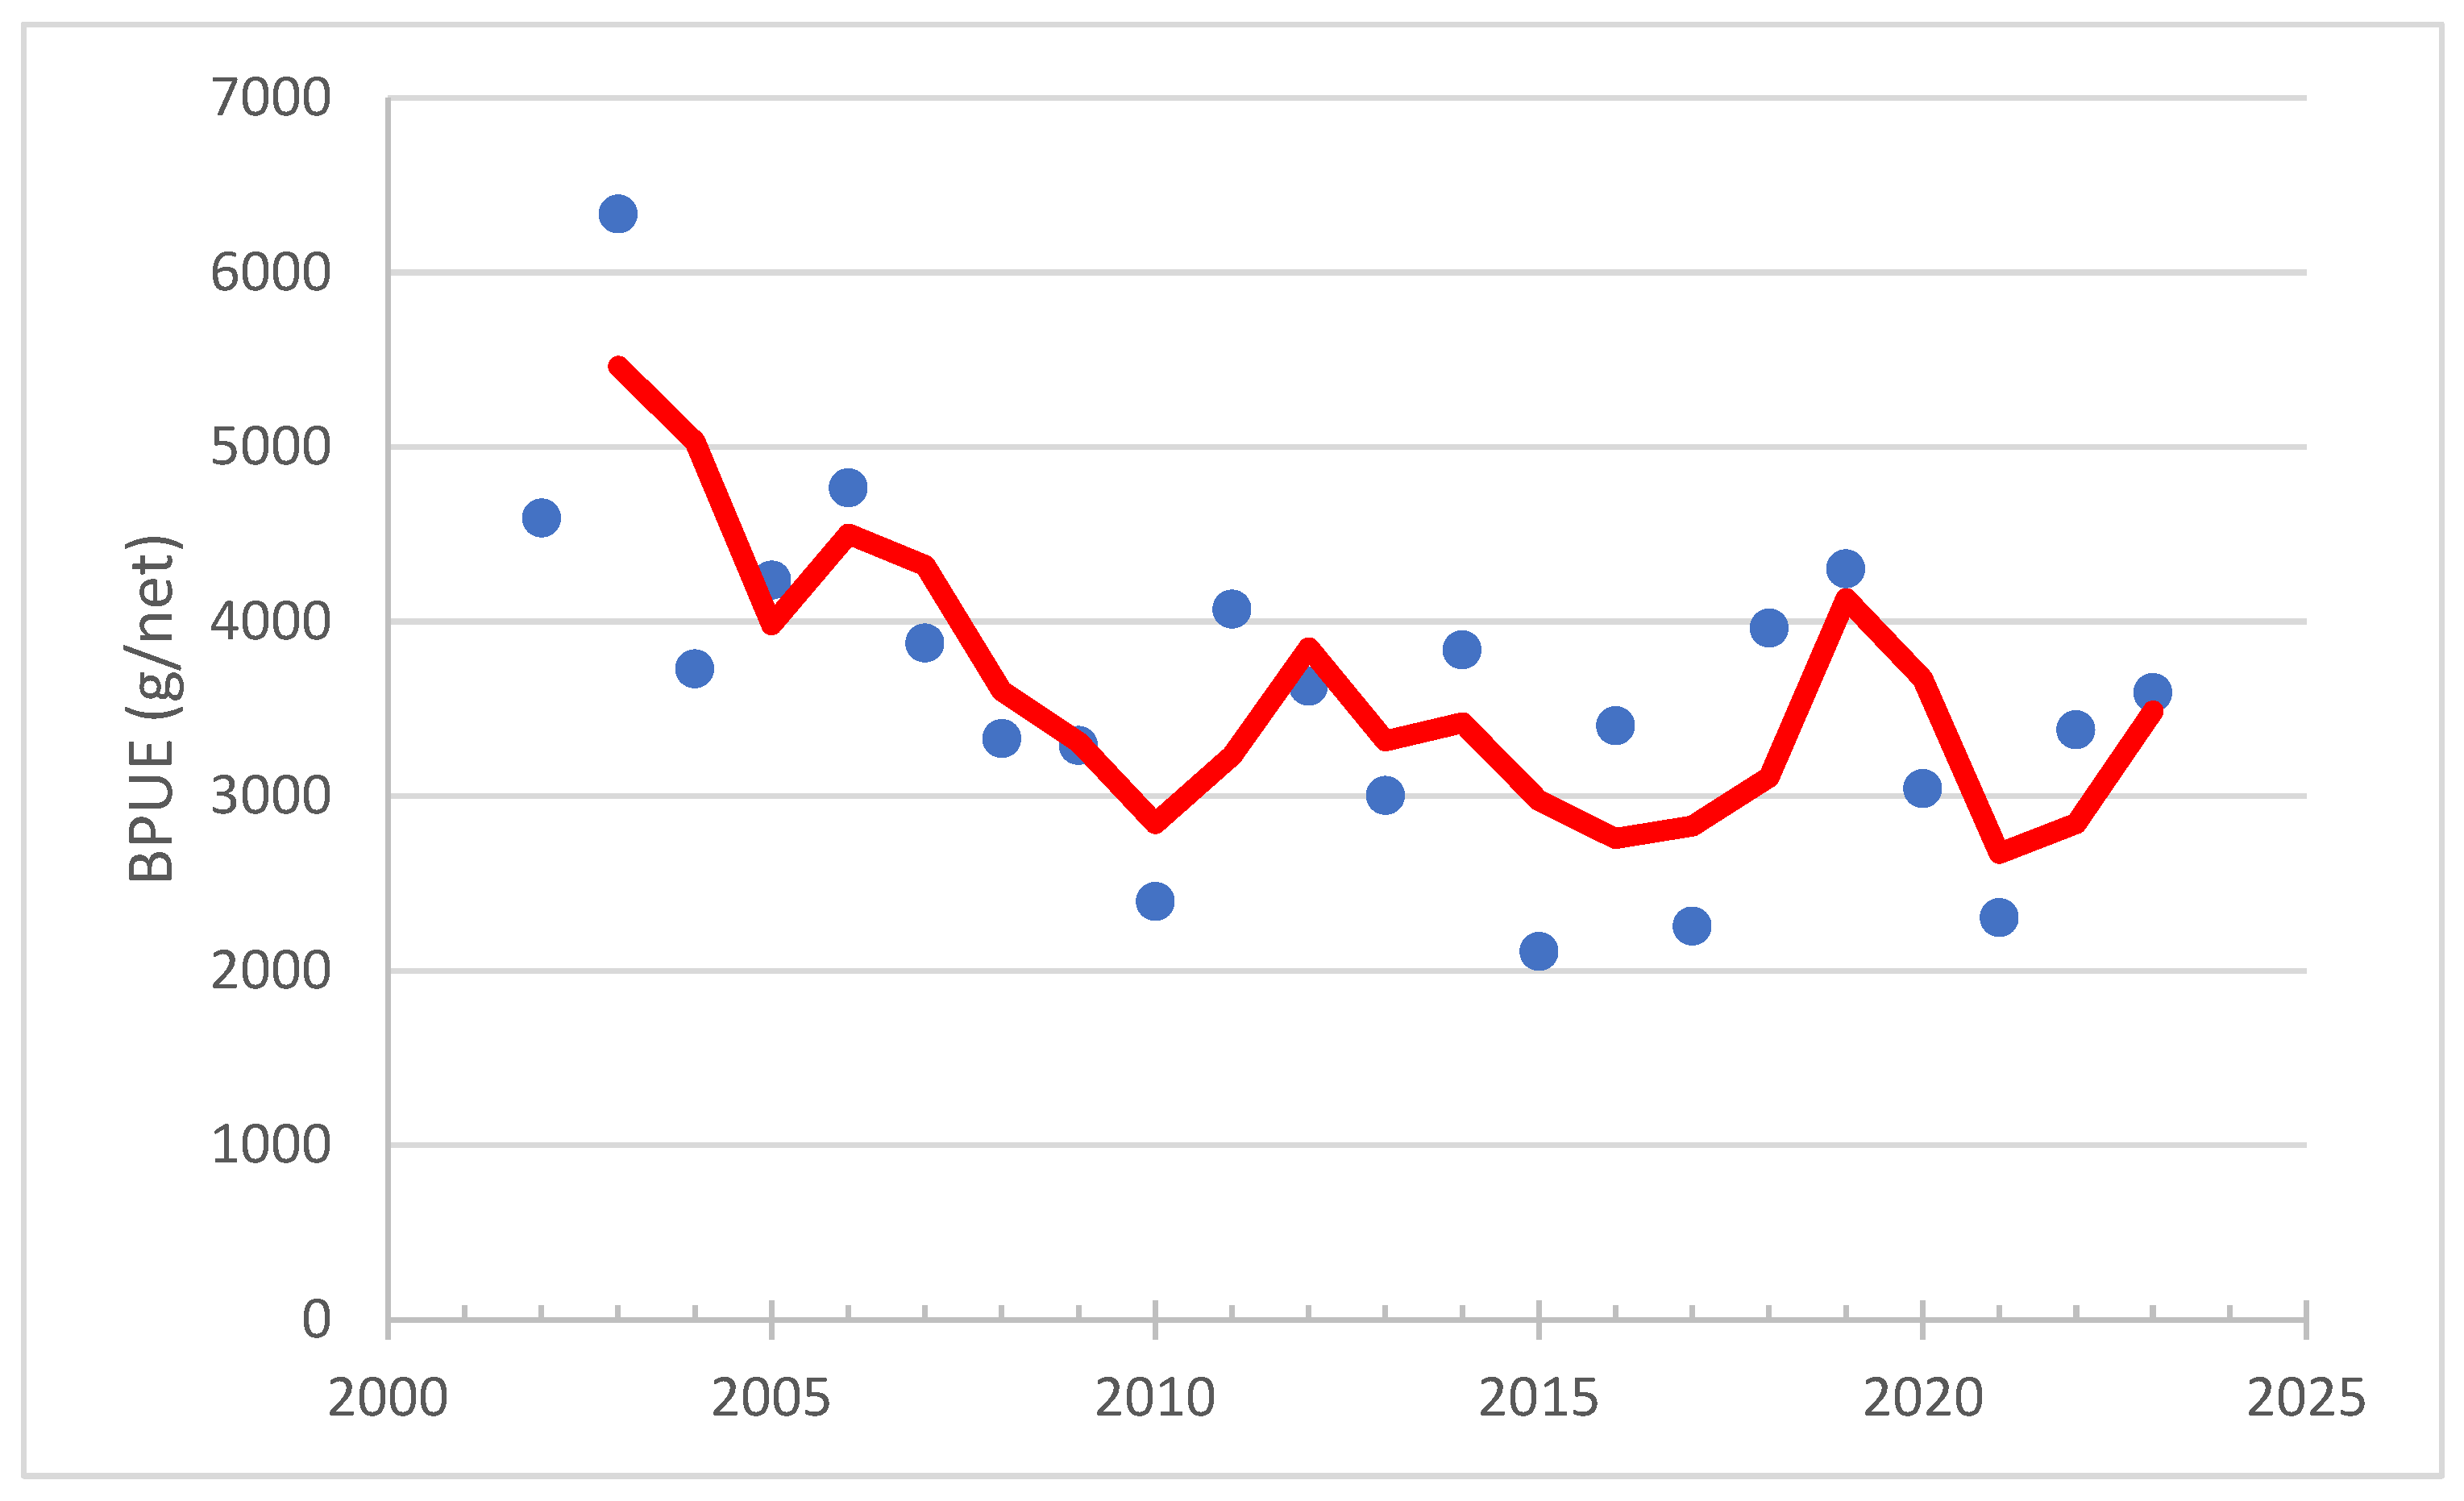
2.5. Herring Stock Assessment

The size of the herring stock was assessed in more detail for the years 1988 and 2023 for the purposes of food consumption and excretion calculations, based on fish catch statistics [28] and model results presented in the annual reports of the ICES Baltic Fisheries Assessment Working Group [30,32]. Of these, the year 1988 represents a situation when the annual herring catch was at its highest (29,507 t/year), and the year 2023 represents the current state with low catch levels (7248 t/year).
In the 2024 ICES report [30], Table 4.2.3 presented the total catch from year 2023 in grid 29 by age group in number of individuals and the average weights (g) of the age groups. The estimated number of individuals in each age group in the catch was obtained by scaling the total catch in grid 29 (12,727 t) to the catch from the study area of this research (7248 t). In the 2022 ICES report [32], the herring stock model still provided coefficients by which the spawning stock size and total biomass could be estimated based on the catch data for different years (Table 4.2.15). In 2023, the model structure was revised, and this information was no longer available. Here, I used the 2018–2021 average conversion factors: yield/ssb = 0.415 and yield/totalbio = 0.256.
Table 4.2.5 in the 2024 ICES report [30] contained the 1988 catch data in number of individuals for grids 25–32, but not separately for grid 29. The estimated number of individuals in each age group in the 1988 catch was obtained by scaling the total catch from grids 25–32 (262,558 t) to the catch from the study area of this research (29,507 t). According to the 2022 ICES report [32], Table 4.2.15 provided conversion factors for estimating the 1988 spawning stock biomass (SSB) and total biomass from catch data. Specifically, the ratios were yield/ssb = 0.252 and yield/totalbio = 0.169
Herring spawns in the littoral zone of the Archipelago Sea between early May and the end of July [33,34]. After spawning, the fish migrate to their feeding areas offshore and live there until the next reproduction. Thus, in the Archipelago Sea area, the abundance of herring varies significantly depending on the season. Unfortunately, no echo sounder surveys or other assessments have been conducted in the Archipelago Sea area to estimate the magnitude of this variation. However, it can be assumed that during the period from July 1 to October 31, the herring spawning stock and most individuals are feeding either in the open waters of the Bothnian Sea or in the Baltic Proper [33]. In the food consumption calculations, the herring stock (age group 1 and older) is assumed to obtain its food in the Archipelago Sea area during the winter period (November 1 to March 31) as well as in the spring and early summer (up to June 30). YOY (young-of-the-year) herring spend their entire first year feeding in the Archipelago Sea.
Herring are small, fast-growing fish. In the northern Baltic Sea in favorable conditions (abundant food and optimal temperatures), they can reach a size sufficient for reproduction in just two or three years [33]. According to ICES 2024 [30], around 74% of herring in the 2020s are estimated to have reached sexual maturity by the age of two. In this study, the spawning stock of herring is assumed to consist of individuals aged two years and older.

2.6. Perch Stock Assessment

According to Kokkonen et al. [35], perch catches in the Archipelago Sea peaked in the late 1990s, reaching nearly 2000 tons per year. They estimated the number of perch recruits (age group 3 years) and the size of the spawning stock (biomass in tons; age groups 5–14) for the years 1981–2009. According to marine fishery statistics [28,29], perch catches in the Archipelago Sea have remained well below those peak levels since 2009.
The effects of the late 1990s perch population were simulated by basing the number of recruits on the average number of 3-year-old recruits from 1994 to 1997, extracted from Figure 3a in Kokkonen et al. [35]. It was 31.25 × 10⁶ individuals. Similarly, the spawning stock biomass was estimated based on Figure 3b [35] as the average for the years 1998–2001. It was 7000 tons.
The simulation for the stock assessment required perch growth data because the size of the spawning stock was reported as biomass. Growth data were derived from Setälä et al. [36] by digitizing values presented in Figure 20. Next, the biomass estimates for age groups 4–10 were calculated using the abundance estimate of age group 3 and an iterated annual mortality rate of 0.4. This resulted in a spawning stock size (age groups 4–10 years) of approximately 7100 tons, which was sufficiently close to the average observed in the data for this assessment.

2.7. Bioenergetic Models

Bioenergetic models are formulated as an energy balance equation: C = R + A + SDA + F + U + G, where energy input (i.e., consumed food, C) is balanced by metabolic demands (standard metabolism, R; energy expenditure due to activity, A; and specific dynamic action, SDA, or the energy required to digest food), waste losses due to egestion (F) and excretion (U), and somatic and/or gonadal growth (G); units for all terms are typically joules per day.
The computation was conducted with Fish Bioenergetics 4.0 (FB4), a newly developed modeling application [12]. FB4 uses an R-based analytical approach that consists of a graphical user interface application [37] and an independent modeling package to be used in the R computing environment [38]. The FB4 model application includes pre-parameterized equations for herring [39] and perch [40] (Table 1).

2.7.1. Herring Growth and Energy

The growth of different herring age groups in 2023 was estimated based on the data of grid 29 in Table 4.2.3 of the ICES 2024 report [23,30] (Figure S1). The initial weight of YOY on June 1 was set at 1 g. The growth values for 1988 were derived from Table 4.2.6 [30], which provided the average weights (g) of age groups for grids 25–32 (Figure S1) [23].
Corrected temperature records at depths of 0–20 m from the Seili intensive monitoring station, located in the inner archipelago, were used as temperature data for herring (Figure S2). The data from the Seili station were adjusted to correspond to those of the Utö station, located in the outer archipelago on the southern edge of the Archipelago Sea, based on a temperature comparison between the two stations from 2000 to 2024: Utö = 0.93 × Seili − 0.25 (p < 0.001; R2 = 0.83). The correction was made because no data were available from Utö for the 1980s, and after 2015, measurements were infrequent. For the bioenergetic modeling of the year 1988, temperature averages from the years 1985–1989 were calculated, and correspondingly for the 2023 modeling, from the years 2019–2023.
The energy content of herring was estimated based on measurements of lipid content (% wet mass) of the muscle tissue conducted in the Archipelago Sea. Data were available from the years 1987–1988 [42] and 2020–2021 [43]. According to Rajasilta et al. [42] lipid content (% wet mass) of the muscle tissue in spawning Baltic herring (1987–1988 data combined) was 5.4%, and late (2013–2014 data combined) 1.5%. In the winter of 1998, the lipid content was 7.7%, and then in 2017 it was 4.3% [42]. According to Rajasilta et al. [43] in winter 2020 lipid content of herring caught in the intermediate archipelago was 3.1%, and in those caught in the northern parts it was 2.5%. Similarly, during the spawning season, their lipid contents were 1.6%.
For the year 1988, I calculated the energy content of herring aged 2 years and older based on fat percentages of 7.7% (November 1–December 31) and 5.4% (May 1–May 31). For the periods in between, the model interpolated daily estimates. No measurement data were available for protein content, so it was assumed to be constant at 16.3% [44]. Energy contents used were 37.4 kJ/g for fat and 16.7 kJ/g for protein. The resulting values were: 5602 J/g (November 1–December 31) and 4742 J/g (May 1–May 31). A constant energy content value of 4742 J/g was applied for herring in age groups 0 and 1.
For the year 2023, I used a winter fat percentage of 3.6% (combined data [42,43]) and a spawning season lipid content of 1.5% as the baseline values for energy content. The resulting values were: 3283 J/g (November 1–December 31) and 4068 J/g (May 1–May 31). A constant energy content value of 3283 J/g was applied for herring in age groups 0 and 1.
Phosphorus concentrations in Baltic herring have been measured, for example, by Hjernen and Hansson [45], who found that the content of N and P in herring and sprat was 2.4% and 0.43% of the wet biomass. In the study by Mäkinen et al. [41], the phosphorus content of Baltic herring measured at different times in the Archipelago Sea averaged 0.4%. Ruohonen et al. [46], in turn, reported a value of 0.53%. In the calculations I used an estimate of 0.45% of wet weight.
According to Möllmann et al. [47] likewise Flinkman et al. [48] Baltic herring was mainly preying upon calanoid copepods with Pseudocalanus sp. dominating the diet. The energy density estimates for prey items were derived from the bioenergetics model of Bachiller et al. [49]. There, the energy density of copepods was set to 3600 J g−1 for Calanus finmarchicus. For euphausiids and amphipods, an energy density of 4000 J g−1 was used. Here, a prey energy density of 3800 J g−1 was applied.
Walve and Larsson [50] have examined the carbon, nitrogen, and phosphorus contents of various zooplankton species in the Baltic Sea. Phosphorus concentrations were reported as percentages of dry weight, with an average value of 1.235%. The carbon content of zooplankton is 6% of wet weight [51], and since dry mass contains twice the amount of carbon, zooplankton dry weight biomass was on average 12% of zooplankton wet weight biomass. This yields an average phosphorus content of 0.15% of zooplankton wet weight, which was used as baseline data in this study. Measurements conducted in lakes have led to the same estimate [6,52].

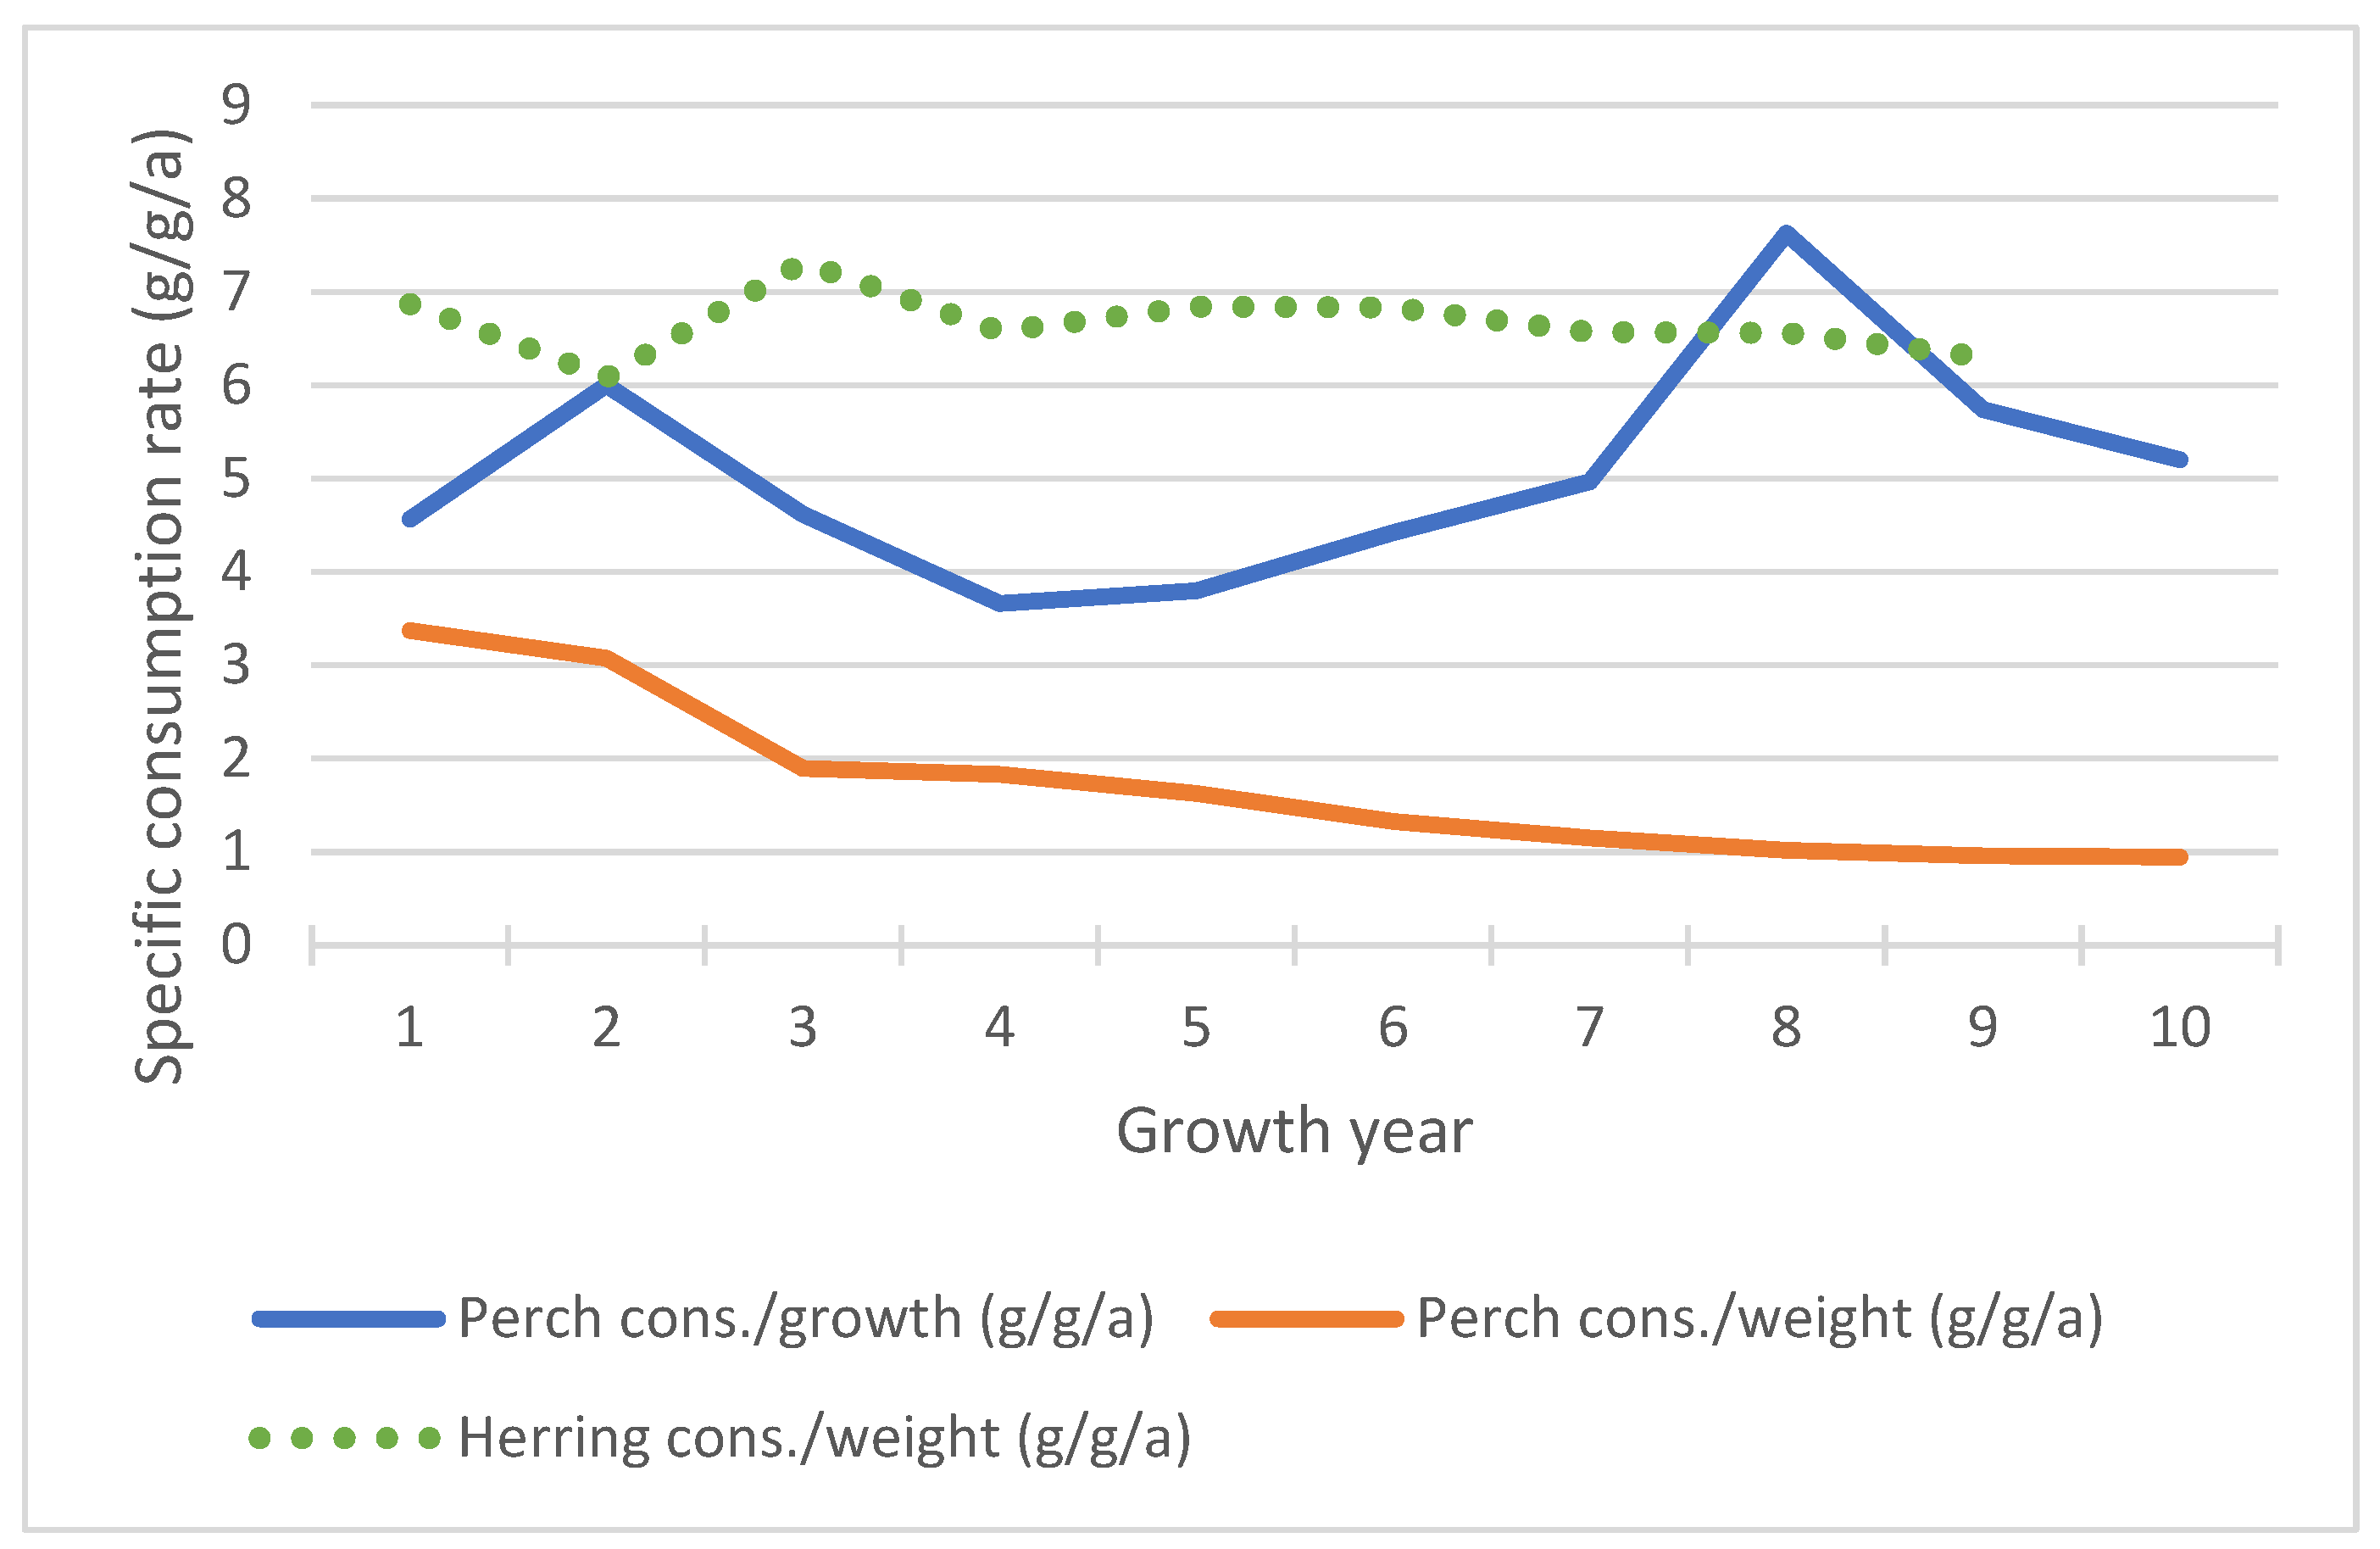
2.7.2. Perch Growth and Energy

The growth data for age groups 3 and older were obtained from Setälä et al. [36]. There the growth of perch in the Archipelago Sea was assessed using data from 1998 collected with different fishing gear (nets and trap nets), in which perch of various sizes and ages were well represented. The weights of 1- and 2-year-old perch were estimated based on the length data presented by Olin and Veneranta (Figure 18 in [53]) (Figure S3 [28,41]).
As temperature data for perch, records from the Seili intensive monitoring station from the years 2000–2020, were used at depths of 0–10 m (Figure S4). For the bioenergetic modeling of the year 1998, temperature averages from the years 1991–1999 were calculated.
No measurements have been made of the energy content of the perch in the Archipelago Sea. According to Schreckenbach et al. [54] the average energy content of freshwater perch was 4840 J/g (fish n = 1032). In the same study, the average phosphorus content of the perch was 1.02%. The phosphorus content of perch in the Archipelago Sea was determined in 2007 and the result was 1.08% [41]. I utilized this as an initial estimate in the bioenergetics model.
According to Jacobsen et al. [55] in the Baltic Sea perch undergo two ontogenetic diet shifts, from zooplankton to macroinvertebrates at ca. 50 mm; and then to fish at ca. 250 mm. The proportion of fish in the diet increased with perch length from 2% in length class of 50–74 mm to 92% in the length class of 375–474 mm, and constituted ≥50% of the diet in perch in the size range of 250–474 mm. I used their research findings (Figure 2 in [55]) as input data for the model regarding the diet of perch, but I divided the food sources into only two groups—zooplankton, insects, and fish, etc. (Figure S5 [48]). According to Jacobsen et al. [55], group 1 includes, among others, worms, caddisfly larvae, roes, amphipods, isopods, and mysids. For example, Chipps and Bennet [56] have reported for juvenile Mysis relicta in Char Lake an energy value of 3.14 kJ g−1 wet wt. However, I used here for group 1 prey energy density value 3800 J/g (see earlier herring prey). For this group, the phosphorus content is also assumed to be 0.15%, based on the estimate previously applied in connection with herring prey.
Jacobsen et al. [55] found that the three-spined stickleback contributed most to the total diet of perch in early summer, gobiids were found more in August–September. Lappalainen et al. [57] had similar results from Gulf of Finland were larger perch, > 20 cm, fed mainly on fish. Gobiidae accounted for approximately half of the fish diet of perch, other important species being herring and three-spined stickleback. Hovel et al. [58] used an energy content of 6030 J/g for adult three-spined sticklebacks in their bioenergetics modeling. Lee and Johnson [59], in turn, used an estimated energy content of 4600 J/g for round goby in their model. The round goby (Neogobius melanostomus) is currently a common non-native species in the Archipelago Sea, and it is known that perch feed on it. In the Archipelago Sea, cyprinid fish and smelt (Osmerus eperlanus) are also a potential food source for perch. According to the study by Schreckenbach et al. [54], the energy content of roach in freshwater is 5080 J/g. Similarly, the energy content of smelt would be 4086 J/g [60]. Perch can also feed on younger individuals of their own species, whose energy content was previously assumed to be 4840 J/g. In the bioenergetics model for perch, I use the average energy content of the mentioned prey fish species (herring in this connection 4742 J/g), 4900 J/g, as data input.

2.8. Phosphorus Content of Other Fish Species

Mäkinen et al. ([41] Appendix 3) presented measurement results of phosphorus concentrations in various fish species from the Archipelago Sea. Based on these, I calculated an average phosphorus content of 0.81% for cyprinid fish. The other values were as follows: three-spined stickleback 0.71%, smelt 0.45%, and the previously mentioned perch 1.08%, as well as 0.45% calculated for herring. For round goby, I found a phosphorus concentration estimate of 0.585% [61]. The overall average of all these values is 0.7%, which I used as input data in the calculations.
In this context, data were also sought on the phosphorus concentrations of recreational fishing catch species. According to Mäkinen [41], the phosphorus content in pike (Esox lucius) from the Archipelago Sea is 0.66%, and in pikeperch (Sander lucioperca) it is 0.80%. When cyprinids and perch are also included, the average phosphorus content is 0.84%.

2.9. Statistical Analysis

Statistical processing of the data, including regression and correlation analyses as well as summary statistics, was performed using Microsoft® Excel® for Microsoft 365 MSO (Version 2502 Build 16.0.18526.20264). Regression analysis was also employed to identify statistically significant trends. For time series analysis, exponential smoothing was performed in Excel on the temperature data from the Seili station. Additionally, a technical adjustment of +10% was applied to the total phosphorus concentrations for the period 2016–2024. The non-parametric Mann–Whitney U test was conducted using Excel XLSTAT to compare two independent groups when the dependent variable was either ordinal or continuous but not normally distributed. This test evaluates whether observations in one group tend to be larger than those in the other. A significant level of 0.05 was adopted for all statistical tests.

3. Results

3.1. The Phosphorus Pool in the Water Column of the Archipelago Sea

The phosphorus pool in the water of the Archipelago Sea varies seasonally. In the 2000s, the highest amount of phosphorus was observed during winter (January 1–March 31), totaling 6764 tons, and the lowest in early summer (May 15–June 15), after the spring bloom, at 4789 tons. During the ecological classification period (July 1–September 7), the average phosphorus content in the water was 5494 tons. The average total phosphorus concentrations in the entire water column were 30.7 µg/L in winter, 21.8 µg/L in early summer, and 25.0 µg/L during the ecological classification period. The seasonal reduction from the winter maximum to the early summer minimum—amounting to 1975 tons—is primarily attributed to the spring phytoplankton bloom. During this period, large amounts of phosphorus are taken up by primary producers and subsequently transferred to the sediments through the sedimentation of organic matter.
In the years 2001–2024, the average total phosphorus concentrations in the Inner Archipelago were 28% higher in winter compared to the average for the years 1983–1989. The Mann–Whitney U test revealed a significant difference between these periods (U = 2.5, p < 0.001). The corresponding difference was 15% in early summer and 23.6% during the ecological classification period. Based on the observed phosphorus concentrations, estimates were derived for the total phosphorus pool in the water phase of the Archipelago Sea during the late 1980s. The estimated phosphorus pools were 5268 tons in winter, 4163 tons in early summer, and 4444 tons during the ecological classification period. The seasonal decline in phosphorus mass from winter to early summer amounted to 1122 tons.
At the Seili monitoring station, the average total phosphorus concentration in the entire water column (0–50 m) during winter (1 January to 31 March) increased from 25.5 µg/L in 1984 to 40.9 µg/L in 2012. The increase in phosphorus concentration (y) was statistically significant: y = 0.394x + 756.4 (95% CI for x: 0.301 to 0.488; p < 0.001; R2 = 0.74). During the years 2013–2024, the average wintertime total phosphorus concentration was 34.1 µg/L (SD 1.9).
There as well, the mean surface water temperature (0–20 m) during the open-water season (15 May to 15 October) increased by approximately 0.5 °C per decade between 1983 and 2024, rising from 12 °C to 14.5 °C. The resulting equation was as follows: y = 0.054x − 95.76 (95% CI: 0.037–0.072; p < 0.001; R2 = 0.51. It is therefore not surprising that a statistically significant correlation was also found between the average temperatures during the open-water season and the total phosphorus concentration in the entire water column during the subsequent winter season (p = 0.004; R = 0.45).

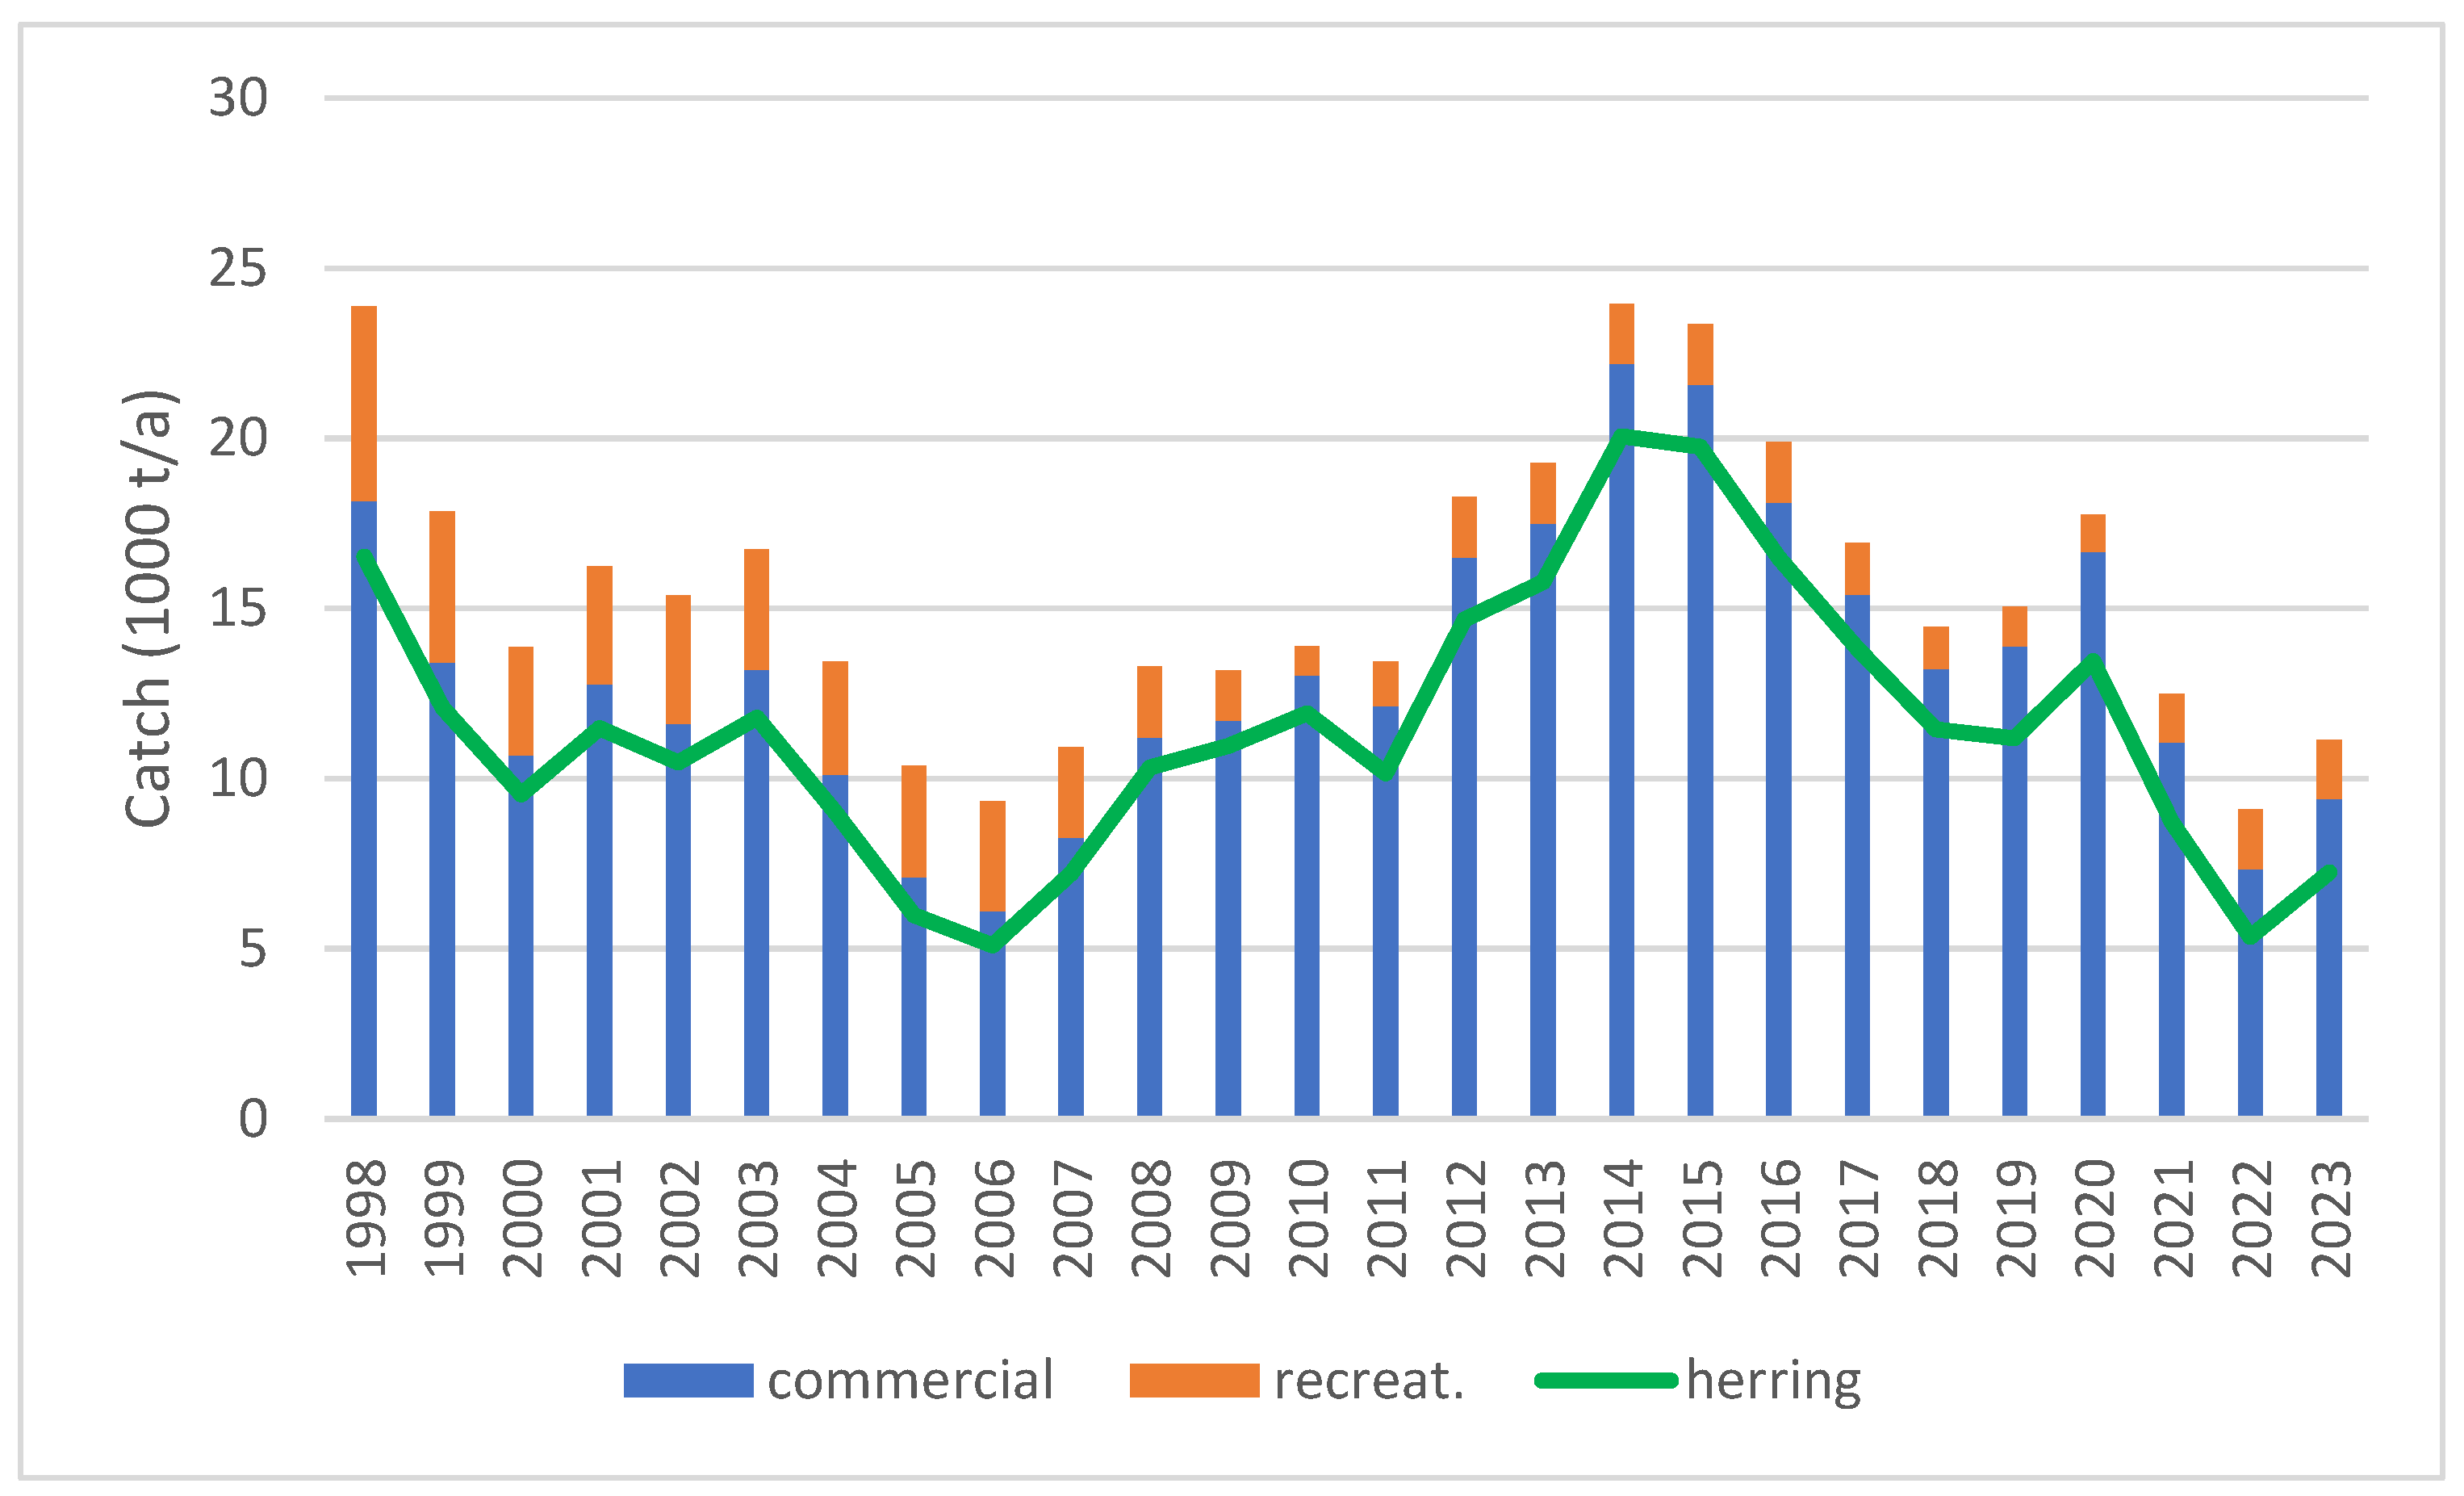
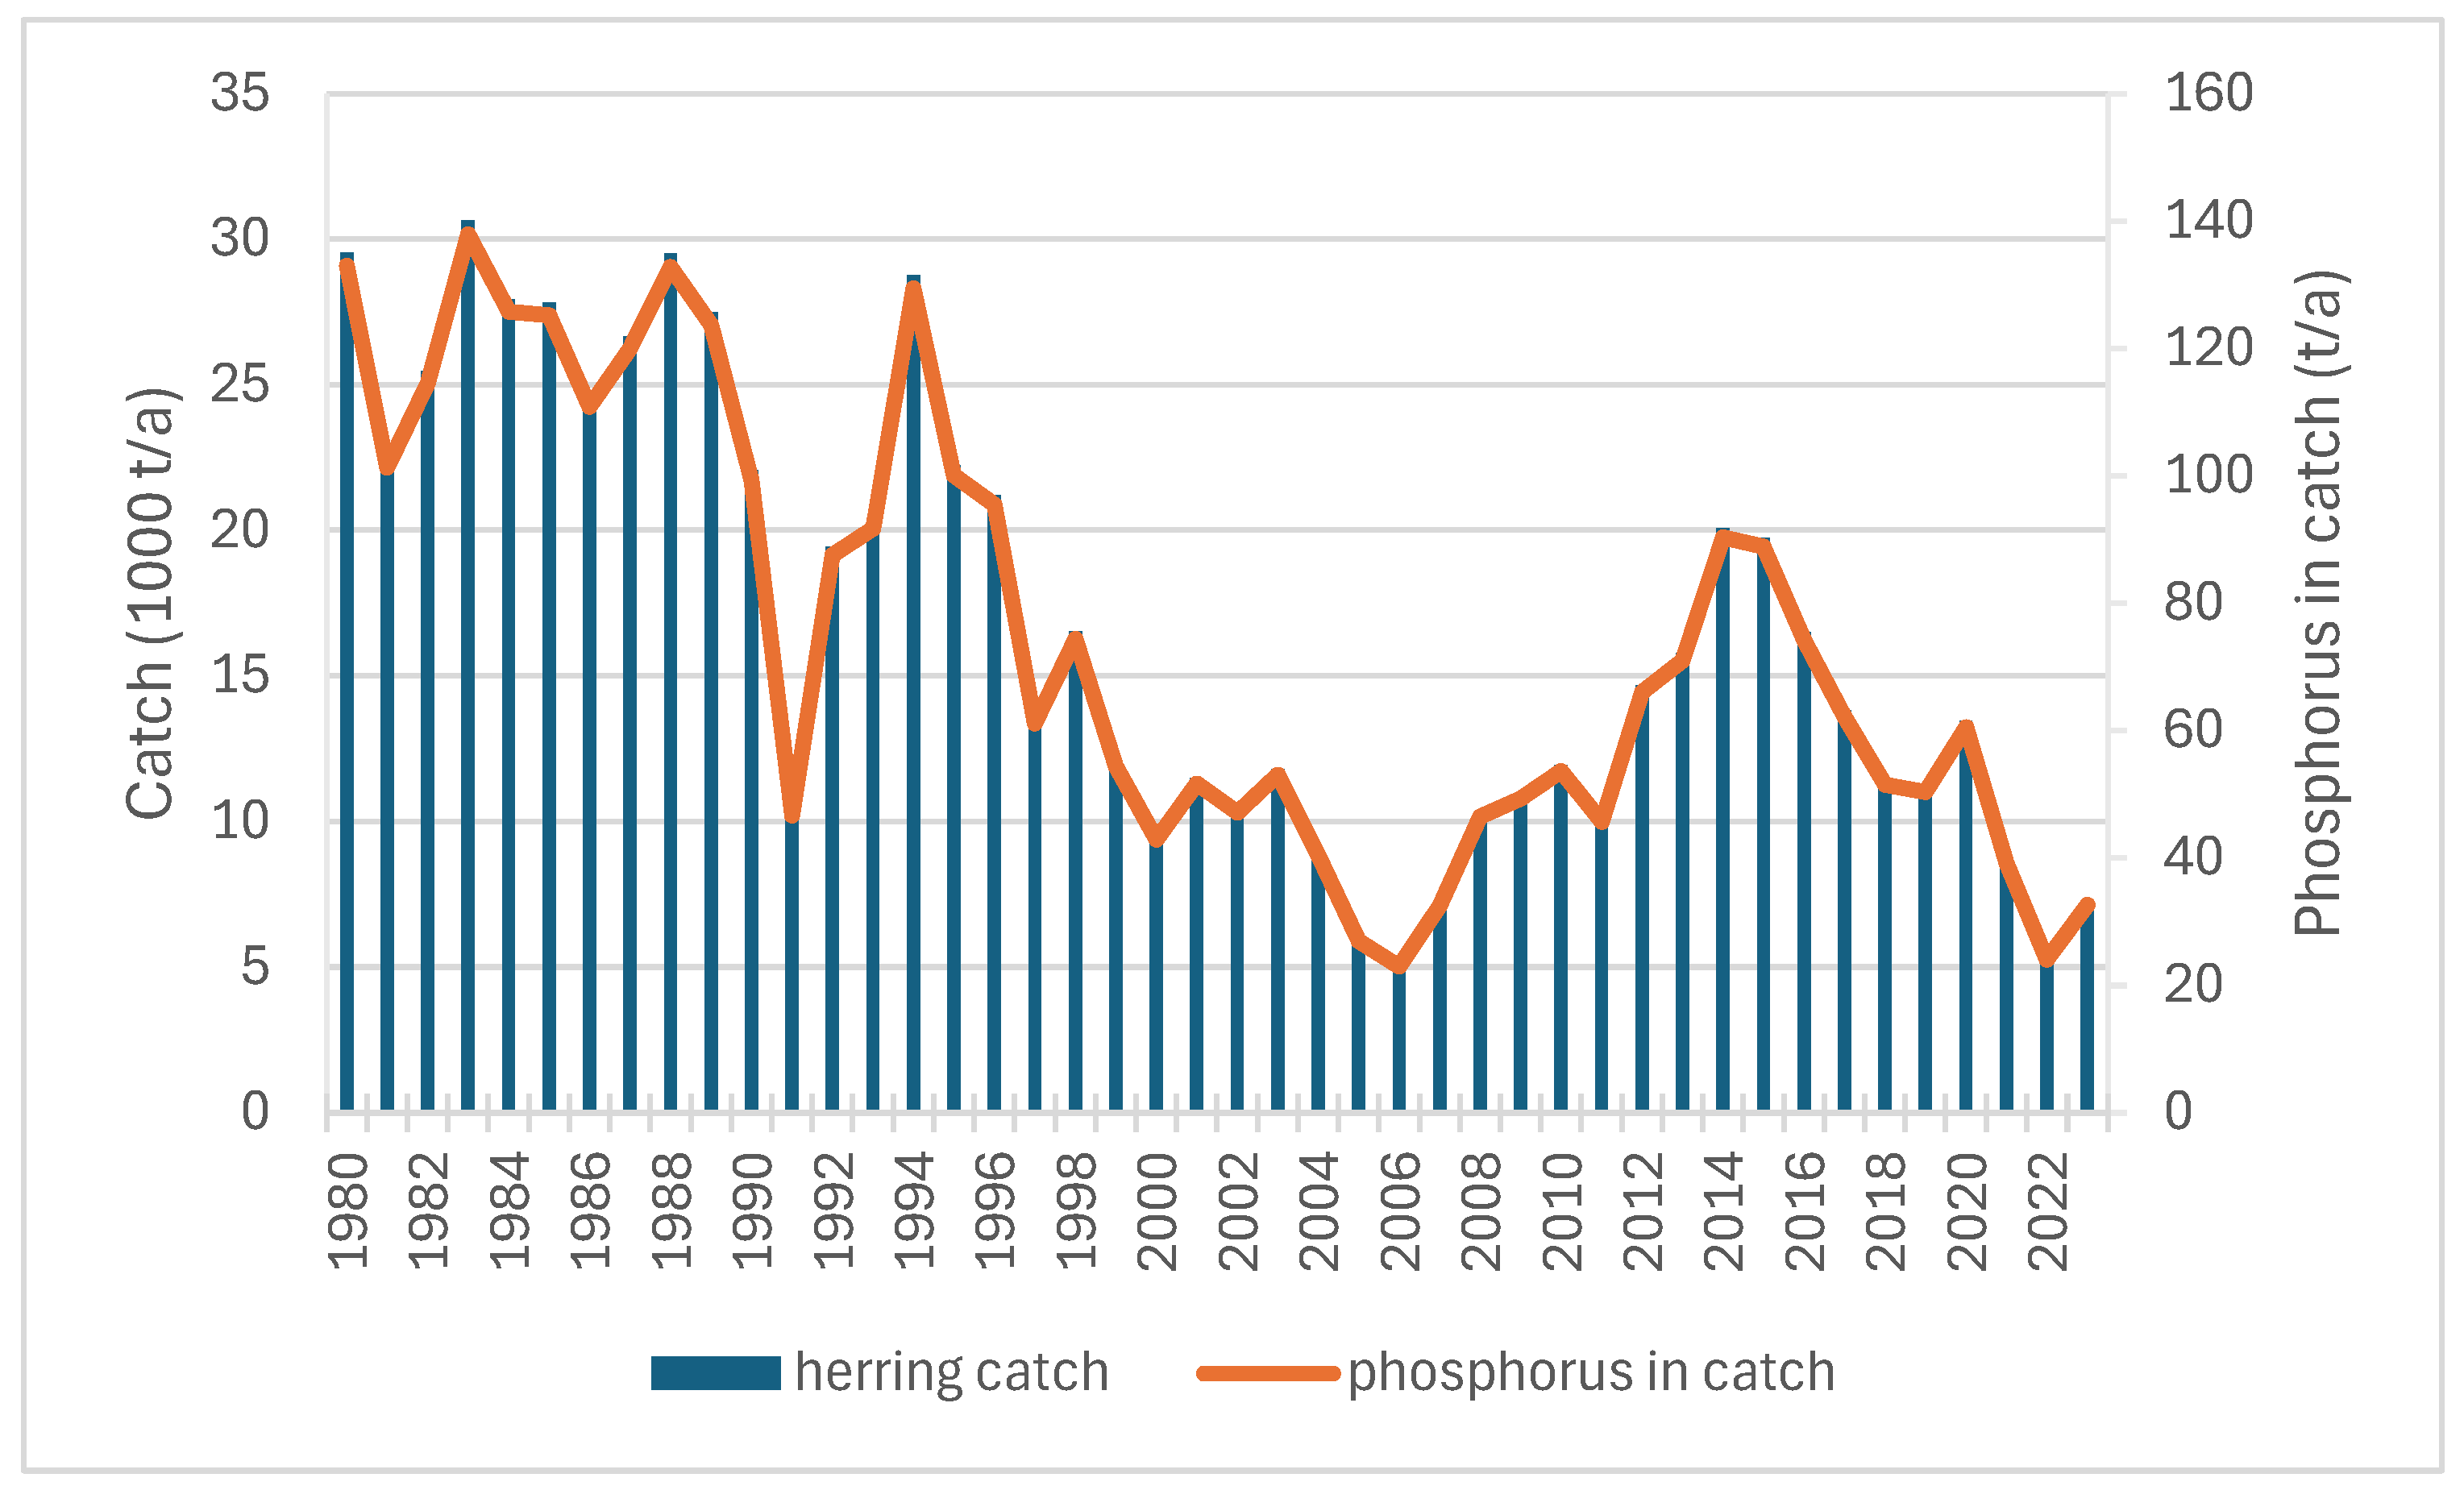
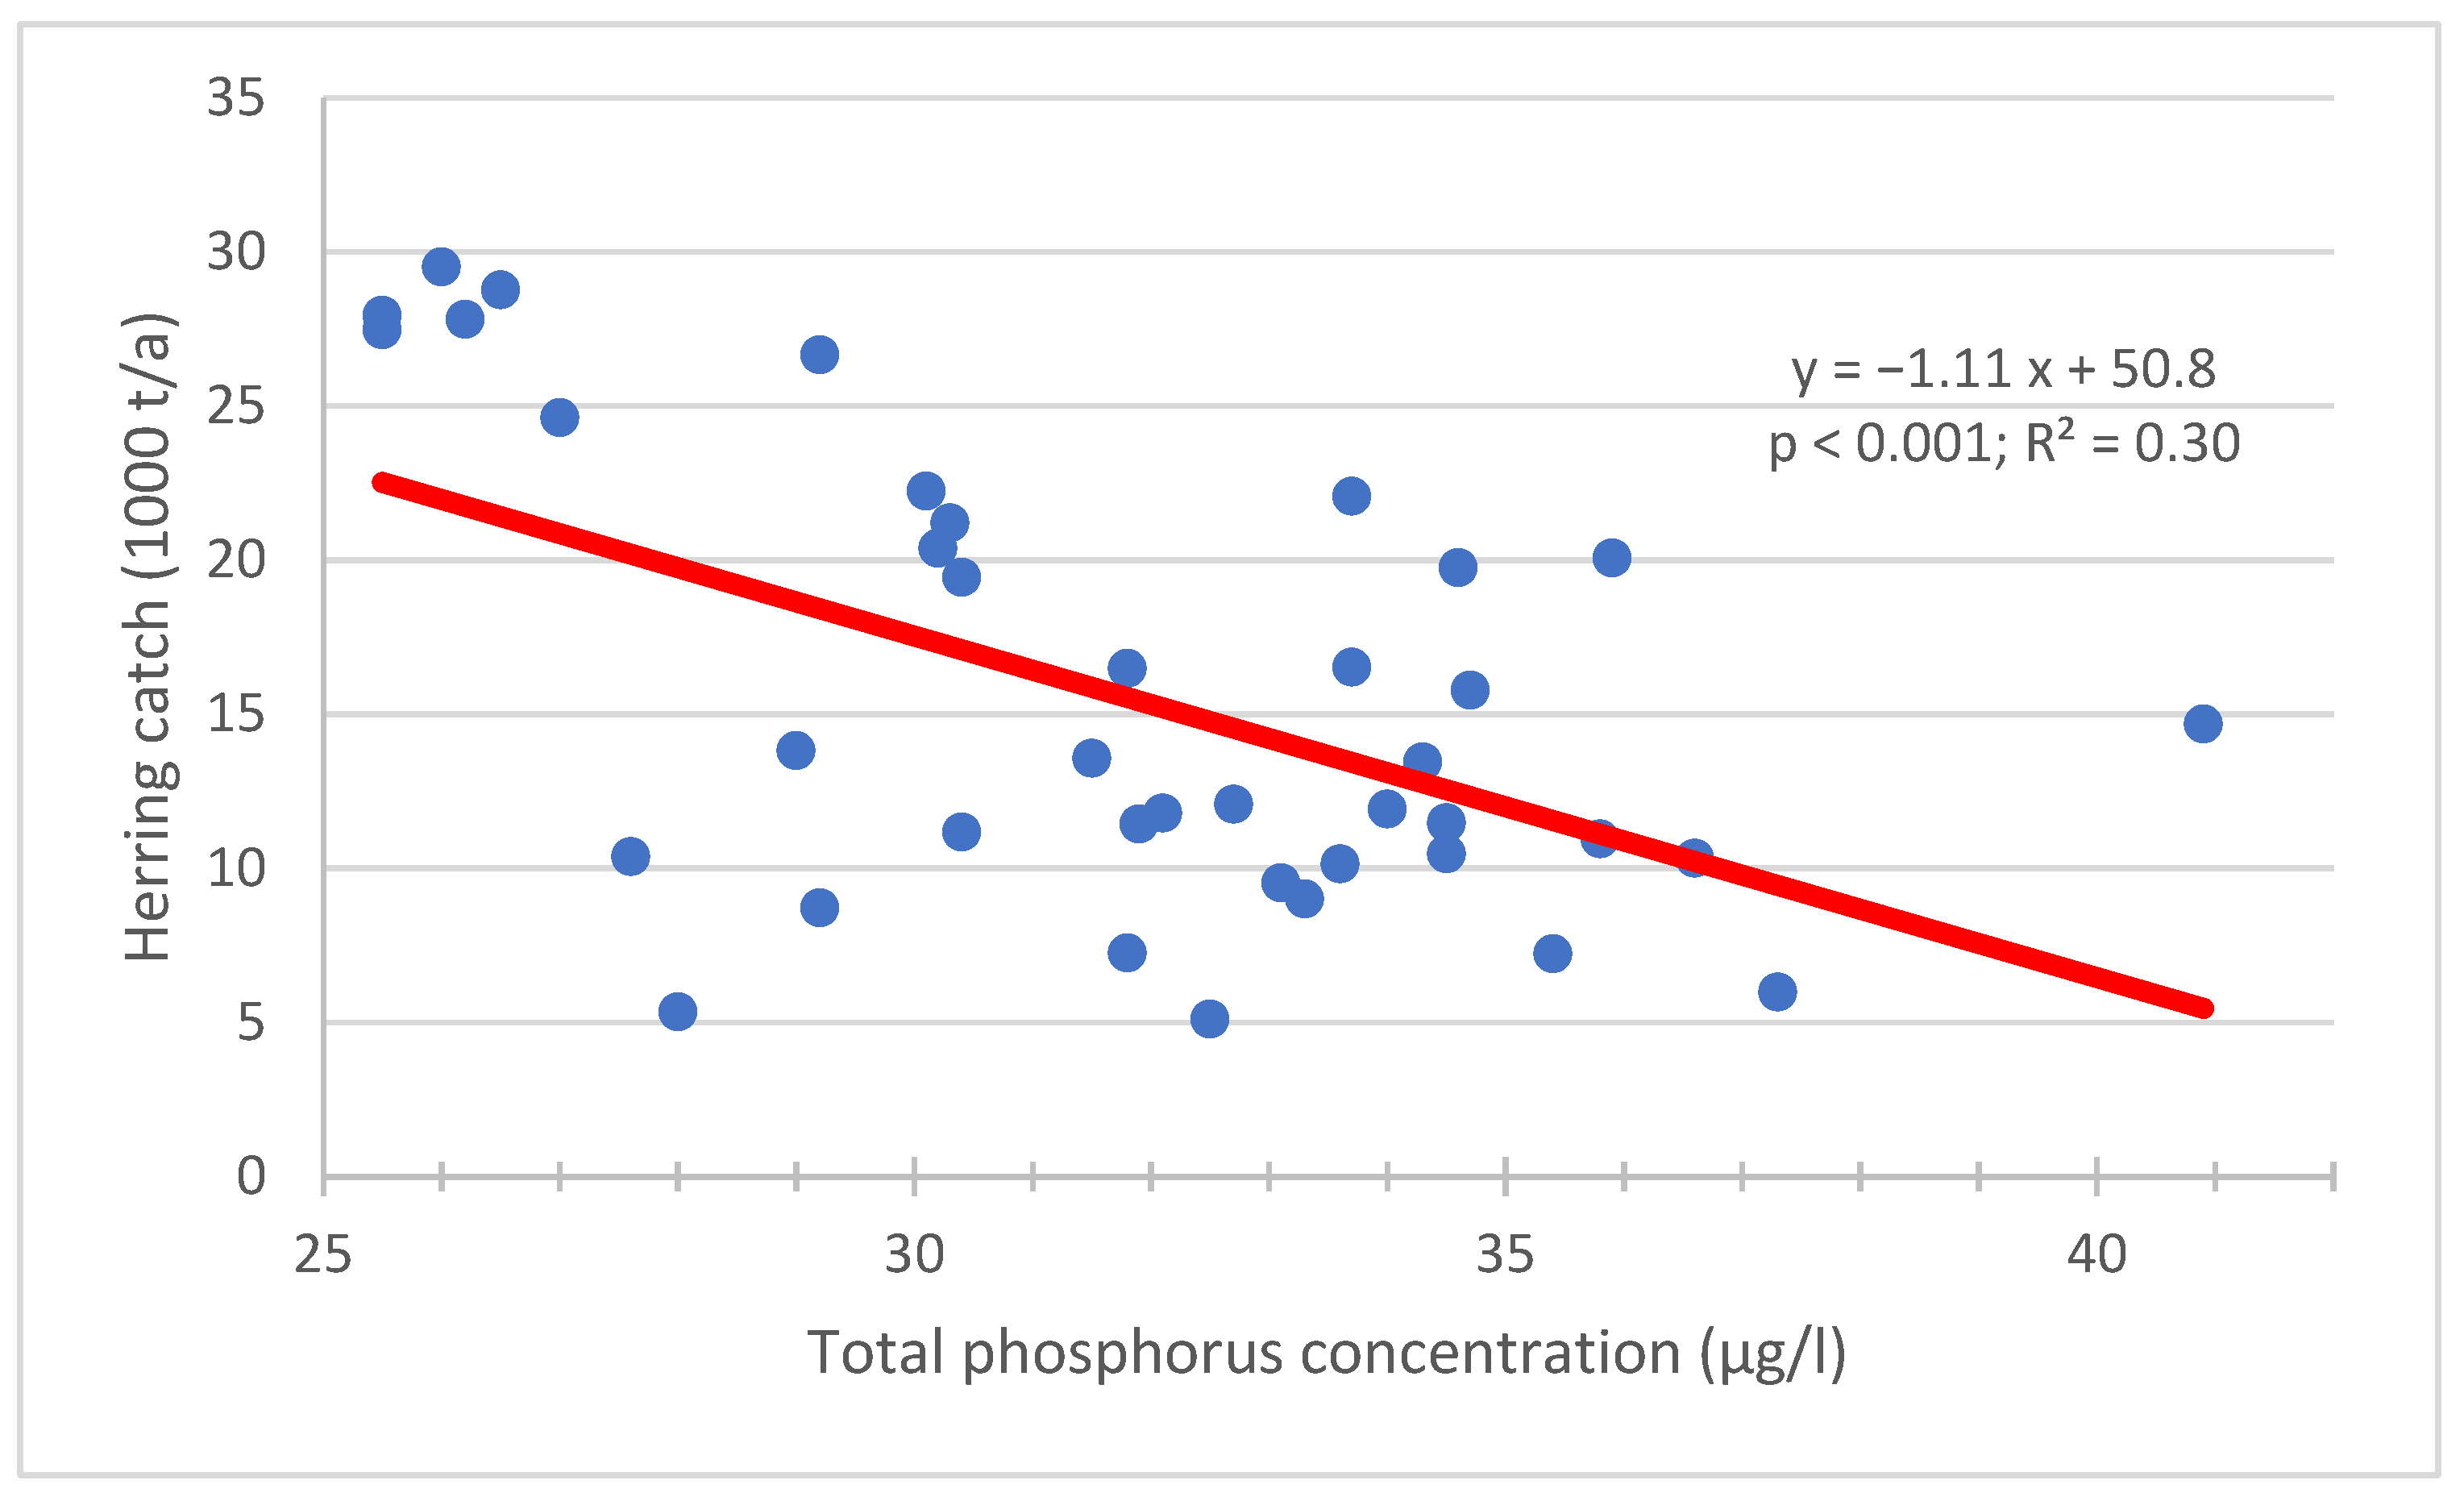
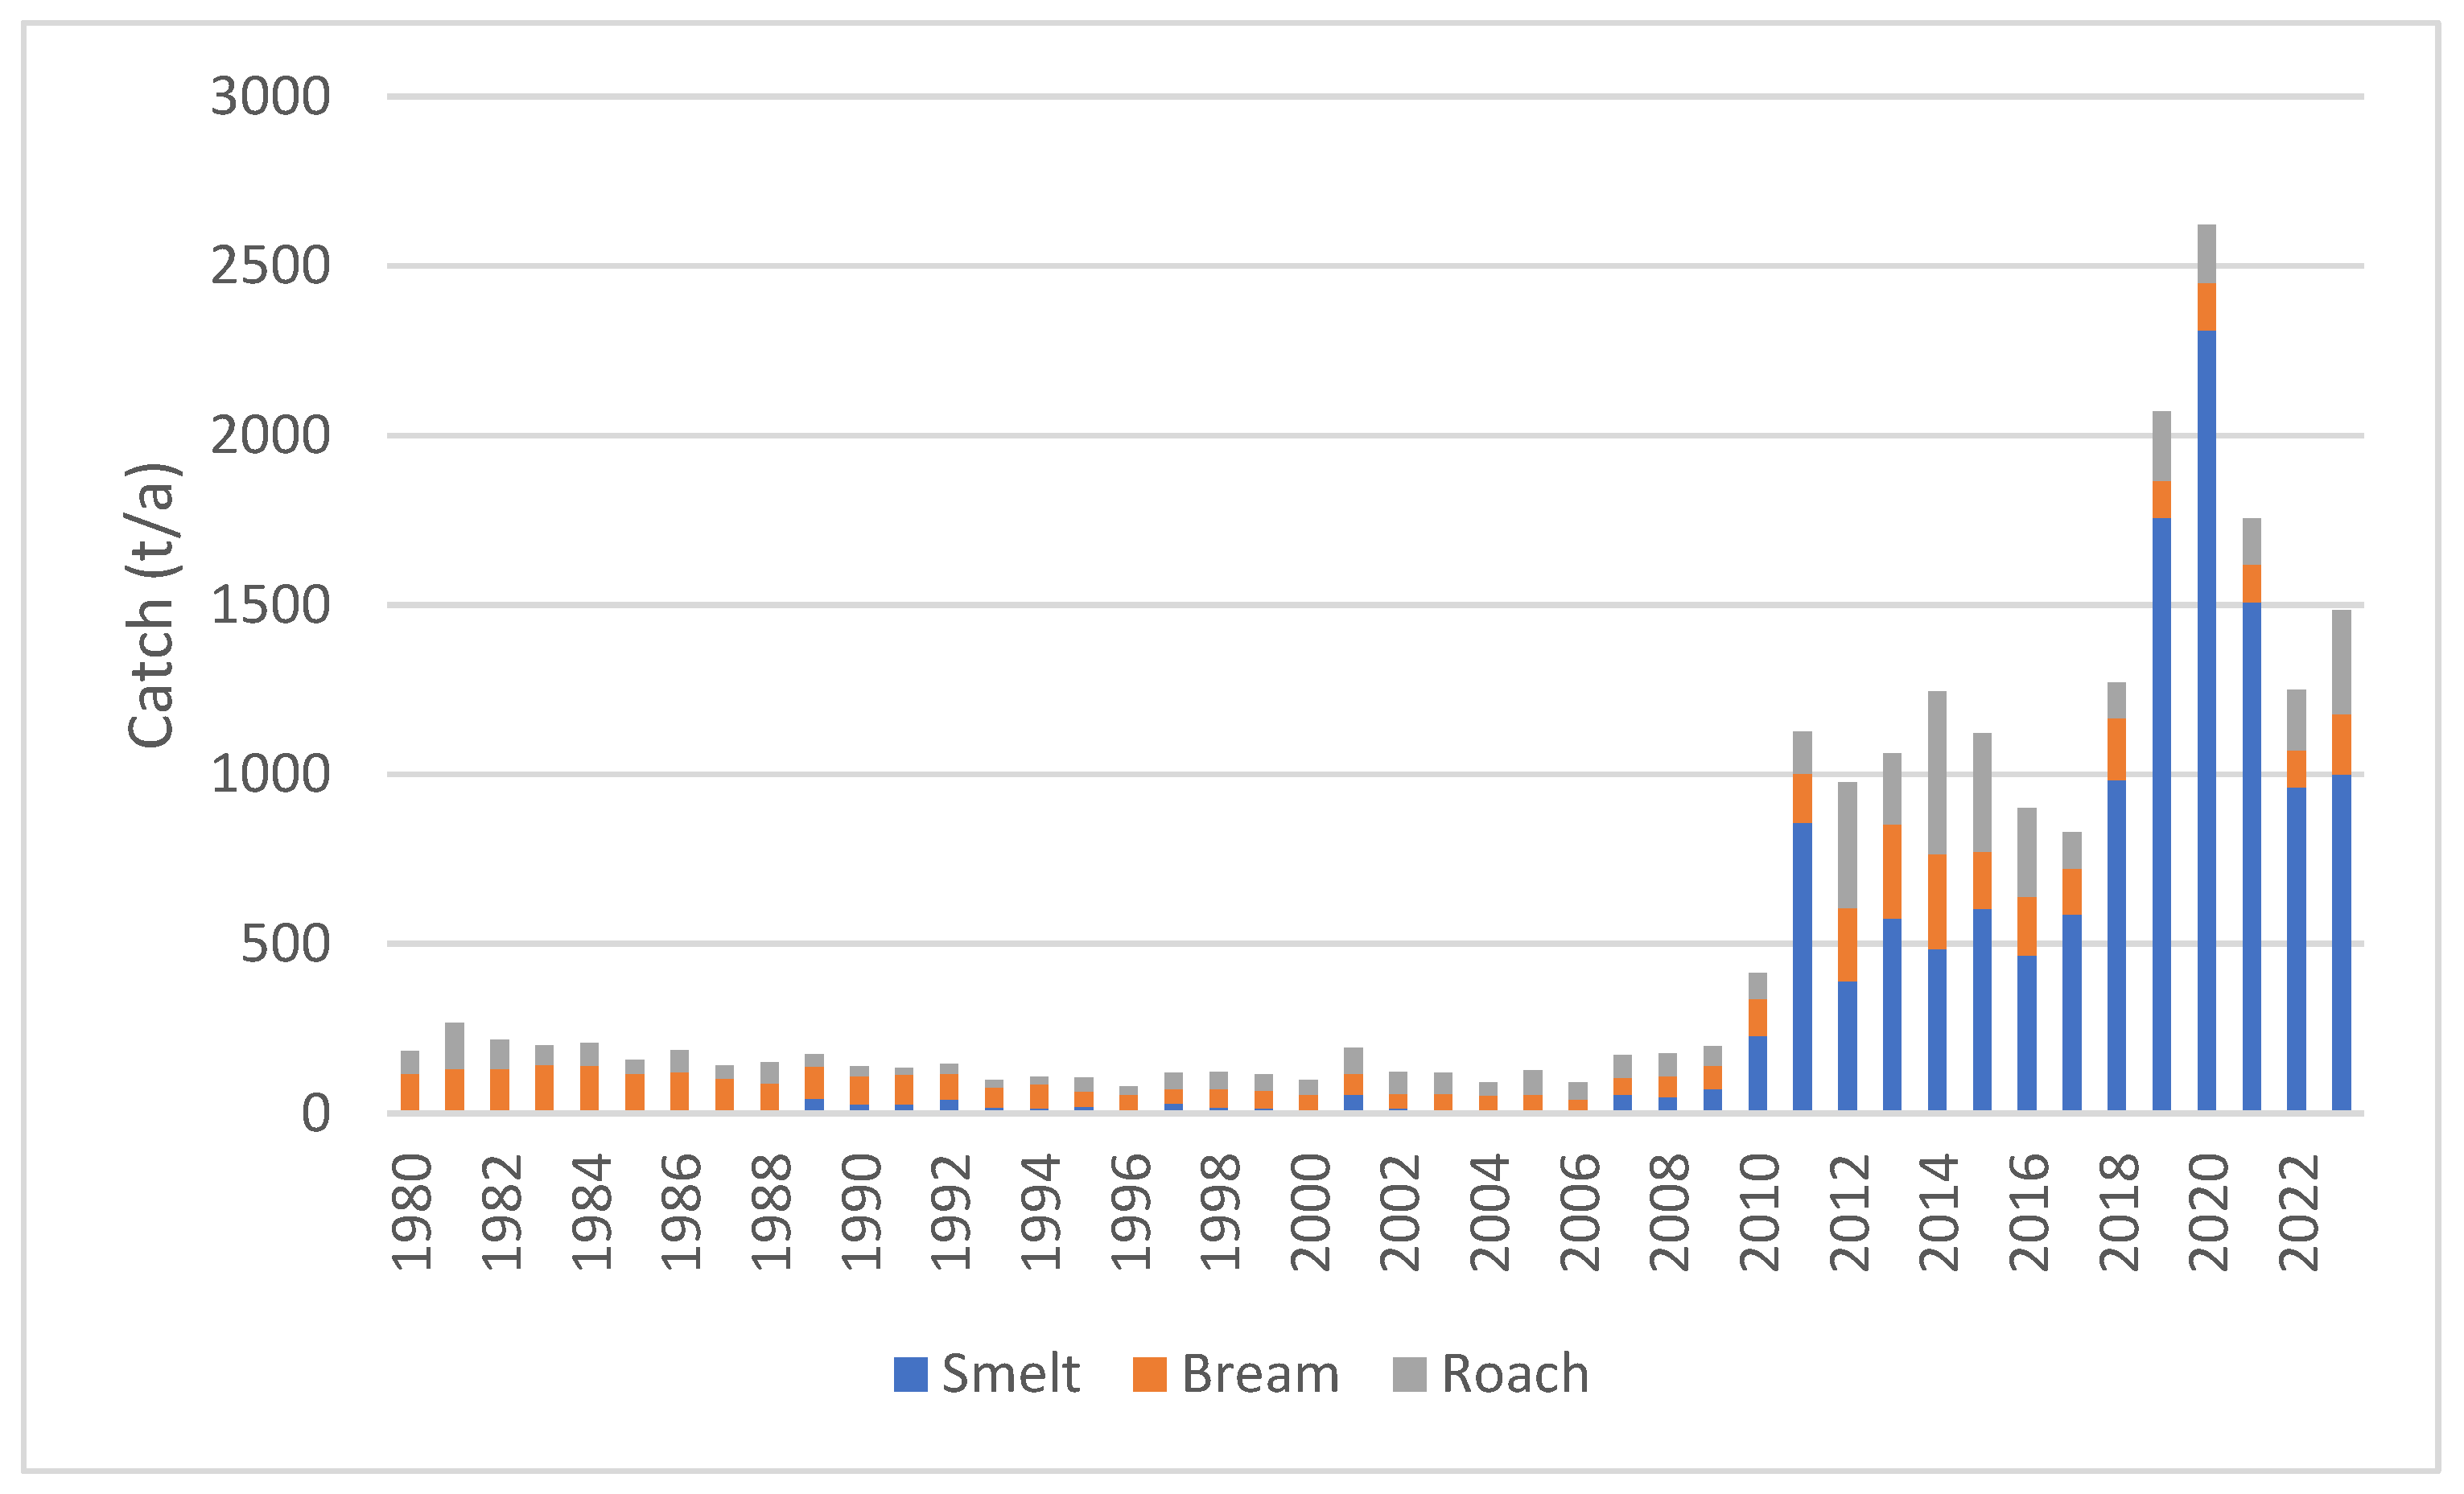
3.2. Fish Catches in the Archipelago Sea and Their Associated Phosphorus Contents

The total annual fish catch in the Archipelago Sea during the years 1998–2023 averaged 15,516.5 tons (SD: 4190.9; median: 14,754.5 tons; range: 9085–23,952 tons; Figure 2). On average, 73.1% of this catch consisted of commercially caught Baltic herring. The annual fish catch contained an average of 83.4 tons of phosphorus (SD: 20.8; median: 78.5 tons; range: 51.7–136.1 tons).
Over a longer period (1980–2023), the annual herring catch averaged 16,607 tons (SD 7689.9; median: 14,250.5 tons; minimum: 5105 tons; maximum: 30,651 tons; Figure 3). The amount of phosphorus contained in the annual Baltic herring catch during this period averaged 74.7 tons (SD: 34.6; median: 64.1 tons; range: 23.0–137.9 tons; Figure 2).
The Mann–Whitney U test was used to compare annual herring catches between 1980 and 1989 and 2020–2023. The results showed a significant difference between the periods (U = 40, p = 0.02). In the 1980s, average annual catches were over three times higher than in the 2020s: 27,217 t/year (SD = 2490) vs. 8690 t/year (SD = 3465).
Accordingly, over three times more phosphorus was removed through the herring catch during that time (122.5 t/a vs. 39 t/a).
There appears to be a statistically significant, linear, and negative relationship between the amount of phosphorus in the waters of the Archipelago Sea and the size of the herring stock: y = −1.11 x + 50.8. (95% CI for x: −1.65 to −0.56; p < 0.001; R2 = 0.304; Figure 4). In the regression analysis, the phosphorus reservoir was represented by the wintertime total phosphorus concentration of the entire water column at the Seili station. The size of the herring stock was approximated by its total catch.
The share of predatory fish in commercial fishery catches has fluctuated considerably between 1980 and 2023 (Figure 5). Notably, no cod has been caught since 1989. The annual catch of pikeperch was 400 tons in 2003 but began to decline thereafter, averaging only 92 tons in the 2020s. Similarly, the catch of pike has been decreasing since the early 2000s.
The commercial catches of species typically targeted in so-called management fishing (smelt, roach, and bream) remained modest until the early 2010s (Figure 6). During the 2010s, however, smelt catches increased rapidly, reaching a record high of 2311 tons in 2020. That year, the smelt catch removed 10.4 tons of phosphorus.
The total perch catch in the Archipelago Sea was highest at the beginning of the time series in 1998, estimated at 2234 tons, and lowest in 2010, at 516 tons (Figure 7). Over the entire period from 1998 to 2023, the average annual perch catch was approximately 1150 tons (SD: 500.6), of which 69% was caught by recreational fishers. The amount of phosphorus contained in the annual total perch catch during this period averaged 12.4 tons (SD: 5.4; median: 10.0 tons; range: 5.6–24.1 tons).
Based on the test fishing results, the perch stock was at its strongest in the early 2000s, with an average biomass per unit effort (BPUE) of 4723 g/net, (SD: 1131); the maximum was recorded in 2003 at 6334 g/net. During the years 2011–2023, perch biomass per unit effort (BPUE) averaged approximately 3300 g/net (SD: 718), which is about 30% lower than the average observed during 2002–2005 (Figure 8). The Mann–Whitney U test revealed a significant difference between the groups (U = 47, p = 0.015).

3.3. Internal Phosphorus Recycling of Herring Population

The annual food consumption of the 1+ age group and older was, on average, approximately 1.7 times higher in 1988 (characterized by strong growth and high yield) than in 2023 (poor growth, low yield; Figure 9). The mean specific consumption rate (consumption per unit weight per day) in 1988 was approximately 12% lower—0.018 g/g/day (1.8%)—compared to 0.021 g/g/day (2.1%) in 2023. The consumption-to-predator biomass ratios were 6.6 in 1988 and 7.6 in 2023.
Based on the 1988 herring catch in the Archipelago Sea (29,507 tons), the corresponding spawning stock biomass is estimated at 117,091 tons, and the total biomass at 174,598 tons. These estimates reflect the potential maximum size of the subpopulation and are not necessarily geographically limited to the Archipelago Sea region. In 1988, the spawning stock of Baltic herring was estimated to contain approximately 527 tons of phosphorus, while the total population biomass accounted for about 786 tons.
Correspondingly, based on the 2023 catch (7248 tons), the spawning stock biomass of Baltic herring in the Archipelago Sea is estimated at 17,465 tons, and the total biomass at 28,313 tons. Accordingly, in 2023, the spawning stock biomass was approximately 6.7 times lower and the total biomass 6.2 times lower than in 1988. The 2023 spawning stock was estimated to contain approximately 79 tons of phosphorus, while the total biomass accounted for about 127 tons.
Table 2 presents estimates produced by bioenergetic modeling for the phosphorus load (via excretion and egestion) released into seawater by different components of the Baltic herring stock—namely, the harvested portion, the spawning stock, and the total population—in the years 1988 and 2023. The estimates have been calculated separately for the period during which the herring are present in the Archipelago Sea and for the entire year.

3.4. Internal Phosphorus Recycling/Regeneration of Perch Population

The annual food consumption of perch of different ages ranged from 39 g to 416 g, with an average of 219 g (Figure 10).
The specific consumption rate (SCR) per unit increase in weight (g/g weight/a) was about 3.2 for 1- and 2-year-old perch but decreased to approximately 1 for 6-year-olds and older (Figure 11). The perch SCR per unit increase in growth (g/g growth/a) is much more consistent, with an average of 5.1. For Baltic herring, the SCR per unit increase in weight (g/g weight) is nearly 30% higher at 6.7.
The calculation based on the bioenergetic model indicated that not all input data were accurate, as perch appeared to accumulate more phosphorus than it received through its diet. This was particularly evident in the younger age groups (1–4), which feed on zooplankton and crustaceans. Therefore, I adjusted the input value for the phosphorus content of perch (originally 1.08%) to an estimated 0.7% for age groups 1–6. After this adjustment, the phosphorus budget became balanced.
The phosphorus load released into seawater by the simulated perch population in 1998 (biomass 10,600 t) through excretion and egestion was calculated to be 24.2 t/year. Approximately 56% of the phosphorus obtained from food is retained in the fish. The total perch stock contains up to 114 tons of phosphorus bound in biomass (assuming a phosphorus content of 1.08%), and the spawning stock contains 77 tons.

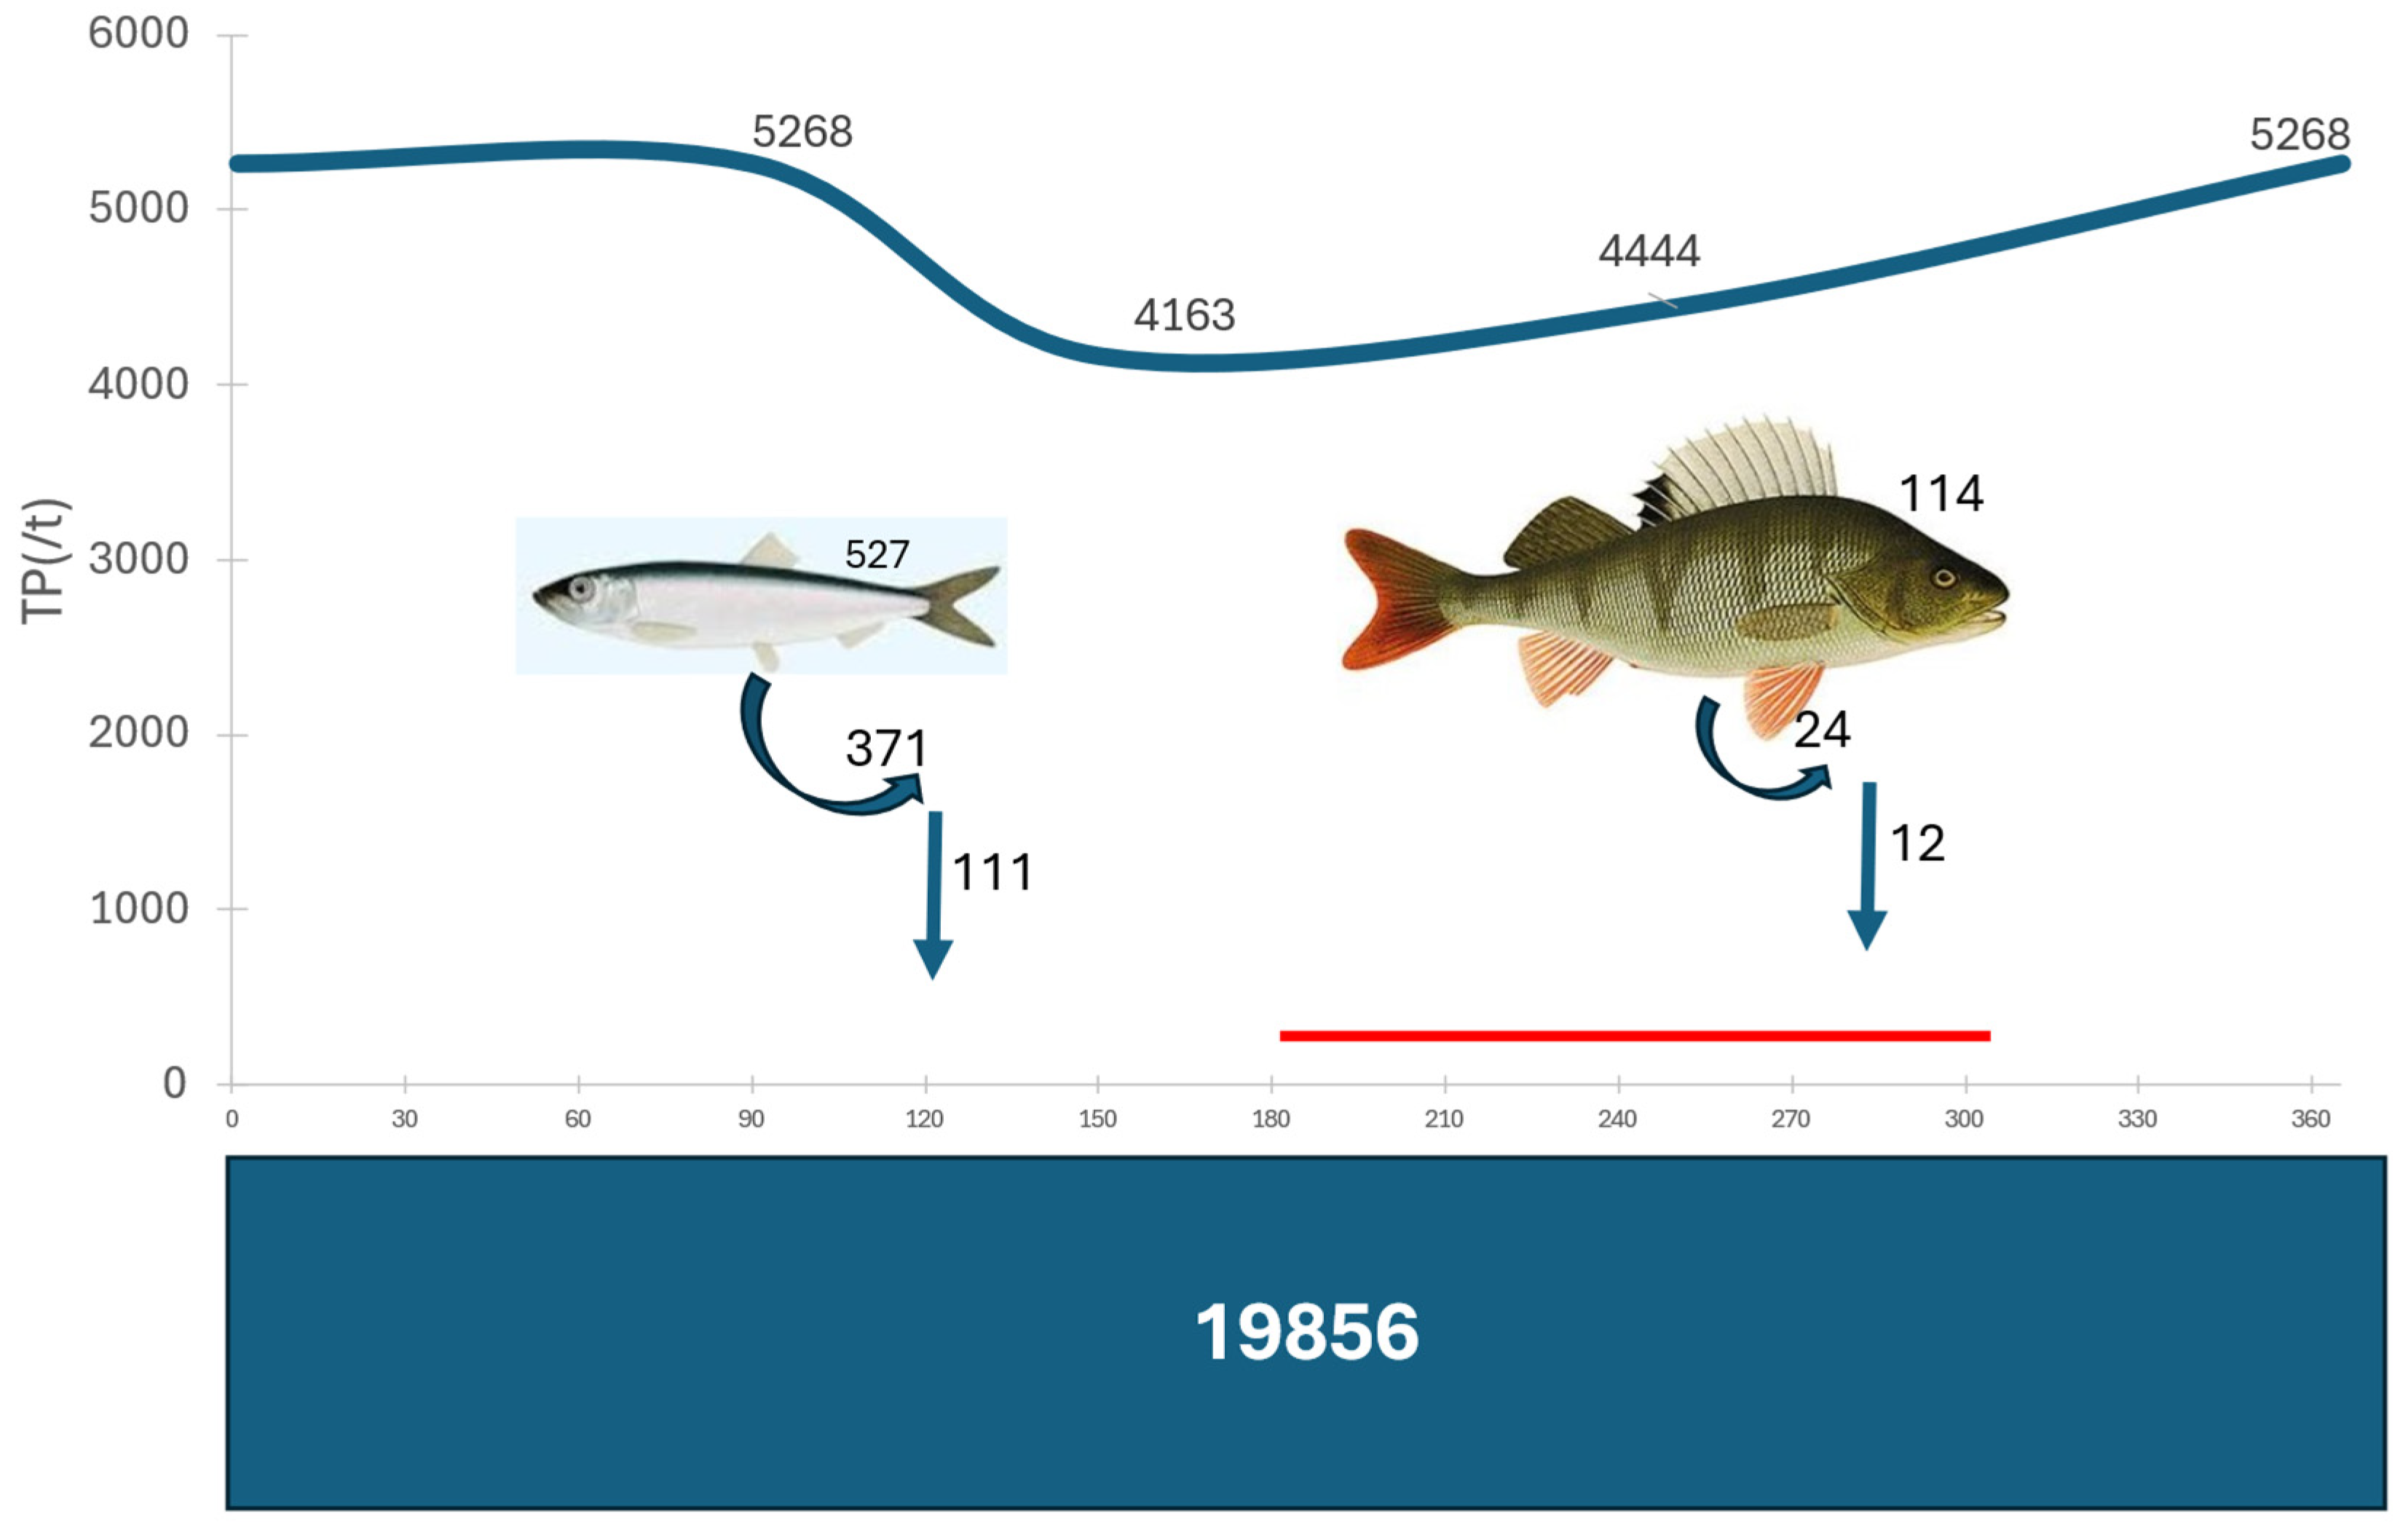
3.5. Generalized Phosphorus Budget of the Archipelago Sea

To support the situational analysis, I compiled a synthesis of results derived from various calculations and bioenergetic modeling approaches (Figure 12). The summary includes an estimate of the phosphorus stock in the water phase of the Archipelago Sea for the year 1988. This estimate is, on average, approximately 18% lower than the more detailed estimate made for 2023. For the phosphorus stock in the surface layer of the sediment, only a single estimate [19,20] was available. The herring stock estimate representing 1988 was selected, as both the stock and catches were at their peak during that time. Similarly, the perch stock estimate for 1998 was included based on the same rationale. In 2023, the spawning stock of herring was only about 15% of the 1988 level, and the phosphorus content of the stock followed a similar proportion. The amount of phosphorus cycled by the herring stock in 2023 was 23% of the 1988 value. The total perch catch in 2023 was approximately 41% of the 1998 catch, and a similar reduction is assumed here for both the phosphorus bound in the perch stock and the amount of phosphorus recycled by it.
The phosphorus bound in the herring stock biomass corresponds to approximately 10% of the phosphorus present in the water phase during winter (Figure 12). While the herring stock recycles phosphorus already present in the water column, part of this phosphorus is removed from circulation through excretion. Assuming a DIP:TP ratio of 0.7 in fish-excreted phosphorus [62], the herring stock could transfer approximately 111 tons of phosphorus from the water column to the surface sediment during its residence in the Archipelago Sea. This amount corresponds to roughly 10% of the phosphorus that settles to the bottom of the water column after the spring bloom. Most of the annual food consumption by herring occurs during the period when the stock is assumed to be absent from the Archipelago Sea (July 1 to November 1). In 1988, 33.6% of the herring stock’s total food consumption took place during its residence in the Archipelago Sea, whereas in 2023, the corresponding proportion was 43.2%.
The phosphorus content of the 1998 perch stock biomass was approximately 114 tons, corresponding to about 2% of the phosphorus in the water column (Figure 12). The total phosphorus excretion and egestion by the perch stock was approximately 24 tons, of which roughly half may have been bound in fecal matter. This amount is negligible compared to, for example, the winter phosphorus stock in the water column, representing approximately 0.2%.
The amount of phosphorus removed through fish harvest should be considered in relation to both the phosphorus stock in the surface layer of the sediment and that in the water column. As fish carcasses sink to the bottom, part of the phosphorus may remain in the surface sediment layer. Organic phosphorus is converted to inorganic form (DIP) in the sediment, which can return to the water column and become available for reuse. During the years 1998–2023, the total fish catch in the Archipelago Sea removed a maximum of 136 tons of phosphorus per year. Correspondingly, during 1980–2023, the herring catch alone is estimated to have removed approximately 139 tons of phosphorus annually. If this phosphorus had remained in the Archipelago Sea, it would have increased the combined phosphorus stock of the sediment and water column (as measured in winter 1988) by approximately 0.6%.

4. Discussion

The amount of nutrients stored and cycled by fish can vary across space and time, influenced by environmental and physiological factors. In addition to natural variation, fishing can alter nutrient storage and cycling by affecting fish biomass and community structure [63]. Based on the estimates presented earlier, fishing in the Archipelago Sea between 1980 and 2023 may have annually removed an amount of phosphorus equivalent to approximately 0.6% of the total phosphorus pool in the water column and the surface layer of the sediment. It is common to encounter comparisons in which the phosphorus content of fish catch is evaluated against only a portion of the external phosphorus load—typically riverine input alone. Using this approach, the phosphorus content of the fish catch would correspond on average approximately 24% to phosphorus load, range between 15 and 39% (fish catch P: mean 83,4 t, max. 136 t/year, min. 52 t/year vs. riverine input: 350 t/year [10]). However, such comparisons have limited biogeochemical relevance, as riverine phosphorus is first assimilated into the Archipelago Sea ecosystem and cycles through trophic levels before eventually becoming part of fish biomass. Its eutrophying effect—stimulating primary production—occurs earlier, so fish harvest does not offset the initial ecological impact.
To ensure comprehensive evaluation, assessments should incorporate total external phosphorus loading rather than riverine input alone. Model estimates by Lignell et al. [23] indicate an average load of 5870 t/a to the Archipelago Sea during 2006–2014. Relative to this, the amount of phosphorus removed via fish harvest would represent only about 1.4% of the total load. Even in this comparison, it is important to consider internal phosphorus cycling and that much of the phosphorus removed with fish originates outside the Archipelago Sea. The Baltic herring stock associated with the Archipelago Sea spends most of the summer feeding in the Bothnian Sea or the main basin of the Baltic Sea.
Between 1988 and 2023, the estimated phosphorus content in the spawning stock of Baltic herring in the Archipelago Sea decreased by approximately 85% and by around 84% in the total biomass. This substantial decline reflects a significant reduction in herring biomass in the Archipelago Sea, which may have implications for phosphorus cycling, food web dynamics, and nutrient retention within the marine ecosystem. According to Rajasilta et al. [64] the total lipid resources of spawning females have decreased by 40–50% during 1988–2019, and the mean length of the spawning population decreased from 21 to 16 cm due to the reduction in their growth rate. The decline in herring body condition is also clear in Figure S1 [23]. According to Casini et al. [65] the main predictor of herring and sprat conditions is the total abundance of clupeids. They found the strong negative correlation between clupeid abundance and total zooplankton biomass, which pointed to food competition and to top–down control by herring and sprat on common food resources.
Baltic sprat populations began to increase, likely by the 1990s at the latest, following the collapse of cod stocks due to poor recruitment and high fishing pressure. Sprat was the principal prey for cod in the Baltic Sea [66]. Herring and sprat, although showing some differences in feeding preferences, have a strong diet overlap during a large part of their ontogeny. The sprat spawning stock peaked in 1997. Although the stock has declined since then, it has remained significantly more abundant than in the 1980s. In the Archipelago Sea, sprat catches have remained low, averaging approximately 40 tons per year between 1980 and 2023. In the late 1990s, when the stock was at its strongest, catches averaged around 200 tons per year. The majority of sprat are found in the Baltic Sea main basin and the Bothnian Sea—areas where Baltic herring from the Archipelago Sea also migrate to feed. Casini et al. [66] provided evidence that temporal fluctuations in both sprat and herring conditions in all areas of the Baltic Proper can be linked to drastic variations in sprat density.
The summer build-up of fish biomass in the Archipelago Sea sequesters quantities of P, which is much greater than the amount removed annually via harvest. In 1988, the total Baltic herring stock in the Archipelago Sea was estimated to contain 786 tons of phosphorus, whereas by 2023, this amount had decreased to just 127 tons. However, this phosphorus pool can be considered a dynamic and partly transient component of the overall budget. According to bioenergetic model estimates of food consumption, in 1988 Baltic herring obtained approximately 66% of their annual food intake from areas outside the Archipelago Sea, and in 2023 about 57%. These figures may still be underestimated, as only indicative assessments exist regarding herring movements between the Archipelago Sea and their feeding grounds. Regardless, most of the phosphorus stored in Baltic herring originates from areas outside the Archipelago Sea. Baltic herring, thus, function as vectors of phosphorus transport, carrying a portion of the phosphorus pool that is partly removed through harvest and partly deposited into the Archipelago Sea during the spawning period.
The amount of phosphorus retained in the inner archipelago spawning areas via herring eggs can be estimated by assuming, for example, that half of the 1988 spawning stock biomass (117,091 tons) consisted of females (58,546 tons). Based on studies of Baltic herring eggs [67], the mass of the released eggs may amount to approximately 10% of the spawning stock biomass. If it is further assumed that 90% of the deposited eggs are washed off from the substrate, this would result in an estimated 5270 tons of non-viable egg mass remaining in the coastal zone. Assuming that the phosphorus content of herring eggs is like that of adult herring (0.45%), the estimated amount of phosphorus remaining in the coastal zone would be 23.7 tons. In 2023, the size of the Baltic herring spawning stock was estimated to be only about 15% of its 1988 level. The number of eggs deposited in the Archipelago Sea declined in proportion to the reduction in spawning stock size. According to studies by Puttonen [26], the phosphorus stock in the surface sediment of the southwestern inner archipelago zone (679 km2) might be approximately 2377 tons. The phosphorus input from herring eggs in 1988 would represent about 1% of this amount, but by 2023, only 1.5‰.
Fish contribute to phosphorus recycling in aquatic systems by excreting excess phosphorus, which can then be utilized by algae or other organisms. Fish-mediated nutrient recycling can alleviate phosphorus limitation in phytoplankton, but its impact depends on how fish regeneration rates compare to other phosphorus sources [63]. The total herring stock in the Archipelago Sea was estimated to be capable of recycling phosphorus at a maximum rate of 0.237 mg/m2/day (Table 2). This nutrient recycling is likely most significant in early summer, when rising water temperatures, the onset of primary production, and peak herring presence coincide in the Archipelago Sea. The estimated size of the Baltic herring stock at that time 1988 was 117,598 tons, or 18.4 g/m2, and the spawning stock was 117,019 tons, or 12.3 g/m2. These estimates are broadly consistent with findings from other studies, despite potentially appearing elevated. For instance, 18.4 g/m2 corresponds to 184 kg/ha, a value that is already considerable even in lacustrine systems. According to Thurow [68], the total fish biomass in the Baltic Sea increased from about 5 g/m2 in 1903 to 17–23 g/m2 during the period 1970–1990. Axenrot and Hansson [69] estimated stock spawning biomass (SSB) in ICES SD 27 during the years 1988–1989 to an average of 173,150 tons or about 10 g/m2.
Since no researched data is available, it is assumed here that approximately 30% of the estimated recycled phosphorus by herrings would be deposited to the seabed via fecal matter, at least temporarily (Figure 12). Consequently, the maximum amount of dissolved inorganic phosphorus (DIP) recycled by herring and retained in the water column would be approximately 0.17 mg/m2/day. Dissolved P contains all urinary P and a portion of fecal P that is soluble and therefore leaches from voided feces. DIP is bioavailable and can immediately fuel primary production. Egested nutrients are packaged into fecal pellets that sink below the surface layer and are recycled at greater depths, especially those from fish, which descend faster and deeper than marine snow or phytodetritus [63,70,71].
There is data available on the biomass of phytoplankton (see earlier VESLA, phytoplankton register) and zooplankton [72] in the Archipelago Sea, but not on the rates at which they recycle nutrients or similar processes. The phosphorus contained in plankton is essentially included in the phosphorus pool of the water column, but based on biomass data and concentration estimates, it can be separated from it to some extent. Based on data from the Seili monitoring station, the average phytoplankton biomass during the period April 1 to October 31 between 2001 and 2024 has been 1.58 mg L−1 (wet weight) (SD: 2.0; median: 0.75 mg L−1; range 0.009–10.5 mg L−1). Since the volume of the surface layer (0–10 m) of the Archipelago Sea has previously been estimated at 80.2 km3 [10], the mean phytoplankton biomass can be calculated as approximately 127,037 tons wet weight. If phytoplankton contains 0.08% phosphorus by wet weight [6], the average size of the instantaneous phosphorus pool of phytoplankton can be estimated at approximately 102 tons. This corresponds to approximately 1.8% of the estimated average total phosphorus pool in the entire water volume of the Archipelago Sea during the 2000s. According to (Rousi et al. [72], Figure 2), the average zooplankton biomass was approximately 1 g/m3 wet weight during the years 1980–1985 but had declined to around 0.2 g/m3 in the 2000s. The volume of the surface layer (0–20 m) is 131.5 km3, so in the 1980s the biomass of zooplankton in the Archipelago Sea averaged 131,500 tons (wet weight), and in the 2000s it was only 26,300 tons. Correspondingly, the amount of phosphorus contained in the zooplankton was 197 tons and 40 tons. In the 1980s, this accounted for approximately 4.4% of the estimated phosphorus pool in the water phase, and in the 2000s, 0.7%.
Griffiths [6] states that, in lake ecosystems, phosphorus turnover rates mediated by zooplankton (mg/m2/day) are approximately eight times higher than those mediated by fish, while turnover via phytoplankton may be up to 34 times greater. But fish could be more important as nutrient stores than plankton. In the Archipelago Sea dataset, the phosphorus bound in Baltic herring reached a maximum of 82.7 mg/m2 in 1988 and declined to 13.4 mg/m2 by 2023. Corresponding values for zooplankton were 20.7 mg/m2 in the 1980s and 4.2 mg/m2 in the 2020s. The phosphorus content of phytoplankton has remained probably around 10.7 mg/m2 during the 2000s. In the late 1990s, the maximum amount of phosphorus bound in perch biomass was about 12 mg/m2, whereas today it is estimated to be 30% lower (Figure 8), i.e., 8 mg/m2. Notably, there has been a significant shift in the relative proportions of phosphorus pools. In the 1980s and 1990s, the ratio of phosphorus bound in plankton to that in fish was approximately 1:3. However, in the 2020s, this ratio has shifted to about 1:1.4, indicating a remarkable change in the distribution of phosphorus between trophic levels.
A notable ecological change in the Archipelago Sea is the marked decline in zooplankton biomass, which began in the early 1990s and has persisted, decreasing by approximately 80% between the early 1980s and 2019 [72]. Concurrently, the estimated instantaneous total biomass of the herring stock has declined by as much as 84% from 1988 to 2023. However, it is important to note that herrings in the Archipelago Sea primarily forage elsewhere, namely in the Baltic Proper or the Bothnian Sea, where it competes for the same food resources as the sprat [65]. Rousi et al. [72] concluded that considerable biomass and functional biodiversity loss of the common mesozooplankton is likely driven by climatic factors. The surface water temperature of the Archipelago Sea has increased by approximately 0.5 °C per decade since the 1980s.
Steinkopf et al. [73] have emphasized eutrophication as a key driver of the observed changes in Baltic Sea food webs. Eutrophication and increased temperatures can lead to massive filamentous, N2-fixing cyanobacterial (FNC) blooms in coastal ecosystems with largely unresolved consequences for the mass and energy supply in food webs. Mesozooplankton adapts to not top–down controlled FNC blooms by switching diets from phytoplankton to microzooplankton, resulting in a directly quantifiable increase in its trophic position. If, in this process—known as trophic lengthening—mesozooplankton is transferred to higher trophic levels within the food web, the resulting energy loss could lead to substantial declines in fish biomass. A trend of this nature would have manifested in the Archipelago Sea, supported by evidence from observed changes in water quality parameters [10,11,14], zooplankton time series data [72], and variability in herring catches. Helminen [14] documented a significant increase in nitrogen-fixing cyanobacteria biomass in the inner archipelago over the past 15 years. Validation of this hypothesis necessitates further detailed investigation, particularly through the analysis of comprehensive phytoplankton time series encompassing the entire Archipelago Sea.
The Water Framework Directive mandates that the goal of water management is to achieve good ecological status in all water bodies by 2027. This directive highlights the urgent need to address nutrient pollution and implement effective measures against eutrophication, especially in areas with high nutrient loads and slow ecological recovery. It is generally assumed that reducing nutrient loads via catchment-area measures could significantly improve the condition of the Archipelago Sea [10]. Previous model analyses of the Archipelago Sea [3,14,23] have, however, concluded that achieving good ecological status in any sea area, nearby coastal region, or inner bay is not attainable through unilateral local actions within the drainage basin alone. Traditionally, major ecological concerns in the Baltic Sea include clean water availability and fisheries sustainability [74,75]. Although significant progress has been made in recent decades—such as greatly reducing toxic pollutant loads, halting further eutrophication by cutting nutrient emissions, and the recovery of the main Baltic cod stock [74]—eutrophication remains a problem, and quick solutions are unlikely.

5. Conclusions

The Baltic herring, the dominant planktivorous fish and the most abundant species by biomass in the Archipelago Sea, redistributes phosphorus within the Baltic Sea during its feeding migrations. This movement likely reduces its potential local impact on water quality, assuming such effects are significant. Reducing planktivorous fish has been used in lake restoration to increase zooplankton abundance and thereby reduce phytoplankton. A similar mechanism has been proposed for coastal waters; however, empirical data from the Archipelago Sea do not support this hypothesis. Over the past few decades, the biomass of the herring stock in the region has declined by approximately 80%. Concurrently, zooplankton abundance has also decreased by around 80%. During the same period (1983–2024), chlorophyll concentrations—serving as a proxy for algal production—have increased by 103.7% in the inner archipelago zone of the Archipelago Sea [11].
Contribution of fish to phosphorus turnover in marine ecosystems is small; plankton dominates the recycling of this nutrient because of the higher turnover rates of planktonic organisms relative to fishes. Moreover, both planktivorous fish and their prey recycle nutrients that are already present in the water column. The removal of nutrients bound in fish biomass has no direct effect on the eutrophication trajectory of the Archipelago Sea. Eutrophication is primarily governed by a combination of external and internal ecosystem factors, particularly the availability of key nutrients—most notably phosphorus but also nitrogen [10,11,14]. If fish in the Archipelago Sea were not harvested, they would eventually die and sink to the seafloor, where their nutrients would either contribute to sediment phosphorus reserves or be utilized by benthic organisms.
But if phosphorus, once removed with the wild fish catch, is recycled through aquaculture-raised fish in marine environments, a portion will inevitably return to phytoplankton. For phytoplankton production, this phosphorus is effectively new; the original source of usable phosphorus is irrelevant. Therefore, using feed made from Baltic Sea fish in aquaculture is not nutrient-neutral but instead contributes to the sea’s nutrient load.

Supplementary Materials

The following supporting information can be downloaded at: https://www.mdpi.com/article/10.3390/fishes10070328/s1, Figure S1: Growth data of herring in the Archipelago Sea in 1988 and in 2023, used as the baseline, consisted of end-of-year weights (g) for different age groups (data source: [23]).; Figure S2; Temperature data for herring. The blue dots represent the averages for the years 1985–89 and were used as the baseline data for herring in 1988. Similarly, the red dots represent the averages for the years 1999–2023 and were used as the baseline data for 2023; Figure S3: Growth data of perch in the Archipelago Sea, used as the baseline, consisted of end-of-year weights (g) for different age groups (data sources: [28,45]); Figure S4: Temperature data for perch. The blue dots represent the averages for the years 1991–00 and were used as the baseline data for perch in 1998; Figure S5: Proportion of zooplankton, insects, etc. and fish in diet of perch in the Archipelago Sea. Data modified from Jacobsen et al. [48].

Funding

This research was funded by The Ministry of Environment. Support for the implementation of the project is granted under the Supporting Water and Environmental Management (decision 3 September 2024, VN/19624/2024 757/2021).

Data Availability Statement

Data supporting the reported results can be found at https://www.syke.fi/en/environmental-data/maps-and-information-services/open-environmental-information-systems, accessed on 31 May 2025.

Acknowledgments

This study was conducted at the Centre for Economic Development, Transport, and the Environment, Turku (VARELY). The monitoring data were collected from databases in the VARELY and the Finnish Environment Institute (SYKE). The catch data for various fish species has been obtained from the official statistics produced by the Natural Resources Institute Finland (LUKE). Special thanks to Chief Inspector Titta Lahtinen for the cooperation.

Conflicts of Interest

The author declares no conflicts of interest.

References

  1. Smith, Y.H.; Schindler, D.W. Eutrophication science: Where do we go from here? Trends Ecol. Evol. 2009, 24, 201–207. [Google Scholar] [CrossRef] [PubMed]
  2. Laamanen, M.; Suomela, J.; Ekebom, J.; Korpinen, S.; Paavilainen, P.; Lahtinen, T.; Nieminen, S.; Hernberg, A. Suomen merenhoitosuunnitelman toimenpideohjelma vuosille 2022–2027. Ympäristöministeriön Julk. 2021, 30. (In Finnish) [Google Scholar]
  3. Helminen, H. The Role of Internal Phosphorus Loading in the Archipelago Sea Ecological Status. Water 2025, 17, 248. [Google Scholar] [CrossRef]
  4. Berninger, K.; Fleming, V.; Huttunen, M.; Iho, A.; Niskanen, L.; Kuosa, H.; Piiparinen, J.; Räike, A.; Salo, M.; Sarkkola, S.; et al. Rannikkovesille Tuntuvia Kuormitusvähennyksiä; Policy Brief No. 26; Valtioneuvoston Selvitys-ja Tutkimustoiminta: Helsinki, Finland, 2023. (In Finnish) [Google Scholar]
  5. Available online: https://www.ely-keskus.fi/saaristomeri/saaristomeri-ohjelma (accessed on 1 June 2025). (In Finnish).
  6. Reynolds, C.S. The development of perceptions of aquatic eutrophication and its control. Int. J. Ecohydrol. Hydrobiol. 2003, 3, 149–163. [Google Scholar]
  7. Griffits, D. The direct contribution of fish to lake phosphorus cycles. Ecol. Freshw. Fish 2006, 15, 86–95. [Google Scholar] [CrossRef]
  8. Hart, R.C.; Harding, W.R. Impacts of fish on phosphorus budget dynamics of some SA reservoirs: Evaluating prospects of ‘bottom up’ phosphorus reduction in eutrophic systems through fish removal (biomanipulation). Water SA 2015, 41, 4. [Google Scholar] [CrossRef]
  9. Vanni, M.J.; Boros, G.; McIntyre, P.B. When are fish sources vs. sinks of nutrients in lake ecosystems? Ecology 2013, 94, 2195–2206. [Google Scholar] [CrossRef]
  10. Available online: https://balticwaters.org/en/can-you-fish-nutrients-out-of-the-baltic-sea/ (accessed on 1 June 2025).
  11. Helminen, H.; Inkala, A. Modelled Water and Phosphorus Transports in the Archipelago Sea and through the Åland Sea and Northern Baltic Sea and Their Links to Water Quality. J. Mar. Sci. Eng. 2024, 12, 1252. [Google Scholar] [CrossRef]
  12. Helminen, H. The Effects of Reduced Wastewater Load in the Marine Area off Turku in the Archipelago Sea During the Period 1965–2025. Water 2025, 17, 1251. [Google Scholar] [CrossRef]
  13. Deslauriers, D.; Chipps, S.R.; Breck, J.E.; Rice, J.A.; Madenjian, C.P. Fish Bioenergetics 4.0: An R-based modeling application. Fisheries 2017, 42, 586–596. [Google Scholar] [CrossRef]
  14. Hansen, M.J.; Boisclair, D.; Brandt, S.B.; Hewett, S.W.; Kitchell, J.F.; Lucas, M.C.; Ney, J.J. Applications of bioenergetics models to fish ecology and management: Where do we go from here? Trans. Am. Fish. Soc. 1993, 122, 1019–1030. [Google Scholar] [CrossRef]
  15. Rolff, C.; Elfwing, T. Increasing nitrogen limitation in the Bothnian Sea, potentially caused by inflow of phosphate-rich water from the Baltic Proper. Ambio 2015, 44, 601–611. [Google Scholar] [CrossRef] [PubMed]
  16. Eilola, K.; Meier, H.E.M.; Almroth, E. On the dynamics of oxygen, phosphorus and cyanobacteria in the Baltic Sea; A model study. J. Mar. Syst. 2009, 75, 163–184. [Google Scholar] [CrossRef]
  17. Nausch, M.; Achterberg, E.P.; Bach, L.T.; Brussaard, C.P.D.; Crawfurd, K.J.; Fabian, J.; Riebesell, U.; Stuhr, A.; Unger, J.; Wannicke, N. Concentrations and Uptake of Dissolved Organic Phosphorus Compounds in the Baltic Sea. Front. Mar. Sci. 2018, 5, 386. [Google Scholar] [CrossRef]
  18. Andersson, A.; Höglander, H.; Karlsson, C.; Huseby, S. Key role of phosphorus and nitrogen in regulating cyanobacterial community composition in the northern Baltic Sea. Estuar. Coast Shelf Sci. 2015, 164, 161–171. [Google Scholar] [CrossRef]
  19. Becker, S.; Aoyama, M.; Woodward, E.M.S.; Bakker, K.; Coverly, S.; Mahaffey, C.; Tanhua, T. GO-SHIP Repeat Hydrography Nutrient Manual: The Precise and Accurate Determination of Dissolved Inorganic Nutrients in Seawater, Using Continuous Flow Analysis Methods. Front. Mar. Sci. 2020, 7, 581790. [Google Scholar] [CrossRef]
  20. SFS-EN ISO/IEC 17025:2017; General Requirements for the Competence of Testing and Calibration Laboratories. ISO: Geneva, Switzerland, 2017.
  21. SFS 3026; Determination of Phosphorus in Water. Finnish Standards Association SFS: Helsinki, Finland, 1986; 11p.
  22. Lignell, R.; Miettunen, E.; Tuomi, L.; Ropponen, J.; Kuosa, H.; Attila, J.; Puttonen, I.; Lukkari, K.; Peltonen, H.; Lehtoranta, J.; et al. Rannikon Kokonaiskuormitusmalli: Ravinnepäästöjen Vaikutus Veden Tilaan—Kehityshankkeen Loppuraportti (XI 2015–VI 2018); Finnish Environment Institute: Helsinki, Finland, 2019. (In Finnish) [Google Scholar]
  23. Lignell, R.; Miettunen, E.; Kuosa, H.; Ropponen, J.; Tuomi, L.; Puttonen, I.; Lukkari, K.; Korppoo, M.; Huttunen, M.; Kaurila, K.; et al. Modeling how eutrophication in northern Baltic coastal zone is driven by new nutrient inputs, internal loading, and 3D hydrodynamics. J. Mar. Syst. 2025, 249, 104049. [Google Scholar] [CrossRef]
  24. Helminen, H.; Juntura, E.; Koponen, J.; Laihonen, P.; Ylinen, H. Assessing of long-distance background nutrient loading to the Archipelago Sea, northern Baltic with a hydrodynamic model. Environ. Model. Softw. 1998, 13, 511–518. [Google Scholar] [CrossRef]
  25. Suomela, J. Kirkkaasta Sameaan. Meren Kuormitus ja tila Saaristomerellä ja Ahvenanmaalla; Varsinais-Suomen Elinkeino-, Liikenne- ja Ympäristökeskuksen Julkaisuja: Turku, Finland, 2011; Volume 6. (In Finnish) [Google Scholar]
  26. Puttonen, I.; Mattila, J.; Jonsson, P.; Karlsson, O.M.; Kohonen, T.; Kotilainen, A.; Lukkari, K.; Malmaeus, J.M.; Rydin, E. Distribution and estimated release of sediment phosphorus in the northern Baltic Sea archipelagos. Estuar. Coast. Shelf Sci. 2014, 145, 9–21. [Google Scholar] [CrossRef]
  27. Puttonen, I. Phosphorus in the Sediments of the Northern Baltic Sea Archipelagos—Internal P Loading and Its Impact on Eutrophication. Ph.D. Thesis, Åbo Akademi University, Turku, Finland, 2017. Available online: https://www.doria.fi/handle/10024/131068 (accessed on 31 May 2025).
  28. Official Statistics of Finland (OSF). Commercial Marine Fishing [Online Publication]; Natural Resources Institute Finland: Helsinki, Finland, 2025; Available online: https://www.luke.fi/en/statistics/commercial-marine-fishery (accessed on 31 May 2025).
  29. Official Statistics of Finland (OSF). Recreational Fishing [Online Publication]; Natural Resources Institute Finland: Helsinki, Finland, 2025; Available online: https://www.luke.fi/en/statistics/recreational-fishing (accessed on 31 May 2025).
  30. ICES. Baltic Fisheries Assessment Working Group (WGBFAS). ICES Scientific Reports; ICES: Toronto, ON, Canada, 2024; 628p. [Google Scholar] [CrossRef]
  31. Available online: https://helcom.fi/wp-content/uploads/2019/08/Guidelines-for-Coastal-fish-Monitoring-of-HELCOM.pdf (accessed on 1 June 2025).
  32. ICES. Baltic Fisheries Assessment Working Group (WGBFAS). ICES Scientific Reports; ICES: Toronto, ON, Canada, 2022; 659p. [Google Scholar] [CrossRef]
  33. Rajasilta, M. Relationship between food, fat, sexual maturation and spawning time of Baltic herring (Clupea harengus membras) in the Archipelago Sea. Can. J. Fish. Aquat. Sci. 1992, 49, 644–654. [Google Scholar] [CrossRef]
  34. Rajasilta, M.; Eklund, J.; Hänninen, J.; Kurkilahti, M.; Kääriä, J.; Rannikko, P.; Soikkeli, M. Spawning of herring (Clupea harengus membras L.) in the Archipelago Sea. ICES J. Mar. Sci. 1993, 50, 233–246. [Google Scholar] [CrossRef]
  35. Kokkonen, E.; Heikinheimo, O.; Pekcan-Hekim, Z.; Vainikka, A. Effects of water temperature and pikeperch (Sander lucioperca) abundance on the stock–recruitment relationship of Eurasian perch (Perca fluviatilis) in the northern Baltic Sea. Hydrobiologia 2019, 841, 79–94. [Google Scholar] [CrossRef]
  36. Setälä, J.; Heikinheimo, O.; Raitaniemi, J.; Saarni, K. Verkon solmuvälin suurentamisen vaikutus Saaristomeren ammattikalastuksen kuha-ja ahvensaaliin arvoon. Kala-Ja Riistaraportteja 2003, 297. (In Finnish) [Google Scholar]
  37. Chang, W.; Cheng, J.; Allaire, J.; Xie, Y.; McPherson, J. Shiny: Web Application Framework for R, R package version 0.12.0; Shiny: Wellington, New Zealand, 2015; Available online: http://CRAN.R-project.org/package=shiny (accessed on 1 June 2025).
  38. R Core Team. R: A Language and Environment for Statistical Computing; R Foundation for Statistical Computing: Vienna, Austria, 2015. [Google Scholar]
  39. Rudstam, L.G. Exploring the dynamics of herring consumption in the Baltic: Applications of an energetic model of fish growth. Kiel. Meeresforsch Sonderh. 1988, 6, 312–322. [Google Scholar]
  40. Karås, P.; Thoresson, G. An application of a bioenergetics model to Eurasian Perch (Perca fluviatilis L.). J. Fish Biol. 1992, 41, 217–230. [Google Scholar] [CrossRef]
  41. Mäkinen, T. (Ed.) Voidaanko Kalastuksella Vähentää Kalankasvatuksen Ravinnekuormaa? Kalankasvatuksen Nettokuormitusjärjestelmän Esiselvitys; RKTL Selvityksiä; Riista-ja Kalatalouden Tutkimuslaitos: Helsinki, Finland, 2008; Volume 2. (In Finnish) [Google Scholar]
  42. Rajasilta, M.; Hänninen, J.; Laaksonen, L.; Suomela, J.-P.; Vuorinen, I.; Mäkinen, K. Influence of environmental conditions, population density, and prey type on the lipid content in Baltic herring (Clupea harengus membras) from the northern Baltic Sea. Can. J. Fish. Aquat. Sci. 2018, 49, 644–654. [Google Scholar] [CrossRef]
  43. Rajasilta, M.; Hänninen, J.; Karpela, T.; Mäkinen, K.; Ollennu-Chuasam, P.; Sahlstén, J.; Suomela, J.-P. Silakan rasvapitoisuuden ja rasvojen laadun ajallinen ja alueellinen vaihtelu Saaristomerellä. SEILI Archipel. Res. Inst. Publ. 2022, 9. (In Finnish) [Google Scholar]
  44. Available online: https://fineli.fi/fineli/fi/elintarvikkeet/800 (accessed on 1 June 2025).
  45. Hjerne, O.; Hansson, S. The role of fish and fisheries in Baltic Sea nutrient dynamics. Limnol. Oceanogr. 2002, 47, 1023–1032. [Google Scholar] [CrossRef]
  46. Ruohonen, K.; Vielma, J.; Grove, D.J. Comparison of nutrient losses into the water from rainbow trout culture based on fresh Baltic herring, moist and dry diets. Aquac. Int. 1998, 6, 441–450. [Google Scholar] [CrossRef]
  47. Möllmann, C.; Kornilovs, G.; Fetter, M.; Köster, F.W. Feeding ecology of central Baltic Sea herring and sprat. J. Fish Biol. 2004, 65, 1563–1581. [Google Scholar] [CrossRef]
  48. Flinkman, J.; Vuorinen, I.; Aro, E. Planktivorous Baltic herring (Clupea harengus) prey selectively on reproducing copepods and cladocerans. Can. J. Fish. Aquat. Sci. 1992, 49, 73–77. [Google Scholar] [CrossRef]
  49. Bachiller, E.; Utne, K.R.; Jansen, T.; Huse, G. Bioenergetics modeling of the annual consumption of zooplankton by pelagic fish feeding in the Northeast Atlantic. PLoS ONE 2018, 13, e0190345. [Google Scholar] [CrossRef] [PubMed]
  50. Walve, J.; Larsson, U. Carbon, nitrogen and phosphorus stoichiometry of crustacean zooplankton in the Baltic Sea: Implications for nutrient recycling. J. Plankton Res. 1999, 21, 2309–2321. [Google Scholar] [CrossRef]
  51. Helminen, H.; Sarvala, J.; Hirvonen, A. Growth and food consumption of vendace (Coregonus albula (L.)) in Lake Pyhäjärvi, SW Finland: A bioenergetics modeling analysis. Hydrobiologia 1990, 200, 511–522. [Google Scholar] [CrossRef]
  52. Tarvainen, M.; Sarvala, J.; Helminen, H. The role of phosphorus release by roach (Rutilus rutilus (L.)) in the water quality changes of a biomanipulated lake. Freshw. Biol. 2002, 47, 2325–2336. [Google Scholar] [CrossRef]
  53. Olin, M.; Veneranta, L. Merenkurkun Ahvenkantojen Rakenne ja Kalastuksen Vaikutukset; Luonnonvara-ja biotalouden tutkimus, Luonnonvarakeskus: Helsinki, Finland, 2020; Volume 94, 42p. (In Finnish) [Google Scholar]
  54. Schreckenbach, K.; Knösche, R.; Ebert, K. Nutrient and energy content of freshwater fishes. J. Appl. Ichthyol. 2001, 17, 142–144. [Google Scholar] [CrossRef]
  55. Jacobson, P.; Bergström, U.; Eklöf, J. Size-dependent diet composition and feeding of Eurasian perch (Perca fluviatilis) and northern pike (Esox lucius) in the Baltic Sea. Boreal Environ. Res. 2019, 24, 137–153. [Google Scholar]
  56. Chipps, S.R.; Bennett, D.H. Evaluation of Mysis bioenergetic model. J. Plankton Res. 2002, 24, 77–82. [Google Scholar] [CrossRef]
  57. Lappalainen, A.; Rask, M.; Koponen, H.; Vesala, S. Relative abundance, diet and growth of perch (Perca fluviatilis) and roach (Rutilus rutilus) at Tvärminne, northern Baltic Sea, in 1975 and 1997: Responses to eutrophication? Boreal Environ. Res. 2001, 6, 107–118. [Google Scholar]
  58. Hovel, R.A.; Beauchamp, D.A.; Hansen, A.G.; Sorel, M.H. Development of a Bioenergetics Model for the Threespine Stickleback. Trans. Am. Fish. Soc. 2015, 144, 1311–1321. [Google Scholar] [CrossRef]
  59. Lee, V.A.; Johnson, T.B. Development of a Bioenergetics Model for the Round Goby (Neogobius melanostomus). J. Great Lakes Res. 2005, 31, 125–134. [Google Scholar] [CrossRef]
  60. Karjalainen, J.; Miserque, D.; Huuskonen, H. The estimation of food consumption in larval and juvenile fish: Experimental evaluation of bioenergetics models. J. Fish Biol. 1997, 51 (Suppl. A), 39–51. [Google Scholar] [CrossRef]
  61. Pennuto, C.M.; Mehler, K.; Weidel, B.; Lantry, B.F.; Bruestle, E. Dynamics of the seasonal migration of Round Goby (Neogobius melanostomus, Pallas 1814) and implications for the Lake Ontario food web. Ecol. Freshw. Fish 2021, 30, 151–161. [Google Scholar] [CrossRef]
  62. Vanni, M. Nutrient Cycling by Animals in Freshwater Ecosystems. Annu. Rev. Ecol. Syst. 2002, 33, 341–370. [Google Scholar] [CrossRef]
  63. Mézo, P.M.; Guiet, J.; Scherrer, K.; Bianchi, D.; Galbrait, E. Global nutrient cycling by commercially targeted marine fish. Biogeosci. Discuss. 2022, 19, 2537–2555. [Google Scholar] [CrossRef]
  64. Rajasilta, M.; Mäkinen, K.; Ruuskanen, S.; Hänninen, J.; Laine, P. Long-Term Data Reveal the Associations of the Egg Quality with Abiotic Factors and Female Traits in the Baltic Herring Under Variable Environmental Conditions. Front. Mar. Sci. 2021, 8, 698480. [Google Scholar] [CrossRef]
  65. Casini, M.; Cardinale, M.; Hjelm, J. Inter-annual variation in herring, Clupea harengus, and sprat, Sprattus sprattus, condition in the central Baltic Sea: What gives the tune? OIKOS 2006, 112, 638–650. [Google Scholar] [CrossRef]
  66. Casini, M.; Kornilovs, G.; Cardinale, M.; Möllmann, C.; Grygiel, W.; Jonsson, P.; Raid, T.; Flinkman, J.; Feldman, V. Spatial and temporal density dependence regulates the condition of central Baltic Sea clupeids: Compelling evidence using an extensive international acoustic survey. Popul. Ecol. 2011, 53, 511–523. [Google Scholar] [CrossRef]
  67. Laine, P.; Rajasilta, M. Changes in the reproductive properties of Baltic herring females during the spawning season. Fish. Res. 1998, 36, 67–73. [Google Scholar] [CrossRef]
  68. Thurow, F. Estimation of the total fish biomass in the Baltic Sea during the 20th century. ICES J. Mar. Sci. 1997, 54, 444–461. [Google Scholar] [CrossRef]
  69. Axenrot, T.; Hansson, S. Predicting herring recruitment from young-of-the-year densities, spawning stock biomass, and climate. Limnol. Oceanogr. 2003, 48, 1716–1720. [Google Scholar] [CrossRef]
  70. Wotton, R.S.; Malmqvist, B. Feces in Aquatic Ecosystems: Feeding animals transform organic matter into fecal pellets, which sink or are transported horizontally by currents; these fluxes relocate organic matter in aquatic ecosystems. BioScience 2001, 51, 537–544. [Google Scholar] [CrossRef]
  71. Turner, J.T. Zooplankton fecal pellets, marine snow, phytodetritus and the ocean’s biological pump. Prog. Oceanogr. 2015, 130, 205–248. [Google Scholar] [CrossRef]
  72. Rousi, H.; Fält-Nardman, J.; Niemelä, P.; Hänninen, J. Changes in Atlantic climatic regulation mechanisms that underlie mesozooplankton biomass loss in the northern Baltic Sea. Heliyon 2024, 10, e31268. [Google Scholar] [CrossRef]
  73. Steinkopf, M.; Krumme, U.; Schulz-Bull, D.; Wodarg, D.; Loick-Wilde, N. Trophic lengthening triggered by filamentous, N2-fixing cyanobacteria disrupts pelagic but not benthic food webs in a large estuarine ecosystem. Ecol. Evol. 2024, 14, e11048. [Google Scholar] [CrossRef]
  74. Elmgren, R.; Blenckner, T.; Andersson, A. Baltic Sea management: Successes and failures. Ambio 2015, 44 (Suppl. S3), 335–344. [Google Scholar] [CrossRef]
  75. Blenckner, T.; Möllmann, C.; Stewart Lowndes, J.; Griffiths, J.R.; Campbell, E.; De Cervo, A.; Belgrano, A.; Boström, C.; Fleming, V.; Frazier, M.; et al. The Baltic Health Index (BHI): Assessing the social–Ecological status of the Baltic Sea. People Nat. 2021, 3, 359–375. [Google Scholar] [CrossRef]
Figure 1. Map of the Archipelago Sea and the locations of water quality monitoring stations. The blue line indicates the boundary of the Archipelago Sea. Water quality observation stations are marked on the map with green circles and labeled. Square 29 is a statistical unit defined by ICES, and within it, the smaller squares 50, 51, and 52 are national units. Subsquare 47 belongs to ICES square 30, but for the purposes of this context, it is considered part of the Archipelago Sea.
Fishes 10 00328 g001
Figure 2. Total fish catch (recreational and commercial) in the Archipelago Sea during the period 1998–2023.
Fishes 10 00328 g002
Figure 3. Commercial Baltic herring catch in the Archipelago Sea in 1980–2023 and the amount of phosphorus removed with it (right y-axis).
Fishes 10 00328 g003
Figure 4. The wintertime (1 Jan–31 Mar) average total phosphorus concentration of the entire water column (0–50 m) at the Seili station vs. commercial Baltic herring catch in the Archipelago Sea in 1984–2023. The red line indicates the relationship between total phosphorus concentration (µg/L) and Baltic herring catch (t/year) (p < 0.001, R2 = 0.3).
Fishes 10 00328 g004
Figure 5. The share of predatory fish in commercial fishery catches in the Archipelago Sea in 1980–2023.
Fishes 10 00328 g005
Figure 6. The share of smelt, bream, and roach in commercial fishery catches in the Archipelago Sea in 1980–2023.
Fishes 10 00328 g006
Figure 7. Total perch catch in the Archipelago Sea during the period 1998–2023.
Fishes 10 00328 g007
Figure 8. Perch catch (BPUE, g/net) of test fishing in the Archipelago Sea during the period 2000–2023. The red line indicates the moving average in the BPUE over the entire period under review.
Fishes 10 00328 g008
Figure 9. Annual food consumption estimates (g) by herring age group calculated using a bioenergetics model for the years 1988 (strong growth, high yield) and 2023 (poor growth, low yield).
Fishes 10 00328 g009
Figure 10. Annual food consumption estimates (g) by perch age group calculated using a bioenergetics model for the years 1988.
Fishes 10 00328 g010
Figure 11. Specific annual consumption rates (SCR) of perch per unit increase in weight (g/g weight/a) and per unit increase in growth (g/g growth/a). As a comparison, the figure shows the SCR per unit increase in weight of Baltic herring (g/g weight/a).
Fishes 10 00328 g011
Figure 12. Generalized phosphorus budget of the Archipelago Sea. Potential reservoir of mobile phosphorus in the surface sediment layer: 19,856 tons, shown as the blue bottom bar [19,20]. Phosphorus content in the water column during different seasons in the late 1980s: blue wavy line. Amount of phosphorus (527 t) bound in the 1988 spawning stock of Baltic herring (117,091 t): shown above the fish symbol. Curved arrow below the fish: phosphorus (t) recycled by the spawning stock during its residence in the Archipelago Sea. Straight downward arrow: estimated total phosphorus (t) bound in feces. The red line indicates the period during which the Baltic herring stock is foraging beyond the Archipelago Sea. For the 1998 total perch stock (10,600 t), the phosphorus bound, recycled, and sedimented (t) is shown analogously to herring.
Fishes 10 00328 g012
Table 1. The parameter values used in the bioenergetics model for herring (Clupea harengus) [39] and perch (Perca fluviatilis) [40]. CA, intercept for a 1 g fish at CTO; CB, coefficient of the mass dependence; CQ, Q10 value for consumption, T dependence is CK1; CTO, optimum temperature (°C); CTM, maximum temperature (°C); CTL, the upper temperature at which T dependence is CK4; RA, intercept for a 1 g fish at RTO (g/g/d); RB, slope of the allometric mass function for respiration; RQ, Q10 value for respiration; RTO, optimum temperature (°C); RTM, maximum lethal temperature (°C); RTL, cutoff T above which swimming speed is dependent weight and below T and weight; RK1, intercept of weight dependence of swimming speed above cutoff T; RK4, slope for weight dependence of swimming speed at all T; ACT, activity multiplier; BACT, coefficient for T dependence of swimming speed below RTL; SDA, proportion of assimilated energy lost to specific dynamic action; FA, proportion of consumed food egested; FB, coefficient of T dependence; FG, coefficient for feeding level dependence; UA, proportion of consumed food excreted; UB, coefficient of T dependence; UG, coefficient for feeding level dependence. For growth and temperature, the letters a, b, c, and d refer to Supplementary Materials Figures S1–S4 [23,28,41].
HerringPerch
Consumption equation3 2
CA0.642 0.4
CB−0.256 −0.27
CQ1 3.9
CTO13 23
CTM15 28
CTL23
CK10.1
CK40.01
Respiration equation1 2
RA0.0033 0.0108
RB−0.227 −0.2
RQ0.0548 2.8
RTO0.03 28
RTM0 33
RTL9 0
RK115 0
RK40.13 0
ACT3.9 1
BACT0.149 0
SDA0.175 0.15
Egestion equation1 3
FA0.16 0.158
FB0 −0.222
FG0 0.631
Excretion equation1 3
UA0.1 0.0292
UB0 0.58
UG0 −0.299
Predator equation11
Growthac
Temperaturebd
Table 2. Calculations made with a bioenergetic model of phosphorus flows produced by different components of the Baltic herring stock—namely, the harvested portion (catch), the spawning stock (SSB), and the total population (TotB)—for the reference years 1988 and 2023. In the Archipelago Sea, this refers to the period when the herrings are mainly present in the area (1 November to 30 June).
Recycled P in AS
(t)
Recycled P in AS
(mg/m2/day)
Recycled P Total
(t/v)
1988
catch93.40.040274.1
SSB370.60.1591087.5
TotB552.70.2371621.7
2023
catch33.30.01476.4
SSB80.20.034184.1
TotB130.10.056298.4
Disclaimer/Publisher’s Note: The statements, opinions and data contained in all publications are solely those of the individual author(s) and contributor(s) and not of MDPI and/or the editor(s). MDPI and/or the editor(s) disclaim responsibility for any injury to people or property resulting from any ideas, methods, instructions or products referred to in the content.

