
Relationship Between Visual Acuity, Colour Vision, Contrast Sensitivity and Stereopsis, and Road Traffic Accidents: A Systematic Review and Meta-Analysis


Abstract
1. Introduction
2. Materials and Methods
2.1. Systematic Literature Search
2.2. Criteria for Study Selection
2.3. Data Extraction and Quality Assessment of Studies
2.4. Statistical Analysis
3. Results
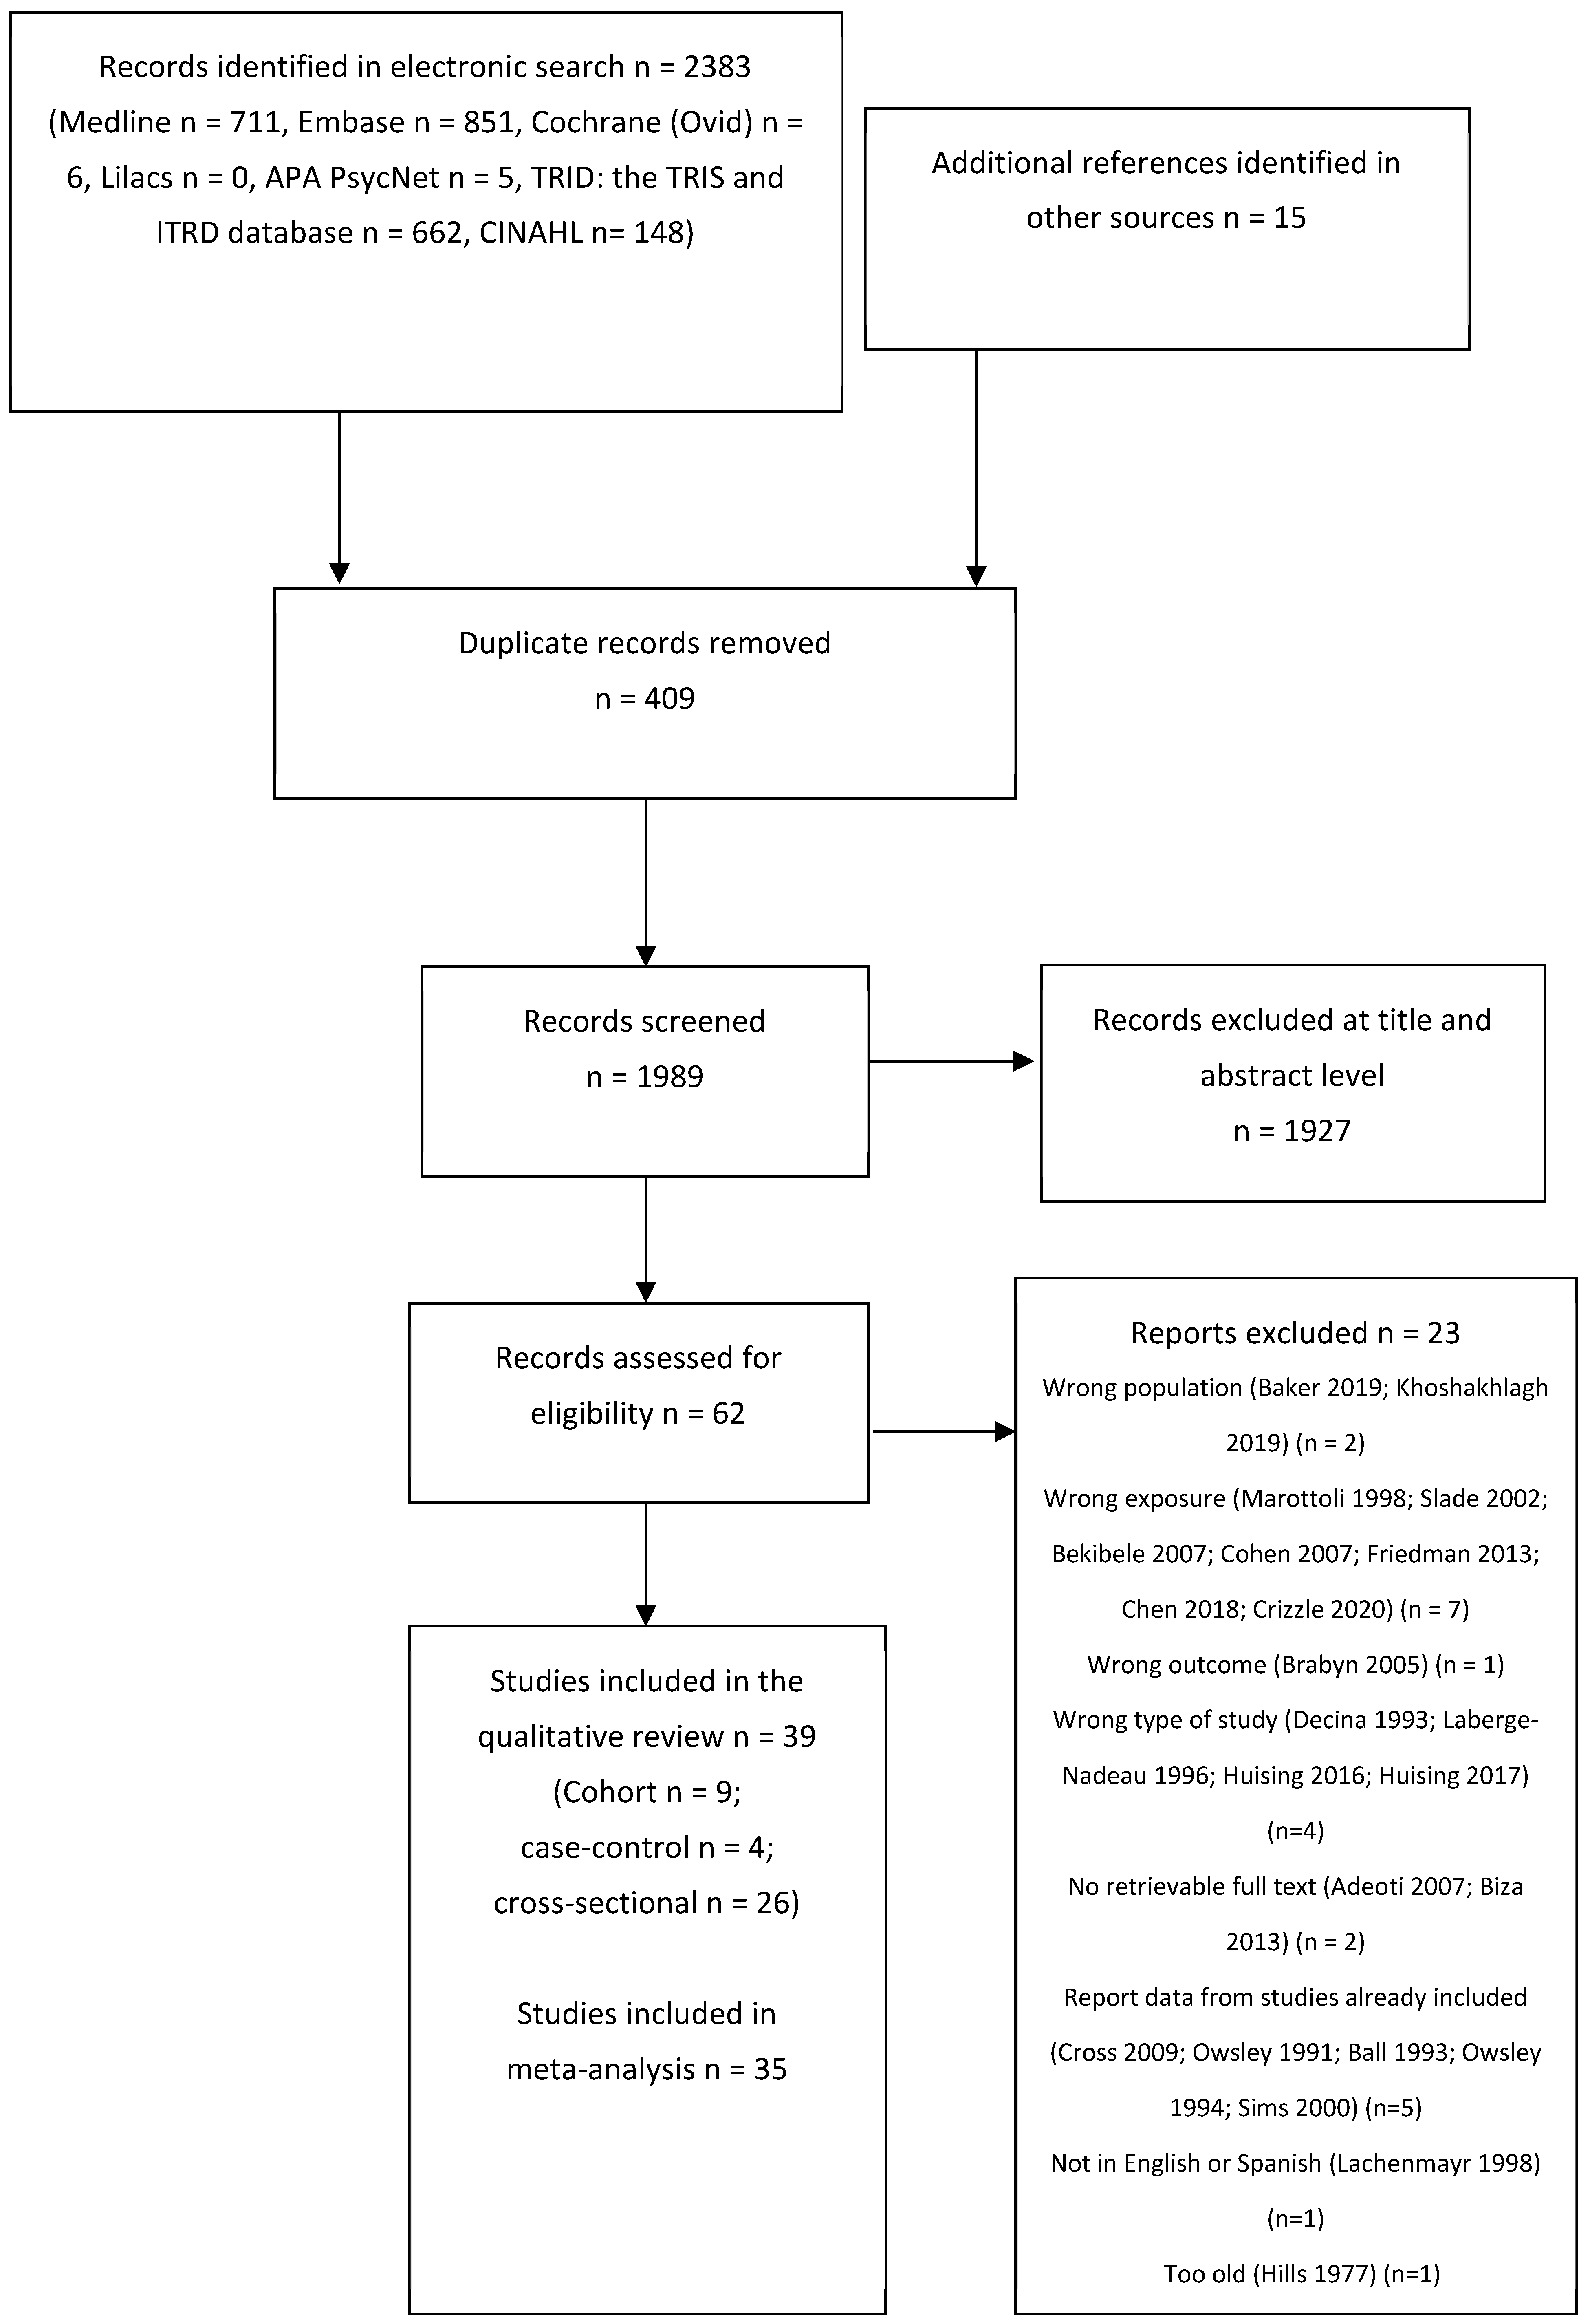
3.1. Results of the Search
3.2. Characteristics of the Included Studies
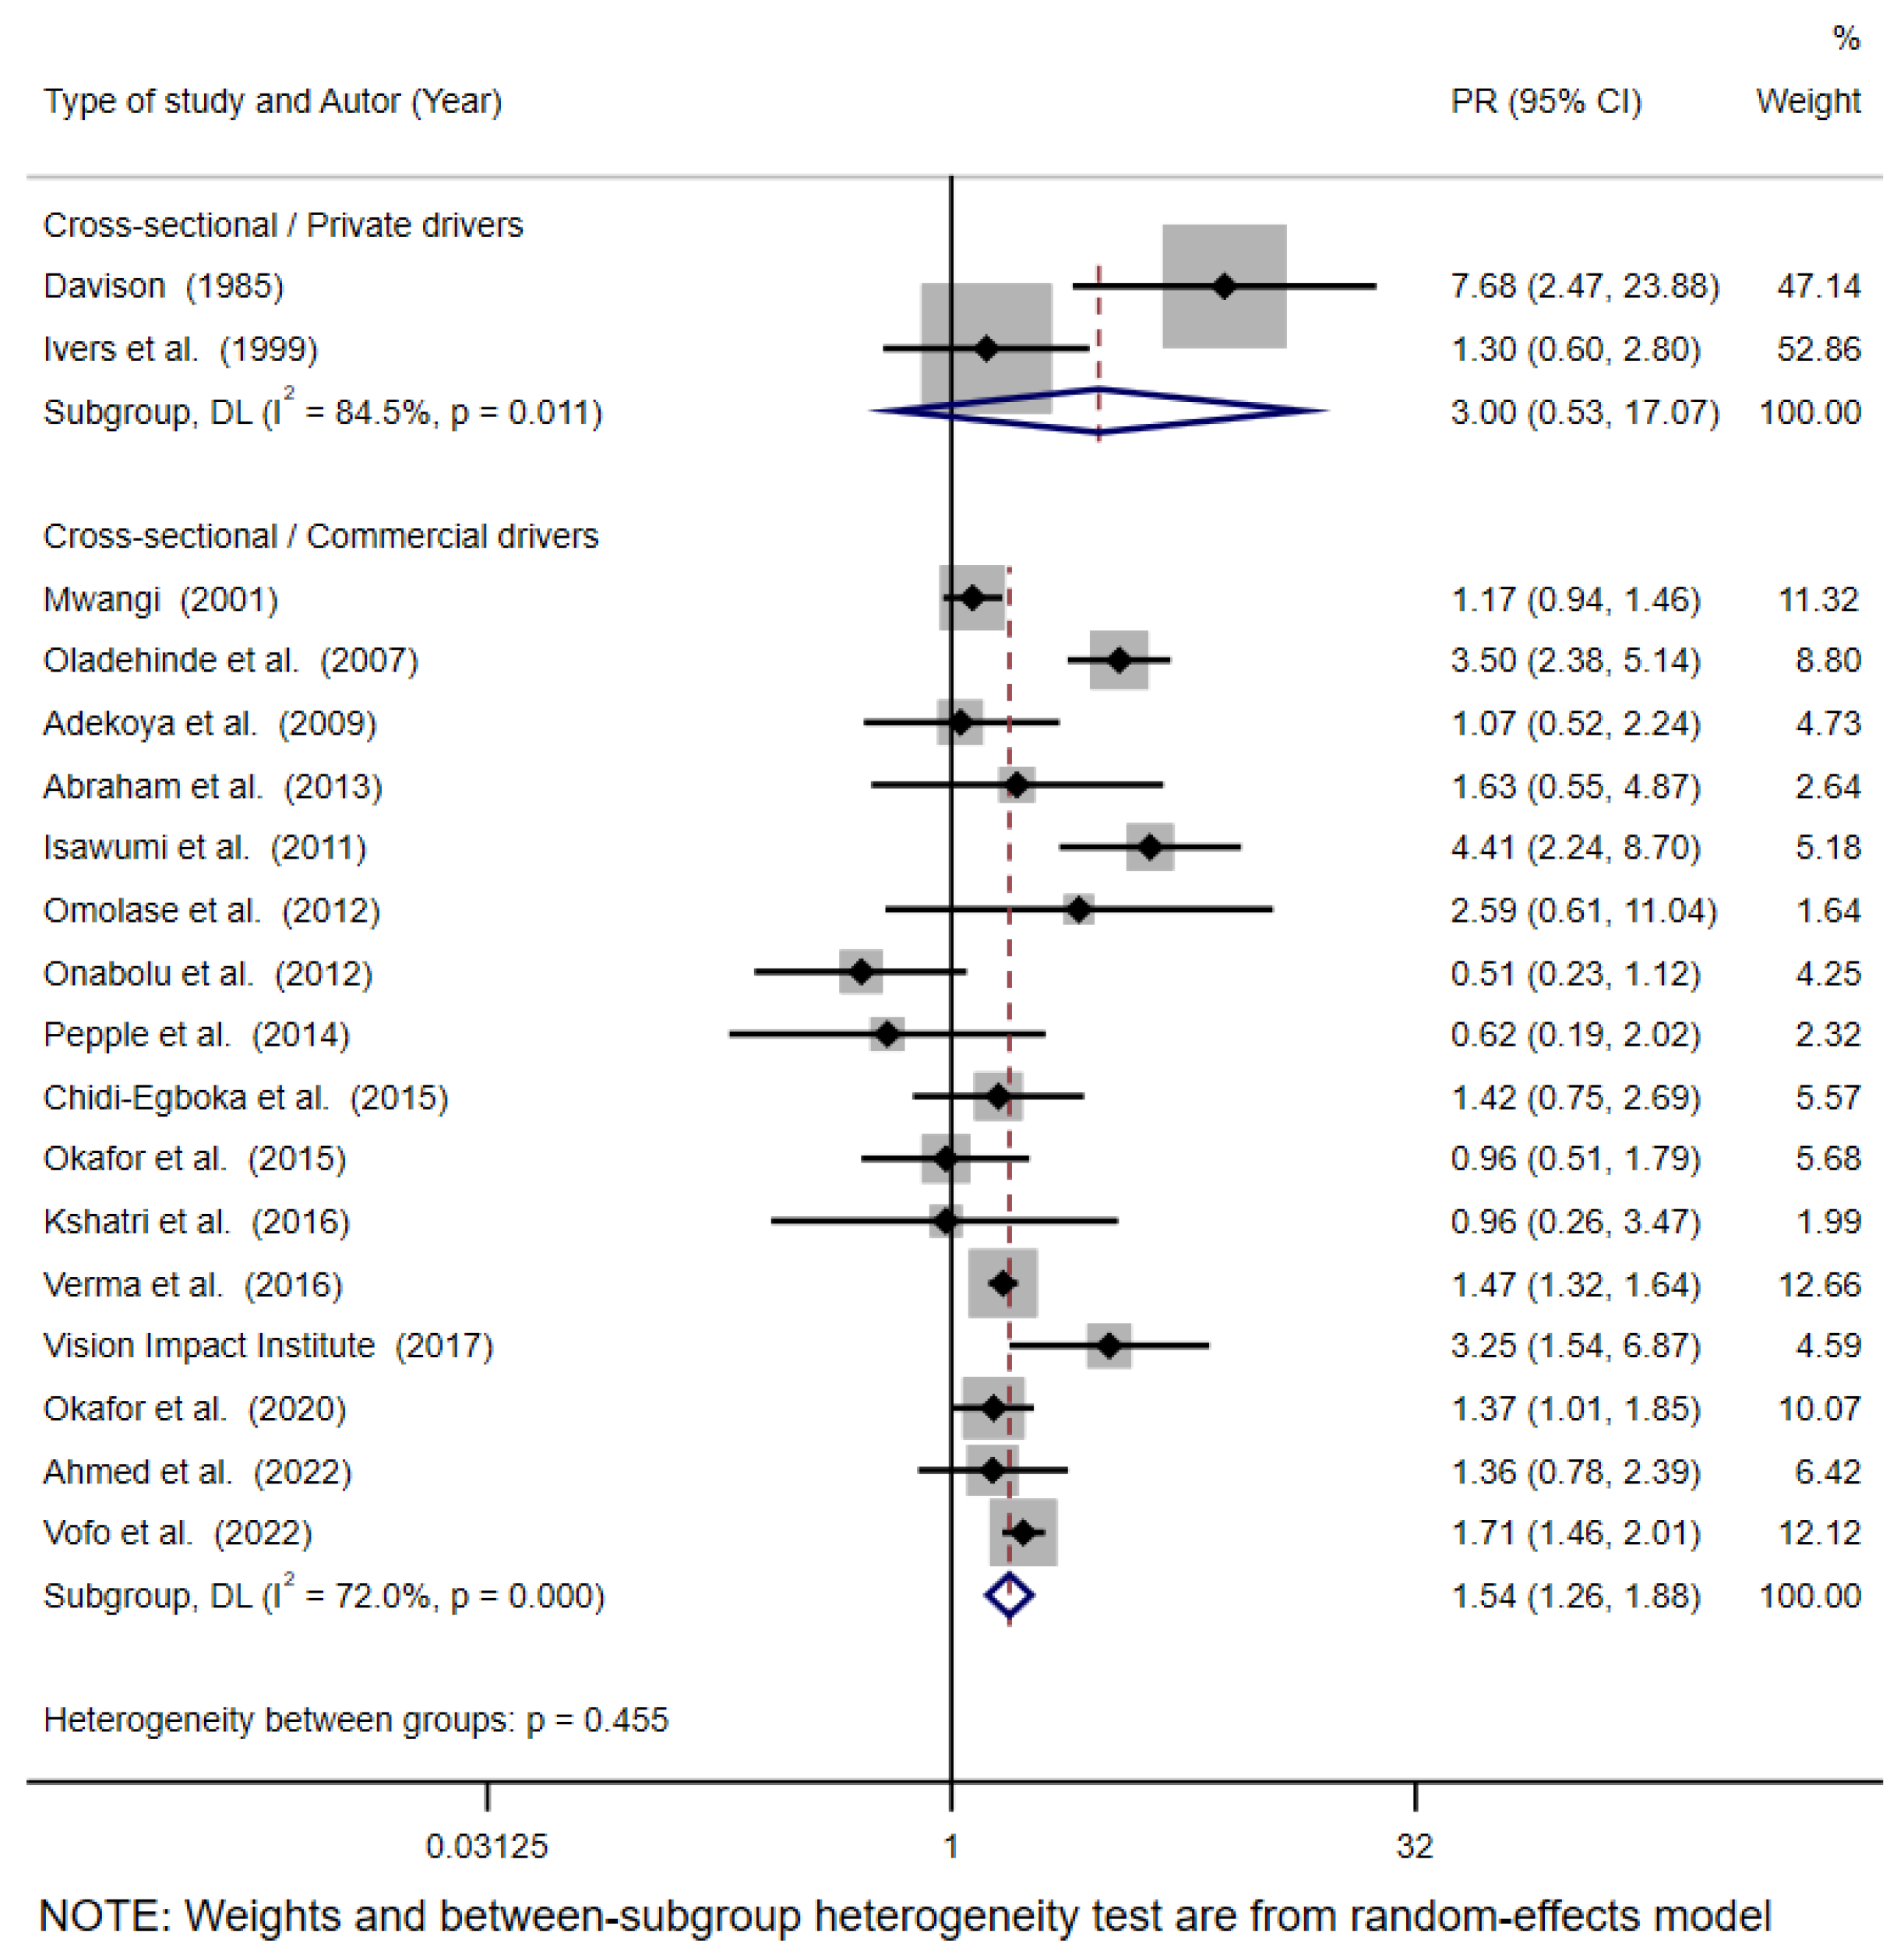
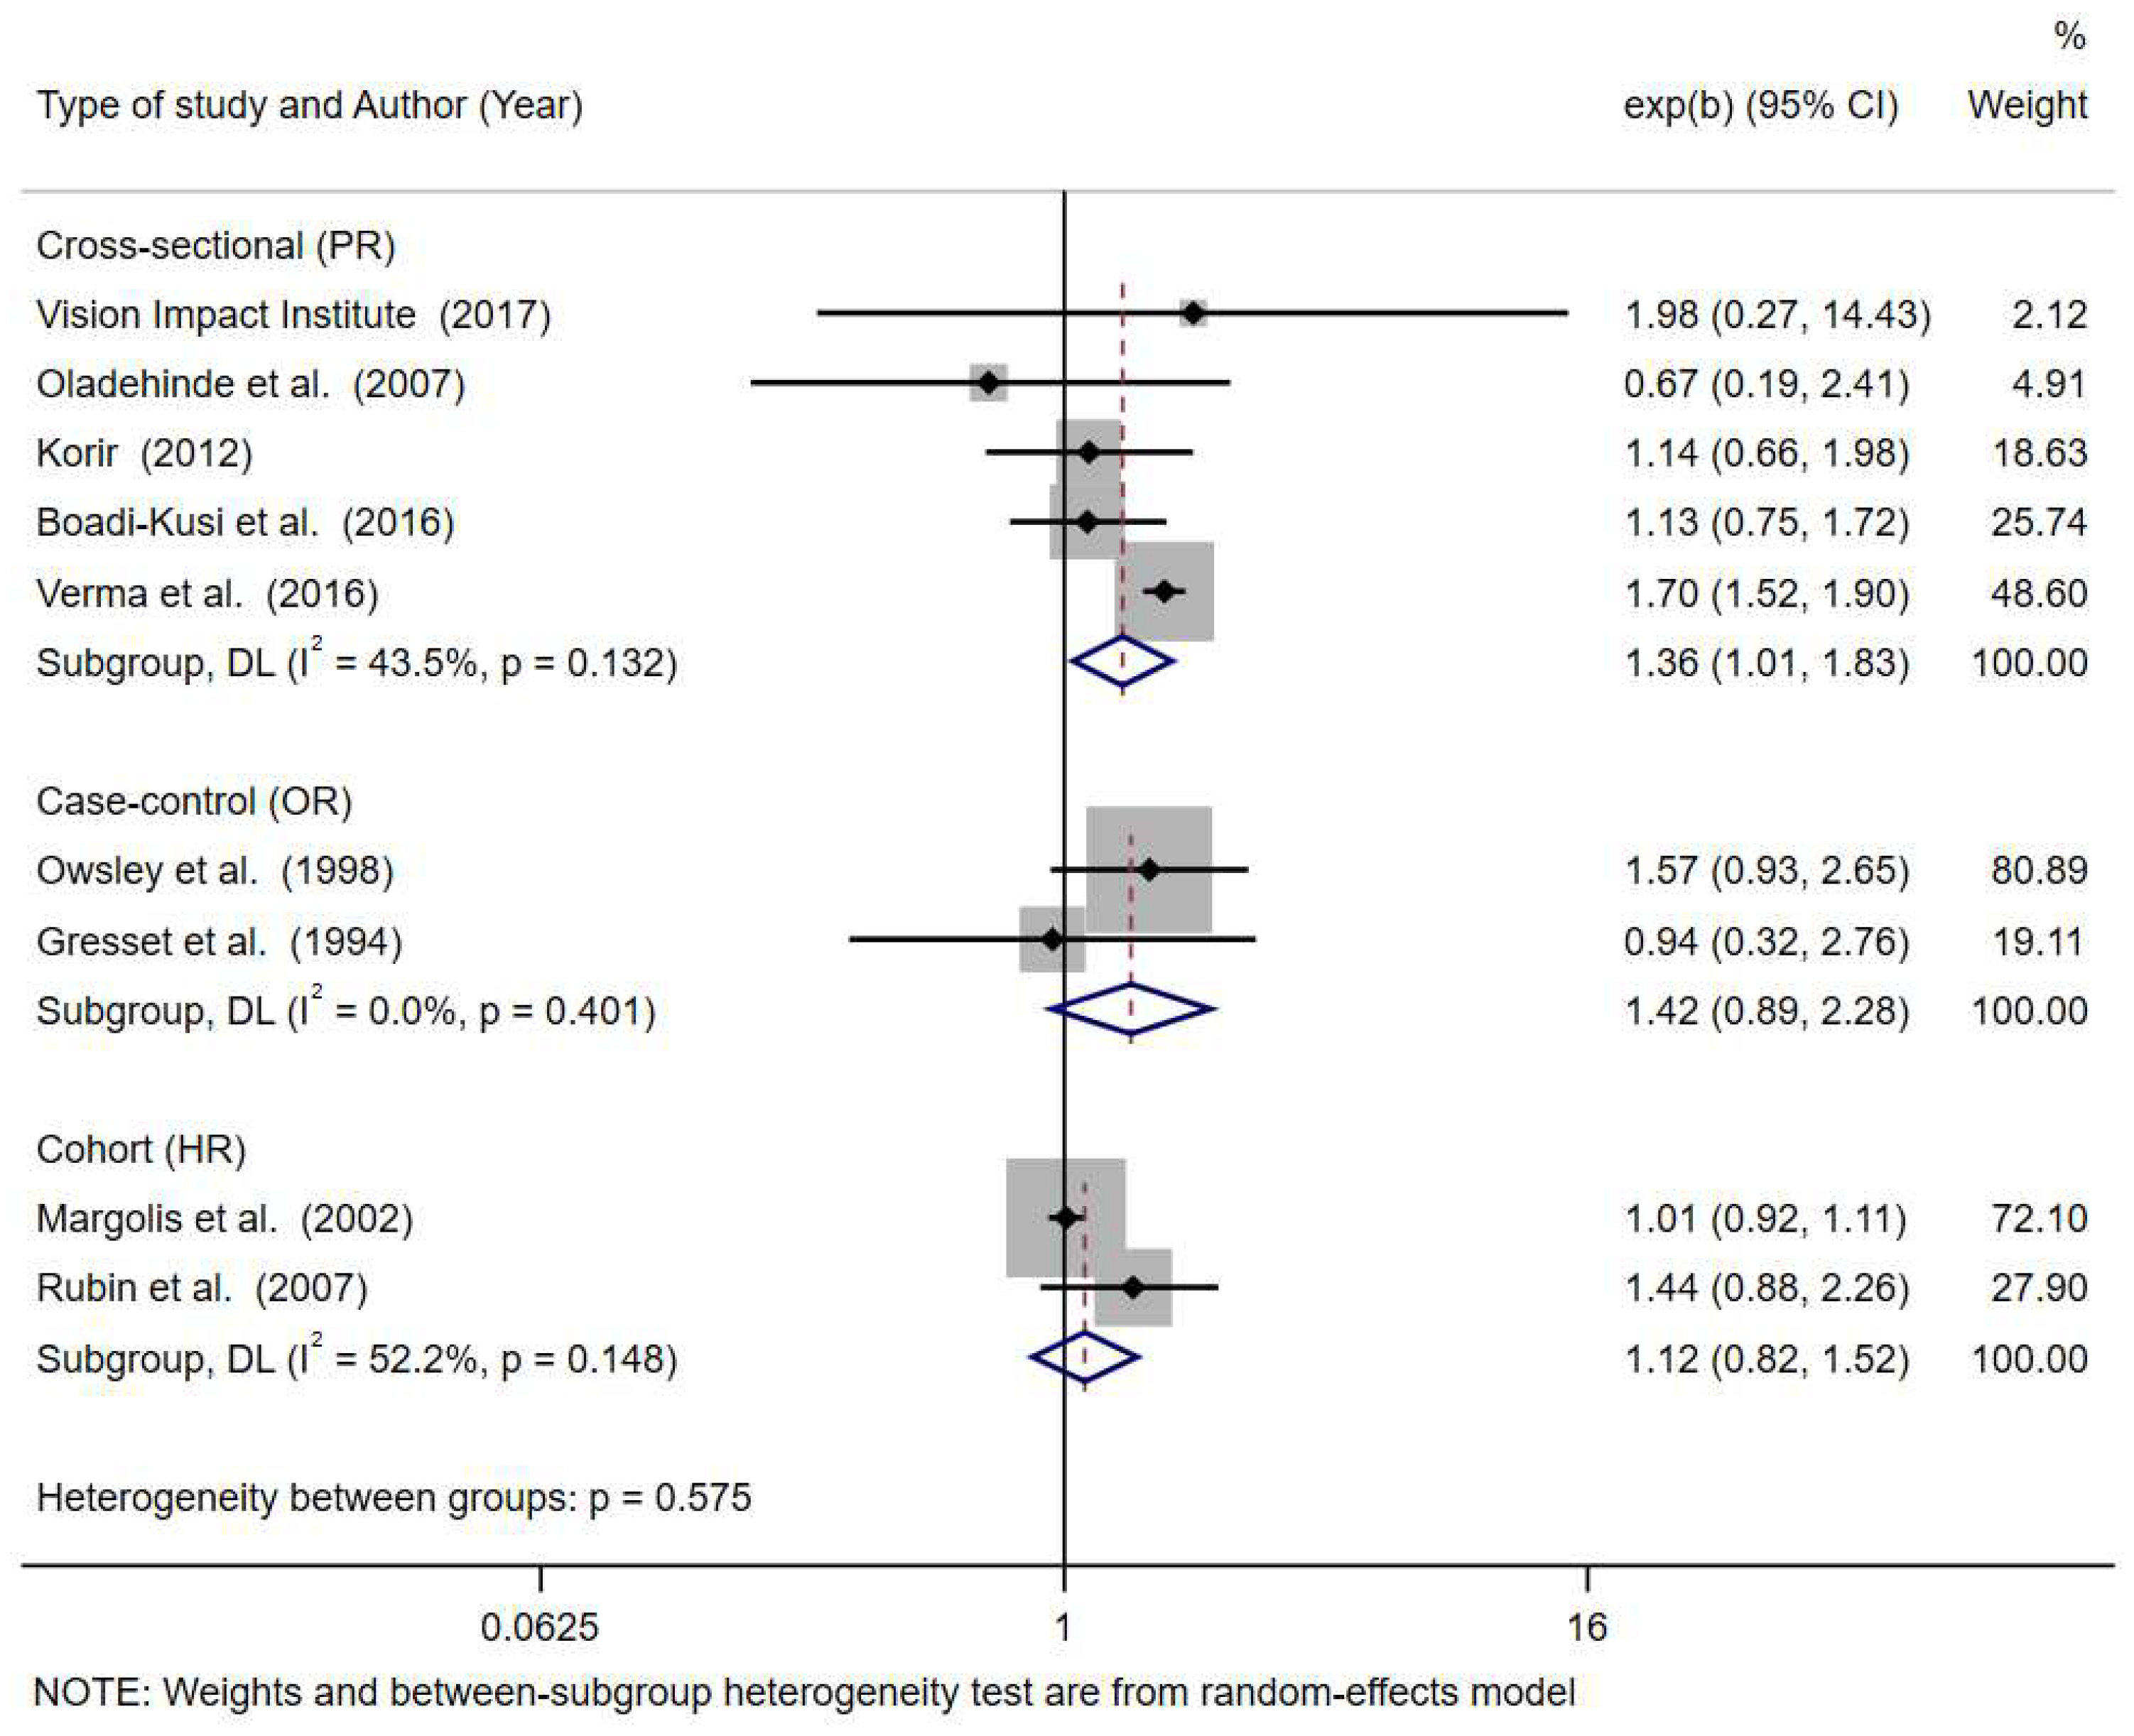
3.3. Visual Acuity
3.4. Colour Vision
3.5. Stereopsis
3.6. Contrast Sensitivity
4. Discussion
Author Contributions
Funding
Institutional Review Board Statement
Informed Consent Statement
Data Availability Statement
Acknowledgments
Conflicts of Interest
References
- World Health Organization. Global Status Report on Road Safety 2023; World Health Organization: Geneva, Switzerland, 2023; Available online: https://iris.who.int/handle/10665/375016 (accessed on 2 March 2024).
- Organización Mundial de la Salud. Plan Mundial Para el Decenio de Acción Para la Seguridad Vial 2021–2030; Organización Mundial de la Salud: Geneva, Switzerland, 2021; p. 36. Available online: https://www.who.int/es/publications/m/item/global-plan-for-the-decade-of-action-for-road-safety-2021-2030 (accessed on 18 August 2023).
- Ortiz-Peregrina, S. Influencia del Rendimiento Visual y Factores de Accidentabilidad Durante la Conducción en Sujetos con Visión Normal y con Patología Ocular. Ph.D. Thesis, Universidad de Granada, Granada, Spain, 2020. Available online: https://n9.cl/u2qc4 (accessed on 20 September 2023).
- Hawley, C.; Roberts, C.; Fosdick, T.; Ursachi, G. Vision and health as factors contributing to injury collisions in Great Britain: Comparisons between older and younger drivers. Optom. Pract. 2020, 21, 1–11. [Google Scholar]
- Rolison, J.J.; Regev, S.; Moutari, S.; Feeney, A. What are the factors that contribute to road accidents? An assessment of law enforcement views, ordinary drivers’ opinions, and road accident records. Accid. Anal. Prev. 2018, 115, 11–24. [Google Scholar] [CrossRef]
- Owsley, C.; McGwin, G. Vision and driving. Vis. Res. 2010, 50, 2348–2361. [Google Scholar] [CrossRef]
- Wood, J.M.; Black, A.A.; Dingle, K.; Rutter, C.; DiStefano, M.; Koppel, S.; Charlton, J.L.; Bentley, S.A. Impact of vision disorders and vision impairment on motor vehicle crash risk and on-road driving performance: A systematic review. Acta Ophthalmol. 2022, 100, e339–e367. [Google Scholar] [CrossRef] [PubMed]
- Piyasena, P.; Olvera-Herrera, V.O.; Chan, V.F.; Clarke, M.; Wright, D.M.; MacKenzie, G.; Virgili, G.; Congdon, N. Vision impairment and traffic safety outcomes in low-income and middle-income countries: A systematic review and meta-analysis. Lancet Glob. Health 2021, 9, e1411–e1422. [Google Scholar] [CrossRef] [PubMed]
- Nguyen, H.; Di Tanna, G.L.; Coxon, K.; Brown, J.; Ren, K.; Ramke, J.; Burton, M.J.; Gordon, I.; Zhang, J.H.; Furtado, J.; et al. Associations between vision impairment and vision-related interventions on crash risk and driving cessation: Systematic review and meta-analysis. BMJ Open 2023, 13, e065210. [Google Scholar] [CrossRef]
- Ouzzani, M.; Hammady, H.; Fedorowicz, Z.; Elmagarmid, A. Rayyan—A web and mobile app for systematic reviews. Syst. Rev. 2016, 5, 210. [Google Scholar] [CrossRef]
- NHLBI. Study Quality Assessment Tools; National Heart, Lung and Blood Institute: Bethesda, MD, USA, 2021. Available online: https://www.nhlbi.nih.gov/health-topics/study-quality-assessment-tools (accessed on 15 March 2022).
- Higgins, J.P.T.; Thompson, S.G.; Deeks, J.J.; Altman, D.G. Measuring inconsistency in meta-analyses. BMJ 2003, 327, 557–560. [Google Scholar] [CrossRef]
- Bekibele, C.; Fawole, O.; Bamgboye, A.; Adekunle, L.; Ajav, R.; Baiyeroju, A. Risk factors for road traffic accidents among drivers of public institutions in Ibadan, Nigeria. Afr. J. Health Sci. 2008, 14, 137–142. [Google Scholar] [CrossRef]
- Okamura, K.; Iwase, A.; Matsumoto, C.; Fukuda, T.; Kunimatsu-Sanuki, S.; Fujita, G.; Kihira, M.; Kosuge, R. Association between visual field impairment and involvement in motor vehicle collision among a sample of Japanese drivers. Transp. Res. Part F Traffic Psychol. Behav. 2019, 62, 99–114. [Google Scholar] [CrossRef]
- Ojabo, C.O.; Adeniyi, O.S.; Ojo, B.A. An Assessment of Visual Acuity of Commercial Vehicle Drivers in Makurdi, Benue State, North-Central Nigeria. Curr. J. Appl. Sci. Technol. 2020, 39, 61–67. [Google Scholar] [CrossRef]
- Ovenseri-Ogomo, G.; Adofo, M. Poor vision, refractive errors and barriers to treatment among commercial vehicle drivers in the Cape Coast municipality. Afr. Health Sci. 2011, 11, 97–102. [Google Scholar]
- Woolnough, A.; Salim, D.; Marshall, S.C.; Weegar, K.; Porter, M.M.; Rapoport, M.J.; Man-Son-Hing, M.; Bédard, M.; Gélinas, I.; Korner-Bitensky, N.; et al. Determining the validity of the AMA guide: A historical cohort analysis of the Assessment of Driving Related Skills and crash rate among older drivers. Accid. Anal. Prev. 2013, 61, 311–316. [Google Scholar] [CrossRef] [PubMed]
- Owsley, C.; Ball, K.; McGwin, G.J.; Sloane, M.E.; Roenker, D.L.; White, M.F.; Overley, E.T. Visual processing impairment and risk of motor vehicle crash among older adults. JAMA 1998, 279, 1083–1088. [Google Scholar] [CrossRef] [PubMed]
- Sims, R.V.; McGwin, G.J.; Allman, R.M.; Ball, K.; Owsley, C. Exploratory study of incident vehicle crashes among older drivers. J. Gerontol. A Biol. Sci. Med. Sci. 2000, 55, M22–M27. [Google Scholar]
- Keeffe, J.E.; Jin, C.F.; Weih, L.M.; McCarty, C.A.; Taylor, H.R. Vision impairment and older drivers: Who’s driving? Br. J. Ophthalmol. 2002, 86, 1118–1121. [Google Scholar] [CrossRef] [PubMed]
- Margolis, K.L.; Kerani, R.P.; McGovern, P.; Songer, T.; Cauley, J.A.; Ensrud, K.E. Risk factors for motor vehicle crashes in older women. J. Gerontol. A Biol. Sci. Med. Sci. 2002, 57, M186–M191. [Google Scholar] [CrossRef]
- Rubin, G.S.; Ng, E.S.W.; Bandeen-Roche, K.; Keyl, P.M.; Freeman, E.E.; West, S.K. A prospective, population-based study of the role of visual impairment in motor vehicle crashes among older drivers: The SEE study. Invest. Ophthalmol. Vis. Sci. 2007, 48, 1483–1491. [Google Scholar] [CrossRef]
- Emerson, J.L.; Johnson, A.M.; Dawson, J.D.; Uc, E.Y.; Anderson, S.W.; Rizzo, M. Predictors of driving outcomes in advancing age. Psychol. Aging 2012, 27, 550–559. [Google Scholar] [CrossRef]
- Green, K.A.; McGwin, G.; Owsley, C. Associations between visual, hearing, and dual sensory impairments and history of motor vehicle collision involvement of older drivers. J. Am. Geriatr. Soc. 2013, 61, 252–257. [Google Scholar] [CrossRef]
- Chen, S.J.; Chen, C.Y.; Lin, M.R. Risk factors for crash involvement in older motorcycle riders. Accid. Anal. Prev. 2018, 111, 109–114. [Google Scholar] [CrossRef] [PubMed]
- Humphriss, D. Three South African studies on the relation between road accidents and drivers’ vision. Ophthalmic Physiol. Opt. 1987, 7, 73–79. [Google Scholar] [CrossRef]
- Gresset, J.A.; Meyer, F.M. Risk of accidents among elderly car drivers with visual acuity equal to 6/12 or 6/15 and lack of binocular vision. Ophthalmic Physiol. Opt. 1994, 14, 33–37. [Google Scholar] [CrossRef]
- McCloskey, L.W.; Koepsell, T.D.; Wolf, M.E.; Buchner, D.M. Motor vehicle collision injuries and sensory impairments of older drivers. Age Ageing 1994, 23, 267–273. [Google Scholar] [CrossRef] [PubMed]
- Owsley, C.; McGwin, G.J.; Ball, K. Vision impairment, eye disease, and injurious motor vehicle crashes in the elderly. Ophthalmic Epidemiol. 1998, 5, 101–113. [Google Scholar] [CrossRef]
- Davison, P.A. Inter-relationships between British drivers’ visual abilities, age and road accident histories. Ophthalmic Physiol. Opt. 1985, 5, 195–204. [Google Scholar] [PubMed]
- Ivers, R.Q.; Mitchell, P.; Cumming, R.G. Sensory impairment and driving: The Blue Mountains Eye Study. Am. J. Public. Health 1999, 89, 85–87. [Google Scholar] [CrossRef]
- Mwangi, C. Vision Assessment of Public Service Vehicle Drivers in Nairobi. Ph.D. Thesis, University of Nairobi, Nairobi, Kenya, 2001. [Google Scholar]
- Abebe, Y.; Wondmikun, Y. Defective color perception among car drivers in Addis Ababa, Ethiopia. Traffic Inj. Prev. 2002, 3, 294–297. [Google Scholar] [CrossRef]
- Oladehinde, M.K.; Adeoye, A.O.; Adegbehingbe, B.O.; Onakoya, A.O. Visual functions of commercial drivers in relation to road accidents in Nigeria. Indian J. Occup. Environ. Med. 2007, 11, 71–75. [Google Scholar]
- Adekoya, B.J.; Owoeye, J.F.A.; Adepoju, F.G.; Ajaiyeoba, A.I. Visual function survey of commercial intercity vehicle drivers in Ilorin, Nigeria. Can. J. Ophthalmol. 2009, 44, 261–264. [Google Scholar] [CrossRef]
- Isawumi, M.A.; Adeoti, C.O.; Ubah, J.N.; Oluwatimilehin, I.O.; Raji, R.A. Ocular status of commercial drivers in Osun State, Nigeria. Afr. J. Med. Med. Sci. 2011, 40, 405–411. [Google Scholar] [PubMed]
- Onabolu, O.O.; Bodunde, O.T.; Otulana, T.O.; Ajibode, H.A.; Awodein, O.G.; Onadipe, O.J.; Jagun, O.A. Visual acuity of commercial motor drivers in Ogun State of Nigeria. Niger. Postgrad. Med. J. 2012, 19, 225–229. [Google Scholar] [CrossRef] [PubMed]
- Korir, F. Vision Among Bodaboda Motorcycle Riders in Kisumu. Master Thesis, University of Nairobi, Nairobi, Kenya, 2012. [Google Scholar]
- Omolase, C.O. Ocular Status of Commercial Drivers in a Nigerian Community. J. Community Med. Heal. Educ. 2012, 2, 2–5. [Google Scholar] [CrossRef]
- Abraham, E.G.; Umanah, I.N.; Abraham, E.G. Prevalence of visual impairment among commercial motor vehicle drivers in Uyo, South-South Nigeria. J. Environ. Occup. Sci. 2013, 2, 55–60. [Google Scholar] [CrossRef]
- Achigbu, E.O.; Fiebai, B. Visual defects and commercial motorcycle accidents in south eastern Nigeria. Niger. J. Med. 2013, 22, 299–303. [Google Scholar]
- Pepple, G.; Adio, A. Visual function of drivers and its relationship to road traffic accidents in Urban Africa. Springerplus 2014, 3, 47. [Google Scholar] [CrossRef]
- Chidi-Egboka, N.C.; Bolarinwa, O.A.; Ademola Awoyemi, O. Visual function test among commercial drivers in a North Central State of Nigeria. Health Sci. J. 2015, 9, 11. [Google Scholar]
- Okafor, I.P.; Odeyemi, K.A.; Aribaba, O.T.; Dolapo, D.C.; Ogunyemi, A.O. Visual acuity, safe/unsafe practices and self-reported road traffic crash experiences among commuter bus drivers from two motor parks in Lagos, Nigeria. West Afr. J. Med. 2015, 34, 118–124. [Google Scholar] [PubMed]
- Boadi-Kusi, S.B.; Kyei, S.; Asare, F.A.; Owusu-Ansah, A.; Awuah, A.; Darko-Takyi, C. Visual function among commercial vehicle drivers in the central region of Ghana. J. Optom. 2016, 9, 54–63. [Google Scholar] [CrossRef]
- Kshatri, J.; Pradhan, P.; Patro, S.; Tripathy, R. Ocular Status of Inter-State Commercial Drivers: A Cross Sectional Study in Odisha, India. Int. J. Ophthalmic Res. 2016, 2, 188–191. [Google Scholar] [CrossRef]
- Verma, A.; Chakrabarty, N.; Velmurugan, S.; Prithvi Bhat, B.; Dinesh Kumar, H.D.; Nishanthi, B. Assessment of driver vision functions in relation to their crash involvement in India. Curr. Sci. 2016, 110, 1063–1072. [Google Scholar] [CrossRef]
- Vision Impact Institute. Assesment of Visual Limitations of Commercial Drivers in Metropolitan Cities in India; Vision Impact Institute: New Delhi, India, 2017; Available online: https://onesight.essilorluxottica.com/research/assessment-of-visual-limitations-of-commercial-drivers-in-metropolitan-cities-in-india-(interim-report) (accessed on 7 July 2021).
- Okafor, K.; Awunor, N.; Otabor-Olubor, O.; Okojie, O. Assessment of visual acuity of commercial long-distance drivers in Benin City, Edo State, Nigeria. Delta J. Ophthalmol. 2020, 21, 57. [Google Scholar]
- Ahmed, M.; Patnaik, J.L.; Whitestone, N.; Hossain, M.A.; Alauddin, M.; Husain, L.; Hossain, M.P.; Islam, M.S.; Hossain, M.I.; Imdad, K.; et al. Visual Impairment and Risk of Self-Reported Road Traffic Crashes Among Bus Drivers in Bangladesh. Asia Pac. J. Ophthalmol. 2022, 11, 72–78. [Google Scholar] [CrossRef]
- Vofo, B.N.; Ayuk, D.A.; Pe’er, J.; Chichom-Mefire, A.; Tendongfor, N.; Nche, E.N. Visual assessment of commercial drivers in the South West Region of Cameroon. BMC Ophthalmol. 2021, 21, 148. [Google Scholar] [CrossRef]
- Cole, B.L. Colour blindness and driving. Clin. Exp. Optom. 2016, 99, 484–487. [Google Scholar] [CrossRef] [PubMed]
- Alvarez-Peregrina, C.; Martinez-Perez, C.; Villa-Collar, C.; Sánchez-Tena, M.Á. Influence of vision on drivers: A pilot study. Int. J. Environ. Res. Public Health 2021, 18, 12116. [Google Scholar] [CrossRef]
- Dakroub, M.; Boueiri, M.; Al-Haddad, C. A review of driving and binocularity. J. Pediatr. Ophthalmol. Strabismus 2022, 59, 6–12. [Google Scholar] [CrossRef] [PubMed]
- Owsley, C.; Swain, T.; Liu, R.; McGwin, G.; Kwon, M.Y. Association of Photopic and Mesopic Contrast Sensitivity in older drivers with risk of motor vehicle collision using naturalistic driving data. BMC Ophthalmol. 2020, 20, 47. [Google Scholar] [CrossRef]
- Lord, S.R.; Delbaere, K.I.M.; Sturnieks, D.L. Aging. In Handbook of Clinical Neurology, 3rd ed.; Day, B., Lord, S., Eds.; Elsevier: Melbourne, Australia, 2018; pp. 157–171. [Google Scholar]
- Ball, K.; Owsley, C.; Sloane, M.E.; Roenker, D.L.; Bruni, J.R. Visual attention problems as a predictor of vehicle crashes in older drivers. Investig. Ophthalmol. Vis. Sci. 1993, 34, 3110–3123. [Google Scholar]
- Owsley, C. Vision and driving in the elderly. Optom. Vis. Sci. 1994, 71, 727–735. [Google Scholar] [CrossRef]
- Sims, R.V.; Owsley, C.; Allman, R.M.; Ball, K.; Smoot, T.M. A preliminary assessment of the medical and functional factors associated with vehicle crashes by older adults. J. Am. Geriatr. Soc. 1998, 46, 556–561. [Google Scholar] [CrossRef] [PubMed]


| Author, Country and Year | Setting, Sample, Age and Sex | Study Period/Time of Follow-Up | Visual Acuity * | Colour Vision * | Contrast Sensitivity * | Stereopsis * | Accidents ** | Association with RTA | Adjustment Variables | Quality Rating (NIH) |
|---|---|---|---|---|---|---|---|---|---|---|
| Owsley et al., USA 1998 [18] | Community-based sample of older drivers n = 294 55 to 87 years old Male 53.7% | 3 years of follow-up 1990–1993 | ETDRS Binocular ≥20/40 87.4% <20/40 12.6% | - | Pelli–Robson Binocular log > 1.5 83% log ≤ 1.5 17% | TNO stereo test <500″ 68.7% ≥500″ 31.3% | State-recorded. At least 1 crash in the 3-year follow-up period 19.1% The estimated annual crash rate was 74 per 1000 person-years of driving and 7.1 per million person-miles of travel | VA RR 1.45 (95% CI 0.58–3.64) CS RR 0.87 (95% CI 0.35–2.17) StereoacuityRR 0.76 (95% CI 0.36–2.74) | None | Good |
| Sims et al., USA 2000 [19] | Community-based sample of older drivers n = 174 55 to 87 years old Male 52.6% | 1991–1996 | ETDRS Binocular <20/40 6.9% | - | Pelli–Robson Binocular log < 1.8 9.1% | - | State-recorded. A single crash, 80.3%. The remaining drivers having up to four events. Incidence of 10 crashes per million person miles travelled | VA RR 1.07 (95% CI 0.26–4.47) CS < 1.8 RR 1.49 (95% CI 0.34–6.57) | None | Good |
| Keeffe et al., Australia 2002 [20] | Population based study: The Melbourne Visual Impairment Project (VIP) n = 1771 40–101 years old Female 55% | Between 4 and 7 years (mean 4.5 (SD 0.64), median 4 years) | logMAR ≥6/12 97.4% <6/12 2.6% | - | - | - | Self-reported accident record in the intervening 5 years since the baseline study 19.1% | VI RR 0.91 (95% CI 0.48–1.71) | None | Fair |
| Margolis et al., USA 2002 [21] | The Study of Osteoporotic Fractures n = 1416 65–84 years old Female 100% | Baseline exam (1986–1988) Follow-up 5.7 years avg. | Bailey and Lovie Impaired acuity VA ≤ 20/40 4.7% LogMAR mean 0.08 (SD 0.12) | - | Vistech Vision Contrast Test System 6500 Low spatial frequencies Mean 73.7 (SD 33.3) High spatial frequencies Mean 33.5 (SD 27.0) | Howard Dolman Apparatus Mean 2.02 (SD 2.44) | Police-reported. Rate of crashes 0.07 per driver per year | VA 20/40 HR 1.14 (95% CI 0.73–1.80) LogMAR HR 1.08 (95% CI 0.97–1.19) CS Low spatial frequencies HR 0.99 (95% CI 0.89–1.10) High spatial frequencies HR 0.94 (95% CI 0.85–1.04) Distance depth perception HR 1.01 (95% CI 0.92–1.11) | Age and miles driven per week | Good |
| Rubin et al., USA 2007 [22] | Salisbury Eye Evaluation (SEE) Study (older participants who reported driving more than 500 miles during the prior year) n = 1801 65–84 years old Female 50.3% | 1993–1995 14 to 1567 days (median, 1087; interquartile range = 933–1323) | ETDRS Binocular Better than 20/25 (<0.1) 81.9% 20/25–20/40 (0.1–0.3) 14.8% Worse than 20/40 (>0.3) 3.2% | - | Pelli–Robson Better eye 1.65 (>36) 50.9% 1.35–1.65 (30–36) 46.0% 1.35 (<30) 3.1% | Randot Circles test 13% failed at 457 arc sec (stereodeficient) Passed 82.1% Failed 17.9% | State records 6.7% | VA HR 1.17 (95% CI 0.78–1.70) CS <1.7 HR 0.75 (95% CI 0.49–1.21) ≥1.7 HR 1.25 (95% CI 0.44–5.65) Stereopsis worse 457″ HR 1.44 (95% CI 0.88–2.26) | Miles driven, age, race, sex, Mini-Mental State Examination score, education, comorbidities, living alone and depression | Good |
| Emerson et al., USA 2012 [23] | General community older drivers without neurological diseases n = 100 65 to 89 years old Male 51% | Mean total follow-up time 6.40 years (range: 0.46–9.03) | ETDRS Mean −0.05 (SD 0.11) Median −0.06 Range −0.26–0.24 | - | Pelli–Robson Both eyes Mean 1.80 (SD 0.15) Median 1.80 Range 1.35–1.95 | - | Police crash reports in which the participant was the driver, categorised as “at-fault”, “not at-fault” or “not enough Information”. Crash rate at 1 year Cumulative incidence 7.1% (95% CI 3.4–14.3); at 2 years, 16.4% (95% CI 10.4–25.3]; at 4 years 28.6% (95% CI 20.5–38.9), and at 6 years 32.4% (95% CI 23.8–43.0) | VA HR 0.95 (95% CI 0.64–1.40) CS HR 1.19 (95% CI 0.82–1.71) | Age, gender, education, and baseline mileage driven per week | Fair |
| Green et al., USA 2013 [24] | Population-based sample n = 1998 70 to 99 years old Male 56.5% | MVCs report for the 5 years before study enrollment | Electronic Visual Acuity test Binocular <20/40 8.1% | - | Pelli–Robson Binocular log < 1.5 6.7% | - | Police-reported. 34% At fault 15.4% 5.6 per 1,000,000 person-miles for persons without impairment 6.4 per 1,000,000 person-miles for persons with VA impairment 8.3 per 1,000,000 person-miles for persons with CS impairment | VA RR 1.04 (95% CI 0.74–1.48) At fault RR 1.08 (95% CI 0.66–1.76) CS RR 1.42 (95% CI 1.00–2.02) At fault RR 1.52 (95% CI 0.93–2.49) | Age, race, sex, number of medical conditions, Mini-Mental State Examination, Motor-Free Visual Perception Test, and Trail-Making Test Part B. | Good |
| Woolnouph et al., Canada, Australia and New Zealand 2013 [17] | The Candrive II/Ozcandrive cohort n = 1230 70 to 94 years old Male 64.2% | 2 years prior to the baseline assessment | Snellen Binocular No collision Mean 14.0 (SD 5.1) Collision Mean 14.8 (SD 4.7) | - | - | - | State records 5.1% involved in an MVC | VA p > 0.01 | None | Fair |
| Chen et al., Taiwan 2018 [25] | Motorcycle riders n = 256 ≥60 years old Male 51.2% | 1-year study period 2013–2014 | Rosenbaum cards Abnormal <20/50 31.3% | - | - | - | Self-reported 33.7% | Abnormal VA Without a crash 32.2% With a crash 29.1% p = 0.622 | None | Fair |
| Author, Country and Year | Setting, Number of Cases and Controls, Age and Sex | Case Definition | Visual Acuity * | Colour Vision * | Contrast Sensitivity * | Stereopsis * | Association with RTA | Adjustment Variables | Quality Rating (NIH) |
|---|---|---|---|---|---|---|---|---|---|
| Humphriss South Africa 1987 [26] | Construction company 196 cases/170 controls No gender or age information provided | Company records | Orthorater vision screener Binocular Cases 12.7% fail Controls 5.9% fail | Orthorater vision screener | - | Orthorater vision screener | VA OR 2.34 (95% CI 1.09–5.02) ** Stereopsis OR 0.94 (95% CI 0.32–2.76) ** Colour vison differences no significant | None | Fair |
| Gresset et al., Canada 1994 [27] | Population-based 1400 cases/2636 controls 70 years old Male 100% | Insurance company | Cases: 6/12 or 6/15 8% Controls: 6/12 or 6/15 7.7% | - | - | Stereoacuity threshold greater than 200 sec arc Cases 0.4% Controls 0.4% | VA lower than 6/12 and binocularity OR 0.97 (95% CI 0.68–1.38) VA lower than 6/12 and lack of binocularity OR 1.23 (95% CI 0.88–1.72) | Traffic convictions, mileage, time spent and frequency of driving during rush hours | Good |
| McCloskey et al., USA 1994 [28] | Population-based 235 cases/448 controls ≥65 years old Male 49.9% | Drivers treated for injuries sustained in police-reported collisions | Aided VA 20/15 or 20/20 Cases 37.2% Controls 30.8% 20/25 or 20/30 Cases 46.1% Controls 50.8% 20/40 Cases 10% Controls 11.3% 20/50 or 20/60 Cases 3.9% Controls 5.9% 20/70 or greater Cases 2.8% Controls 1.1% | - | - | - | Aided VA 20/25 or 20/30 RR 0.7 (95% CI 0.5–1.1) 20/40 RR 0.6 (95% CI 0.3–1.2) 20/50 or 20/60 RR 0.3 (95% CI 0.1–0.9) ≥20/70 RR 4.3 (95% CI 0.5–40.3) | Controls matched to cases by age, sex, and country of residence | Fair |
| Owsley et al., USA 1998 [29] | Population-based 179 cases/115 controls 55 to 87 years old Male 54% | Drivers who had incurred at least one vehicle crash between 1985 and 1990 resulting in an injury to anyone in the involved vehicles according to the accident report. The other case group (n = 101) consisted of drivers involved in non-injurious crashes | ETDRS Binocular Injurious crashes ≤20/40 85.9% >20/40 14.1% Non-injurious crashes ≤20/40 85.6% >20/40 14.4% Non crash ≤20/40 90.4% >20/40 9.6% | - | Pelli–Robson Binocular Injurious crashes log >1.5 79.5% log ≤1.5 20.5% Non-injurious crashes log >1.5 83.8% log ≤1.5 16.2% Non-crash log >1.5 77.4% log ≤1.5 22.6% | TNO stereo test Injurious crashes <500 arcseconds 59% ≥500 arcseconds 41% Non-injurious crashes <500 arcseconds 71.8% ≥500 arcseconds 28.2% Non-crash <500 arcseconds 75.7% ≥500 arcseconds 24.3% | Injurious crashes AV worse than 20/40 OR 1.6 (95% CI 0.6–3.8) SC ≤ 1.5 OR 0.9 (95% CI 0.4–1.8) Stereoacuity ≥500 arcseconds OR 2.2 (95% CI 1.1–4.1) Non-injurious crashes AV worse than 20/40 OR 1.6 (95% CI 0.7–3.6) SC ≤1.5 OR 0.7 (95% CI 0.3–1.3) Stereoacuity ≥500 arcseconds OR 1.2 (95% CI 0.7–2.3) | None | Good |
| Author, Country and Year | Sample, Age and Sex | Study Population | Visual Acuity * | Colour Vision * | Contrast Sensitivity * | Stereopsis * | Accidents ** | Association with RTA *** | Adjustment Variables | Quality Rating (NIH) |
|---|---|---|---|---|---|---|---|---|---|---|
| Davison England 1985 [30] | n = 1000 16 to 79 years old >55 years = 173 Male 83.7% | Private drivers | Keystone Telebinocular Binocular ≥ 6/7.5 93.6% 6/7.5 o 6/6.5 4.3% <6/7.5 2.1% | Keystone Telebinocular ≥1 colour plates misread 4.4% (5.3% of males) | - | Keystone Telebinocular Unsatisfactory (score < 4) 8.4% | Self-reported 13.4% within the previous 3 years | ≥55 years and binocular VA 6/9 or worst PR 7.68 (95% CI 2.47–23.88) | None | Poor |
| Ivers et al., Australia 1999 [31] | The Blue Mountains Eye Study n = 2379 >49 years old | Private drivers | Vectorvision CSV-1000 chart. Best eye < 20/40–20/60 4.3% <20/60 1.2% | - | Vectorvision CSV-1000 chart. Best eye 3 CPD 14.8% 6 CPD 15.9% 12 CPD 21.4% 18 CPD 25.3% | - | Self-reported 5.8% in the last 12 months | VI < 20/40–20/60 PR 1.3 (95% CI 0.6–2.8) VI < 20/60 PR 1.2 (95% CI 0.3–5.0) | Age, sex, past and current use of benzodiazepines, phenothiazines, and antidepressants, self-reported history of stroke, arthritis, angina, heart attack, hypertension, and diabetes, health status and hearing impairment | Poor |
| Mwangi Kenia 2001 [32] | n = 539 21 to 65 years old Male 99.6% | Public service vehicle drivers (van, minibus and bus) | Snellen Better eye ≥6/9 87.4% <6/9 12.6% | Ishihara Deficient 1.7% | - | - | Self-reported Included both minor and major accidents. 40.5% in the last 3 years | VI PR 1.17 (95% CI 0.94–1.46) Colour vision PR 1.38 (95% CI 0.76–2.50) | None | Poor |
| Abebe et al., Ethiopia 2002 [33] | n = 1879 Mean 33.5 (SD 10.2) years old Male 93.7% | Private, taxi, state or institutional drivers | - | Ishihara Abnormal 4.5% (Deuteranopes 65.9%, protanopes 34.1%) | - | - | Self-reported Any degree of damage inflicted on human beings or material damage caused by a motor vehicle: 21.2% in the past 3 years of active driving | Colour vision PR 1.54 (95% CI 1.11–2.13) | None | Fair |
| Oladehinde et al., Nigeria 2007 [34] | n = 215 21 to 75 years old Male 100% | Commercial drivers | Snellen Better eye Normal 96.7% <6/18–6/60 3.3% | Ishihara The only driver with colour vision abnormality was involved in RTA | - | TNO stereo test Does not report results | Self-reported History of RTA 26.5% | VI PR 3.50 (95% CI 2.38–5.14) Stereopsis PR 0.67 (95% CI 0.19–2.41) | None | Poor |
| Bekibele et al., Nigeria 2007 [13] | n = 99 38 to 60 years old Male 100% | Drivers from a college of medicine and a hospital | VI WHO definition3.3% | Ishihara Does not report results | - | - | Self-reported Mild (with no serious bodily injuries or damage to the vehicle), moderately serious or very serious (with major injuries/mortality or damage to the vehicle) 16,2% since they commenced driving. 4% in the last 5 years | VI < 6/18 OR 1.5 (95% CI 0.5–4.6) | None | Poor |
| Adekoya et al., Nigeria 2009 [35] | n = 399 Mean 44.7 (SD 10.1) years old Male 100% | Public transport, commercial intercity vehicle | Snellen Better eye VI WHO definition 2.8% FRSC 11.5% | Ishihara Abnormal colour vision: the inability to correctly identify 1 or more pseudoisochromatic plates 4.3% | - | - | Self-reported History of RTA 20.8% | VI < 6/9 RP 1.07 (95% CI 0.52–2.24) | None | Poor |
| Ovenseri-Ogomo et al., Ghana 2011 [16] | n = 206 18 to 68 years old Male 100% | Commercial drivers | Snellen ≥6/9 in the better seeing eye 87.9% <6/18–6/60 6.8% | Ishihara Abnormal 3.4% | - | - | Self-reported History of RTA Does not report prevalence data | VI was not significantly associated with a positive history of RTA (p = 0.050) None of those who had colour vision defect had a history of RTA | None | Poor |
| Isawumi et al., Nigeria 2011 [36] | n = 99 22 to 66 years old Male 100% | Commercial motor vehicle drivers (buses and taxis) | Snellen WHO classification Either eye ≥ 6/18 93.9% <6/18 6.1% | Ishihara Abnormal 6.1% (95%CI, 0.2–8.0) The abnormalities were distributed as deutan 1.0%, protan 4.1% and both 1.0% | - | - | Self-reported History of RTA 20.2% | VI PR 4.41 (95% CI 2.24, 8.69) Colour vision PR 1.72 (95% CI 0.52–5.75) | None | Poor |
| Onabolu et al., Nigeria 2012 [37] | n = 524 19 to 66 years Male 100% | Commercial drivers | Snellen Worse eye ≥ 6/12 88.4% <6/12 11.6% | - | - | - | Self-reported Previous RTA 18.1% | VI PR 0.51 (95% CI 0.23–1.12) | None | Poor |
| Korir Kenya 2012 [38] | n = 186 18 to 52 years Male 100% | Motorcycle riders | Lea test Better eye logMAR 0.2 and better 97.3% Worse 0.2 2.7% | Ishihara Abnormal 2.2% Missing 1.6% | - | Titmus 40 61.8% 50 to 400 32.3% 3000 to 0 4.3% Missing 1.6% | Self-reported Major (requiring medical attention at a medical facility) and minor (treated at site of the accident) and whether they were at fault 55.4% | VA PR 1.46 (95% CI 0.93–2.31) Colour vision PR 0.90 (95% CI 0.34–2.43) Stereopsis ≤ 3000 PR 1.14 (95% CI 0.66–1.98) | None | Poor |
| Omolase et al., Nigeria 2012 [39] | n = 90 22 to 70 years old Male 100% | Commercial intercity drivers | Snellen Better eye 6/5–6/18 97.8% 6/18–6/60 2.2% | Ishihara Normal 100% | - | - | Self-reported History of RTA 20% | VI PR 2.59 (95% CI 0.61–11.04) | None | Poor |
| Abraham et al., Nigeria 2013 [40] | n = 291 Mean 41.5 (SD 11.1) years old Does not report sex | Commercial drivers, active for at least three months | Snellen Better eye ≥ 6/9 93.1% ≤6/12 6.9% | Ishihara Abnormal 2.2% | - | - | Self-reported Included major and minor accidents. A major accident is one resulting in serious damage of the vehicle and/or causing any form of injury or death to person(s) or livestock. 24.7% | VI PR 1.63 (95% CI 0.55–4.87) None of the colour defective drivers was involved in RTA | None | Poor |
| Achigbu et al., Nigeria 2013 [41] | n = 615 Mean 38.1 (SD 10.3) years old Does not report sex | Commercial motorcyclists | Snellen Better eye ≥6/12 98.9% <6/18–3/60 1.1% | Ishihara Abnormal 2.6% | - | - | Self-reported History of RTA 57.7% | VI PR 1.49 (95% CI 1.10–2.04) Colour vision PR 1.65 (95% CI 1.42–1.91) | None | Poor |
| Pepple et al., Nigeria 2014 [42] | n = 400 25 to 62 years old Male 100% | Commercial drivers | Snellen WHO definition Good vision 98.2% Impaired vision 1.8% | Ishihara Abnormal 4.5% | - | - | Self-reported Major accident (damage to the vehicle beyond repairs or death to person(s) or livestock) and minor accident (damage to the vehicle but without loss of lives) 45.5% | VI PR 0.62 (95% CI 0.19–2.02) | None | Poor |
| Chidi-Egboka et al., Nigeria 2015 [43] | n = 328 20 to 70 years old Male 100% | Commercial drivers who drive four wheel vehicles and convey passengers both intra and intercity | Snellen FRSC standard for commercial driving (better or equal to 6/9 in the better eye and 6/24 in the second eye) Adequate 90.9% Inadequate 9.1% | Ishihara Abnormal 10.4% | - | - | Self-reported RTA in the last 5 years 19.5% | VA PR 1.42 (95% CI 0.75–2.69) Colour vision PR 0.99 (95% CI 0.47–2.11) | None | Poor |
| Okafor et al., Nigeria 2015 [44] | n = 407 Mean 43.4 (SD 10.8) years old No gender information | Intercity commercial minibus drivers | Snellen Better eye 6/5–6/9 90.2% ≤6/12 9.8% | - | - | - | Self-reported History of RTA 15.2% in the past 5 years | VA PR 0.96 (95% CI 0.51–1.79) | None | Poor |
| Boadi-Kusi et al., Ghana 2016 [45] | n = 520 Mean 39.2 (SD 11) years old Male 100% | Commercial vehicle drivers | ≥0.2 logMAR 97.5% <0.2 logMAR 2.5% | Hardy– Rand–Rittler Abnormal 7.1% Protan 45.9%, deutan 35.1%, tritan 18.9% | - | Randot Stereoacuity chart Abnormal 15.4% | Self-reported History of RTA 22.5% | Colour vision PR 1.63 (95% CI 1.02–2.61) Stereopsis PR 1.13 (95% CI 0.75–1.72) | None | Fair |
| Kshatri et al., India 2016 [46] | n = 195 22 to 65 years old Male 100% | Inter-state commercial drivers (truck drivers) | Snellen Better eye 6/5–6/18 94.4% 6/18–6/60 5.6% | Ishihara Normal 100% | - | - | Self-reported History of RTA 19% | VA PR 0.96 (95% CI 0.26–3.47) | None | Poor |
| Verma India 2016 [47] | n = 387 20 to 60 years old Mostly male | Drivers of private and public transport | Keystone DVS-GT Deluxe Vision Screener—Model # 1158WE Both eyes Acceptable: 6/6–6/12 90% Unacceptable: more than 6/12 10% | Keystone DVS-GT Deluxe Vision Screener—Model # 1158WE Acceptable: If subject identifies all three colours 86% Unacceptable: If the subject does not identify colours correctly 14% | Keystone DVS-GT Deluxe Vision Screener—Model # 1158WE Acceptable: Subject able to read within 40% contrast 96% Inacceptable: Subject unable to read within 40% contrast 4% | Keystone DVS-GT Deluxe Vision Screener—Model # 1158WE Acceptable: If both near and far signs are observed correctly 71% Inacceptable: The subject fails to identify the position of close and far away signs 29% | Organisational databases or self-reported crash history 67.4% | VA PR 1.47 (95% CI 1.32–1.64) Colour vision PR 0.86 (95% CI 0.68–1.08) CS PR was not calculated due to error in the data. Depth perception PR 1.7 (95% CI 1.52–1.90) | None | Poor |
| Vision Impact Institute India 2017 [48] | n = 627 20 to 70 years old Male 99.7% | Commercial drivers | Keystone View Vision Screeners test Binocular Unacceptable ≤ 20/50 16% Marginal 20/40 15% Acceptable ≥20/30 69% | Keystone View Vision Screeners test Red/green Unacceptable: None or 1 correct 19% Marginal: 2 correct 20% Acceptable: 3 correct 61% Blue/violet Unacceptable: None or 1 correct 23% Marginal: 2 correct 24% Acceptable: 3 correct 53% | Keystone View Vision Screeners test Unacceptable ≥ 60%: 4% Marginal 50%: 2% Acceptable ≤ 40%: 94% | Keystone View Vision Screeners test Unacceptable 32″ 68% Marginal 45″ 22% Acceptable 74 to 592″ 9% | Self-reported Crash history 4.3% | VA marginal/unacceptable PR 3.25 (95% CI 1.54–6.87) Does not report colour vision data Stereopsis marginal/unacceptable PR 1.98 (95% CI 0.27–14.43) | None | Poor |
| Okamura Japan 2019 [14] | n = 458 ≥40 years old Male 78.2% | General drivers | Log MAR Better eye < 0.7 Police-registered MVCs (with MVC 0%, without MVC 0.5%) Self-reported at-fault MVC (With MVC 0%, without MVC 0.5%) Police-registered MVCs: With MVC −0.03 [SD 0.08], without MVC −0.06 [SD 0.10] Self-reported at-fault MVC: With MVC −0.04 [SD 0.08], without MVC −0.06 [SD 0.10] | - | - | - | Police-registered at-fault MVCs, many of which resulted in injuries: 5% Self-reported in the previous five years, by level of severity (resulting in injury or in property damage only) and level of at-faultiness (not at fault, partially at fault, and at fault) Self-reported at fault 7% | Police-registered or self-reported: VA in better eye <0.7 p = 1.00 Police registered. VA in better eye (logMAR) p = 0.204 Self-reported VA in better eye (logMAR) p = 0.417 | None | Poor |
| Ojabo et al., Nigeria 2020 [15] | n = 122 18 to 56 years old Male 100% | Commercial vehicle drivers | Snellen Both eyes ≥6/12 98.4% <6/12 1.6% | - | - | - | Self-reported Involvement in RTA in the past 10 years 44.3% | The two drivers with impaired visual acuity have never had RTA | None | Poor |
| Okafor et al., Nigeria 2020 [49] | n = 315 21 to 70 years old Male 98.7% | Commercial long-distance drivers | Snellen Normal (6/6–6/18) 90.5% Visual impairment (<6/18–6/60) 8.9% Severe visual impairment (<60/60–3/ 60) 0.6% | - | - | - | Self-reported History of RTA 47.9% | VI PR 1.37 (95% CI 1.01–1.85) | None | Poor |
| Ahmed et al., Bangladesh 2022 [50] | n = 691 18 to 84 years old Male 100% | Bus drivers | Snellen Better eye ≤6/9 18% | - | - | - | Self-reported RTA while driving a bus or minibus 9% | VA 6/7.5 in better eye PR 1.36 (95% CI 0.78–2.39) | None | Poor |
| Vofo et al., Cameroon 2022 [51] | n = 207 22 to 72 years old Male 100% | Commercial vehicle drivers (bus, taxi, truck) | Snellen Better eye ≥6/9 85.9% <6/9 ≥ 6/12 3.9% <6/12 ≥ 6/18 7.2% <6/18 ≥ 6/24 2.9% <6/24 ≥ 6/36 0.5% | - | - | - | Self-reported RTA over the previous 10 years 59.9% | VA < 0.5 PR 1.71 (95% CI 1.46–2.01) | None | Poor |
Disclaimer/Publisher’s Note: The statements, opinions and data contained in all publications are solely those of the individual author(s) and contributor(s) and not of MDPI and/or the editor(s). MDPI and/or the editor(s) disclaim responsibility for any injury to people or property resulting from any ideas, methods, instructions or products referred to in the content. |
© 2025 by the authors. Licensee MDPI, Basel, Switzerland. This article is an open access article distributed under the terms and conditions of the Creative Commons Attribution (CC BY) license (https://creativecommons.org/licenses/by/4.0/).
Share and Cite
García-Lozada, D.; Rivera-Pinzón, F.; Ibáñez-Pinilla, E. Relationship Between Visual Acuity, Colour Vision, Contrast Sensitivity and Stereopsis, and Road Traffic Accidents: A Systematic Review and Meta-Analysis. Safety 2025, 11, 71. https://doi.org/10.3390/safety11030071
García-Lozada D, Rivera-Pinzón F, Ibáñez-Pinilla E. Relationship Between Visual Acuity, Colour Vision, Contrast Sensitivity and Stereopsis, and Road Traffic Accidents: A Systematic Review and Meta-Analysis. Safety. 2025; 11(3):71. https://doi.org/10.3390/safety11030071
Chicago/Turabian StyleGarcía-Lozada, Diana, Fanny Rivera-Pinzón, and Edgar Ibáñez-Pinilla. 2025. "Relationship Between Visual Acuity, Colour Vision, Contrast Sensitivity and Stereopsis, and Road Traffic Accidents: A Systematic Review and Meta-Analysis" Safety 11, no. 3: 71. https://doi.org/10.3390/safety11030071
APA StyleGarcía-Lozada, D., Rivera-Pinzón, F., & Ibáñez-Pinilla, E. (2025). Relationship Between Visual Acuity, Colour Vision, Contrast Sensitivity and Stereopsis, and Road Traffic Accidents: A Systematic Review and Meta-Analysis. Safety, 11(3), 71. https://doi.org/10.3390/safety11030071