Abstract
We report a new process technique for electrode manufacturing for all solid-state batteries. Porous electrodes are manufactured by a tape casting process and subsequently infiltrated by a plastic crystal polymer electrolyte (PCPE). With a following isostatic lamination process, the PCPE was further integrated deeply into the porous electrode layer, forming a composite electrode. The PCPE comprises the plastic crystal succinonitrile (SN), lithium conductive salt LiTFSI and polyacrylonitrile (PAN) and exhibits suitable thermal, rheological (ƞ = 0.6 Pa s @ 80 °C 1 s−1) and electrochemical properties (σ > 10−4 S/cm @ 45 °C). We detected a lowered porosity of infiltrated and laminated electrodes through Hg porosimetry, showing a reduction from 25.6% to 2.6% (NCM infiltrated to laminated) and 32.9% to 4.0% (LTO infiltrated to laminated). Infiltration of PCPE into the electrodes was further verified by FESEM images and EDS mapping of sulfur content of the conductive salt. Cycling tests of full cells with NCM and LTO electrodes with PCPE separator at 45 °C showed up to 165 mAh/g at 0.03C over 20 cycles, which is about 97% of the total usable LTO capacity with a coulomb efficiency of between 98 and 99%. Cycling tests at 0.1C showed a capacity of ~128 mAh/g after 40 cycles. The C-rate of 0.2C showed a mean capacity of 127 mAh/g. In summary, we could manufacture full cells using a plastic crystal polymer electrolyte suitable for NCM and LTO active material, which is easily to be integrated into porous electrodes and which is being able to be used in future cell concepts like bipolar stacked cells.
1. Introduction
Lithium-ion batteries have shown great application potential for mobile high-energy and fast charging devices (e.g., for cell phones or electric vehicles), which, furthermore, require a high current input and output [1,2]. For future designs of LIBs, conventional battery materials with liquid electrolytes clearly show limitations, especially in safety aspects (e.g., thermal runaway, self-inflammation) and therefore need extensive cooling [3,4,5] In addition, novel battery designs, especially in terms of flexibility, approach a certain degree of material elasticity at minimum material thickness. Thereof, especially the substitution of liquid electrolytes with solid-state electrolytes (SSE) towards an all-solid-state battery has been in the focus of research [6]. There are different categories upon SSEs, such as inorganic based (oxides, phosphates, sulfides), organic based (polymers, polymerized ionic liquids) and gel-based (liquid swollen separators or polymers) electrolytes [4,5,6,7]. Within those, solid polymer electrolytes (SPE) convince with a facile processability, low costs and adjustable material properties [7]. Some prominent materials among SPEs are polyethyleneoxide (PEO) [8] polyacrylonitrile (PAN) [9,10,11,12], polymethylmethacrylate (PMMA) and polyvinyldienefluoride (PVDF) [10,12]. Although SPEs often fail to reach required ionic conductivities, additives such as plastic crystals can enhance ionic conductivity while maintaining the solid character of the electrolyte. Succinonitrile (SN), a plastic crystal and derivate of succinic acid, was used as additive in various SPEs with PAN, PEO and PVDF [13,14,15,16,17,18,19,20,21,22]. Through its high polarity, SN favors the solvation of Li-salts and acts as a solvent in melt for polar polymers, whereby the use of critical solvents can be reduced. A very promising candidate is the combination of SN with PAN and Li-salts (e.g., LiTFSI), which reach an ionic conductivities of about 10−3 S/cm at room temperature and exhibits Young’s modulus of maximum 1.0 MPa [18]. The compatibility of SPEs containing SN with electrode materials like Li4Ti5O12 (LTO), LiaNixMnyCozO2 (NCM) or LiFePO4 (LFP) was widely investigated [13,14,15,16,17,18,19,20,21,22]. Bi et.al. combined SN with oxide electrolytes like LLTO (Li0.33La0.557TiO3) and PAN and reached stable cycling over 150 cycles with LFP [18]. Further, Patel et.al demonstrated a good cycling performance for SN-rich electrolytes with PAN additives in Li-metal|LFP cells delivering an average capacity 163 mA/hg [20]. Beside the optimization of the SPEs itself, the use of thermoplastic polymers also offers new possibilities for electrode manufacturing.
There are two main techniques for manufacturing of an electrode combined with a solid-state or polymer-based electrolyte: One option for fabrication is an infiltration-based process (infiltration electrode). It uses a conventional casted and dried porous electrode or membrane which is consequently infiltrated with the solid-state electrolyte phase to fill the open porosity and thus forming a lithium conductive network in the electrode [22,23,24,25]. An advantage of this method is the incorporation of the electrode manufacturing process from conventional porous electrodes for liquid electrolytes, thereby utilizing already existing knowledge and equipment. A disadvantage could be, that pores remain not infiltrated, if they are not accessible for the electrolyte and thus the full capacity of the electrode might not be reached.
Another option is a slurry-based process (composite electrode), in which all components (e.g., active particles, conductive carbon, binder and solid-state electrolyte) are dispensed in a solvent (e.g., NMP) and coated onto a current collector foil [26]. An advantage of that process is, that a homogeneous mixture of all components can be achieved through extensive mixing process [27]. A disadvantage is an open porosity after solvent evaporation, creating pores without electrolyte, leading to poor ionic contacts [28]. Moreover, the composite electrode recipes and mixing parameters have to be re-developed for that purpose. Recipes of an electrode for liquid electrolyte contain a lot of knowledge and empirical testing which will be even more complex, when casting composite electrodes with a PCPE.
The application of novel SN based electrolytes in an electrode infiltration process has not been investigated in depth yet. In this work, we use a solvent-free plastic-crystal-polymer electrolyte (PCPE), with SN, LiTFSi and PAN, to infiltrate conventionally casted porous NCM and LTO electrodes and prove their electrochemical function in a full cell setup. Basic chemical, electrochemical and material properties (melting point, rheology, ionic conductivity, voltage stability) of the SN:LiTFSI-PAN electrolyte are shown. Further, we investigated the influence of a followed hot-isostatic lamination process on the infiltration of PCPE into the electrodes. The pore filling was examined by Hg porosimetry measurements and FESEM-EDS analysis. Subsequently, the cell testing was conducted with the infiltrated LTO and NCM electrodes with a PCPE infiltrated fiber separator (named PCPIS). Cycling performance from 0.03C and 0.1C were measured, as well as 40 cycles at 0.1C. The C-rate performance from 0.03C up to 0.5C was finally characterized.
2. Materials and Methods
2.1. Preparation of the PCPE and PCPIS (Plastic-Crystal Polymer Infiltrated Separator)
For the preparation of the PCPE the following materials were obtained: succinonitrile (SN > 99% purity, TCI, Tokyo, Japan); Lithium bis(trifluoromethanesulfonyl)imide (LiTFSI > 99% purity, Iolitec, Heilbronn, Germany), Polyacrylonitrile (PAN, Mw 80.000, Dolan, Kelheim, Germany) and nonwoven glass fiber (NWG) (30 g/m2 density, R&G, Waldenbuch, Germany). PCPE samples were prepared by mixing LiTFSI (0.4 mol/L) with SN and 10 wt.% PAN at 75 °C under constant stirring and argon atmosphere (glovebox, H2O and O2 < 1 ppm, MBraun, Garching, Germany). A homogenous, clear to yellow viscous melt was finally obtained. This melt was further infiltrated into the NWG by hand at 80 °C by placing the NWG on a hot plate. Here, the NWG was placed on aluminum plate, which was heated from below. After, the infiltrated NWG was shrink-wrapped and pressed outside the glovebox with a lab press MB 20,400 VC (Schmidt Maschinentechnik, Dauphetal, Germany) at 80 °C with 0.1 N/mm2 for 3–5 min.
2.2. Cathode and Anode Preparation
For the cathode preparation, a N-Methyl-2-pyrrolidone, (NMP, Carl Roth, Germany, Karlsruhe) based slurry with NCM622 (LiNi0.6Mn0.2Co0.2O2, TDT011, Toda, Japan), conductive carbon (SuperPli, TIMCAL, Bodio, Switzerland) and PVDF (polyvinylidene fluoride 5130, Solvay, Hannover, Germany) was mixed in a dry room atmosphere (dry point: −40 °C) in a vacuum mixer (MSK-SFM-7, MTI, Japan). For the anode preparation LTO (Li4Ti5O12, MZT13-15, Huntsman, Salt Lake City, USA) was mixed in NMP with conductive carbon (, SuperPli, Imerys, Paris, France) and PVDF (5130, Solvay, Hannover, Germany). The slurries were doctor-bladed (ZAA 2300-slow, Zehntner, Schwerzenbach, Switzerland) onto aluminum current collector (30 µm thickness, Hydro, Oslo, Norway). Coatings were dried for 24 h at 80 °C, resulting in a thickness of 75 µm with 22 mg/cm2 active mass loading for the NCM cathode and 125 µm thickness with 23 mg/cm2 for the LTO anode, respectively.
2.3. Infiltration and Isostatic Lamination of Cathode and Anode with PCPE
The as prepared anodes and cathodes were heated up to 60 °C on a film applicator (ZAA 2300-slow, Zehntner, Schwerzenbach, Switzerland).
Infiltration: The molten PCPE was doctor bladed with 125 µm height and 1 mm/s on each electrode and let to cool down to room temperature for 1 h. The procedure was conducted in an argon filled glovebox.
Lamination: For isostatic pressing, the prepared electrodes covered by a polymer foil (PVDF, Mylar®, Germany) and sealed in an airtight aluminum pouch bag with a thick aluminum metal plate. Sealed pouches were laminated at 70 °C and isostatically pressed after a dwell time of 1 min with 200 bar for 10 min (Isostatic Laminator System IL4008, Keko, Zuzemberk, Slovenia). After the lamination process, electrodes were used for further characterization and cell assembly.
2.4. Material Analysis
Differential Scanning Calorimetry (DSC) experiments were carried out using a TA instruments (New Castle, DE, USA) DSC Discovery Series in a temperature range from −80 °C to 200 °C with 10 K/min heating rate and 5 K/min cooling rate. The sample was weighted in hermetically sealed aluminum pans under argon atmosphere. For equilibration, three heating and cooling cycles were performed, where the second heating cycle is shown here to evaluate solid-phase transitions and melting temperatures of the PCPE. In this experiment, one sample was measured, without double determination.
Thermal Gravimetric Analysis (TGA) was performed with TA instruments (DE, USA) TGA Q5000. Weight loss over temperature from 30 °C to 800 °C under nitrogen atmosphere was recorded. Samples were loaded in aluminum pans in a glove box under argon atmosphere and kept in a desiccator before placed into the instrument. A heating rate of 10 K/min was used. In this experiment from each material/compound one sample was measured.
The rheological flow behavior of the samples was investigated using a TA instruments (DE, USA) Discovery rheometer with 40 mm base plate and 2° cone plate. Stress and resulting viscosity at different shear rates of 1 s−1 and 1000 s−1 were recorded during cooling and heating from 80 °C to 40 °C with temperature hold every 10 K for 30 s. Samples were heated to 70 °C before the melt was placed on the preheated base plate. The sample was measured once, upon cooling and heating.
Mercury porosimetry measurements were conducted in accordance with ISO 15901-1:2016(E) using an AutoPore V Mercury Intrusion Porosimetry Analyzer (Micromeritics Unterschleißheim, Germany). Penetrometers for powder analysis usable for 5 ccm sample volume were applied. The analysis procedure covered a pressure range from 0.5 to 30.000 psi and 350 µm to 6 nm, respectively. For the evaluation of the measurement data, the sample weight was measured, considering that only the electrode, the infiltrated PCPE and its top layer contributing to a porosity. The aluminum substrate from the electrode is assumed to possess no measurable porosity. A sample of 2 × 2 cm2 of each electrode was used in the porosity measurement.
Electron microscopy was used for the high-resolution structure documentation. It was carried out with the field emission scanning electron microscope (FESEM) NVision 40 (Carl Zeiss Microscopy GmbH, Jena, Germany). The micrographs were made with the backscattered electron detector. We used the X-Max 150 Silicon Drift Detector (Oxford Instruments GmbH, Abingdon, UK) to display the element distribution over the electrode thickness. In order to visualize the structure of the electrodes, it was necessary to expose the internal structures without introducing artifacts. To characterize distribution of the active material and the organic components we used the ion beam slope cutting method [29,30] with the PECS II Model 685 (Gatan GmbH, München Germany) system for preparing sample cross-sections. Through that it is possible to achieve a clean cut through the entire electrode thickness.
For electrochemical impedance spectroscopy (EIS) an 18 mm diameter PCPIS was sandwiched between two 18 mm diameter stainless steel blocking electrodes and placed in test cells (ECC-Standard, EL-Cell GmbH, Hamburg, Germany). Temperature dependent (EIS, Interface 1010e, Gamry Instruments, Warminster, PA, USA) was carried out in a frequency range of 106 Hz to 1 Hz with an amplitude of 10 mV using blocking electrodes for determination of ionic conductivity. Temperature was varied from 80 °C to −20 °C with a temperature chamber (Espec). Temperature was decreased stepwise in 10 K intervals and held for one hour prior the EIS measurement for equilibration. For the evaluation, two samples were measured simultaneously.
2.5. Cell Preparation and Electrochemical Characterization
PCPIS samples were assembled for linear sweep voltammetry (LSV) in a test cell (ECC-Standard, EL-Cell, Hamburg, Germany) between a stainless-steel electrode and a reference electrode of lithiated graphite, each with diameter 18 mm. The graphite electrode was prepared by conventional doctor blading process, assembled in an LIB and fully lithiated. LSV (Interface 1000e, Gamry Instruments, Warminster, PA, USA) was performed at room temperature with 1 mV/s scan speed, in a voltage window from OCV to 5 V vs. Ref.
For electrochemical cycling measurements, full cells with PIC and PIA were assembled in test cells (ECC-Standard, El-Cell, Hamburg, Germany) in an argon filled glove box. All test cell parts were dried in a vacuum oven for 24 h at 105 °C and 40mbar. In the test cells, PCPIS with a diameter of 18 mm was placed between the two electrodes (LTO and NCM, respectively) of the same size. The spring in the test cell cause a pressure of about 12 N onto the 200–300 µm thick electrode stack. With the used electrodes having a diameter of 18 mm, the resulting contact pressure was 4.7 N/cm2.
Cycling experiments of full cells were conducted with a potentiostate (CTS, Basytec, Asselfingen, Germany) in climate-controlled chambers (T40/50, CTS, Hechingen, Germany). In case of full cell measurements, polymer infiltrated cathode and anodes (PIC and PIA) were punched to 18 mm diameter. The cell was stacked in the El-Cell as follows: PIC 18 mm| PCPIS 18 mm| PIA 18 mm. The cycling of different C-rates was conducted within a voltage range between 2.6 V and 1.0 V. Measurements were conducted at elevated temperature of 45 °C, if not mentioned differently. Cycling rates mentioned with C-rates in this manuscript are charge and discharge currents, which were calculated in respect to the electrodes nominal weight-capacity without infiltrated electrolyte.
3. Results and Discussion
3.1. Characterization of PCPE
From DSC experiments (Figure 1 left), two distinctive endothermic events upon heating from −80 °C to 200 °C were observed. The first endothermic peak at −41 °C (ΔHpc 1–2 J/g) is attributed to the solid-solid phase transition of SN in the PCPE, from crystalline to plastic crystalline (Tpc) [16,20]. The second endothermal signal at 42 °C (10 J/g) is attributed to the melting of the PCPE [20]. The observed transition temperatures were lower compared to pristine SN, but are in good agreement with values reported previously for similar systems [20]. Further TGA experiments (Figure 1—right) demonstrated, that the PCPE loose up to 3 wt.% until 114 °C due to sublimation of SN [31].
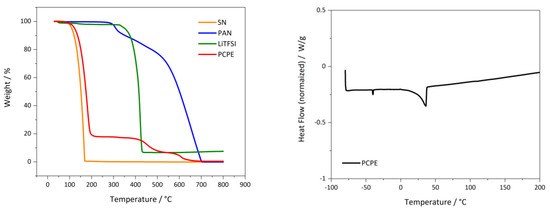
Figure 1.
(Left): TGA measurement of PCPE (SN + 10 % PAN + 0.4 m/l LiTFSI; (Right): DSC graphs of bulk electrolyte components and PCPE (SN + 10% PAN + 0.4 m/l LiTFSI) electrolyte.
In a melted phase, the PCPE exhibited a viscosity dependence on temperature and shear rate (Figure 2). Raising the temperature lowers the viscosity at 1 s−1 from 2.5 Pa s (40 °C) to 0.6 Pa s (80 °C). Additionally, increasing the shear rate to 1000 s−1 decreased viscosity to 0.9 Pa s (40 °C) and 0.4 Pa s (80 °C).
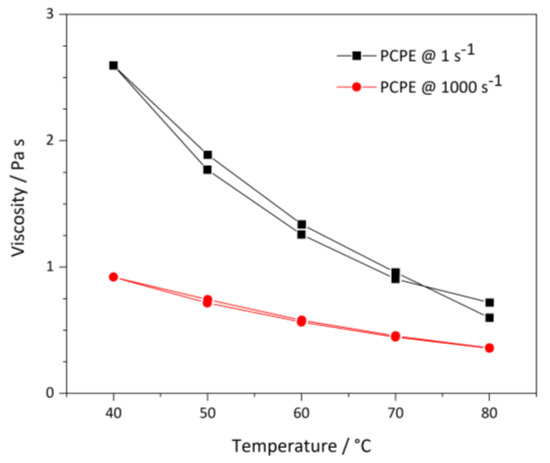
Figure 2.
Temperature dependent viscosity of the PCPE at 1 s−1 and 1000 s−1 sheer rate; two measurements each.
To avoid mass losses, but, at the same time, adjust the viscosity without applied shear forces, processing temperature for electrode infiltration and isostatic lamination process was set at 70–80 °C.
The temperature dependent ionic conductivity of the PCPE, infiltrated in glass nonwoven to avoid short circuits upon melting, is depicted in Figure 3—left. For the PCPIS, two distinctive temperature regions are observed. The ionic conductivity in Figure 3—left increases linear between −40 °C and 30 °C and finally shows a plateau between 40 °C and 80 °C. This can be attributed to the melting point of the system at 41 °C (DSC). At 20 °C, an ionic conductivity of 1.5 × 10⁻⁴ S/cm is achieved, which is further enhanced to 1.5 × 10⁻³ S/cm at 80 °C. Figure 3—right shows the linear sweep voltammetry (LSV) with 1 mV/s at room temperature of the PCPIS vs. lithiated graphite electrode. The current does not rise significantly until 4.2 V. Beyond this stability point, severe electrochemical degradation of the sample takes place resulting in an increased current. Thus, we can conclude for the PCPE sample an electrochemical stability up to 4.2 V, which indicates the compatibility with NCM electrodes.
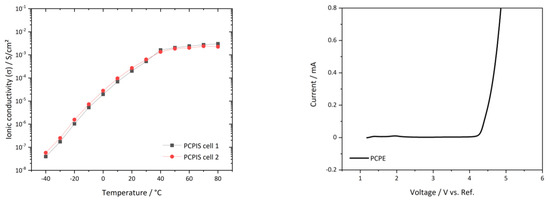
Figure 3.
(Left): Arrhenius graph derived from impedance spectroscopy of PCPE infiltrated separator (PCPIS) between −40 °C and 80 °C vs. steel electrode; (Right): Linear voltage sweep of PCPIS vs. lithiated graphite with 1 mVs-1; here shown a representative curve of three measured cells.
3.2. Porosity Measurement with PCPE Infiltrated Electrodes
Hg-porosimetry measurements are used to verify PCPE penetration into pores of the LTO and NCM electrodes. Through the hot-isostatic infiltration process, the PCPE is being pressed into the porous structure and is presumed to fill the open porosity of the electrodes. Using the Hg-porosimetry method we aim to detect the difference in the pore volume before and after the infiltration and subsequent lamination process of the electrodes. Therefore, the differential intrusion volume of the not infiltrated NCM and LTO electrode is compared with the PCPE infiltrated and the isostatic laminated electrode. Note that the Hg-porosity measurement device is not able to detect pores smaller than 6 nm or to discover closed porosity or cavities. In addition, in the data evaluation only pores of 10 µm and smaller were considered for the porosity calculation, as larger pores are attributed to measurement artefacts which arise from the surface of the sample. Moreover, we could not detect pores larger than 10 µm diameter neither in used LTO nor in NCM electrodes in the FESEM pictures (see Section 3.3). Hence, the intruded mercury volumes in a pressure range >18 psi were not considered. These two recalculation steps are necessary to determine the calculated porosity.
Figure 4—left shows the differential intrusion volume over the pore size of uninfiltrated (pristine), with PCPE infiltrated and with PCPE infiltrated+laminated NCM samples. Figure 4—right shows the intrusion of pristine, infiltrated and infiltrated and laminated LTO samples. In case of the pristine NCM electrode, we observed two peaks at 0.1 µm and 2 µm, which can be assigned to the main open porosity of the electrode. The porosity is the result of drying the electrode after doctor blading and elimination of solvent NMP. From 8 µm onwards, a steady increase of the Hg volume is observed, up to 10 µm. Note that the porosity above 10 µm was not considered in the porosity calculation, as measured values above this region mostly origin from different surface topology of the electrode. FESEM pictures (see Section 3.3) showed no sign for pores with diameters higher than 10 µm. In case of infiltrated NCM (red graph), we can see a complete extinction of the first peak at 0.1 µm and a drastic decrease of the peak at 2–3 µm pore size, meaning pores in this region are already filled to a certain degree with the PCPE. After undergoing the lamination process (blue graph), those peaks are further reduced to a very low and not visible differential intrusion below 0.01 mL/g at 1–2 µm pore size. The overall porosity below 10 µm of the uninfiltrated NCM electrode was calculated with 25.6%, where the porosity of infiltrated NCM was 4.9%. After the lamination process, infiltrated and laminated NCM shows a residual open porosity of 2.6%, which is by factor 8 lower than for pristine NCM. Figure 4—right shows the differential intrusion over the pore size of the LTO samples. The pristine LTO sample shows one major peak at 0.2 µm pore size, which can be attributed to pores emerging from the electrode drying process. After the PCPE infiltration, the peak’s maximum reduces from 0.5 mg/L to 0.15 mg/L. Further, after the lamination process pore volume is once more reduced to <0.05 mg/L, indicating that pores are successfully filled by the PCPE. Figure 5 shows the calculated porosity values, which are reduced from 32.9% in pristine LTO to 13.2% in infiltrated LTO and further reduced to 4.0% in case of the infiltrated and laminated LTO. Thus, from the porosity measurements can be concluded that the infiltration of electrodes with PCPE is successful. The application of isostatic lamination further improves the intrusion of electrolyte especially for electrodes with small pore volume, i.e., the LTO electrode.
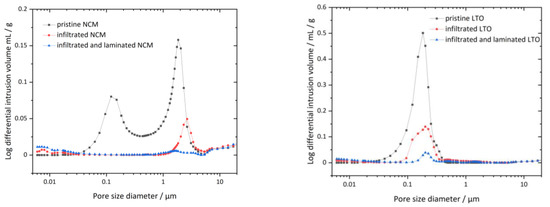
Figure 4.
Pore size distribution measured through Hg-porosimetry; (Left): NCM; black: porous NCM electrode; red: PCCE infiltrated NCM; blue: PCPE infiltrated and isostatically laminated NCM; (Right): LTO; black; porous LTO electrode; red: PCPE infiltrated LTO electrode; blue: PCPE infiltrated and isostatically pressed LTO electrode.
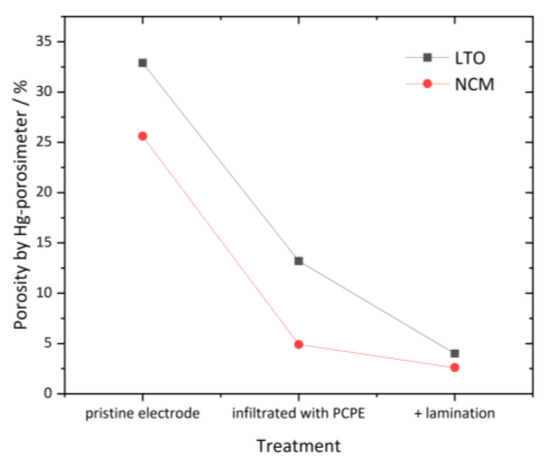
Figure 5.
Calculated porosity values of LTO and NCM electrodes measured by Hg-porosimetry to determine grade of polymer intrusion; calculation method is described in the supplementary results.
3.3. Cross-Section Analysis by FESEM-EDS of PCPE Infiltrated Electrodes
Prepared cross-sections of the uninfiltrated, infiltrated and further laminated electrodes were examined with FESEM to determine the degree of PCPE filling. By analyzing sulfur, introduced in PCPE by LiTFSI, EDS-spectroscopy can be used to record map distribution of the PCPE in the electrode. It must be taken into account that sublimation of SN during the ion-beam cross-section preparation might occur, which leads to a certain degree of SN loss. Figure 6A,B show the FESEM and EDS images of the LTO electrode without PCPE, revealing no sulfur content in Figure 6B. The infiltrated electrode in Figure 6C,D show a coated layer of PCPE on top of the electrode. An increased sulfur concentration in the top layer as well as in the cross-section of the electrode can be found. Figure 7A,B show the NCM electrode without PCPE infiltration, where NCM granules can be clearly distinguished from conductive carbon. The EDS mapping shows apart from detector noise no sulfur contrast. Figure 7C,D show the PCPE infiltrated and laminated electrode, revealing a dense top layer and NCM granules surrounded by darker material. In comparison with Figure 7A, the material contrast changes drastically and is more comparable to the material contrast of the top layer, which most likely corresponds to the PCPE. Furthermore, the EDS-spectrum reveals a significant sulfur concentration especially in the top layer and around the NCM granules. We can conclude that in case of the PCPE infiltrated and laminated NCM electrode, a noticeably amount of electrolyte as lithium conductive phase is present. When comparing the results from FESEM-EDS with Hg-porosimetry, we observe that less electrolyte filling in the electrode is observed from FESEM-EDS, as expected from Hg-porosimetry data. A reason for this might be the visible electrolyte top layer (Figure 6 and Figure 7C,D), which influences measured porosity values, as it inhibits the intrusion across the surface during measurement. Nevertheless, we can observe a decrease in unfilled porosity and a significant sulfur concentration revealed by FESEM-EDS measurements in case of the infiltrated and laminated electrodes. Further experiments described later in this work show the good electrochemical performance of cells with the laminated electrodes. As stated above, especially characterization methods relying on vacuum techniques (e.g., FESEM and ion beam preparation techniques) are challenging for SN containing electrolytes, as evaporation of SN especially small thin areas, cannot be fully excluded. Hence, the precise analysis of polymer and plastic crystal electrodes through FESEM-EDS and Hg-porosimetry still remains a topic for further research activities.
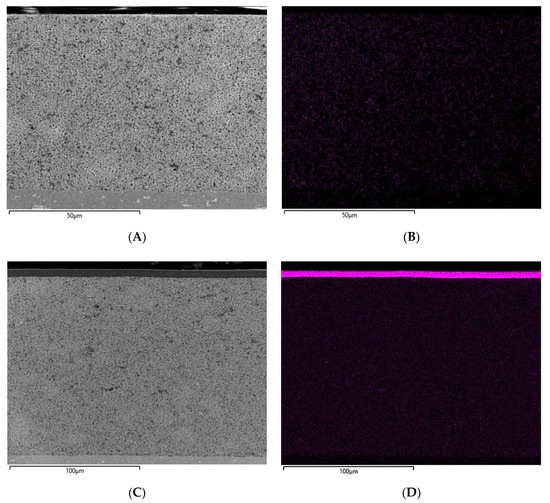
Figure 6.
FESEM cross-section (SE-detector) prepared by focused ion beam of: (A) sample of pristine LTO without PCPE; (B) EDS mapping of sulfur in pristine LTO (control sample); (C) infiltrated and laminated LTO sample with PCPE; (D) EDS mapping of sulfur in infiltrated and laminated LTO with PCPE.
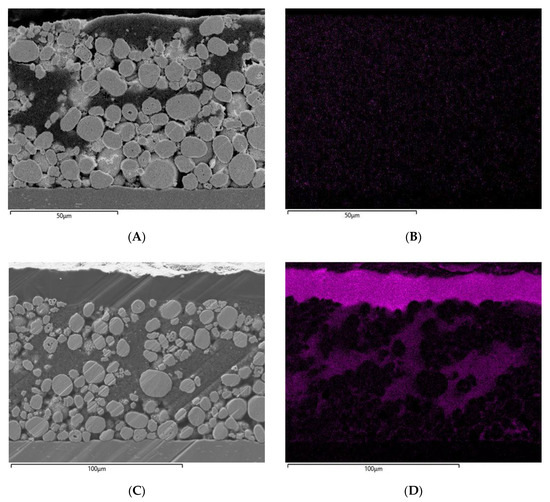
Figure 7.
FESEM cross-section (SE-detector) prepared by focused ion beam of: (A) sample of pristine NCM without PCPE; (B) EDS mapping of sulfur in pristine NCM (control sample); (C) infiltrated and laminated NCM sample with PCPE; (D) EDS mapping of sulfur in infiltrated and laminated NCM.
3.4. Cycling Performance of PCPE Based Electrodes in Full Cell Setup
Three different focuses were set to evaluate the cycling performance of the infiltrated+ laminated electrodes. Firstly, three cells were built and cycled with 0.03C and 0.1C to evaluate the capacity and cycling behavior in short term cycling and acquire the coulombic efficiency. Secondly two cells were built for cycling tests over 40 cycles with 0.1C to examine possible capacity decline. Thirdly, three cells were built to evaluate the C-rate capability of the system ranging from 0.03C to 0.5C, with five cycles each, to estimate the C-rate limit of the system.
For evaluating the C-rate and cycle capacity, full cells with infiltrated and laminated NCM and LTO were assembled and measured with 0.03C at 45 °C for 3 cycles, subsequently for 12 cycles at 0.1C and finally at 2 cycles at 0.03C. Figure 8 left shows the capacities of 3 identically prepared and measured cells. We noticed a high initial discharge capacity at 0.03C ranging from 155 to 160 mAh/g and after 20 cycles at 0.1C a capacity ranging from 147 to 150 mAh/g. The final two 0.03C cycles show discharge capacity values between 148 and 150 mAh/g. Figure 8 right shows the coulombic efficiency, which is between 95.4% and 98.8%, indicating that charge capacity is slightly higher. The following 0.1C cycles show a coulombic efficiency between 96.8% and 99%, decreasing to 98% at the last two 0.3C cycles. The loss in coulombic efficiency in the beginning might be attributed to an electrolyte side reaction. Regarding the fact that the used NCM622 is limiting the electrode to 165 mAh/g, a practically achieved capacity at 0.03C of 160 mAh/g (97% of the possible capacity) indicates that the PCPE percolation in the electrode is sufficient for lithium conductive network. This supports the data revealed by Hg-porosimetry, where only 2.6% was not infiltrated by the PCPE. This shows that a solid-state battery with PCPE can be assembled in a full cell configuration and cycled at 0.03C and 0.1C. To visualize the difference between charge and discharge capacity, voltage-capacity curves of cell 1 in Figure 8 left were extracted and shown in Figure 9.
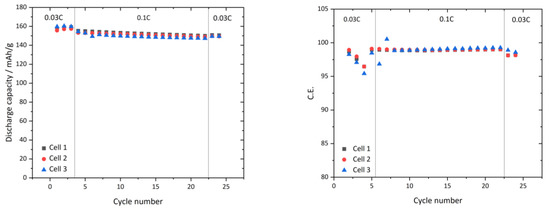
Figure 8.
(Left): 0.03C and 0.1C capacity of 3 full cells with infiltrated and laminated NMC and LTO, respectively with PCPIS at at 45 °C; (Right): coulomb efficiency of tested cells shown on the left.
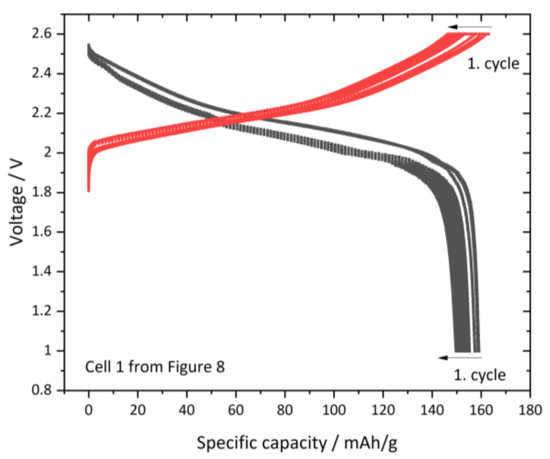
Figure 9.
Extracted capacity voltage curves of full cell 1 from Figure 8; red: charge curve; black: discharge curve.
In Figure 9, we can observe that the discharge cycle (black) from ~2.5V down to 1 V reaches up to 159 mAh/g. After a voltage relaxation phase the charge step (red) is applied between 1.8 V and 2.6V reaching up to 163 mAh/g in the first cycle. The voltage-time curve is shown in the supplementary Figure S1 illustrating the voltage relaxation phase, according to the cycling program between charge and discharge cycle. The fact that the full cell does not reach the maximum discharge capacity can have three origins: Either the NCM or the LTO or both electrodes limit the capacity. In the full cell setup, it is not possible to distinguish, which electrode is dominating the limitation. Due to the fact, that half-cell setups with metallic lithium are not compatible with an SN based electrolyte, it difficult to obtain performance values of the single electrode. When referring to the Hg-porosity data we observed a higher left porosity in the infiltrated and laminated LTO electrode, which could suspect LTO as the limiting electrode. Further experiments with specialized FESEM techniques trace and quantify the lithium conductive network in those electrodes might be a step for upcoming work in this field.
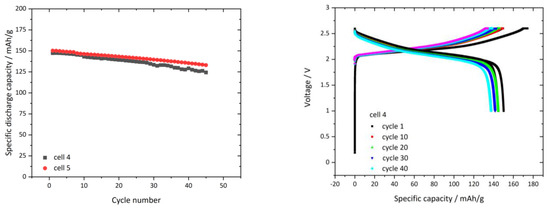
In Figure 10—left, the cylcing performance of two cells cycled at 0.1C for 40 cycles is shown. The voltage-capacity curves of cell 4 (black dotted) were extracted and displayed in Figure 10—right. We observe an initial discharge capacity of 146 mAh/g (cell 4) and 150 mAh/g (cell 5), which declines to 132 mAh/g (cell 4) and 124 mAh/g (cell 5), respectively, after 40 cylces. The capacity loss shows a linear behavior. The voltage capacity plot in Figure 10—right shows a high initial charge capacity of 174 mAh/g. We can conclude that the extended cylcing test give promising results about a long term cyclability, but show a capacity degradation, which has to be examined and remedied. A possible reason for the capacity loss might be reductive or oxidative (or both) reactions of the PCPE, which accumulate over the cycles and thus lead to an accumulating layer on the acitve material, which reduced the capacity. As half cell measurements were not conducted, the origin can currently not be distinguished. We believe that at 2.6 V vs. LTO electrode in the full-cell, minor reactions could occur at the NCM. This can be supported by the LSV measuremt (Figure 3—right), which shows at 4.2 V vs. lithiated graphited a beginning oxidative current. As Figure 8 right shows a decreased in coulomb efficiency in the first cycles at 0.03C, compared to the following cycles, occurs, which can indicate a reaction at the PCPE. Further work is planned to clarify the origin of the capacity loss and if electrochemically induced oxidative reactions occur in the PCPE.
C-rate performance from 0.03C to 0.5C:
Figure 11 shows full cell tests at different C-rates with infiltrated and laminated NCM/LTO electrodes cycled at 45 °C. Supplementary Table S1 shows the median capacity values with its standard deviation of the measured cells in Figure 11. We can observe a high discharge capacity of 153 and 149 mAh/g with a low deviation at 0.03 and 0.05C. When increasing the C-rate to 0.1C or 0.2C, we can see a drop in mean capacity values to 135 ± 7 and 126 ± 10.5 mAh/g. When further increasing the C-rate to 0.5C, we observe a massive capacity drop to 25.9 ± 1.7 mAh/g. This may be due to several reasons, including diffusion limitation within the individual battery components (both electrodes or electrolyte). We can conclude that the here presented battery with a PCPE is able to give high reliable capacity values at 0.03C, 0.05C and 0.1C. However, for more detailed information on high current rate performance, more in-depth analysis is necessary. For future works we propose the following optimization, to achieve higher capacity and a higher infiltration degree: Firstly, an improved NCM cathode, with a large skeleton density, larger NCM granuels and less and better distributed carbon black in order to maintain good accesible porosity. In addition, we propose a lowered viscosity of the PCPE, specially designed for the LTO infiltration. Moreover, multiple infiltration steps could contribute to a higher degree of infiltration, which might also be possible with low viscous PCPE. Thirdly, the separator infiltration process might be also improved by a vacuum infiltration, which are currently ongoing investigations.
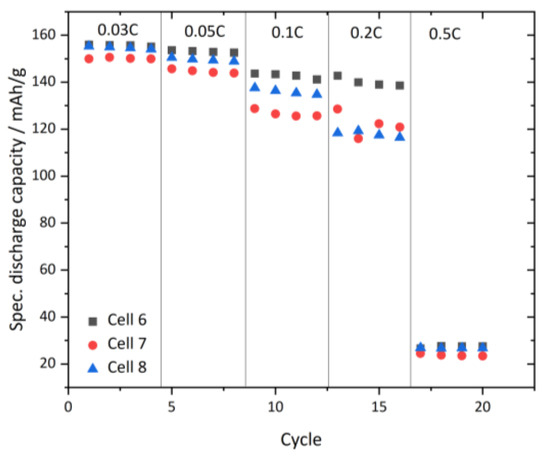
Figure 11.
C-rate testing of full cells with infiltrated and laminated NCM and LTO electrodes, at 45 °C.
4. Conclusions
We successfully showed the preparation and characterization of a lithium-ion solid-state battery based on a succinonitrile, polyacrylonitrile and LiTFSI electrolyte, combined with NCM and LTO electrodes. The electrolyte shows favorable thermal properties for battery application in the manufacturing and operating temperature window between 40 °C and 70 °C. The low viscosity of the electrolyte facilitates the electrode infiltration process. The ionic conductivity of the plastic crystal polymer electrolyte was determined in the region of 10−3 S/cm at 40 °C, showing a plateau at 5 × 10⁻³ S/cm between 40 and 80 °C. Hg-porosimetry measurements show a strong decrease in the differential intrusion volume of the infiltrated and laminated electrodes, decreasing from 32.9% to 4% for the infiltrated and laminated NCM and from 25.6% to 2.6% for the identical treated LTO electrode. Cross-sections in FESEM images and EDS mapping showed a PCPE top layer onto the electrodes and a homogeneous sulfur distribution from the LITFSI in the electrode. However, we cannot fully verify the filling degree of PCPE filled electrode due to limitations in analysis technique. We successfully cycled those cells at 0.03C, 0.05C and 0.1C at 45 °C showing between 153 mAh/g and 131 mAh/g discharge capacity. Cycling over 40 cycles reached, initially, 150 mAh/g with a discharge capacity decrease over time, which might originate from an electrolyte reaction. We can conclude that despite of not fully verifiable infiltration grade according to FESEM-EDS measurements, we could show a reasonable cyclability of the system. For future experiments, an optimization of the infiltration process of PCPE in the separator through vacuum technique and an improved electrode design with better accessible pores are planned.
Supplementary Materials
The following are available online at https://www.mdpi.com/2313-0105/7/1/11/s1, Figure S1: Full cell voltage from Figure 8; Figure S2: Photography of laminated electrode; Table S1: Linear Fitting of capacities of cell Figure 11; Table S2: Calculated mean capacity values from cell of Figure 11; Table S3: Abbreviations used in the manuscript.
Author Contributions
Conceptualization: M.C.; experimental work: M.C., V.v.L., F.L., A.P. and S.H. writing—original draft preparation: M.C., V.v.L. and F.L.; visualization: M.C., V.v.L. and F.L.; supervision: K.K. and S.R., project leading: M.W. All authors have read and agreed to the published version of the manuscript.
Funding
This work was supported by the Fraunhofer Internal Programs under Grant No. MAVO 836 915.
Institutional Review Board Statement
No applicable.
Informed Consent Statement
No applicable.
Data Availability Statement
No applicable.
Acknowledgments
The authors thank for the preparation and measuring of the electrode samples with FESEM-EDS prepared by ion-beam cross section by S. Höhn (IKTS, Ceramography and Phase Analysis).
Conflicts of Interest
The authors declare no conflict of interest.
References
- Zeng, X.; Li, M.; El-Hady, D.A. Commercialisation of lithium battery technologies for electroc vehicles. Adv. Energy Mater. 2019, 9, 1900161. [Google Scholar] [CrossRef]
- Li, J.; Du, Z.; Ruther, R.E. Toward low-cost, high, energy, and high-power density lithium-ion batteries. Miner. Met. Mater. Soc. 2017, 69, 1484–1496. [Google Scholar] [CrossRef]
- Henriksen, M.; Vaagsaether, K.; Lundberg, J. Explosion characteristics for Li-ion battery electrolytes at elevated temperatures. Hazard. Mater. 2019, 371, 1–7. [Google Scholar] [CrossRef]
- Mevawalla, A.; Panchal, S.; Tran, M.-K. Design of a Hybrid Electric Vehicle Powertrain for Performance Optimization Considering Various Powertrain Components and Configurations. Mdpi Batter. 2020, 6, 1–26. [Google Scholar]
- Jilte, R.; Afzal, A.; Panchal, S. A novel battery thermal management system using nano-enhanced phase change materials. Energy 2021, 219, 119564. [Google Scholar] [CrossRef]
- Wu, Z.; Xie, Z.; Yoshida, A. Utmost limits of various solid electrolytes in all-solid-state lithium batteries: A critical review. Renew. Sustain. Energy Rev. 2019, 109, 367–385. [Google Scholar] [CrossRef]
- Randau, S.; Weber, D.A.; Kötz, O. Benchmarking the performance of all-solid-state lithium batteries. Nat. Energy 2020, 5, 259–270. [Google Scholar] [CrossRef]
- Xue, Z.; He, D.; Xie, X.J. Poly (ethylene oxide)-based electrolytes for lithium-ion batteries. Mater. Chem. A 2015, 3, 19218. [Google Scholar] [CrossRef]
- Hu, P.; Chai, J.; Duan, Y.J. Progress in nitrile-based polymer electrolytes for high performance lithium batteries. Mater. Chem. A 2016, 4, 10070–10083. [Google Scholar] [CrossRef]
- Arya, A.; Sharma, A.L. Polymer electrolytes for lithium ion batteries: A critical study. Ionics 2017, 23, 497–540. [Google Scholar] [CrossRef]
- Mindemark, L.; Lacey, M.J.; Brandell, T. Beyond PEO—Alternative host materials for Li+-conducting solid polymer electrolytes. Prog. Polym. Sci. 2017, 81, 114–143. [Google Scholar] [CrossRef]
- Tang, S.; Guo, W.; Fu, Y. Advances in composite polymer electrolytes for lithium batteries and beyond. Adv. Energy Mater. 2020, 11, 2000802. [Google Scholar] [CrossRef]
- Fan, L.-Z.; Hu, Y.-S.; Bhattacharyya, J. Succinonitrile as a versatile additive for polymer electrolytes. Adv. Funct. Mater. 2007, 17, 2800–2807. [Google Scholar] [CrossRef]
- Abouimrane, A.; Davidson, I.J. Solid electrolyte based on succinonitrile and LiBOB: Interface stability and application in lithium ion batteries. J. Electrochem. Soc. 2007, 154, A1031–A1034. [Google Scholar] [CrossRef]
- Kim, G.Y.; Petibon, R.; Dahn, J.R. Effects of succinonitrile (SN) as an electrolyte additive on the impedance of LiCoO2/graphite pouch cells during cycling. J. Electrochem. Soc. 2014, 161, A506–A512. [Google Scholar] [CrossRef]
- Alarco, P.J.; Lebdeh, Y.B.; Aboumirane, A. The plastic-crystalline phase of succinonitrile as a universal matrix for solid-state ionic conductors. Nat. Mater. 2004, 3, 476–481. [Google Scholar] [CrossRef]
- Fan, L.-Z.; Meier, J. Composite effects in poly (ethylene oxide)-succinonitrile based all-solid electrolytes. Electrochem. Commun. 2006, 8, 1753–1756. [Google Scholar] [CrossRef]
- Bi, J.; Mu, D.; Wu, B.; Fu, J.; Yang, H.; Mu, G.; Wu, F. A hybrid solid electrolyte Li0.33La0.557TiO3/poly (acylonitrile) membrane infiltrated with a succinonitrile-based electrolylte for solid state lithium-ion batteries. Mater. Chem. A 2020, 8, 706–713. [Google Scholar] [CrossRef]
- Raut, P.; Li, S.; Chen, Y.-M. Strong and flexible composite solid polymer electrolyte membranes for Li-Ion batteris. Acs Omega 2019, 4, 18203–18209. [Google Scholar] [CrossRef]
- Patel, M.; Bhattacharyyam, A.J. Plastic-polymer composite electrolytes: Novel soft matter electrolytes for rechargeable lithium batteries. Electrochem. Commun. 2008, 10, 1912–1915. [Google Scholar] [CrossRef]
- Zhou, Y.; Zhang, F.; He, P.; Zhang, Y.; Sun, Y.; Xu, J.; Wu, X. Quasi-solid-state polymer plastic crystal electrolyte for subzero lithium-ion bateries. Energy Chem. 2020, 46, 87–93. [Google Scholar] [CrossRef]
- Zhang, Q.; Liu, K.; Ding, F. Enhancing the high voltage interface compatibility of LiNi0.5Co0.2Mn0.3O2 in the succinonitrile-based electroylte. Electrochim. Acta 2019, 298, 818–826. [Google Scholar] [CrossRef]
- Kim, D.H.; Oh, D.Y.; Park, K.H. Infiltration of solution-processable solid electrolytes into conventional Li-ion-battery electrodes for all-solid-state Li-ion batteries. Nano Lett. 2017, 17, 3013–3020. [Google Scholar] [CrossRef] [PubMed]
- Wu, F.; Zhao, E.; Gordon, D. Infiltrated porous polymer sheets as free-standing flexible lithium-sulfur battery electrodes. Adv. Mater. 2016, 28, 6365–6371. [Google Scholar]
- Pandey, G.P.; Klankowski, S.A.; Li, Y. Effective infiltration of gel polymer electrolyte into silicon-coated vertically aligned carbon nanofibers as anodes for solid-state lithium-ion batteries. Acs Appl. Mater. Interfaces 2015, 7, 20909–20918. [Google Scholar] [CrossRef]
- Oh, D.Y.; Kim, D.H.; Jung, S.H.; Han, J.G.; Choi, N.S.; Jung, Y.S. Single-step wet-chemical fabrication of sheet-type electrodes from solid-electroylte precoursors for all-solid-state lithium-ion batteries. Soc. Chem. 2017, 5, 20771–20779. [Google Scholar]
- Oh, D.Y.; Kim, Y.J.; Park, K.H. Slurry-Fabricable Li+-Conductive Polymeric Binders for Practical All-Solid-State Lithium-Ion Batteries Enabled by Solvate Ionic Liquids. Adv. Energy Mater. 2019, 16, 1802927. [Google Scholar] [CrossRef]
- Nam, Y.J.; Oh, D.Y.; Jung, S.H.; Jung, Y.S. Toward practical all-solid-state lithium-ion batteries with high enery density and safety: Comparative study for electrodes fabricated by dry-and slurry-mixing process. Power Sources 2018, 31, 93–101. [Google Scholar] [CrossRef]
- Hauffe, W.; Obenaus, P.; Herrmann, M. Einsatz des Ionenstrahl-Böschungsschnitt-Verfahrens zur Untersuchung des Gefüges von Komposit-Keramiken mit extrem unterschiedlichen Komponenten (BN/TiB2) im Rasterelektronenmikroskop. Prak. Metallogr. 2004, 41, 343–353. [Google Scholar]
- Grünewald, W. Ion Beam Prep. of Samples for SEM. Application Booklet, Leica Microsystems. Available online: https://analyticalscience.wiley.com/do/10.1002/imaging.6545 (accessed on 26 January 2021).
- Gupta, R.K.; Rhee, H.W. A Detailed Investigation into the Electrical Conductivity and Structural Properties of [Poly(ethylene oxide)-succinonitrile}-Li(CF3SO2)2]N Solid Polymer Electrolytes. Bull. Korean Chem. Soc. 2017, 38, 356–363. [Google Scholar] [CrossRef]
Publisher’s Note: MDPI stays neutral with regard to jurisdictional claims in published maps and institutional affiliations. |
© 2021 by the authors. Licensee MDPI, Basel, Switzerland. This article is an open access article distributed under the terms and conditions of the Creative Commons Attribution (CC BY) license (http://creativecommons.org/licenses/by/4.0/).