Abstract
This paper investigates the flame behavior and smoke pattern characteristics of lithium-ion battery (LIB) fires using an integrated experimental and numerical simulation approach. Based on fire dynamics theory, a jet flame model for LIB thermal runaway (TR) is developed to analyze the flame height and dynamic characteristics. The results reveal two distinct regimes in LIB jet flames: momentum-controlled dominance in the early TR stage (lasting approximately 3 s) and buoyancy-controlled dominance in subsequent combustion. The jet flame shifts from a momentum-dominated regime (Fr > 5) to a buoyancy-dominated plume (Fr < 5) as the vent velocity decays below 12 m/s. The simulated flame heights align with experimental measurements and the Delichatsios model, validating the numerical approach. Furthermore, the distribution of flame components (e.g., H2, CO, CO2, CH4, C2H4) is analyzed, highlighting the influence of multi-component gases on combustion heterogeneity. Smoke pattern analysis demonstrates that soot deposition varies significantly between momentum- and buoyancy-controlled stages, with the former producing darker, concentrated deposits and the latter yielding wider, lighter patterns. These findings provide a theoretical basis for forensic fire investigation (accident reconstruction) and targeted suppression strategies for different combustion stages.
1. Introduction
Li-ion battery have been widely used in energy storage and automobiles in recent years due to its high energy storage density, excellent cyclability, and low self-discharge rate [1]. However, the Li-ion battery is also known to pose a high fire and explosion risk due to high temperatures, overcharging, and pressure [2,3]. Therefore, the study of the fire characteristics of Li-ion is important for safety, and it has drawn much attention from previous researchers [4,5,6]. There are many stages of Li-ion battery fire, including the vent disk braking, the gas jet appearing, the jet flame forming, and the extinguishing stage. The initial gas is primarily composed of electrolyte vapor, hydrogen, methane, ethylene, ethane, carbon monoxide, and other hydrocarbons, with a gas temperature of approximately 120 °C. The jet flame forms after gas is released, during which a large amount of energy is released, and the jet flame temperature is approximately 700 °C. The jet flame is the type of phenomenon that occurs in TR, and the flame characteristics are different from those of a normal jet flame. The vent gas contains multiple components, including flammable species and inert gases, which contribute to the complex combustion process of the battery jet flame.
Computational Fluid Dynamics (CFD) frameworks are widely employed to investigate LIB thermal runaway. These frameworks integrate physicochemical models—such as Arrhenius kinetics for reaction rates and Large Eddy Simulation (LES) for turbulence—to describe the governing mechanisms, while utilizing numerical discretization methods (e.g., the Finite Volume Method) to solve the resulting complex system of non-linear partial differential equations. Numerical simulation methods are used to study the thermal runaway of a lithium-ion battery. Kong et al. [7,8] developed a lumped model to predict the thermal reactions, gas release characteristics, and jet dynamics of lithium-ion battery thermal runaway within the framework of OpenFOAM. They also studied the thermal runaway behavior with different battery materials and heating conditions. The TR propagation behaviors were also studied with a numerical method [9]. S. Hoelle et al. [10] studied the heat release model of battery cell thermal runaway (TR) on the Simcenter Star-CCM+ platform. Yuedong Sun et al. [11] studied heating power and energy effects on the TR characteristics of a lithium-ion battery module based on the Comsol Multiphysics. Andrii Gavryliuk et al. [12] used FDS to simulate the e-vehicle fires with the generalized chemical hydrocarbon formula C6H6O. Mingyi Chen et al. [13] established an individual cell fire model with a defined HRR profile of the cell using experimental data. Baopeng Xu et al. [14] simulated the thermal response and thermal runaway behavior of a lithium battery pack under external fire conditions, and the HRR curves for 100% and 75% SOC were fitted with experimental data. Guanqing Wang et al. [15] developed a three-dimensional numerical model for lithium battery thermal runaway that considers the internal pressure and the jet flame of vent gases. Ankur Jain et al. [16] investigated the multimodal heat transfer, Arrhenius heat generation, turbulent fluid flow, flame behavior, and the propagation of thermal runaway in battery cells. Pierre-Alexandre Barré et al. [17] developed a numerical model for thermal runaway in e-V fires, identifying the composition of gas flowing through the pressure vent, the flow rate, and the peak HRR. Sascha Voigt et al. [18] developed a battery combustion model using the ANSYS FLUENT platform to predict the HRR. The primary fuel of the jet flame for battery TR is the released vent gases, which are composed of many components, including H2, CH4, C2H4, and CO2. The combustion of a multi-component gas jet flame is much complex than a normal jet flame, including chemical reaction and flame behaviors. Despite these advances, most existing models focus on thermal behavior and turbulent flame propagation, with limited attention to the distinct regimes of jet flame combustion—specifically, the transition from momentum-dominated to buoyancy-controlled flow—and its impact on flame characteristics and soot deposition. Furthermore, the presence of multi-component gases (e.g., H2, CO, C2H4) alters combustion efficiency and soot production, as noted by Dong et al. [19], but their spatial distribution in LIB jet flames remains underexplored.
Smoke patterns, resulting from soot deposition on surfaces, serve as key evidence in fire investigations. The battery TR flame also has a smoke pattern, which is important for the fire cause determination, which has drawn much attention in the fire investigation for a normal fire source. Han et al. [20,21] studied the smoke pattern of various fire sources such as n-heptane and diesel. The distribution characteristics of the soot pattern exhibit a “V” shape, which is related to the flame behaviors. Flame height and temperature will affect the soot pattern. However, the previous studies are mainly focused on the normal fires dominated by buoyancy. The battery jet flame has both momentum and buoyant processes, as well as complex components in fuel, which have not been discussed in previous studies. To address the gaps in the existing literature, which often overlooks the dynamic transition of jet flames and the formation mechanism of smoke patterns, this study proposes an integrated framework combining Large Eddy Simulation (LES) with experimental validation. The meaningful contributions to battery safety engineering are threefold. The first is that it reveals the Froude-number-driven transition mechanism from momentum- to buoyancy-control, challenging the traditional assumption of steady-state combustion in LIB fires. The second is that it establishes a quantitative correlation between the flame flow field and wall soot deposition, providing fire investigators with a ‘visual fingerprint’ to identify LIB ignition sources and estimate the state of charge (SOC) based on smoke pattern geometry. The third is that the analysis of multi-component gas distribution (e.g., CO enrichment in the core) offers precise input for designing ventilation systems and selecting toxic gas sensors in battery storage stations.
Typically, the thermal runaway process of a lithium-ion battery evolves through three distinct stages [22]. The Incubation Stage: It is characterized by internal heating, electrolyte decomposition, and the initial release of non-combustible gases (safety vent opening). The Jet Flame Stage: The violent ejection of high-temperature combustible mixture, which ignites immediately upon contact with air, results in a high-momentum jet fire. The Residual Decay Stage: A slow, low-momentum burning of the remaining char and solids after the active material is exhausted.
In this study, the numerical simulation specifically focuses on the Jet Flame Stage (Stage II). The rationale for this selection is threefold: First, this stage exhibits the peak Heat Release Rate (HRR), representing the highest thermal hazard and the primary driver for fire propagation to adjacent modules. Second, the high-velocity jet dynamics in this stage are responsible for the complex interaction with walls (e.g., vortex stretching), which cannot be captured by static thermal models. Third, the soot patterns used for forensic analysis are predominantly formed during this high-momentum combustion phase, making it the most critical window for safety engineering and accident reconstruction.
Therefore, this paper studies the jet flame and smoke pattern of a battery fire using a numerical simulation method, and a validated experimental study is also conducted. This paper discusses the flame height, species distribution, and smoke pattern of the battery jet flame. This paper presents numerical methods for investigating knowledge and fire in battery fires.
2. Materials and Methods
2.1. Lithium Battery Vent Gaseous
The TR reaction supplies the lithium battery jet flame, and the gaseous species can be taken as H2, CO2, CO, C2H4, and C2H6, respectively. The mean mole fraction of these species for the Li-ion battery vent gas can be referenced in previous studies, as shown in Table 1 [15]. The initial gaseous vent flow rate is affected by the state of the battery, and it is varied during the actual battery fires, but the jet flame stage is relatively steady for several seconds. The numerical simulation in this paper is mainly focused on the jet flame stage. This boundary condition is derived from the experimental work of Zou et al. [16], who investigated the jet flow dynamics of prismatic NCM lithium-ion batteries with specifications (50 Ah capacity and dimensions) highly comparable to those used in this study. Their measurements indicated that during the stable jetting phase, the vent velocity typically fluctuates between 15 m/s and 20 m/s. Consequently, a representative value of 17 m/s is adopted to initialize the jet flame simulation [6]. It should be noted that due to the violent and transient nature of the thermal runaway jet, real-time measurement of the vent gas composition and velocity is extremely challenging. Therefore, consistent with methodologies in similar CFD studies [9], the inlet boundary conditions for species molar fractions (Table 1) and velocity are adopted from experimental datasets of identical NCM chemistries.

Table 1.
The mole fraction of initial battery vent gases [15].
2.2. The Jet Flame Governing Equation
The three-dimensional (3D) Large Eddy Simulation turbulence model and the low Mach number approximation method are used to calculate the fire behaviors in this paper, which significantly reduces the computational cost. The jet flame numerical simulation models are shown in Figure 1. The mass conservation of jet flow can be expressed as [23]:
where is the total mass generation of total species, and the species conservation can be expressed as [23]:
where Za is the mass fraction of species a, is the source term caused by chemical reaction and the source term by evaporation. The momentum equation of flow can be expressed as [23]
where fp is the momentum transfer due to the particles, and fb is the momentum transfer due to evaporation. The energy conversion equation correlated by the low Mach number approximation can be expressed as [23]:
where is the heat release by chemical reaction, is the energy transferred to subgrid-scale droplets and particles, and is the heat flux. In these equations, the generation of species is due to chemical reactions and the evaporation of liquid.
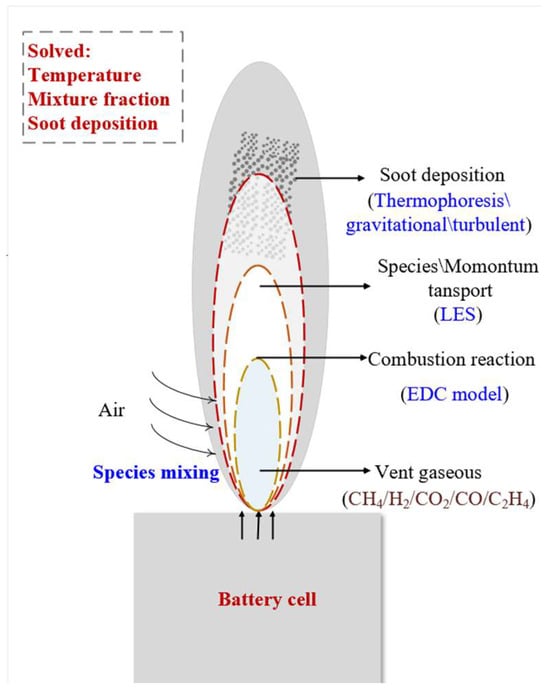
Figure 1.
The jet flame numerical simulation model mechanism diagram.
2.3. Combustion Reaction Model
The mixing model with infinite reaction rate is used to model the gas combustion reaction. The cell has an initial concentration of species (reactants and products) that exist with some degree of mixing, and this mixing is dominated by turbulence. The mixing time is the fastest of the three physical processes: diffusion, subgrid-scale (SGS) advection, and buoyant acceleration. In this condition, the jet flame undergoes non-premixed combustion, for which a simple Eddy Dissipation Concept method is employed to model the process [24]. A lumped species reaction is used to describe the chemical reaction, expressed as:
where X1–X5 are the stoichiometric coefficients of the reactant fuel, b is the reactant oxidizer, and c, d, e, f, and g are the products of the chemical reaction. The stoichiometric coefficients are balanced by atomic conservation and mass conservation calculations.
2.4. Soot Deposition Model
The soot from a fire is an aerosol that can deposit on surfaces due to gravitational settling, diffusive and turbulent transport, and thermophoresis. The gravitational settling velocity is expressed as [25]:
where ma is the particle mass, Xa is a shape factor, μ is the dynamic viscosity of air, ra is the particle radius, and Cn is the Cunningham slip correction factor. The thermophoretic velocity is expressed as [26]:
where Kth is the thermophoretic velocity coefficient. The turbulent deposition velocity is expressed as [27]:
where Sc is the particle Schmidt number, ut is the wall friction velocity, and τ is the dimensionless stopping distance. The total soot deposition velocity to the wall surface is the sum of three deposited velocities expressed as:
2.5. Meshing and Simulation Set-Up
The computational domain is defined as a rectangular volume of 1 m(X) × 0.2 m(Y) × 1.5 m(Z), which is sufficiently large to encompass the fully developed flame and smoke plume without boundary interference. The numerical boundary conditions and initial settings are listed in Table 2. The mesh grid size will affect the accuracy of the computational mode, and the simulation was carried out with three mesh sizes, 10 mm, 5 mm, and 2.5 mm, to determine the optimal grid size for this simulation. The temperature above the vent at 10 cm is measured. This specific monitoring location was selected because it lies within the continuous flame region where turbulent mixing and combustion reactions are intense. Unlike positions too close to the vent (dominated by the unmixed fuel potential core) or too far downstream (dominated by intermittent plume fluctuations), the 10 cm height captures the critical temperature evolution driven by the shear layer development, making it highly sensitive to changes in grid resolution and thus an effective metric for independence testing. The resulting temperature profile is plotted in Figure 2. The temperature in this position initially increases sharply, then drops and remains stable. This is mainly induced by the flame sheet formed and diffused in the Z direction, resulting in a stable diffusion flame. This position is located in the vapor zone, where the temperature rise is primarily due to heat transfer from upstream, and the temperature is relatively low. The temperature result calculated by three conditions is shown in Figure 2. It is shown that the temperature in case 10 mm deviates from 5 mm and 2.5 mm, while the temperature data under 5 mm and 2.5 mm conditions are close.
Table 2.
Summary of numerical boundary conditions and initial settings.
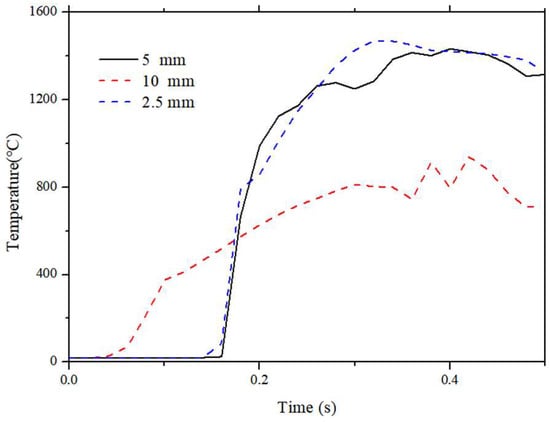
Figure 2.
The temperature of the jet flame above the vent during the burning process.
The global macroscopic parameter, visible flame height, was also compared across the three grid sizes (10 mm, 5 mm, 2.5 mm). As shown in the supplementary analysis, the flame height predicted by the 10 mm grid significantly underestimates the experimental value due to poor resolution of the shear layer. However, the flame topology and height results for the 5 mm and 2.5 mm grids show a deviation of less than 5%. Consequently, the 5 mm grid system (approx. 2.4 million cells) was selected as the optimal trade-off between accuracy and computational cost.
Therefore, the temperature becomes independent when the grid size is reduced to 5 mm. The most significant time step is 6.5 ms, and the Courant–Friedrichs–Lewy is below 0.7 to ensure calculation stability.
2.6. Experiment
The battery TR experiment was conducted to validate the accuracy of the numerical simulation. An experimental platform was built, as shown in Figure 3. The battery sample is a 50 Ah NCM Li-ion battery (Contemporary Amperex Technology Co., Limited, Ningde, China), with NCM as the cathode active material and graphite as the anode. The cell dimensions are 148 mm × 100 mm × 27 mm, and its total mass is 880 g. The nominal voltage of the cell is 3.65 V, and the discharging cut-off voltages are 2.5 V for charging. The battery was charged to 100% SOC before fire tests. The TR was triggered by a plate electric heater (220 V 600 W, 150 mm × 100 mm) contact with the cell, and the temperature can reach 500 °C. To ensure that the observed jet flame and combustion behavior were driven solely by the battery’s internal energy release, the heating protocol involved a trigger-to-stop method. Specifically, the power supply to the heater was immediately cut off once the onset of thermal runaway was detected. The criterion for determining this onset was defined as the moment when the safety vent opened, accompanied by a sharp rise in surface temperature (dT/dt ≥ 10 °C/s) and the visible ejection of smoke. The fire behaviors of the flame are recorded by a Sony camera with 50 fps and pixel of 1920 × 1080. A white gypsum board with size of 3 m × 4 m× 0.05 m recorded the fire smoke pattern on the backside of the battery.
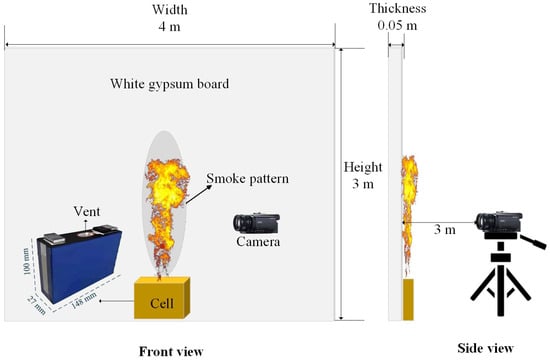
Figure 3.
The lithium battery fire experimental schematic diagram.
3. Results and Discussion
3.1. The Flame Behavior of Jet Flame
The NCM battery TR experiment is conducted to validate numerical simulation data. The TR process is plotted in Figure 4. The internal pressure will decrease as the gas is released, so the vent velocity also decreases. There are mainly two stages for the jet flame due to the initial vent velocity: the first is the momentum-controlled flame, and then the buoyancy-controlled flame, which agrees with the previous studies [6]. The momentum-controlled flame is maintained for about 3 s, while the buoyancy-controlled flame lasts for about 20 s until extinguished. These two regimes have a significant influence on the flame height.
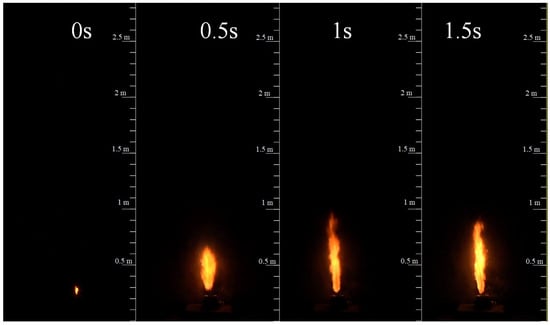
Figure 4.
The experimental jet flame behavior during the battery TR process.
As shown in Figure 4, the jet flame of battery fire seems to transition from momentum-controlled to the buoyancy-controlled. Delichatsios et al. developed a flame height model for the jet flame dominated by momentum and buoyancy, which depend on the Froude number Fr that can be expressed as:
The flame height can be transformed into a dimensionless form expressed as:
The flame is dominated by the buoyant when the Fr < 5, and the dimensionless flame height can be expressed as:
When the Fr ≥ 5, the flame is dominated by momentum, and the H* tends to a constant value of 23. For the flame of the battery in this paper, the stoichiometric air-to-fuel mass ratio of the battery vapor and the initial velocity are important parameters that influence the flame height. According to Equations (9)–(11), the maximum flame height is approximately 0.79 m in the combustion reaction system in this paper. The velocity of the vent is difficult to determine, but we can analyze the flame height at various vent velocities based on Equations (9)–(11), as shown in Figure 4. The boundary velocity between buoyancy-dominated and momentum-dominated flow is approximately 12 m/s. The transition mechanism of the LIB jet flame is governed by the competition between the inertial forces of the ejected gas and the gravitational forces of the hot plume, which can be quantified by the Froude number (Fr). As defined in Equation (10), Fr represents the ratio of momentum flux to buoyancy flux. In the initial stage of thermal runaway (t < 3 s), the rapid release of high-pressure internal gas results in a high vent velocity (Vvent ≈ 17 m/s). Substituting this velocity into Equation (10) yields a Froude number significantly greater than the critical threshold of 5 (Fr >> 5), indicating that the flame dynamics are dominated by the initial momentum. In this momentum-controlled regime, the flame exhibits a rigid, jet-like structure with a high length-to-width ratio, and air entrainment is driven primarily by the high-speed shear layer.
However, as the reactant consumption proceeds, the internal pressure of the battery decays exponentially, leading to a continuous decrease in vent velocity. As shown in Figure 5, when the velocity drops below the critical value of approximately 12 m/s, the calculated Froude number falls below 5 (Fr < 5). This marks the onset of the buoyancy-controlled regime. In this stage, the inertial forces are insufficient to counteract the upward acceleration caused by density differences. Consequently, the flame behavior shifts: the flame widens, flickers significantly due to Kelvin–Helmholtz instability, and its height becomes dependent on the heat release rate rather than the jet exit velocity. This theoretical transition point at Vvent ≈ 17 m/s aligns well with the experimental observation at t ≈ 3 s (Figure 6), confirming that the flame regime transition is fundamentally driven by the depressurization-induced velocity decay.
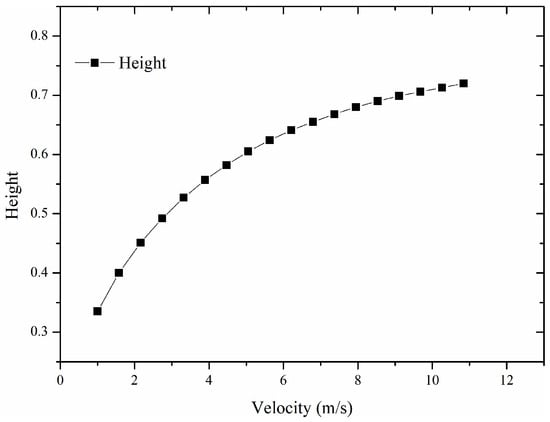
Figure 5.
The flame height data in various velocities predicted by the Delichatsios model.
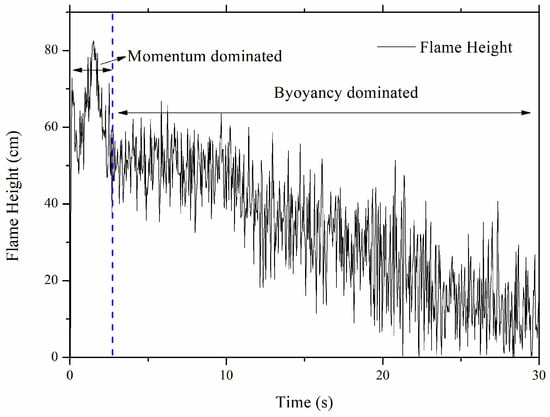
Figure 6.
The experimental flame height data during the burning process of the battery fire.
The Delichatsios model is mainly based on the turbulent entrainment hypothesis, effectively unifying the momentum-driven jet regime and the buoyancy-driven plume regime through the source Froude number, which is also applicable to the situation of multi-component gases. For complex LIB vent gas, the vent gas is treated as a surrogate fuel mixture with an equivalent stoichiometric air-to-fuel mass ratio. The main parameters are the gas density and the equivalent stoichiometric air-to-fuel mass ratio. Therefore, the Delichatsios model is also applicable for the LIB vent gas when the parameters are corrected.
The presence of multi-component species, particularly the high concentration of hydrogen (H2~30.8%), significantly influences these effective parameters and the resulting flame height. First, the low density of H2 drastically reduces the overall density of the vent gas mixture, thereby increasing the initial Froude number (momentum flux) for a given mass flow rate. Second, H2 has high diffusivity and laminar flame speed, which enhances the turbulent mixing efficiency with ambient air. This enhanced entrainment tends to shorten the flame length compared to pure hydrocarbon jets of equivalent heat release. However, the Delichatsios model accounts for these physicochemical variations through the source buoyancy flux term.
3.2. The Species Distribution in Flame
The species fraction in the flame is an important parameter that affects flame structure. The species in flame are measured in this paper. The jet fuel fraction distribution is plotted in Figure 7. The fuel vapor will mix with the ambient air and react with oxygen, then the fraction decreases with distance from the vent. The CH4, H2, and C2H4 also have similar distributions (shown as Figure 8), and they increase radically and axially due to the exhaust from the combustion reaction. The temperature has an inverse relationship with fuels because the mixture of fuel and oxygen primarily determines it.
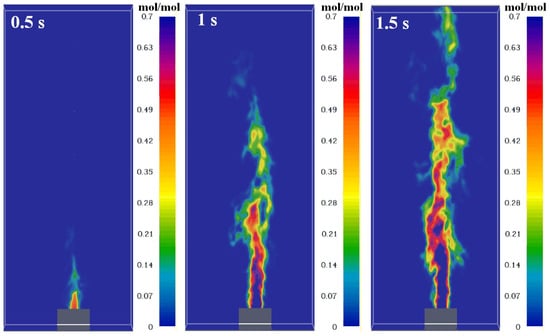
Figure 7.
The simulated fuel fraction distributions at different times.
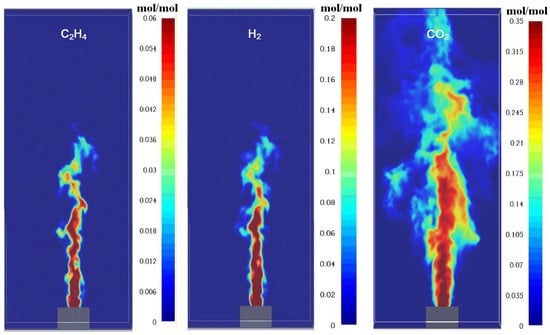
Figure 8.
The simulated species fraction distribution of fuel in a steady flame.
The production of species, such as soot, has a similar distribution, while CO is different. This is mainly induced by the existence of CO in the initial vent, which results in the concentration increase in the flame vapor core zone. The heterogeneous distribution of species directly influences combustion efficiency. High H2 content (30.8% mole fraction) in the vent gas promotes rapid combustion and elevated flame temperatures (~700 °C), as H2 has a high laminar flame speed. Conversely, CO and C2H4 contribute to soot formation due to their carbon-rich nature, leading to incomplete combustion in fuel-rich zones (Figure 8). This aligns with Dong et al. [19], who found that H2 enhances H2O production but inhibits carbon conversion to CO2.
The enrichment of CO in the flame core (as shown in Figure 9) is governed by a dual mechanism involving advective transport and reaction kinetics. Firstly, unlike conventional hydrocarbon pool fires where CO is solely an intermediate product, the LIB vent gas inherently contains a high concentration of CO (~13% mole fraction). In the jet core region, characterized by a high mixture fraction (Z > Zst), the strong axial momentum inhibits the radial entrainment of ambient air. Consequently, the initial CO is advected downstream with minimal dilution, forming a CO-rich channel along the centerline. Secondly, chemical kinetics in this fuel-rich zone further exacerbate CO accumulation. The thermal decomposition of hydrocarbons (e.g., C2H4, CH4) in the core generates additional CO as an intermediate species. However, the oxidation of CO to CO2 (primarily via CO + OH → CO2 + H) is a slow, rate-limiting step and requires sufficient oxidizers. As indicated by the mixture fraction distribution in Figure 10, the oxygen concentration in the core is negligible. Therefore, the conversion path to CO2 is blocked, causing CO to accumulate locally, whereas in the shear layer (flame sheet) where Z ≈ Zst, adequate mixing allows CO to fully oxidize, resulting in lower CO and higher temperature distributions.
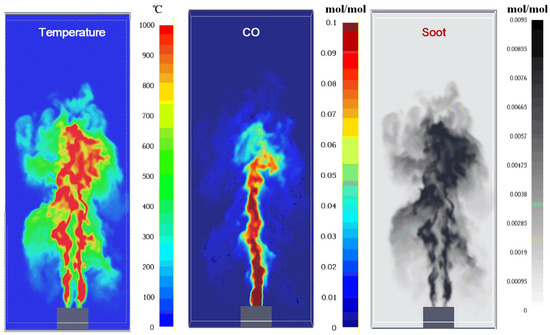
Figure 9.
The simulated temperature and production distribution in a steady flame.
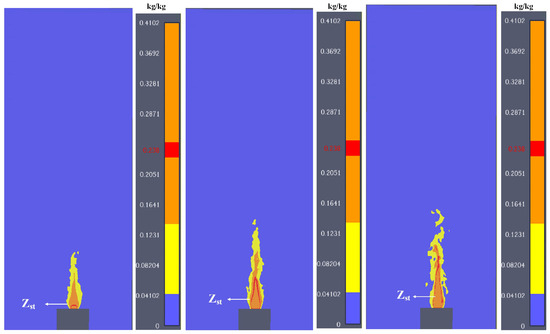
Figure 10.
The simulated mixture fraction distribution evolution during jet flame.
The chemical reaction depends on the degree of fuel and air mixing in the mixture, which the mixture fraction can quantify. The mixture fraction is defined as:
The mixture fraction of the jet flame in this paper is plotted in Figure 10. It is shown that the mixture fraction is high near the flame, as the initial momentum is strong and mixing is primarily induced by turbulence. Due to the intense air entrainment in the edge region of the flame, the mixture fraction rapidly drops to near the stoichiometric ratio, forming a chemically reactive thin layer. The central area, however, maintains a relatively high fuel concentration, which may lead to incomplete combustion. This radial gradient results in significant differences in the equivalent ratio distribution, and in some local areas, both overly concentrated and overly dilute states may coexist simultaneously. The Zst is marked in Figure 10. It can be seen that the Zst is extended during the burning process, and the reaction zones are enlarged. The mixture fraction plot (Figure 10) reveals that Zst (stoichiometric mixture fraction) expands over time, indicating enhanced air entrainment and a broader reaction zone. This explains the observed increase in flame width during buoyancy control. Local regions with Z > Zst are prone to soot formation due to oxygen deficiency, which correlates with the dark smoke patterns observed experimentally. Additionally, the high CO concentration in the core vapor zone (Figure 9) stems not only from the initial vent gas but also from incomplete oxidation, suggesting that LIB fires may pose higher toxicity risks compared to conventional hydrocarbon fires.
3.3. Smoke Pattern of Jet Flame
Carbon exists in hydrocarbon flame, and the carbon particles will deposit on the wall. The smoke pattern from the experiment is shown in Figure 11. To transition from qualitative observation to quantitative analysis, image processing techniques were employed to extract the geometric profile of the experimental smoke pattern shown in Figure 11. The gray level was defined based on our previous study [21]. The raw image was converted to grayscale and subjected to edge detection algorithms to delineate the boundary of the soot deposition zone (Zone I). The extracted coordinate points (x, z) were then plotted against the simulation results in Figure 12. The low part of the battery fire smoke pattern increases in width with height, exhibiting a “V” shape similar to that reported in previous work. However, the smoke pattern from a battery fire obviously stretches in the Z direction; the width of the pattern is larger than the condition described in this paper. As shown in Figure 6, the flame is controlled by momentum, and the mixing in the radial direction is weak, so the width of the flame is relatively small. There are obviously two zones for the smoke pattern; the smoke pattern in Zone I is relatively dark in color, while it is weak in Zone II. The smoke pattern in Zone I is mainly formed in the momentum-controlled stage, while the buoyancy-controlled stage induces Zone II. In the momentum-controlled stage, the jet flame velocity is high, and the turbulence of the flame flow is strong. The turbulent deposition velocity of soot particles in the flame increases, and more soot patterns can deposit on the wall. In the buoyancy-controlled stage, the main deposition is induced by thermophoresis. Therefore, the soot particle deposition is weak in this stage, but the deposition area is enlarged as the flame width increases.
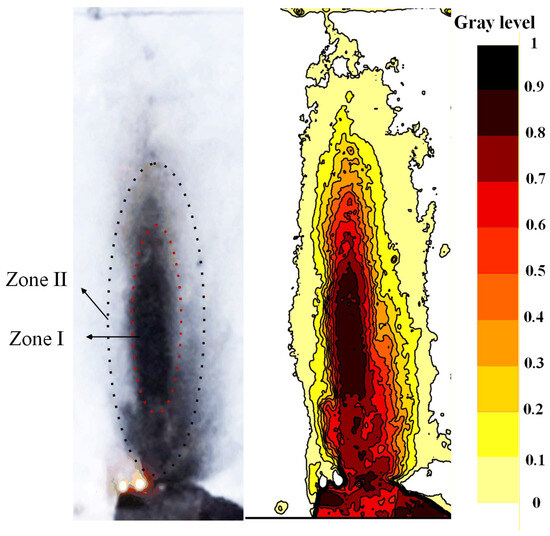
Figure 11.
The experimental smoke pattern and gray level distribution image of the battery jet flame.
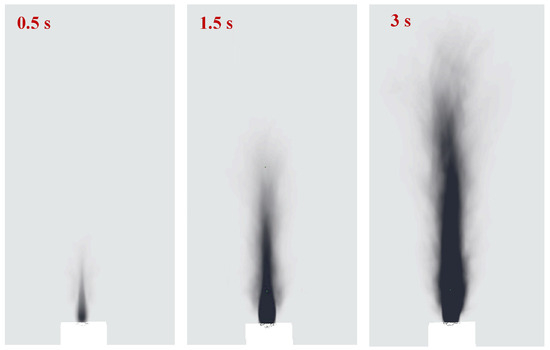
Figure 12.
Evolution of the simulated smoke pattern of the battery fire jet flame.
The numerical simulation result is plotted in Figure 12. The smoke pattern distribution is similar to that in the experimental data in Figure 12, and the smoke pattern profile will be discussed in detail. The numerical simulation clearly described the smoke pattern formation process during the burning process. Two zones also occur in the numerical simulation data. For the smoke pattern outer profiles, there are five regions on the Z directions: (I) the continuous growth region that is similar to a parabola profile, (II) the neck region, where the outer curve pattern is decreased in the x direction, (III) the stable region, where the outer curve stays almost unchanged, and (IV) the decay region, where the curve is decreased to disappear. The smoke pattern has a significant relationship with the flame structure, such as height and width. Region I is approximately located at the flame base, where the shear layer caused by jet flow development remains stable. Region II is situated at the flame neck, where the vortices caused by the jet will form and fall off. Region III is located at the main reaction zone of the flame, where the turbulence is significant, and the vortex stretching is severe. Region IV is the flame tip, where the fuel has been overly diluted and combustion is extinguished. The fire plumes will form in this region, and the soot deposition is weak. The smoke pattern partitioning between Zone I (momentum-controlled) and Zone II (buoyancy-controlled) is governed by distinct deposition mechanisms. In Zone I, high turbulence (Re ~ 104) enhances turbulent deposition velocity, leading to dense soot accumulation. In Zone II, thermophoresis dominates due to temperature gradients, resulting in lighter, wider patterns. This mechanistic insight aligns with Han et al. [15], who reported similar partitioning in wall fires. Han et al. [14] proposed a power-law correlation to describe the geometric profile of wall smoke patterns. In this study, to quantify the smoke pattern spreading characteristics, we define a Cartesian coordinate system where z represents the vertical height above the battery vent and x represents the horizontal half-width of the smoke pattern at that height. The profile model for the lower part of the pattern (Zone I) is expressed as:
where x is the horizontal half-width of the smoke pattern (m); z is the vertical height (m); a and b are the fitting coefficients related to the burner size and burning rate. This model applies to the lower and upper parts of the smoke pattern profile. The simulation and experimental data are fitted with Equation (14), the result is shown in Figure 13, and the calculated coefficients are listed in Table 3. As summarized in Table 3, the coefficient of determination (R2) for the experimental data reaches 0.96, confirming that the parabolic law governs the deposition distribution. Furthermore, a quantitative comparison of the shape coefficients reveals that the simulation (a = 59.81) closely matches the experiment (a = 59.79), with a relative error of less than 0.1%, although a slight deviation exists in the exponent b. This semi-quantitative evidence validates that the numerical model correctly captures the physical mechanism of soot deposition in the momentum-dominated region.
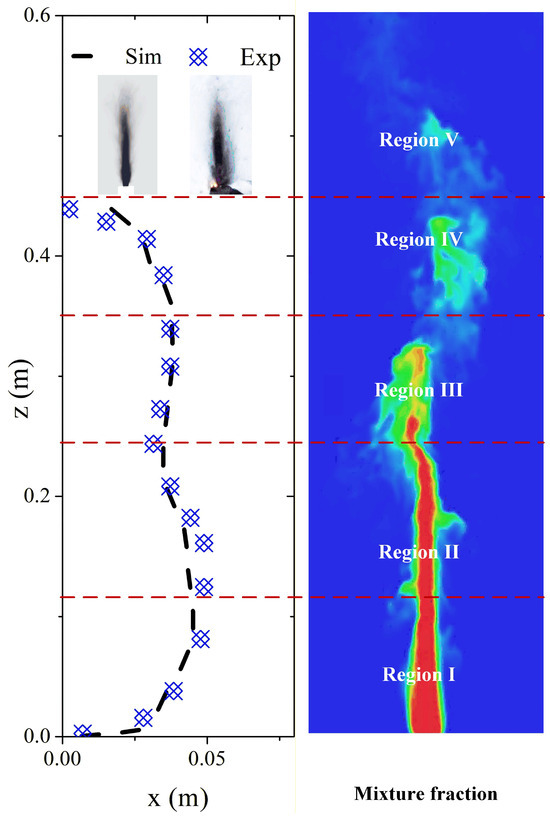
Figure 13.
The smoke pattern profile and five characteristic regions (divided by red dash lines) of experimental and simulation data.
Table 3.
The parabolic model coefficient of experimental and simulation data.
The coefficients of the simulation and experimental parabolic coefficients are close, which means that the simulated smoke pattern is accurate. Practically, these patterns serve as fingerprints for fire investigators: a dark, narrow ‘V’ shape indicates momentum-dominated LIB jets, while a broad, faint pattern suggests buoyancy control. This can aid in distinguishing LIB fires from other sources in accident scenarios. Future work should correlate pattern features with battery SOC or damage severity to enhance diagnostic precision.
4. Conclusions
This study comprehensively examines the flame and smoke pattern characteristics of lithium-ion battery fires using numerical simulations and experimental validations. The main conclusions are drawn as follows:
- Dual-regime flame dynamics: The LIB jet flame exhibits two control mechanisms—momentum control and buoyancy control. The initial stage (≤3 s) is dominated by momentum, characterized by high-velocity gas ejection and compact flame structure. Subsequently, buoyancy control prevails, leading to flame expansion and prolonged combustion. This transition is critical for accurately assessing fire development and energy release rates.
- Flame height modeling: The Delichatsios model effectively predicts the flame height of multi-component LIB jets, with simulations using FDS (Fire Dynamics Simulator) showing strong agreement with experimental data. The model confirms that the boundary velocity between momentum- and buoyancy-dominated regimes is approximately 12 m/s, and the maximum flame height reaches 0.79 m under the tested conditions. This provides a quantitative tool for hazard evaluation.
- Smoke pattern mechanisms: Smoke patterns are influenced by the control regime. Momentum control produces intense soot deposition in central zones (Zone I) due to turbulent transport, resulting in dark, parabolic patterns. Buoyancy control generates weaker deposition at flame edges (Zone II), driven by thermophoresis. The overall pattern evolves through four regions, continuous growth, neck, stable, and decay zones, which correlate with flame structure dynamics. A parabolic model (Equation (14)) accurately describes the smoke profile, with coefficients consistent between simulation and experiment.
- Practical implications: The findings aid in LIB fire risk assessment, such as designing battery safety systems and interpreting fire evidence in investigations. Limitations include the focus on single-cell fires and specific SOC conditions; future work should extend to battery packs, aging effects, and broader environmental factors.
This research bridges numerical modeling and experimental analysis, offering a foundation for advancing LIB safety standards. Despite the insights gained into the jet flame dynamics and smoke pattern formation, this study has certain limitations that warrant further investigation. The first is the boundary condition. The inlet gas composition was adopted from literature values for similar NCM batteries. In reality, species concentrations vary transiently during the thermal runaway process. Future work should aim to couple internal battery reaction models with CFD to generate real-time, time-varying inlet boundary conditions. The second is the chemical kinetics. The current model employs a simplified Eddy Dissipation Concept (EDC) with a lumped reaction step. While efficient for macro-scale flame structure, it does not fully resolve the complex soot formation precursors (PAH). Subsequent studies could incorporate detailed chemical kinetic mechanisms to predict soot yield and toxicity more precisely. The third is the scope of battery types. This research focused on prismatic NCM cells. Since battery chemistry (e.g., LFP) and form factor (e.g., cylindrical) significantly influence jetting characteristics, future research should extend the proposed parabolic smoke model to a broader range of battery specifications to establish a comprehensive forensic database.
Author Contributions
Conceptualization, X.W. and X.F.; methodology, X.W. and Z.F.; validation, M.J., Y.S., and S.L.; resources, X.W.; writing—original draft preparation, Z.F., Z.W. and Z.S.; writing—review and editing, X.W. and Z.S.; funding acquisition, X.W. and X.F. All authors have read and agreed to the published version of the manuscript.
Funding
This work was supported by the National Natural Science Foundation of China (grant numbers 52406167, the Zhejiang Key Laboratory of Intelligent Vehicle Comprehensive (ZKLIVCS-202403), Open Foundation of Key Laboratory of Fire Protection Technology for Industry and Public Building (2022KLIB07), the Sichuan Provincial Natural Science Foundation (2025YFHZ0054), and the National Natural Science Foundation of China (grant numbers 52404196).
Data Availability Statement
The original contributions presented in this study are included in the article. Further inquiries can be directed to the corresponding authors.
Conflicts of Interest
Authors Xin Fu, Mingyu Jin, Yang Shen and Shu Lin are employed by the Geely Automobile Research Institute (Ningbo) Company. Authors Xuehui Wang have received research grants from the foundation of Open Foundation of Key Laboratory of Fire Protection Technology for Industry and Public Building. The remaining authors declare that the research was conducted in the absence of any commercial or financial relationships that could be construed as a potential conflict of interest.
Nomenclature
| a | Parabolic model coefficient [-] |
| b | Parabolic model coefficient [-] |
| Cn | Cunningham slip correction factor [-] |
| d | Burner size [m] |
| fb | Momentum transfers due to the particles [kg/m2s2] |
| fp | Momentum transfers due to evaporation [kg/m2s2] |
| Fr | Froude number [-] |
| g | Acceleration of gravity [9.8 m/s2] |
| hs | The enthalpy in energy equation [kW] |
| Hf | Flame height [m] |
| H* | Dimensionless flame height [-] |
| Kth | Thermophoretic velocity coefficient [-] |
| ma | Particle mass [kg] |
| Burning rate [kg/s] | |
| Source term caused by chemical reaction [kg/s] | |
| mf | The mass of fuel vapor in mixtures [kg] |
| Mair | The mass of air in mixtures [kg] |
| heat release by chemical reaction [kW] | |
| Energy transferred to subgrid-scale droplets and particles [kW] | |
| Xa | Shape factor [-] |
| Sc | Schmidt number [-] |
| u | Velocity in mass conservation equation [m/s] |
| ut | Wall friction velocity [m/s] |
| P | Pressure [Pa] |
| s | Stoichiometric of t reaction [-] |
| t | Time [s] |
| Tf | Flame temperature [K] |
| T∞ | Ambient air temperature [K] |
| Ts | Temperature at liquid surface [K] |
| T* | Dimensionless temperature [-] |
| Tb | Boiling temperature [K] |
| TR | Temperature at the top of vapor-rich zone [K] |
| Vvent | Jet velocity of vent [m/s] |
| Z | Mixture fraction [-] |
| Zα | Mass fraction of gas [-] |
| Zf | Flame height [m] |
| z | The pattern contour coordinates [m] |
| Greek symbols | |
| μ | Dynamic viscosity [Pa·s] |
| ρ∞ | Ambient air density, ρ∞ = 1.29 kg/m3 for standard state [kg/m3] |
| ρ | Density [kg/m3] |
| Δ | Difference value between two parameters [-] |
| τ | Dimensionless stopping distance [-] |
References
- Huang, Y.; Zhao, Y.; Bai, W.; Cao, Y.; Xu, W.; Shen, X.; Wang, Z. Study on the influence of high rate charge and discharge on thermal runaway behavior of lithium-ion battery. Process Saf. Environ. Prot. 2024, 191, 1483–1494. [Google Scholar] [CrossRef]
- Zhou, L.; Jin, X.; Chun, E.; Wang, Z.; Liu, J. Thermal behavior and failure mechanisms of lithium-ion battery under high discharging rate. Appl. Therm. Eng. 2025, 278, 127043. [Google Scholar] [CrossRef]
- Liu, J.; Chun, E.; Jin, X.; Wang, Z.; Cui, Y. Thermal runaway and heat generation of low-temperature cycling batteries under external heating and the influencing factors. Appl. Energy Combust. Sci. 2025, 23, 100360. [Google Scholar] [CrossRef]
- Chen, Y.; Zhu, M.; Chen, M. Comprehensive experimental research on wrapping materials influences on the thermal runaway of lithium-ion batteries. Emerg. Manag. Sci. Technol. 2025, 5, e007. [Google Scholar] [CrossRef]
- Liu, J.; Liu, J.; Jin, X.; Zhang, Y.; Gong, J.; Wang, Z.; Cui, Y. Influence of multi factors on external short circuit of lithium-ion battery. Process Saf. Environ. Prot. Trans. Inst. Chem. Eng. Part B 2010, 199, 13. [Google Scholar]
- Zou, K.; Chen, X.; Ding, Z.; Gu, J.; Lu, S. Jet behavior of prismatic lithium-ion batteries during thermal runaway. Appl. Therm. Eng. 2020, 179, 115745. [Google Scholar] [CrossRef]
- Kong, D.; Wang, G.; Ping, P.; Wen, J. A coupled conjugate heat transfer and CFD model for the thermal runaway evolution and jet fire of 18650 lithium-ion battery under thermal abuse. eTransportation 2022, 12, 100157. [Google Scholar] [CrossRef]
- Kong, D.; Wang, G.; Ping, P.; Wen, J. Numerical investigation of thermal runaway behavior of lithium-ion batteries with different battery materials and heating conditions. Appl. Therm. Eng. 2021, 189, 116661. [Google Scholar] [CrossRef]
- Wang, G.; Ping, P.; Zhang, Y.; Zhao, H.; Lv, H.; Gao, X.; Gao, W.; Kong, D. Modeling thermal runaway propagation of lithium-ion batteries under impacts of ceiling jet fire. Process Saf. Environ. Prot. 2023, 175, 524–540. [Google Scholar] [CrossRef]
- Hoelle, S.; Dengler, F.; Zimmermann, S.; Hinrichsen, O. 3D Thermal Simulation of Lithium-Ion Battery Thermal Runaway in Autoclave Calorimetry: Development and Comparison of Modeling Approaches. J. Electrochem. Soc. 2023, 170, 010509. [Google Scholar] [CrossRef]
- Jin, C.; Sun, Y.; Wang, H.; Zheng, Y.; Wang, S.; Rui, X.; Xu, C.; Feng, X.; Wang, H.; Ouyang, M. Heating power and heating energy effect on the thermal runaway propagation characteristics of lithium-ion battery module: Experiments and modeling. Appl. Energy 2022, 312, 118760. [Google Scholar] [CrossRef]
- Gavryliuk, A.; Yakovchuk, R.; Ballo, Y.; Rudyk, Y. Thermal Modeling of the Electric Vehicle Fire Hazard Effects on Parking Building. SAE Int. J. Transp. Saf. 2023, 11, 421–434. [Google Scholar] [CrossRef]
- Cui, Y.; Chen, Y.; Chen, M.; Ouyang, D.; Weng, J.; Tao, C.; Zhao, L.; Wang, J. Numerical study on the fire and its propagation of large capacity lithium-ion batteries under storage. J. Therm. Anal. Calorim. 2023, 148, 5787–5803. [Google Scholar] [CrossRef]
- Cheng, C.; Kong, F.; Shan, C.; Xu, B. Numerical Study on Lithium-Ion Battery Thermal Runaway Under Fire Conditions. Fire Technol. 2022, 59, 1073–1087. [Google Scholar] [CrossRef]
- Wang, S.; Wang, G.; Ma, D.; Chen, X.; Zheng, G.; Xu, J. Numerical simulation of initial gas-jet fire evolution under thermal runaway of lithium-ion batteries. J. Energy Storage 2025, 114, 115897. [Google Scholar] [CrossRef]
- Mishra, D.; Tummala, R.; Jain, A. Investigation of propagation of thermal runaway during large-scale storage and transportation of Li-ion batteries. J. Energy Storage 2023, 72, 108315. [Google Scholar] [CrossRef]
- Barré, P.-A.; Carlotti, P.; Guibaud, A. Numerical investigation of the influence of thermal runaway modelling on car park fire hazard and application to a Lithium-ion Manganese Oxide battery. Fire Saf. J. 2024, 150, 104284. [Google Scholar] [CrossRef]
- Voigt, S.; Sträubig, F.; Kwade, A.; Zehfuß, J.; Knaust, C. An empirical model for lithium-ion battery fires for CFD applications. Fire Saf. J. 2023, 135, 103725. [Google Scholar] [CrossRef]
- Lin, X.; Dong, M.; Rao, G.; Nie, W.; Zhou, G.; Lu, J. Carbon conversion mechanism of volatile gas flame based on multi-spectral analysis methods. J. Energy Inst. 2025, 119, 101977. [Google Scholar] [CrossRef]
- Han, Y.; Sun, X.; Zhang, X.; Chen, X.; Fang, X.; Hu, L. Characteristic parameter evolutions and fire smoke patterns of the wall fire plume: Experimental and theoretical analysis. J. Build. Eng. 2024, 88, 109142. [Google Scholar] [CrossRef]
- Han, Y.; Sun, X.; Yang, Y.; Chen, X.; Lv, J.; Wang, X.; Zhang, X.; Hu, L. An experimental study of wall smoke pattern characteristics adjacent to fire source. Int. J. Therm. Sci. 2025, 214, 109865. [Google Scholar] [CrossRef]
- Huang, P.; Yao, C.; Mao, B.; Wang, Q.; Sun, J.; Bai, Z. The critical characteristics and transition process of lithium-ion battery thermal runaway. Energy 2020, 213, 119082. [Google Scholar] [CrossRef]
- McGrattan, K.; Hostikka, S.; McDermott, R.; Floyd, J.; Weinschenk, C.; Overholt, K. Fire dynamics simulator technical reference guide volume 1: Mathematical model. NIST Spec. Publ. 2013, 1018, 175. [Google Scholar]
- Magnussen, B.F.; Hjertager, B.H. On mathematical modeling of turbulent combustion with special emphasis on soot formation and combustion. In Symposium (International) on Combustion; Elsevier: Amsterdam, The Netherlands, 1977; pp. 719–729. [Google Scholar]
- Floyd, J.; Overholt, K.; Ezekoye, O. Soot deposition and gravitational settling modeling and the impact of particle size and agglomeration. Fire Saf. Sci. 2014, 11, 174. [Google Scholar] [CrossRef]
- Mensch, A.E.; Cleary, T.G. Measurements and predictions of thermophoretic soot deposition. Int. J. Heat Mass Transf. 2019, 143, 118444. [Google Scholar] [CrossRef]
- Brooke, J.W.; Kontomaris, K.; Hanratty, T.; McLaughlin, J.B. Turbulent deposition and trapping of aerosols at a wall. Phys. Fluids A Fluid Dyn. 1992, 4, 825–834. [Google Scholar] [CrossRef]
Disclaimer/Publisher’s Note: The statements, opinions and data contained in all publications are solely those of the individual author(s) and contributor(s) and not of MDPI and/or the editor(s). MDPI and/or the editor(s) disclaim responsibility for any injury to people or property resulting from any ideas, methods, instructions or products referred to in the content. |
© 2026 by the authors. Licensee MDPI, Basel, Switzerland. This article is an open access article distributed under the terms and conditions of the Creative Commons Attribution (CC BY) license.