Abstract
A simulation study was conducted on the hydrogen leakage diffusion process and influencing factors of fuel cell vehicles in enclosed spaces. The results indicate that when hydrogen leakage flows towards the rear of the vehicle, it mainly flows along the rear wall of the space and diffuses to the surrounding areas. Setting ventilation openings of different areas on the top of the carriage did not significantly improve the spatial diffusion speed of the leaked hydrogen, and the impact on the concentration of leaked hydrogen was limited to the vicinity of the ventilation openings. The ventilation opening at the rear can accelerate the diffusion of hydrogen gas to the external environment, significantly reducing the concentration of hydrogen and rate of gas rise. When the leaked hydrogen gas flows towards the front of the vehicle and above the space, the concentration of hydrogen mainly increases along the height direction of the space. The research results have significant safety implications for the use of fuel cell semi-trailer trucks.
1. Introduction
Against the backdrop of a global energy crisis and escalating environmental degradation, there is an urgent need for a new type of clean energy to replace traditional fossil fuels. Hydrogen has gradually come into the spotlight due to its high energy density, zero emissions, and wide-ranging sources. Meanwhile, the extensive utilization of renewable energy has promoted the planned production of green hydrogen, which provides a real development opportunity for hydrogen fuel cell vehicles (HFCVs) [1]. Because hydrogen is flammable and explosive, it can spread rapidly during leakage, especially after leakage in a closed space, and it is prone to accumulation, resulting in an increase in concentration, and there is a risk of a hydrogen explosion, which can cause great damage to the driver and the surrounding environment. Therefore, research on the leakage of hydrogen in closed spaces (such as car interiors and garages) is extremely important [2].
Salva et al. [3] studied the leakage diffusion of hydrogen tanks in a car. The results show that when the hydrogen tank is located at the rear of the car, the hydrogen concentration at the head and tail of the car is very different, and the hydrogen concentration leaks in the vent area at the rear of the car is the largest. Schiavetti et al. [4] studied the distribution of hydrogen leaking from the bottom of the vehicle. The study found that when the bottom hydrogen cylinder is stationary, the diffusion concentration of leaked hydrogen in the vehicle is lower than the lowest limit of the hydrogen combustible range. Lacome et al. [5] analyzed the effects of different leakage speeds and leakage diameters of hydrogen cylinders on the diffusion of leaked hydrogen in an enclosed space. They found that hydrogen was stratified and observed that explosive mixed gas appeared above the enclosed space, and its concentration increased with the continuous leakage.
Malakhov et al. [6] studied the distribution relationship of the spatial concentration of leaking hydrogen after leaking from leakage ports with different leakage diameters and leakage positions when there is a ventilation device in a semi-enclosed space. Stefano et al. [7] analyzed the change in concentration of hydrogen at different leakage positions and leakage speeds in a confined space. Venetsanos et al. [8,9] analyzed the distribution changes of leaked hydrogen over time and space under certain spatial constraints. Schiavetti et al. [10] conducted a numerical simulation and experimental analysis of the diffusion and combustion explosion of leaked hydrogen in a restricted environment and compared the peak pressure of leaked hydrogen when it flows through different obstacles.
Liu Yanlei et al. [11] studied hydrogen leakage and diffusion in fuel cell vehicles and found that there is a high-concentration area near the baffle after the diffusion of leaked hydrogen, and leaked hydrogen is very likely to accumulate here. Yu et al. [12] studied the leakage diffusion of hydrogen gas with vents in the high-pressure chamber of hydrogen-fueled passenger cars. The study found that the vent parameters in the high-pressure chamber have a great impact on the leakage of hydrogen. As the area of the vent increases, the leakage hydrogen can diffuse into the atmospheric environment more quickly, thereby rapidly reducing the concentration of hydrogen leaking in the high-pressure chamber. Hu et al. [13] analyzed the diffusion and leakage process of hydrogen cylinders in the cabin of hydrogen fuel buses. The research results found that the high-concentration accumulation area formed after the leakage hydrogen’s diffusion was actually located at the corner of the top of the hydrogen cylinder and was in the normal driving state of the vehicle. Due to the existence of the ventilation system, the hydrogen concentration in other areas is lower than the combustible limit of hydrogen.
Jiao et al. [14] investigated the diffusion behavior of a 35 MPa high-pressure hydrogen leakage from a fuel cell vehicle in an enclosed garage by coupling a computational fluid dynamics (CFD) model with full-scale experiments. The results show that in the early stage of leakage (0–30 s), hydrogen forms a local high-concentration zone at the bottom of the vehicle and diffuses toward the roof. Zheng et al. [15] established a VOF multiphase flow model for the leakage risk of liquid hydrogen refueling stations to simulate the gasification and diffusion process of −253 °C liquid hydrogen after leakage. Wang et al. [16] proposed a method for detecting trace hydrogen leakage in fuel cell stacks based on temperature–voltage cross-sensing. Giannissi et al. [17] investigates hydrogen dispersion characteristics from leaks in long-distance buried pure-hydrogen pipelines under high pressure. Li et al. [18] established a three-dimensional numerical model to study the hydrogen leakage and diffusion law according to the airtight characteristics of an aircraft hydrogen storage compartment and analyzed the influence of the leakage position and ventilation conditions on the distribution of combustible gases in the compartment. Liu et al. [19] developed a visualization detection system for high-pressure hydrogen leakage based on infrared imaging and Particle Image Velocimetry (PIV) and reproduced the turbulent diffusion process of the leakage by combining it with Large Eddy Simulation (LES). Zhang et al. [20] established a multi-scale model of valves, pipelines, and cabin environment for a 70 MPa on-board hydrogen storage system and studied the dynamic diffusion process of high-pressure jet leakage under collision conditions. In addition, many scholars have conducted similar research [21,22,23,24,25].
The research objects in the above literature are mainly concentrated on hydrogen tanks and closed units, and there are few research studies on the leakage of hydrogen fuel cell vehicles. Therefore, this paper uses an actual hydrogen fuel cell semi-trailer truck as the research object for the numerical simulation of the diffusion process of leaked hydrogen in its closed space, and it reveals the impact of various factors on the diffusion of leaked hydrogen. The research results have a certain engineering application value for the safe operation of fuel cell vehicles.
2. Model Building
2.1. Geometric Model
The fuel cell vehicle (HFCV) studied is a domestic liquid hydrogen fuel cell semi-trailer tractor. Its appearance is shown in Figure 1. The cab, chassis, wheels, and other structures are basically the same as those of traditional fuel semi-trailer tractors. The obvious difference is that this liquid hydrogen fuel cell semi-trailer tractor is equipped with hydrogen storage bottles, vehicle-mounted hydrogen supply system components, pipelines, and other components required by the hydrogen supply system. The main reasons for hydrogen leakage are the embrittlement properties of hydrogen and poor system sealing. The on-board hydrogen supply system operates under a certain pressure and shock vibration environment, so the possibility of hydrogen leakage at the hydrogen supply pipeline, valve, and joint connections is relatively higher.
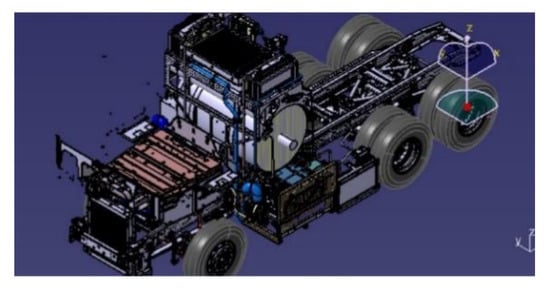
Figure 1.
Car model.
Three leakage ports with different leakage positions and leakage directions are opened at the hydrogen supply pipeline valve box, namely leakage port I, leakage port II, and leakage port III, as shown in Figure 2. Among them, leakage port I and leakage port II are arranged in the middle part of the hydrogen supply pipeline, and the leakage direction flows to the front and rear of the vehicle, respectively. Leakage port III is arranged at a position below the Z axis of the hydrogen storage bottle, and the leakage direction is vertically upward. The selection parameters of these three leak ports are shown in Table 1.
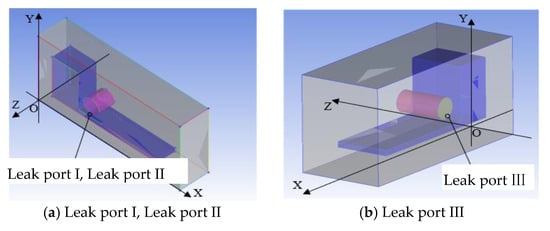
Figure 2.
Leak port location.

Table 1.
Leak port parameters.
2.2. Mathematical Models
When hydrogen leaks in the hydrogen supply system of the hydrogen fuel cell semi-trailer tractor, hydrogen diffuses from the leakage port to the atmosphere. The leakage diffusion process can be described by the energy, momentum, mass, and component equations of the gas, including the energy conservation equation, momentum conservation equations, mass conservation equations, and component transport equations.
(1) The conservation equation of mass
where respectively represent the velocity components of the mixed gas micronuclear body of hydrogen and air in the x, y, and z directions; is the unit time; and is the gas density in the micronuclear body.
(2) Conservation of momentum equation
where, , , respectively represent the unit mass force components of the mixed gas microbody of hydrogen and air in the x, y, and z directions; are the viscous stress components in the x direction; and is the pressure acting on the mixed gas microbody of hydrogen and air.
(3) Energy conservation equation
where , respectively represents the enthalpy of hydrogen and air; and respectively represent the diffusion flux of hydrogen and air; is the effective thermal conductivity coefficient; is the total energy of the hydrogen and air microbody, that is, the kinetic energy of the microbody and the sum of potential energy; and is the part of the volume heat source term that converts mechanical energy and chemical energy to thermal energy under the action of viscosity.
(4) Component conservation equation
where and are the volume concentrations of hydrogen and air, respectively; and are the diffusion coefficients of hydrogen and air, respectively; and and are the mass concentrations of hydrogen and air, respectively.
Assuming that the leakage of hydrogen is an adiabatic process, the mass leakage flow formula is
where is the area of the leakage port, and the unit is is the leakage coefficient, and the value of the circular leakage port is 1.
2.3. Model Verification
The hydrogen leakage diffusion test data of Pitts et al. [16] was selected for verification, and the highest monitoring point and the lowest monitoring point in the test were used for hydrogen monitoring concentrations. The two monitoring points were recorded as A1 and A2, respectively. The simulation results were compared and analyzed with the experimental data of the two monitoring points, as shown in Figure 3. It can be seen that the simulation results are the same as the experimental data trend, with a maximum error of 8.2%, minimum error of 3.1%, and average error of 4.9%. All errors are within an acceptable range. This simulation method can be used for a concentration simulation analysis of the hydrogen leakage process.
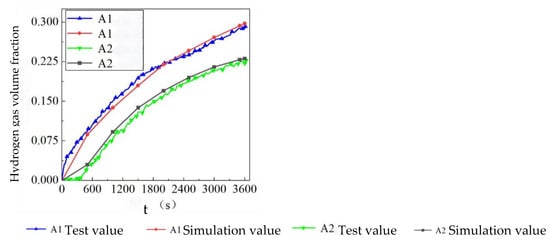
Figure 3.
Result verification.
3. Simulation Results and Analysis
3.1. Analysis of Leakage Diffusion of Hydrogen in Enclosed Space
3.1.1. Leakage and Diffusion of Vehicle-Mounted Hydrogen Supply System
Figure 4 shows the diffusion process of hydrogen after leakage from leakage port I under a completely closed environment. When hydrogen leaks, it first diffuses to the rear wall surface, blocks it, and then spreads around it. When the hydrogen leakage time is t = 10 s, hydrogen is distributed on the space wall and the ground. As hydrogen continues to leak, when the hydrogen leakage time is t = 15 s, the upper hydrogen diffuses along the upper wall and the lower hydrogen along the ground at the same time to the front of the vehicle. When the hydrogen leakage time is t = 20 s, the hydrogen below the vehicle chassis no longer spreads to the front of the vehicle but continues to gather under the chassis. At this time, the hydrogen diffused above is also divided into two channels. The inner hydrogen gradually gathers downward during diffusion forward, while the outer hydrogen gathers towards the edge corner and gradually spreads forward along the corner. When the hydrogen leakage time is t = 25 s, hydrogen completely covers the middle and rear area of the vehicle, and the hydrogen volume fraction at this time can reach 0.04~0.06.
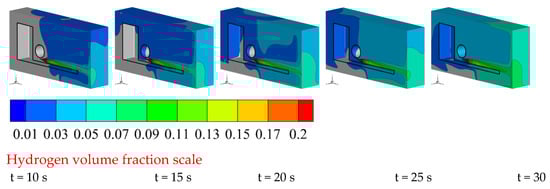
Figure 4.
Hydrogen concentration distribution diagram when leaking backward.
Comparing the hydrogen concentration at t = 25 s and t = 30 s, it can be seen that driven by the hydrogen moving forward along the edge of the space above, the hydrogen above continues to diffuse forward as a whole. Then, it continues to move along the front wall when blocked by the front wall of the space, diffuses under the space, while the hydrogen is still mainly accumulated under the chassis, and the hydrogen distribution area below the cab is smaller. Comparison of the concentration graphs at t = 15 s and t = 30 s shows that the concentration of hydrogen in space has similar contour distribution characteristics near the wall and ground. The difference is mainly because the leakage time continues to increase by 15 s, and the volume fraction of hydrogen in space increases by about 0.02. As the leakage progresses, the hydrogen concentration in the space continues to increase, but the hydrogen in each volume fraction range has the same diffusion pattern.
When hydrogen leaks to the rear of the vehicle, it will continue to gather in the area below the chassis, so there is a high risk of hydrogen combustion and explosion in this area. The hydrogen below the cab mainly diffuses along the walls above and in front of the space, with a low concentration, and it takes a long time for hydrogen to diffuse below the cab. Therefore, when the hydrogen leaks, the area below the cab is safer.
3.1.2. Analysis of Hydrogen Leakage Diffusion Process at Different Leak Locations
(1) Hydrogen leakage diffusion process at leakage port II
In the leakage situation of hydrogen from leakage port II, monitoring points M1–M6 are set on the Z = 0 m plane. The spatial coordinates of the M1–M6 monitoring points are shown in Table 2; the monitoring points are shown in Figure 5, where Figure (a) represents the specific location of the monitoring points, and Figure (b) represents the changes in hydrogen concentration at the M1–M6 monitoring points.
Table 2.
Spatial coordinates of M1–M6 monitoring points.
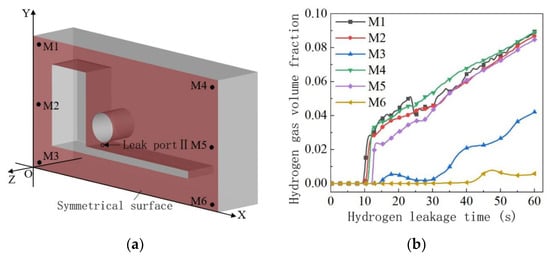
Figure 5.
M1–M6 monitoring points. (a) Schematic diagram of M1–M6 monitoring points; (b) Changes in hydrogen concentration at M1–M6 monitoring points.
It can be seen that at the monitoring points of M1, M2, M4, and M5, the increase in hydrogen concentration was successively monitored after 10 s of hydrogen leakage. The curve rose rapidly within 10–15 s. Then, as the hydrogen leakage continued, the hydrogen concentration at the four monitoring points increased linearly with the increase in time. Although the hydrogen concentrations at the M1 and M4 monitoring points at higher levels were higher at 60 s, the hydrogen volume fractions at the four monitoring points were in the range of 0.08–0.09, and the concentration difference was not large. The M3 and M6 monitoring points located at the bottom of the space are different. The M3 monitoring points monitored changes in hydrogen concentration around 15 s, but the overall hydrogen concentration showed an upward trend. The volume fraction at 60 s was 0.044, in which the hydrogen concentration was about 1/2 lower than the other four monitoring points. The M6 monitoring point monitored the change in hydrogen concentration at 40 s, and the volume fractions were below 0.01 by 60 s, and the hydrogen concentration was significantly lower than the other monitoring points. The difference in the hydrogen concentration changes at different locations in the space is mainly determined by the location of the leakage port and the diffusion direction of the hydrogen in the space. After hydrogen leaks from leakage port II, it encounters obstacles from the rear wall of the cab and the walls of each space and spreads from top to bottom in the space. The concentration below the space is low, so the hydrogen concentration at the M3 and M6 monitoring points is the lowest. Compared with M3, M6 is located at the back of the space, while the leakage port is located at the front of the space, so it takes the longest to monitor the hydrogen concentration at the M6 position.
(2) Analysis of hydrogen leakage diffusion process at leakage port III
Leakage port III is located on the side of the hydrogen storage bottle, and the Z coordinate value of the leakage center is −1.18 m. The spatial coordinates of monitoring points M7–M12 are shown in Table 3, and the monitoring points positions are shown in Figure 6a. The changes in the hydrogen concentration at the M7–M12 monitoring points are shown in Figure 6b.
Table 3.
Space coordinates of M7–M12 monitoring points.
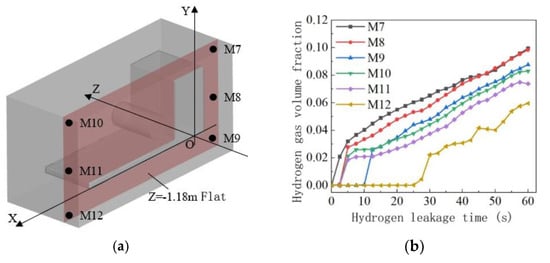
Figure 6.
M7–M12 monitoring points. (a) Schematic diagram of M7–M12 monitoring points; (b) Changes in hydrogen concentration at M7–M12 monitoring points.
It can be seen that the concentrations of the M7-M11 monitoring points all increase within 10 s of hydrogen leakage, and as the leakage continues, the concentration generally increases linearly. The M7, M8, and M9 monitoring points in the space are higher in hydrogen concentration than the M10 and M11 monitoring points behind. The higher the monitoring points under the same X coordinate, the higher the concentration. The hydrogen volume fraction is in the range of 0.07–0.1 at 60 s. The M12 monitoring point only monitors the increase in hydrogen concentration at 25 s, and it takes longer for hydrogen to diffuse here. At 60 s, the volume fraction of hydrogen at this monitoring point is 0.06, which is lower than the other monitoring points. The reason is that in this leakage scenario, hydrogen diffuses from front to back and from top to bottom in the space as a whole. Therefore, it takes the longest time for hydrogen to diffuse to the M12 monitoring point at the back position below the space, and its concentration is the lowest.
From the time and concentration value of the increase in hydrogen concentration at each monitoring point, it can be seen that compared with hydrogen leaking from leakage port II, hydrogen leaking from leakage port III, diffuses faster in the space and has a higher concentration. The reason is that in the leakage port III leakage scenario, hydrogen is less affected by the structure of the vehicle and hydrogen storage bottle and directly diffuses above the space along the Y coordinate axis. In addition, since leakage ports II and III are located in the front position of the space, the hydrogen concentration in the front area of the space will increase first. Then, hydrogen mainly diffuses from front to back and from top to bottom in the space, so the hydrogen concentration is lower in the area behind the space and takes longer to increase in concentration. If the accidental hydrogen leakage can be prevented in time, the hydrogen concentration in the back area below the space will be effectively controlled.
3.2. Analysis on Factors Influencing Hydrogen Leakage Diffusion in Closed Space
3.2.1. Effect of Ventilation Opening Area on Hydrogen Leakage Diffusion
The truck’s vents are mostly located at the top of the space. As shown in Figure 7, vents of different areas are opened behind the wall surface of the space, close to the symmetrical surface, and are denoted as S, and the conditions of each vent are shown in Table 4.
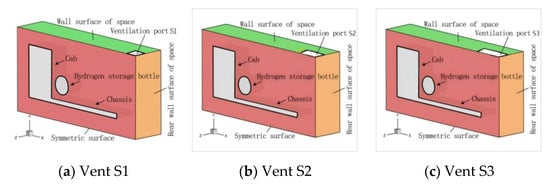
Figure 7.
Schematic diagram of spatial structure under different vent areas.
Table 4.
Ventilation vents with different areas.
In order to analyze the changes in the hydrogen concentration over time at different locations in the space, monitoring points M13-M16 were set at the four corners of the vehicle’s symmetrical surface: M13 (9.9 m, 4.9 m, 0 m), M14 (0.1 m, 4.9 m, 0 m), M15 (0.1 m, 0.1 m, 0 m), M16 (9.9 m, 0.1 m, 0 m). The changes in hydrogen concentration at each monitoring point under different ventilation opening areas are shown in Figure 8, and the hydrogen volume fraction of each monitoring point at 60 s is shown in Table 5.
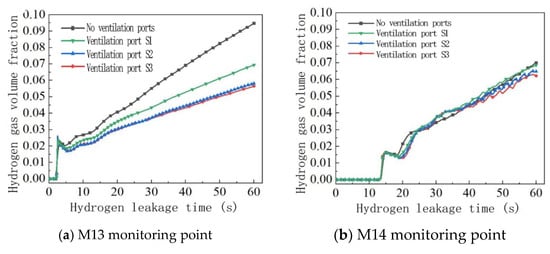
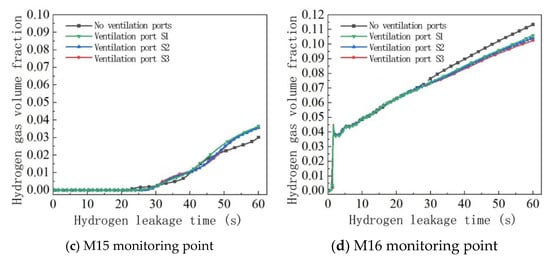
Figure 8.
Changes in hydrogen concentration at each monitoring point under different vent areas.
Table 5.
Hydrogen gas volume fraction at M13-M16 monitoring points at 60 s under different ventilation opening areas.
From the analysis of Figure 8 and Table 5, it can be seen that when hydrogen leaks backwards, the monitoring points M13 and M16 located behind the space first monitor the increase in hydrogen concentration. The concentration curve of the M13 monitoring point closest to the vent is the largest when the area of the vent is different. At the M13 monitoring point, the hydrogen gas volume fractions under the S1, S2, and S3 vents at 60 s were 0.069, 0.058, and 0.056, respectively, which was 27%, 39%, and 41% lower than that of the 0.095 without vents, respectively. It can be seen from this that the larger the vent, the greater the hydrogen concentration in the area near the vent is reduced. From the perspective of curve slope, the larger the vent, the lower the slope, which means that the larger the vent area is, the more it is conducive to reducing the rate of increase in the hydrogen concentration in the space. At the M16 monitoring point, the hydrogen concentrations in the S1, S2, and S3 vents at 60 s were 0.106, 0.104, and 0.103, respectively, which was 6.8%, 7.9%, and 8.8% lower than the volume concentration of 0.113 without vents, respectively. Judging from the curve value and slope, although the vent will also have an impact on the hydrogen concentration and its rising rate in the lower area of the rear of the space, the impact is very small. At monitoring points M14 and M15, the concentration curves under the vents in different areas are basically the same. The reason is that the two monitoring points are located in the front of the space and are the farthest away from the vents located in the rear. The ventilation port has little effect on the hydrogen concentration in the front area of the space.
Therefore, when the area of the vent increases, although the hydrogen concentration value and concentration increase rate in the area near the vent decrease, the affected area is limited to the vicinity of the vent, and basically does not affect the area far away from the vent.
3.2.2. Analysis on the Influence of Ventilation Opening Position on Hydrogen Leakage Diffusion
After hydrogen leaks from leakage port I along the X-coordinate axis to the rear of the vehicle, it will first spread to the rear wall of the space. At the heights of the rear wall and the leakage port of the space, a ventilation port S4 is provided, and a ventilation port of equal area S1 (shown in Figure 7) is arranged behind the upper wall of the space to analyze the influence of the position of the ventilation port on the hydrogen concentration in the closed space. The structure and situation of the vents are shown in Figure 9 and Table 6, respectively.
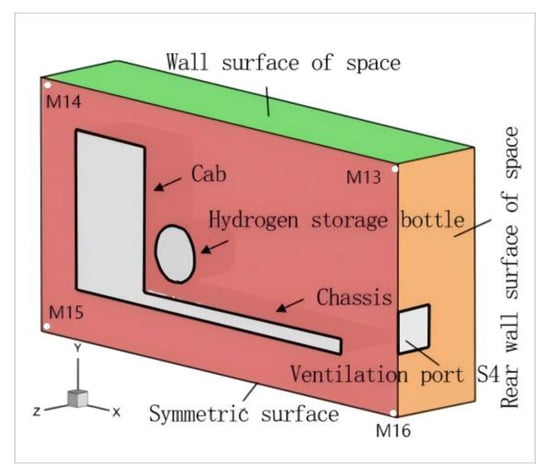
Figure 9.
Schematic diagram of the spatial structure under different vent positions.
Table 6.
Ventilation ports at different locations.
In order to analyze the changes in spatial hydrogen concentration over time at different ventilation opening positions, the changes in hydrogen concentration at the M13-M16 monitoring point were analyzed. The changes in hydrogen concentration at each monitoring point at different ventilation opening positions are shown in Figure 10, and the hydrogen volume fraction at the monitoring point at 60 s is shown in Table 7.
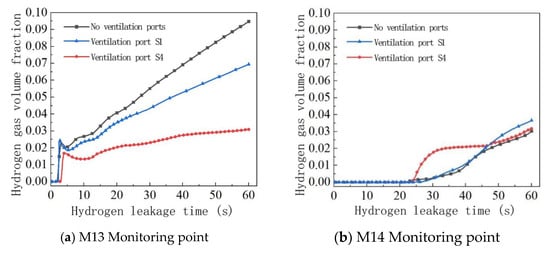
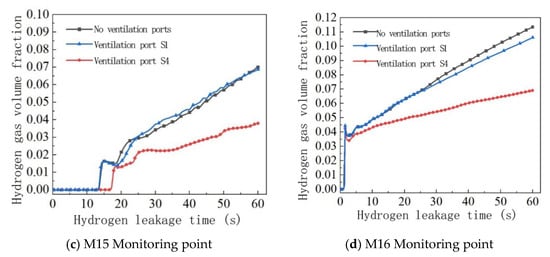
Figure 10.
Changes in hydrogen concentration at each monitoring point under different vent positions.
Table 7.
The hydrogen gas volume fractions of each monitoring point at 60 s at different ventilation opening positions.
It can be seen that the different positions of the vents have little impact on the hydrogen concentration at the M15 monitoring point, but at monitoring points M13, M14, and M16, the slope and concentration value of the hydrogen concentration change curve in an environment without ventilation ports, with ventilation port S1, and with ventilation port S4 decrease in sequence, indicating that the position of the ventilation port significantly affects the increase rate and concentration of the hydrogen concentration at the two monitoring points. In the case of hydrogen leaking backwards, compared with the top vent S1, the rear vent S4 has a more significant impact on the hydrogen concentration and the concentration increase rate in the space.
The hydrogen gas volume fraction at the M13–M16 monitoring points at 60 s is shown in Table 7. It can be seen that the hydrogen gas volume fractions of the vent S4 at the monitoring points of M13, M14, and M16 are 0.031, 0.038, and 0.069, respectively. Compared with the two cases without vents and with vent S1, the hydrogen gas volume fraction is significantly reduced. The reason is that in the case of hydrogen leaking backwards, the S4 vent at the back of the space can directly diffuse more hydrogen to the outside world. The diffusion process of hydrogen in the space has changed, which significantly reduces the hydrogen concentration in more areas in the space.
From the above analysis, it can be seen that the impact of the rear vent on hydrogen concentration is reflected in more areas of the enclosed space, while the impact of the top vent is limited to the area near the vent. If hydrogen accidentally leaks in the enclosed space, allowing hydrogen to diffuse to the external environment as soon as possible will minimize the rate of increase in the hydrogen concentration and concentration in the space. When the area of the vent is limited, analyzing the location and direction of leakage of the hydrogen gas and opening a vent in a reasonable position can better improve the ventilation effect in the enclosed space.
4. Conclusions
(1) When hydrogen leaks from leakage port I to the rear of the vehicle, the hydrogen near the edge of the space above gathers towards the intersection of the space’s wall during the forward diffusion process, and the hydrogen inside also diffuses downward during the forward movement. The area with a lower hydrogen concentration in the space is located below the cab.
(2) When port I leaks to the rear of the car, the hydrogen first diffuses to the rear of the space and then diffuses around along the wall. Under leak port II, the hydrogen leaks towards the cab and diffuses around along the rear wall of the cab. When the hydrogen leaks upward from leak port III, it is basically not affected by the structure of the vehicle, and the hydrogen diffuses quickly in the space.
(3) When the vent is at the top of the space, the hydrogen concentration near the vent decreases but has little effect on the hydrogen concentration in other areas of the space. When the vent is at the top and rear of the space, the rate of increase and concentration of hydrogen concentration in the space can be significantly reduced.
5. Patents
This work was supported by the National Key R&D Program (NO. 2022YFB2502402).
Author Contributions
Conceptualization, C.L. and Z.X.; methodology, Z.X.; software, C.L.; validation, Z.X.; formal analysis, C.L.; investigation, C.L.; resources, Z.X.; data curation, Z.X.; writing—original draft preparation, C.L.; writing—review and editing, Z.X.; visualization, Z.X.; supervision, Z.X.; project administration, Z.X.; funding acquisition, Z.X. All authors have read and agreed to the published version of the manuscript.
Funding
This research was funded by the National Key R&D Program grant number [2022YFB2502402]
Data Availability Statement
The raw data supporting the conclusions of this article will be made available by the authors on request.
Conflicts of Interest
Author Congxin Li was employed by the company State Power Investment Corporation Hydrogen Energy Tech Co., Ltd. The remaining authors declare that the research was conducted in the absence of any commercial or financial relationships that could be construed as a potential conflict of interest.
References
- Sun, R.; Pu, L.; He, Y.; Wang, T.; Tan, H. Phase change modeling of air at the liquid hydrogen release. Int. J. Hydrogen Energy 2024, 50, 717–731. [Google Scholar] [CrossRef]
- Jiao, M. Simulation Analysis and Analysis of Hydrogen Leakage Diffusion in Fuel Cell Truck Hydrogen Supply System. Master’s Thesis, Beijing Jiaotong University, Beijing, China, 2022. [Google Scholar]
- Salva, J.A.; Tapia, E.; Iranzo, A.; Pino, F.J.; Cabrera, J.; Rosa, F. Safety study of a hydrogen leak in a fuel cell vehicle using computational fluid dynamics. Int. J. Hydrogen Energy 2012, 6, 5299–5306. [Google Scholar] [CrossRef]
- Schiavetti, M.; Mattoli, V.; Lutzemberger, G.; Dario, P.; Carcassi, M. Experimental study of hydrogen releases in the passenger compartment of a Piaggio Porter. Int. J. Hydrogen Energy 2012, 22, 17470–17477. [Google Scholar] [CrossRef]
- Lacome, J.M. Large-scale hydrogen release in an isothermal confined area. Int. J. Hydrogen Energy 2011, 3, 2302–2312. [Google Scholar] [CrossRef]
- Malakhov, A.A.; Avdeenkov, A.V.; Du Toit, M.H.; Bessarabov, D.G. CFD simulation and experimental study of a hydrogen leak in a semi-closed space with the purpose of risk mitigation. Int. J. Hydrogen Energy 2020, 45, 9231–9240. [Google Scholar] [CrossRef]
- De Stefano, M.; Rocourt, X.; Sochet, I.; Daudey, N. Hydrogen dispersion in a closed environment. Int. J. Hydrogen Energy 2019, 23, 9031–9040. [Google Scholar] [CrossRef]
- Venetsanos, A.G.V.I.; Papanikolaou, E.; Bartzis, J.G. The ADREA-HF CFD code for consequence assessment of hydrogen applications. Int. J. Hydrogen Energy 2010, 8, 3908–3918. [Google Scholar] [CrossRef]
- Venetsanos, A.G.; Papanikolaou, E.; Cariteau, B.; Adams, P.; Bengaouer, A. Hydrogen permeation from CGH2 vehicles in garages: CFD dispersion calculations and experimental validation. Int. J. Hydrogen Energy 2010, 8, 3848–3856. [Google Scholar] [CrossRef]
- Schiavetti, M.; Carcassi, M.N. Experimental tests of inhomogeneous hydrogen deflagrations in the presence of obstacles. Int. J. Hydrogen Energy 2021, 46, 12455–12463. [Google Scholar] [CrossRef]
- Liu, Y.; Qin, Y.; Sheng, P. Numerical simulation study on hydrogen leakage diffusion in fuel vehicles. China Prod. Saf. Sci. Technol. 2009, 5, 5–8. [Google Scholar]
- Yu, Y.; Deng, Y. Hydrogen leakage and diffusion in high-pressure bays of fuel cell buses. J. Zhejiang Univ. 2020, 54, 381–388. [Google Scholar]
- Hu, Z.; Deng, Y.; Li, J. Research on hydrogen leakage and diffusion in fuel cell buses. Digit. Manuf. Sci. 2019, 17, 271–275. [Google Scholar]
- Jiao, M.; Zhu, H.; Huang, J.; Zhang, X. Numerical Simulation of Hydrogen Leakage and Diffusion Process of Fuel Cell Vehicle. World Electr. Veh. J. 2021, 12, 193. [Google Scholar] [CrossRef]
- ZHENG,J; GUO,J; HE,Y. Numerical Investigation on the Dispersion Characteristics of Liquid Hydrogen Leakage under Different Storage Conditions in a Hydrogen Production Station. Batteries 2023, 9, 570. [Google Scholar]
- WANG,H; YU,Y; ZHANG,X. Leakage Detection of Hydrogen Fuel Cell Stack Based on Cross-Sensing of Temperature and Voltage. Batteries 2022, 8, 251. [Google Scholar]
- Giannissi, S.G.; Tolias, I.C.; Melideo, D.; Baraldi, D.; Shentsov, V.; Makarov, D.; Molkov, V.; Venetsanos, A.G. On the CFD modelling of hydrogen dispersion at low-Reynolds number release in closed facility. Int. J. Hydrogen Energy 2020, 45, 9156–9164. [Google Scholar] [CrossRef]
- LI,X; CHEN,R; ZHOU,T. Hydrogen Leakage Diffusion Analysis and Optimal Design for Hydrogen Tank Cabin of Aircraft. Aeronaut. Sci. Technol. 2025, 36, 45–52. [Google Scholar]
- LIU,F; WANG,D; ZHAO,H. Rapid Visual Detection Method and Numerical Simulation for High-Pressure Hydrogen Leakage. Meas. Technol. 2020, 40, 37–42. [Google Scholar]
- Zhang, L.; Wang, Z.; Li, H. Simulation of Leakage and Diffusion Characteristics of On-board Hydrogen Storage System for Fuel Cell Vehicles. Automot. Eng. 2024, 46, 891–899. [Google Scholar]
- Yang, F. Study on Hydrogen Leakage and Diffusion Mechanism and Emergency Ventilation Strategy in Hydrogen Fuel Cell Marine Compartments. Master’s Thesis, Dalian University of Technology, Dalian, China, 2024. [Google Scholar]
- Wu, X. Simulation of Phase Change Process and Safety Protection Research for Liquid Hydrogen Storage Tank Leakage. Ph.D. Thesis, Tsinghua University, Beijing, China, 2023. [Google Scholar]
- Li, Y. Numerical Simulation Study on Hydrogen Leakage Diffusion in Underground Parking Lots. Master’s Thesis, Nanjing University of Technology Safety Science and Engineering, Nanjing, China, 2017. [Google Scholar]
- Rong, Y.; Peng, J.; Gao, J.; Zhang, X.; Li, X.; Pan, X.; Chen, J.; Chen, S. Numerical Investigation on the Liquid Hydrogen Leakage and Protection Strategy. Processes 2023, 11, 1173. [Google Scholar] [CrossRef]
- Pitts, W.M.; Yang, J.C.; Blais, M.; Joyce, A. Dispersion and burning behavior of hydrogen released in a full-scale residential garage in the presence and absence of conventional automobiles. Int. J. Hydrog. Energy 2012, 37, 17457–17469. [Google Scholar] [CrossRef]
Disclaimer/Publisher’s Note: The statements, opinions and data contained in all publications are solely those of the individual author(s) and contributor(s) and not of MDPI and/or the editor(s). MDPI and/or the editor(s) disclaim responsibility for any injury to people or property resulting from any ideas, methods, instructions or products referred to in the content. |
© 2025 by the authors. Licensee MDPI, Basel, Switzerland. This article is an open access article distributed under the terms and conditions of the Creative Commons Attribution (CC BY) license (https://creativecommons.org/licenses/by/4.0/).