
A SOH Estimation Method for Lithium-Ion Batteries Based on CPA and CNN-KAN

 , , and
Abstract
1. Introduction
- (1)
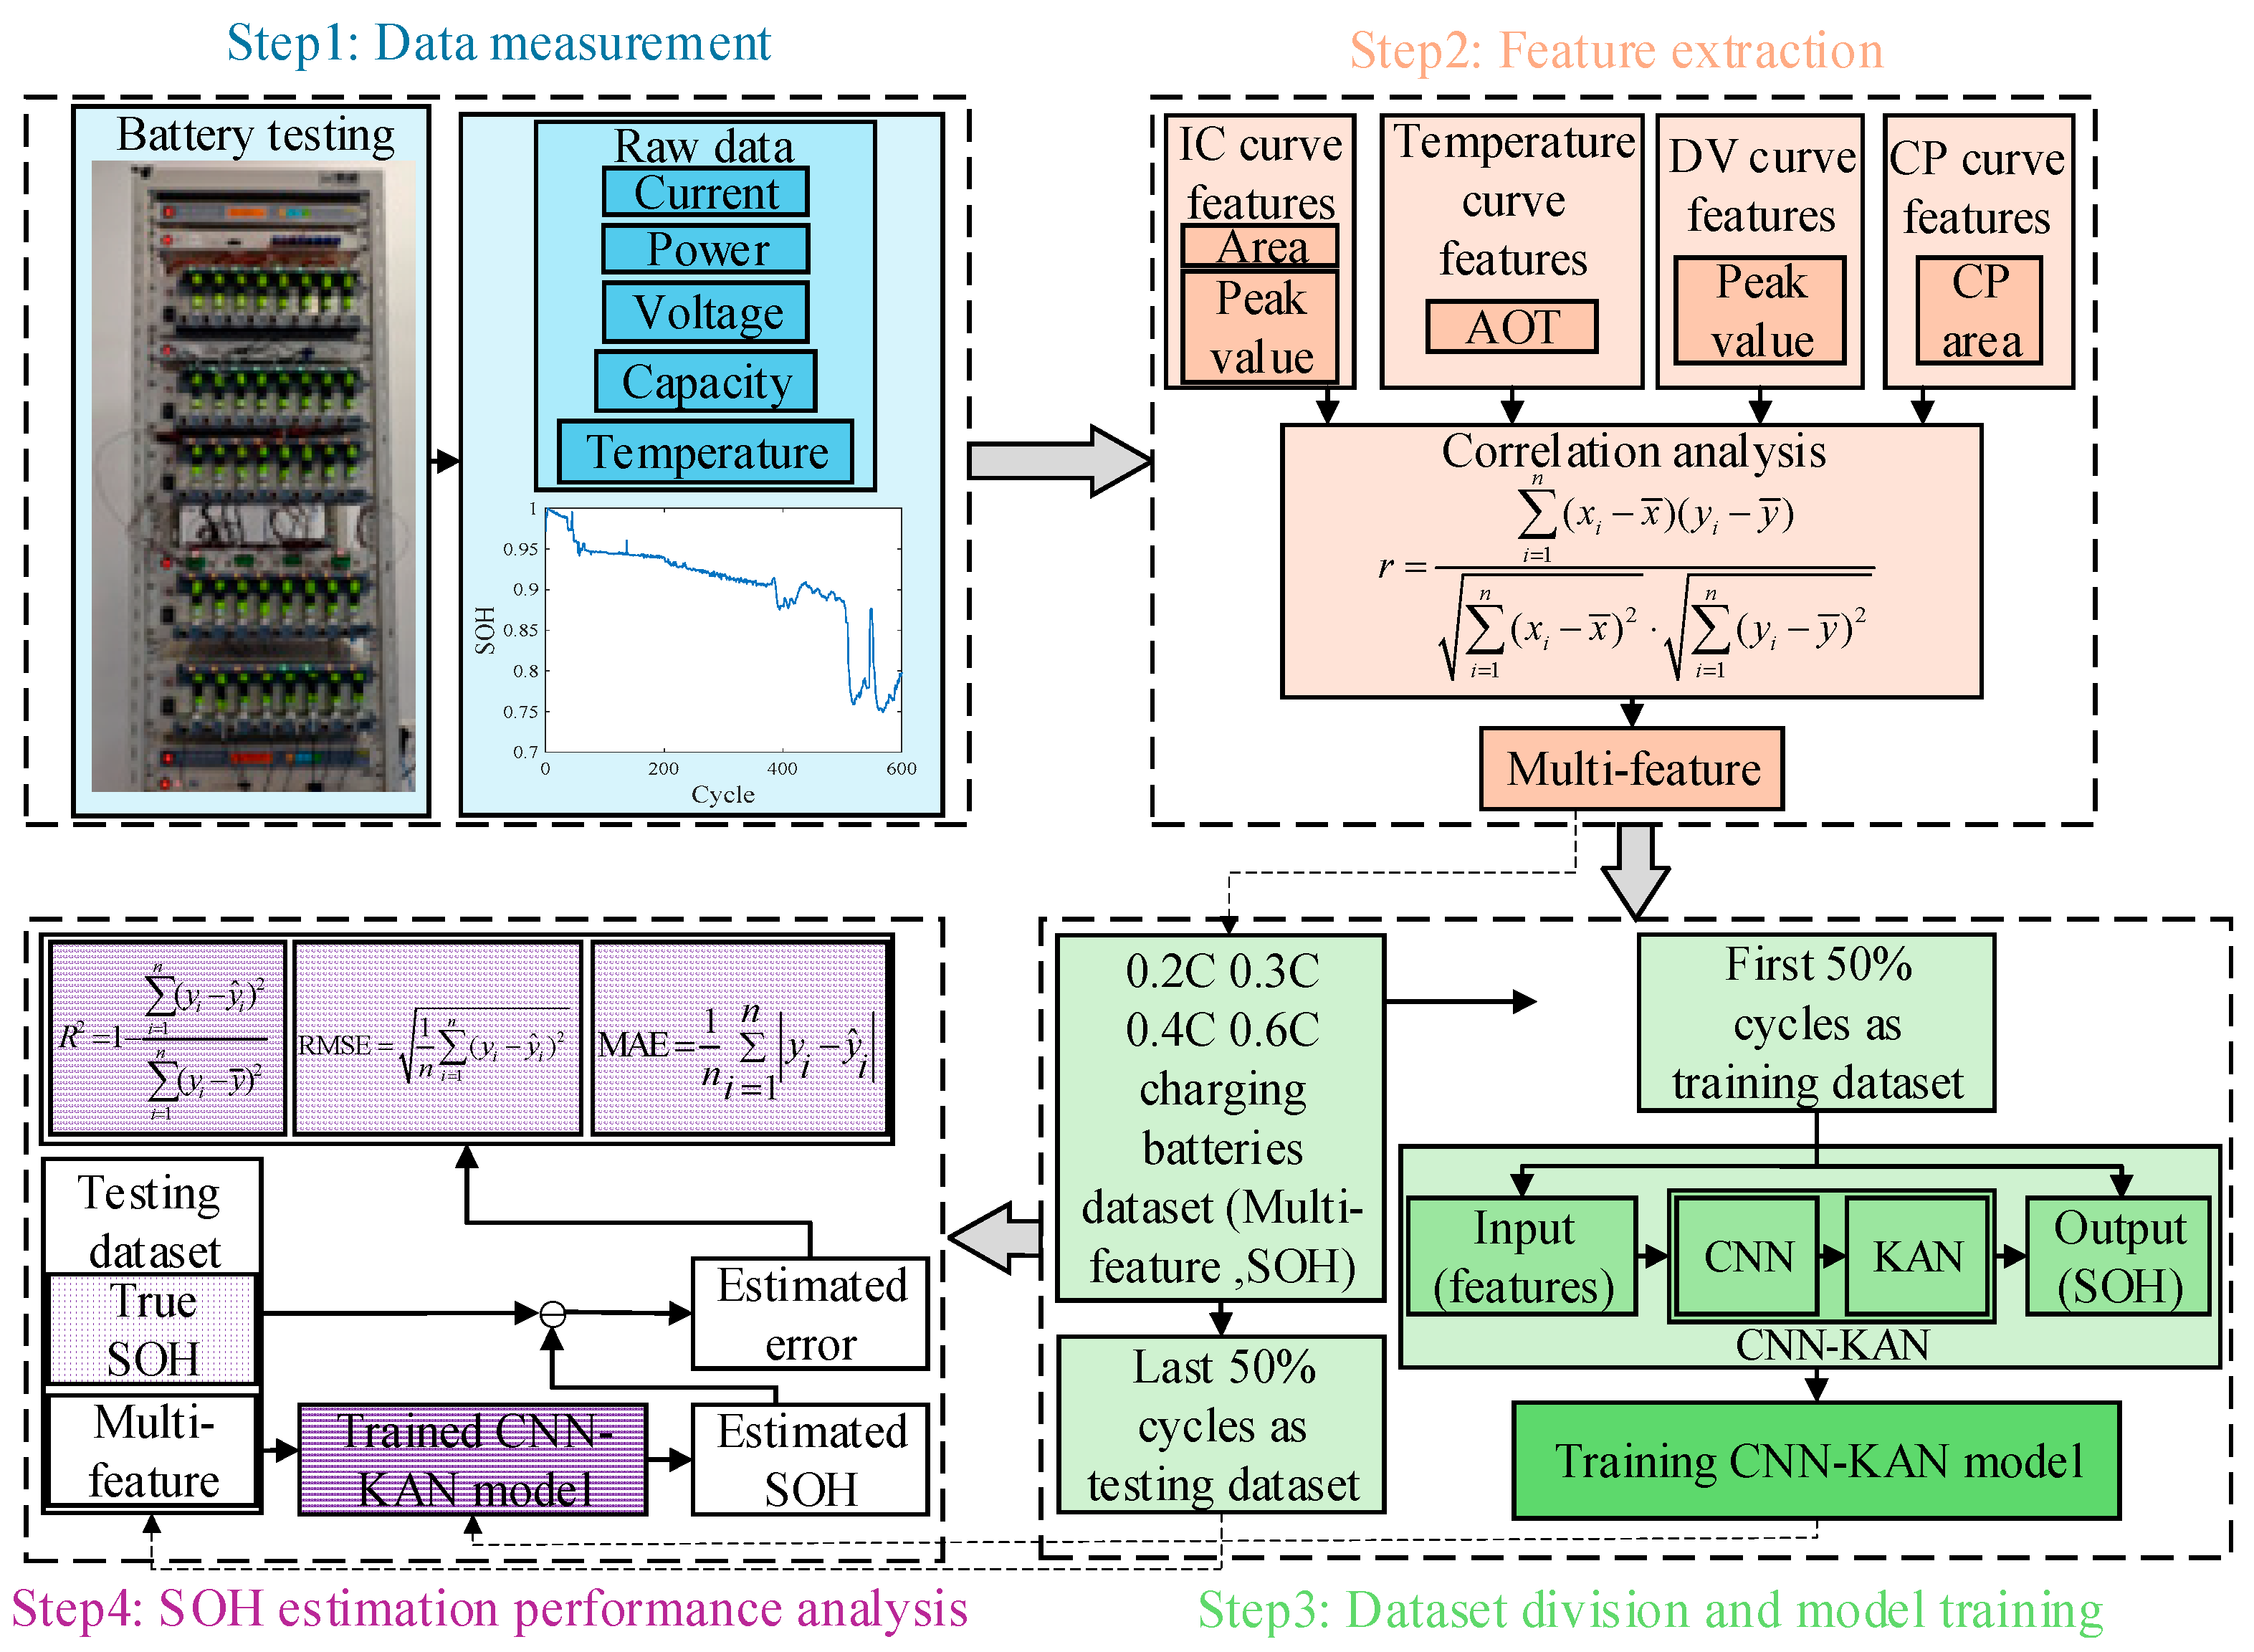
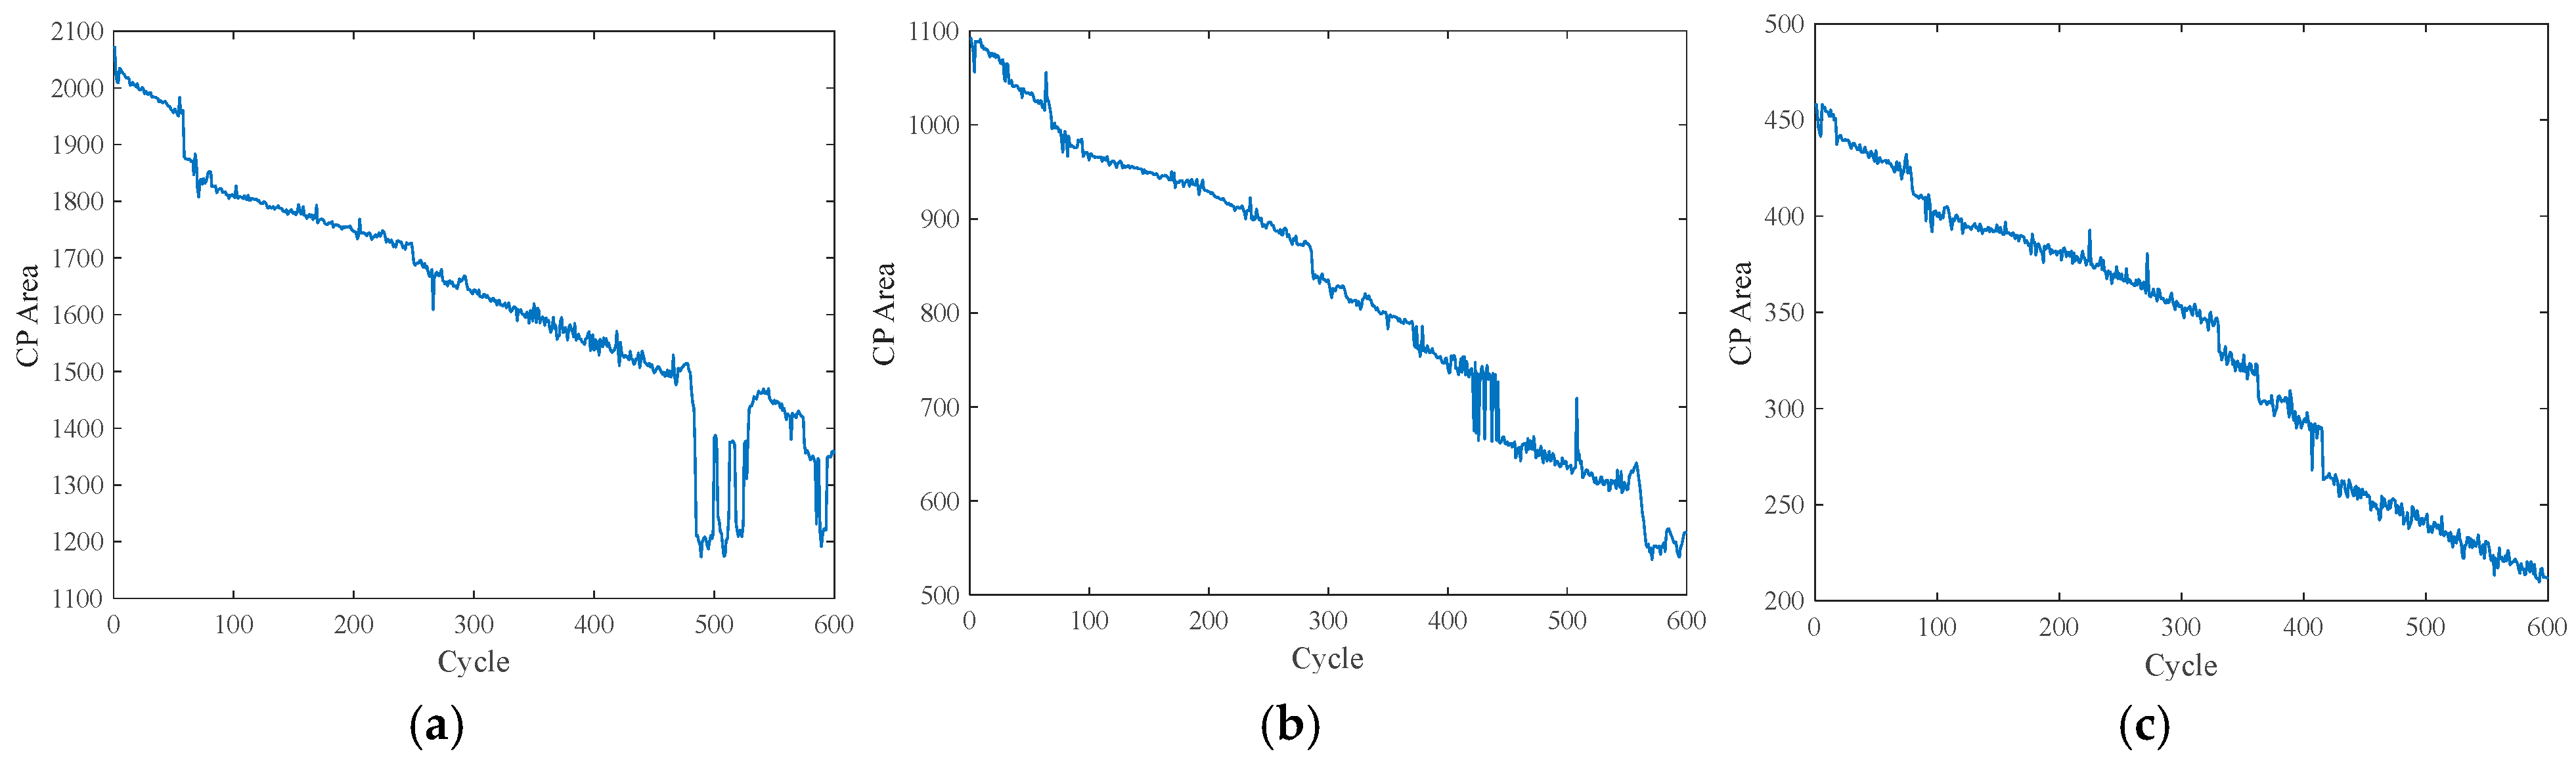
- In the realm of feature extraction, this paper introduces a multi-dimensional feature that integrates temperature and CP. Traditional Incremental Capacity (IC) [40] and Differential Voltage (DV) [41] curves frequently omit data segments with constant voltage during the analysis of charging data, resulting in the loss of valuable information. The CPA method addresses this pre-processing loss by directly examining the dynamic changes in capacity and power throughout the charging process. Furthermore, by incorporating temperature characteristics that are closely associated with battery aging, this approach optimizes the utilization of charging data;
- (2)
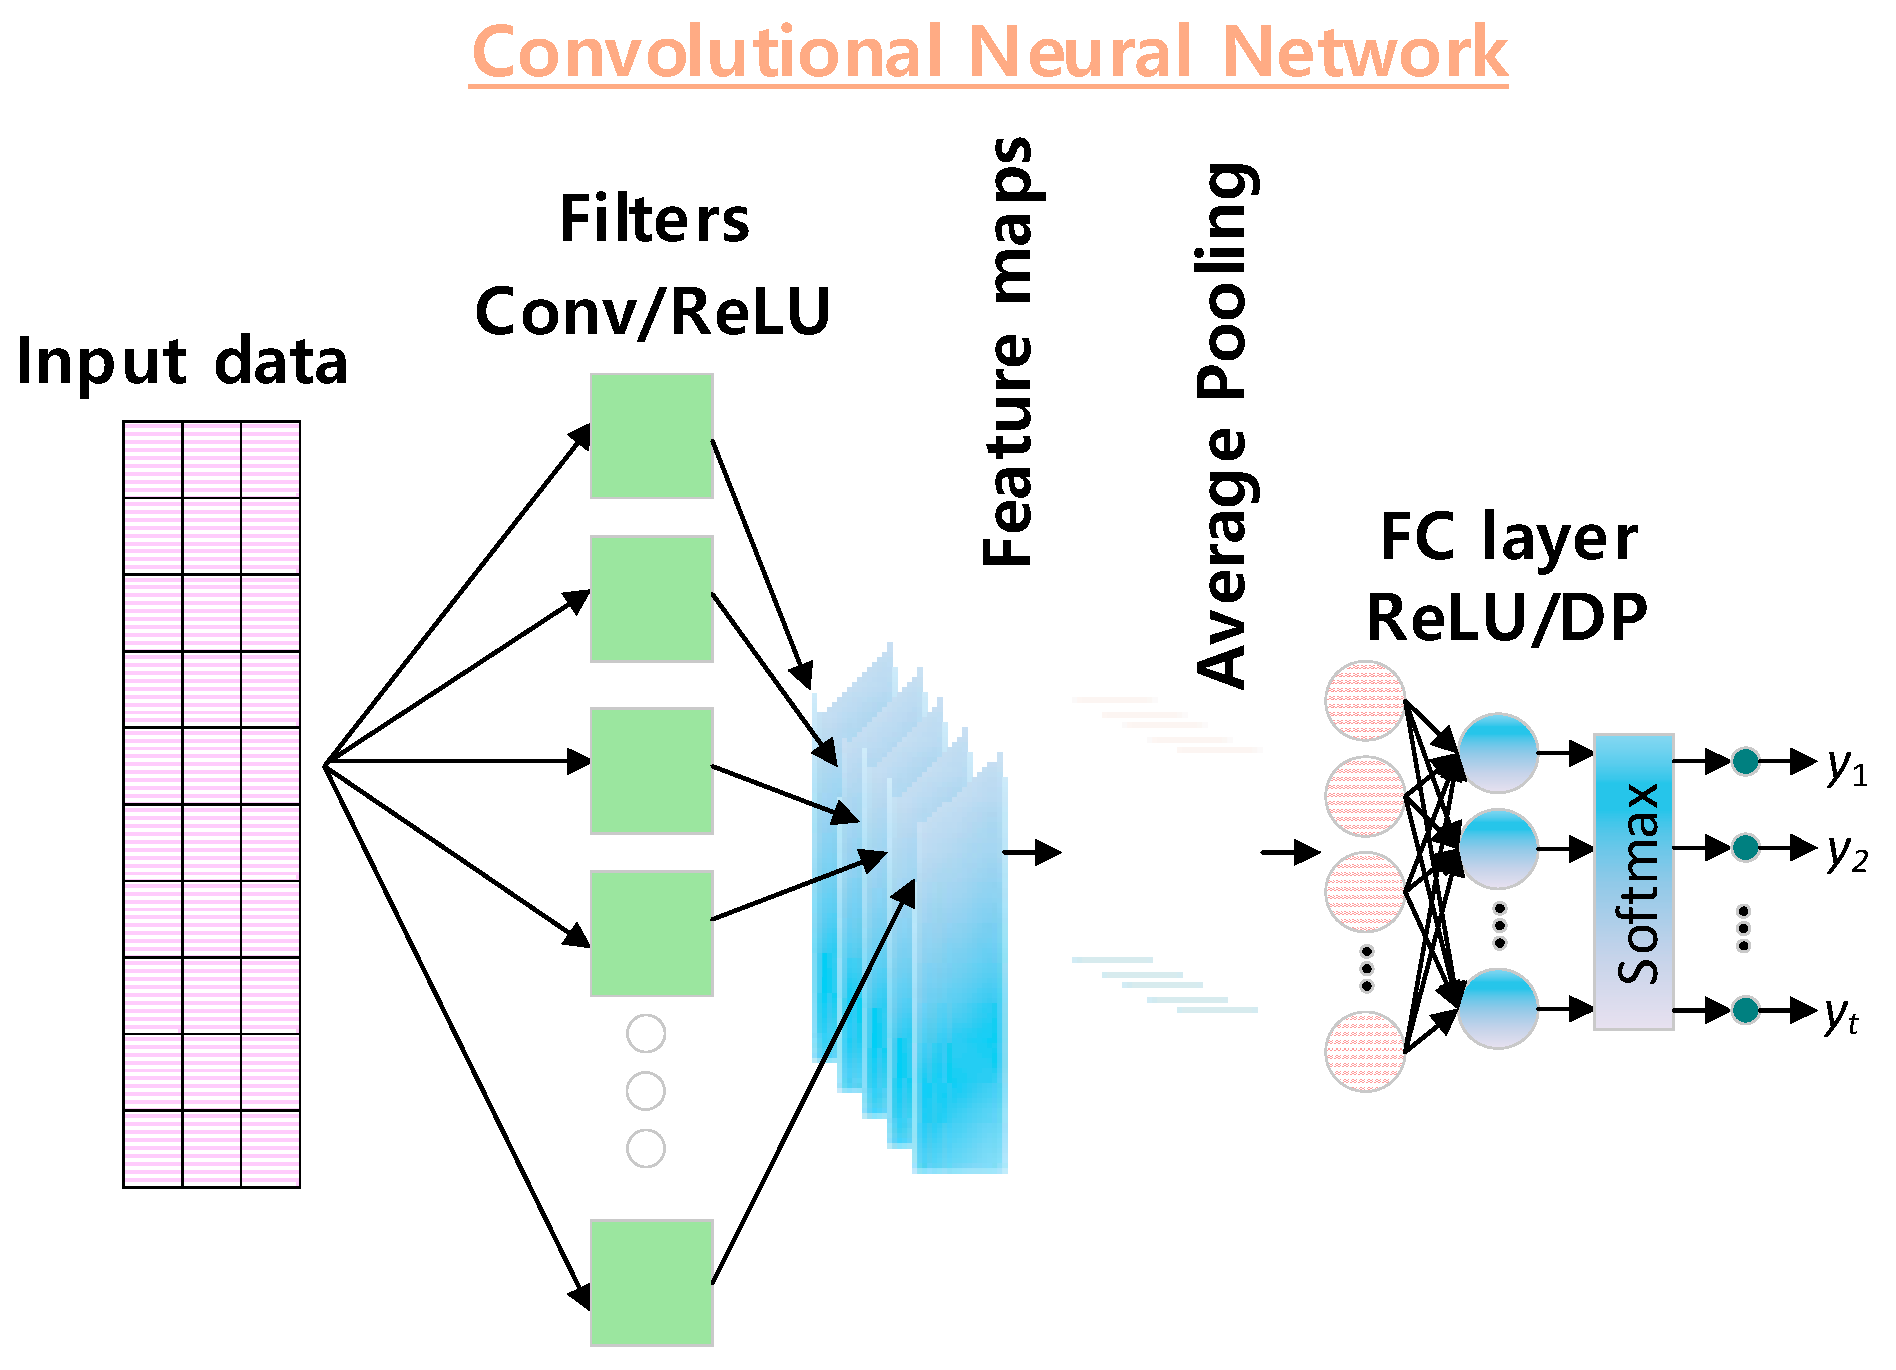
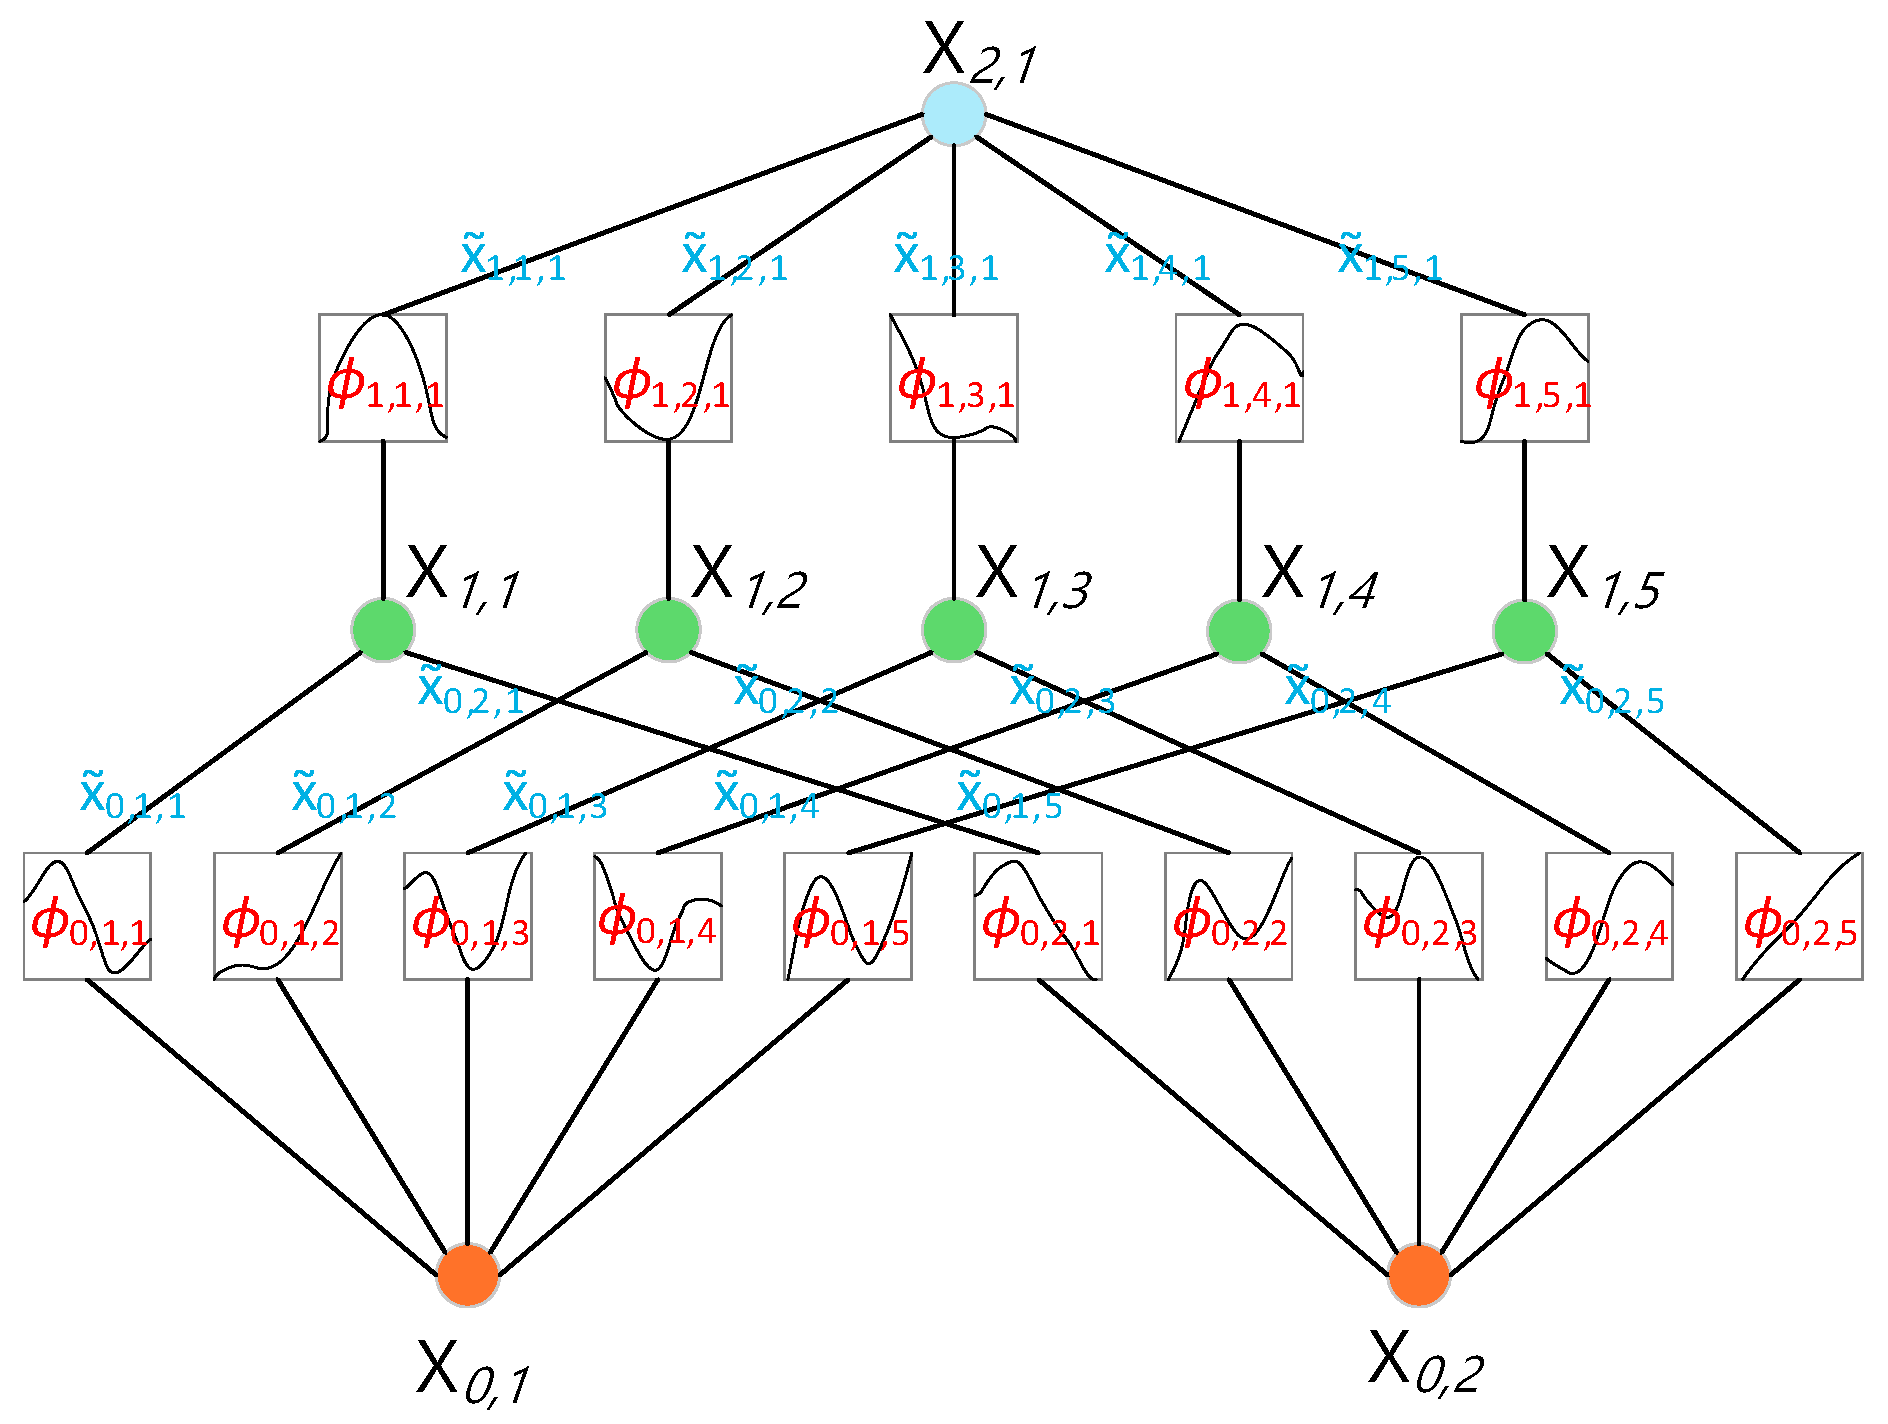
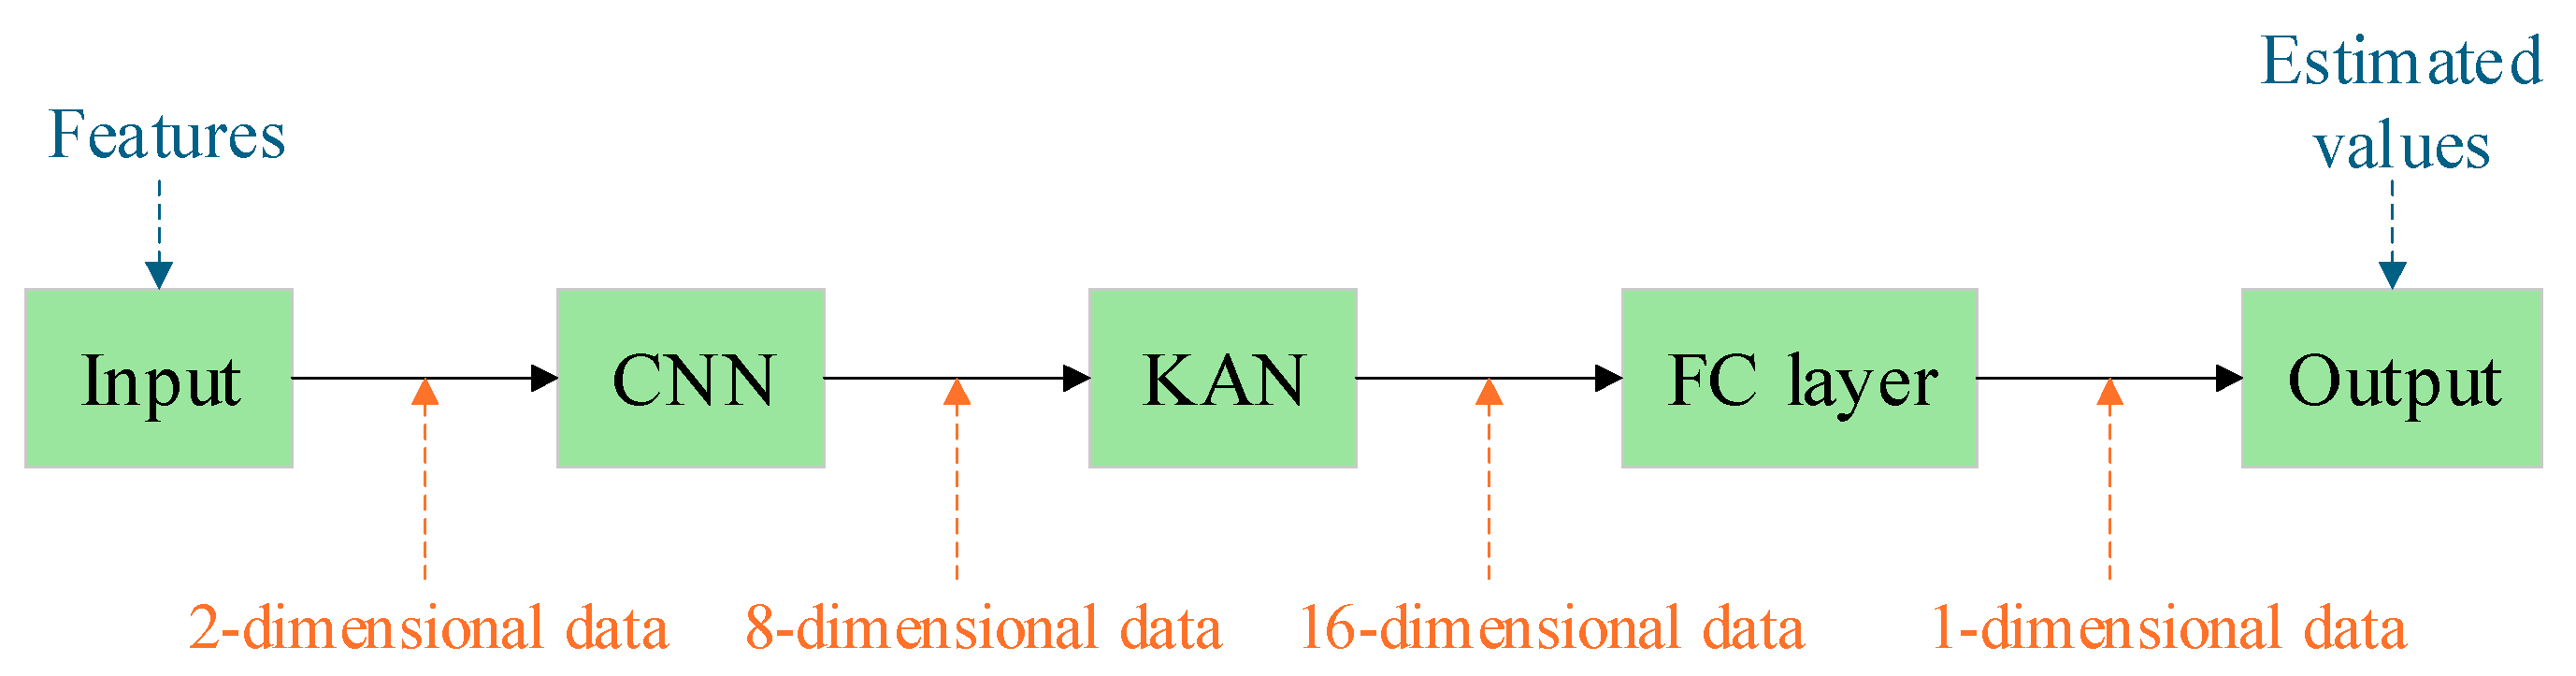
- This study presents an innovative CNN-KAN fusion model that achieves significant advancements in various aspects by harnessing the local feature extraction capabilities of CNN and the nonlinear modeling advantages of KAN. Specifically, the CNN module effectively captures essential trend features within the multi-feature sequence while simultaneously reducing data dimensions. By employing a mathematical representation theory, the KAN layer transforms high-dimensional feature mappings into a combination of univariate functions with strong interpretability, thereby greatly enhancing the model’s overall interpretability.
2. Lithium Battery SOH
3. Feature Correlation Analysis and Selection
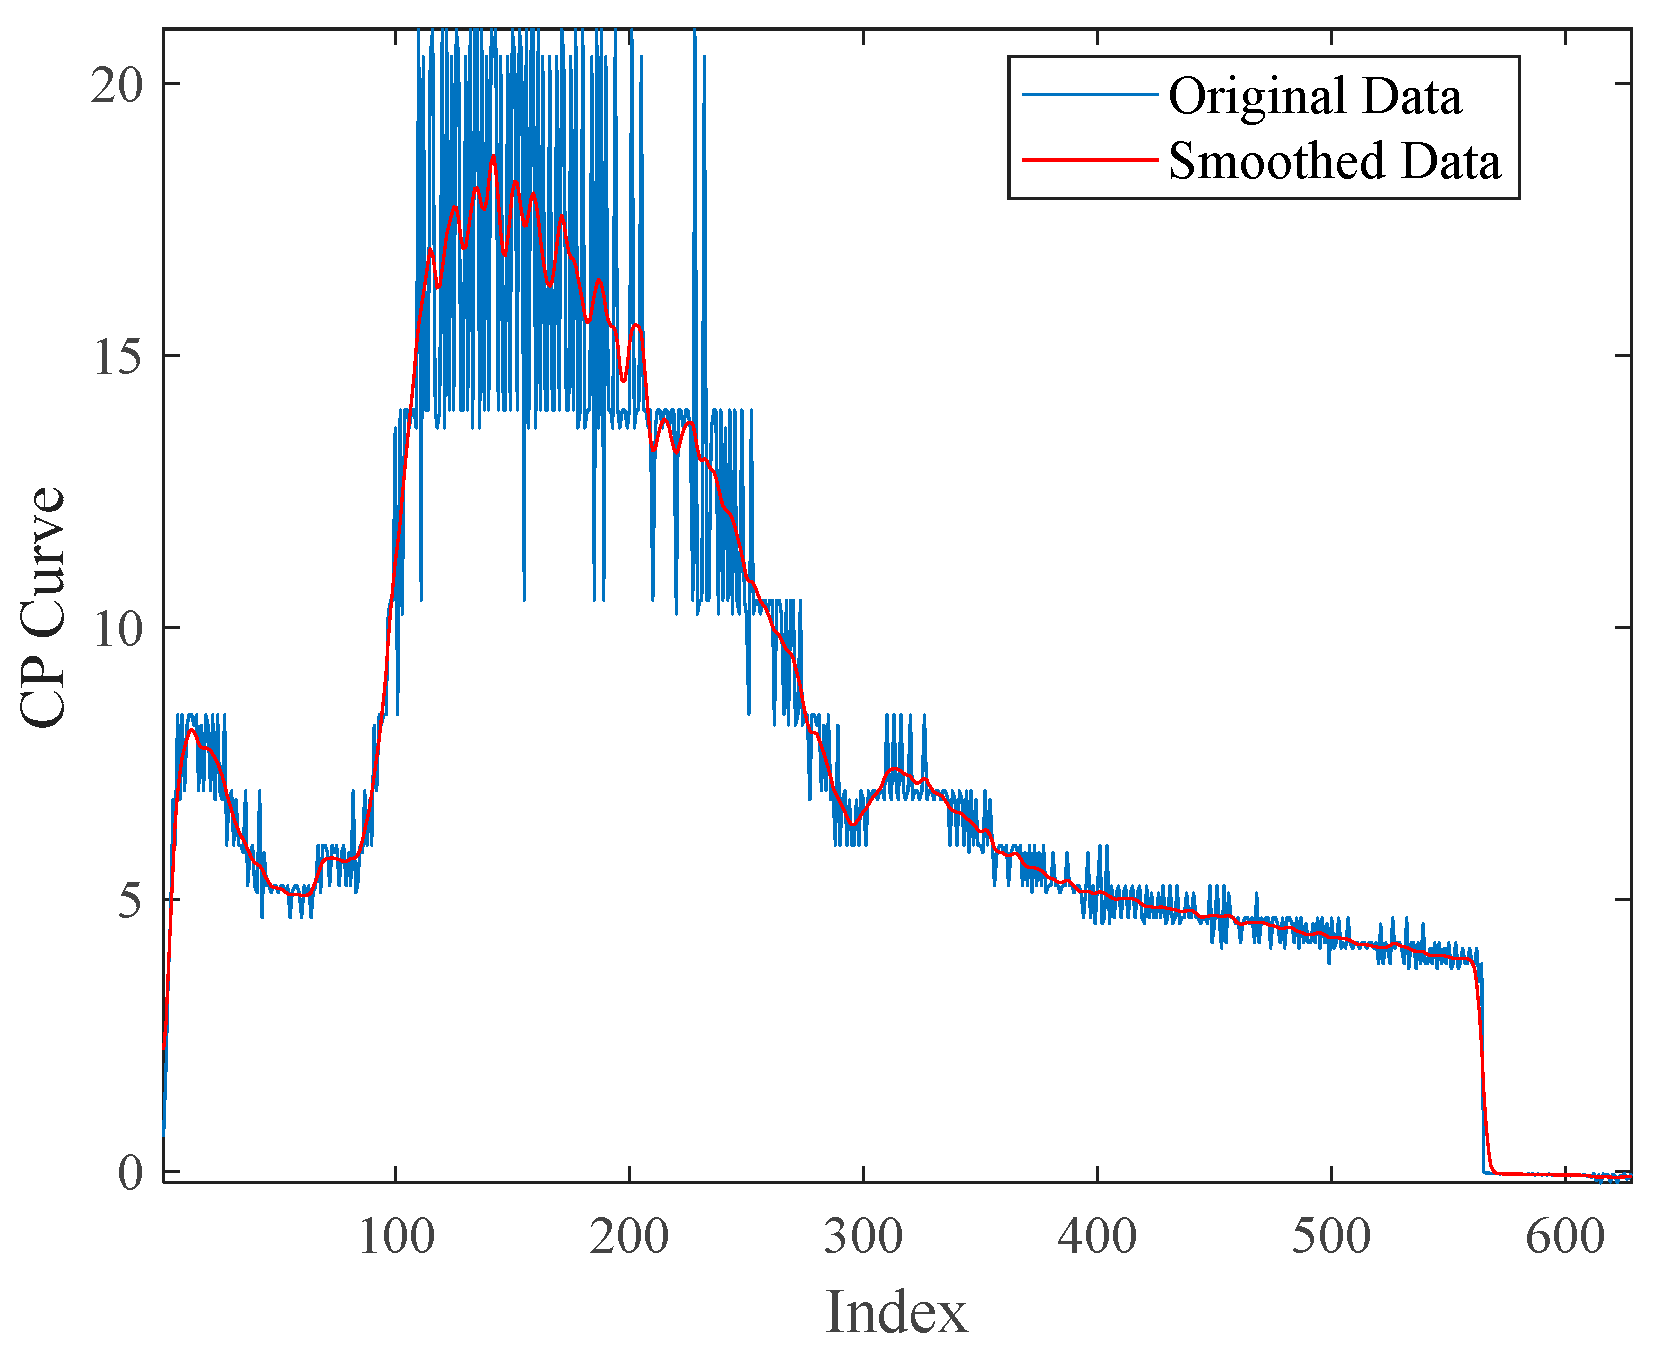
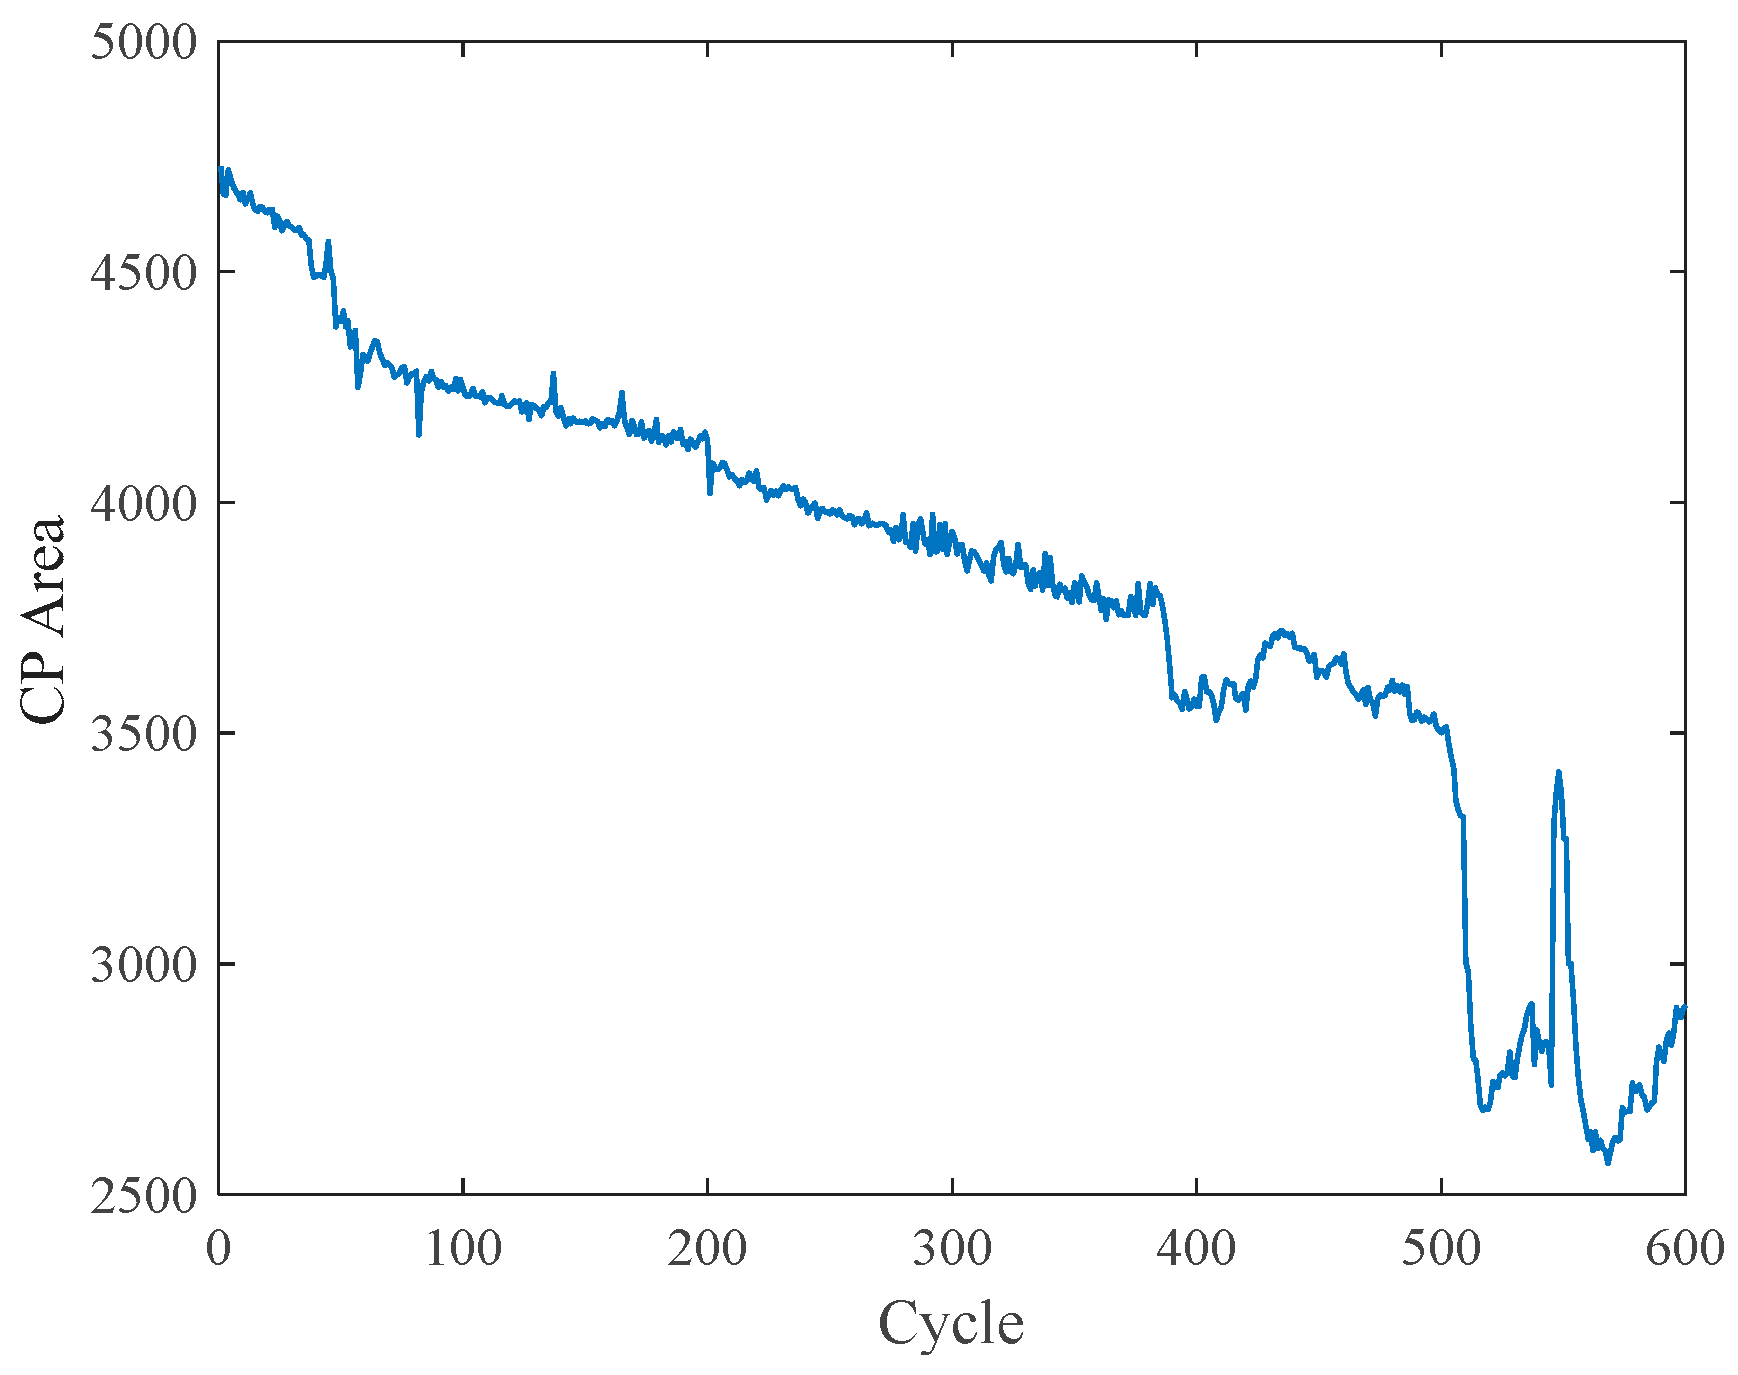
3.1. CPA
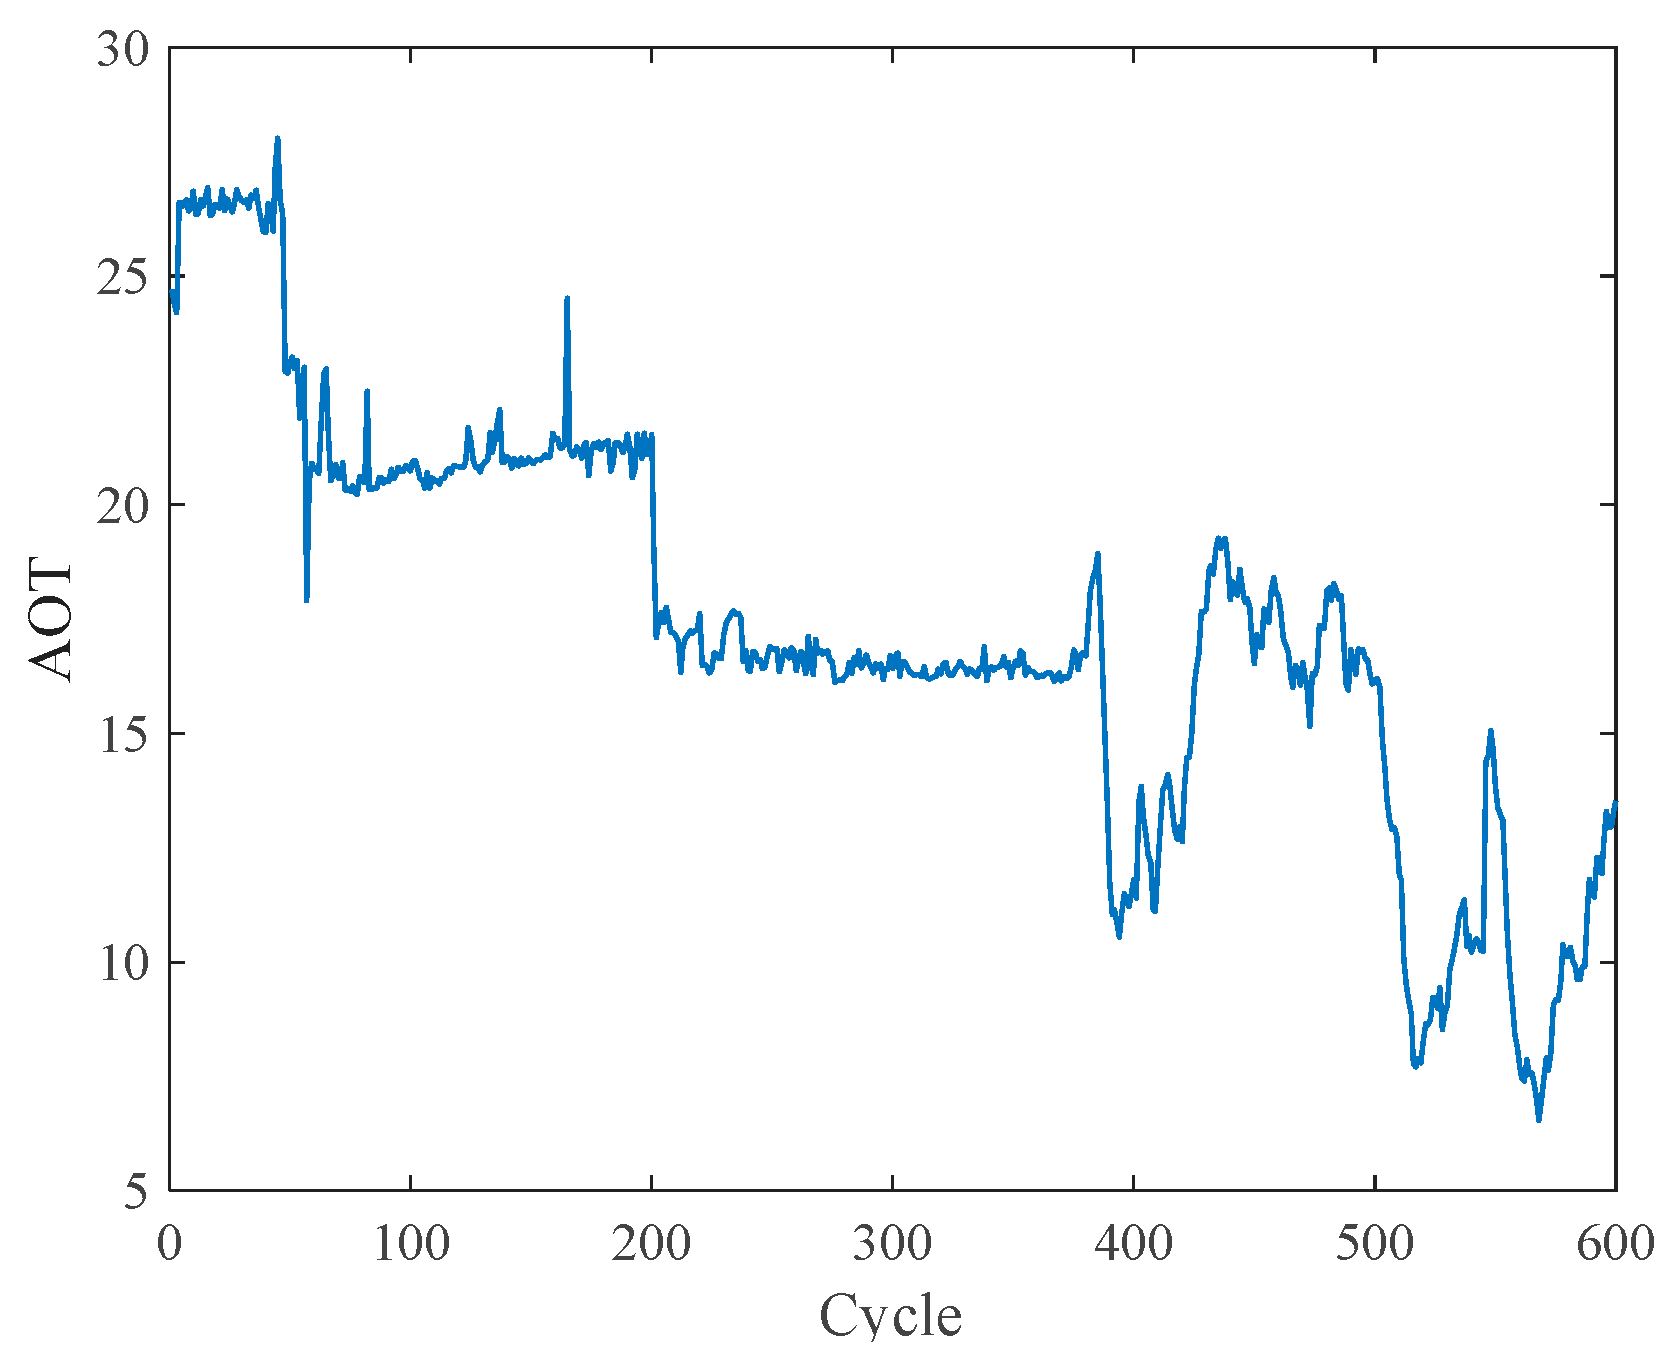
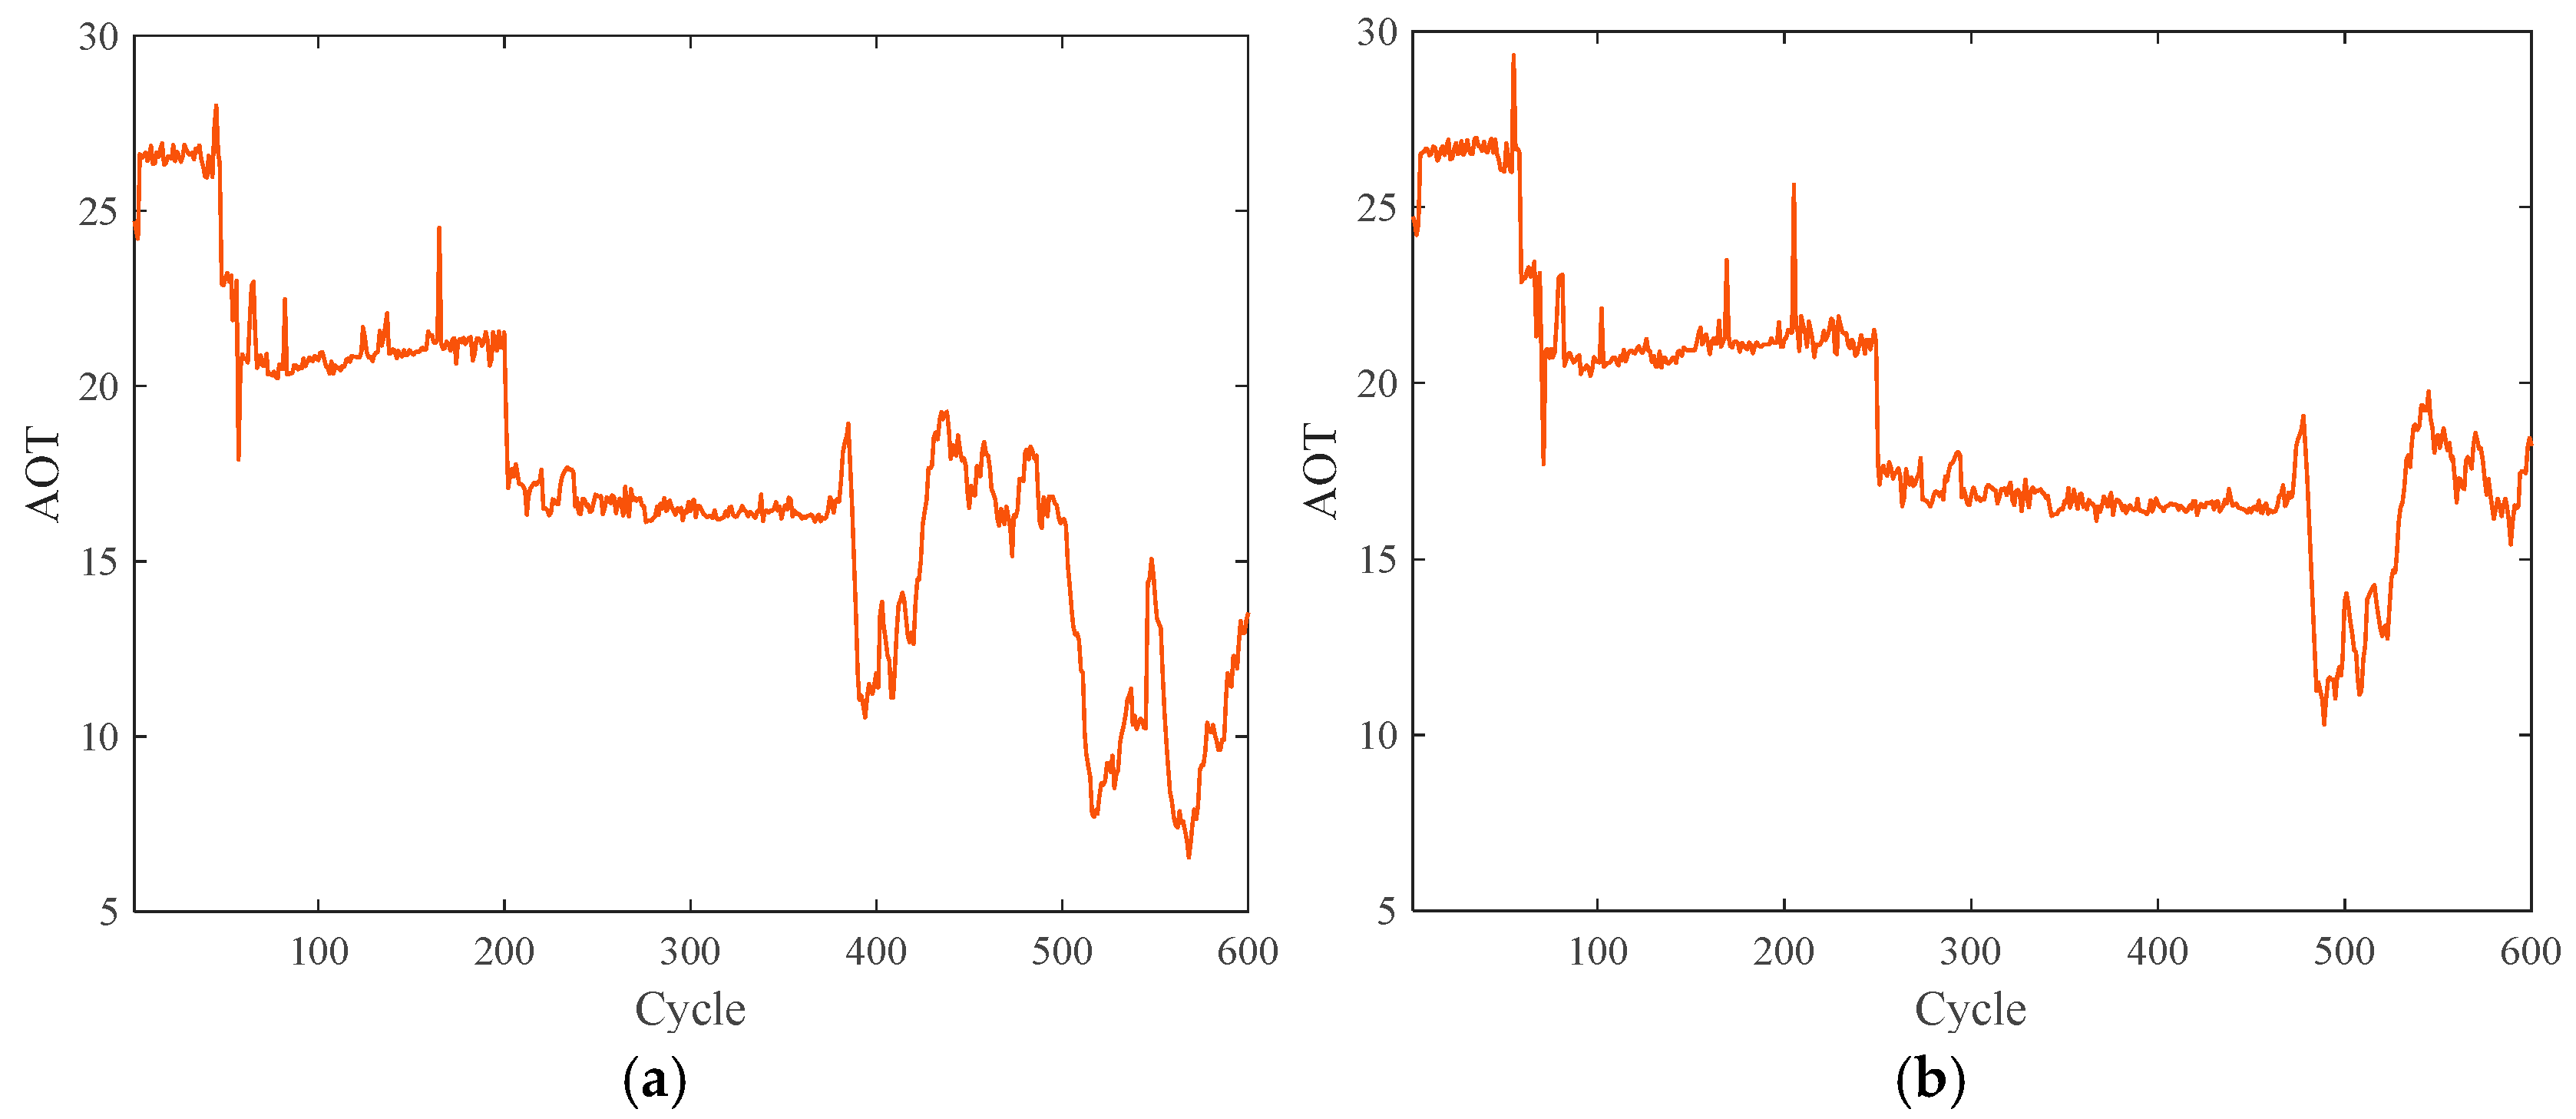
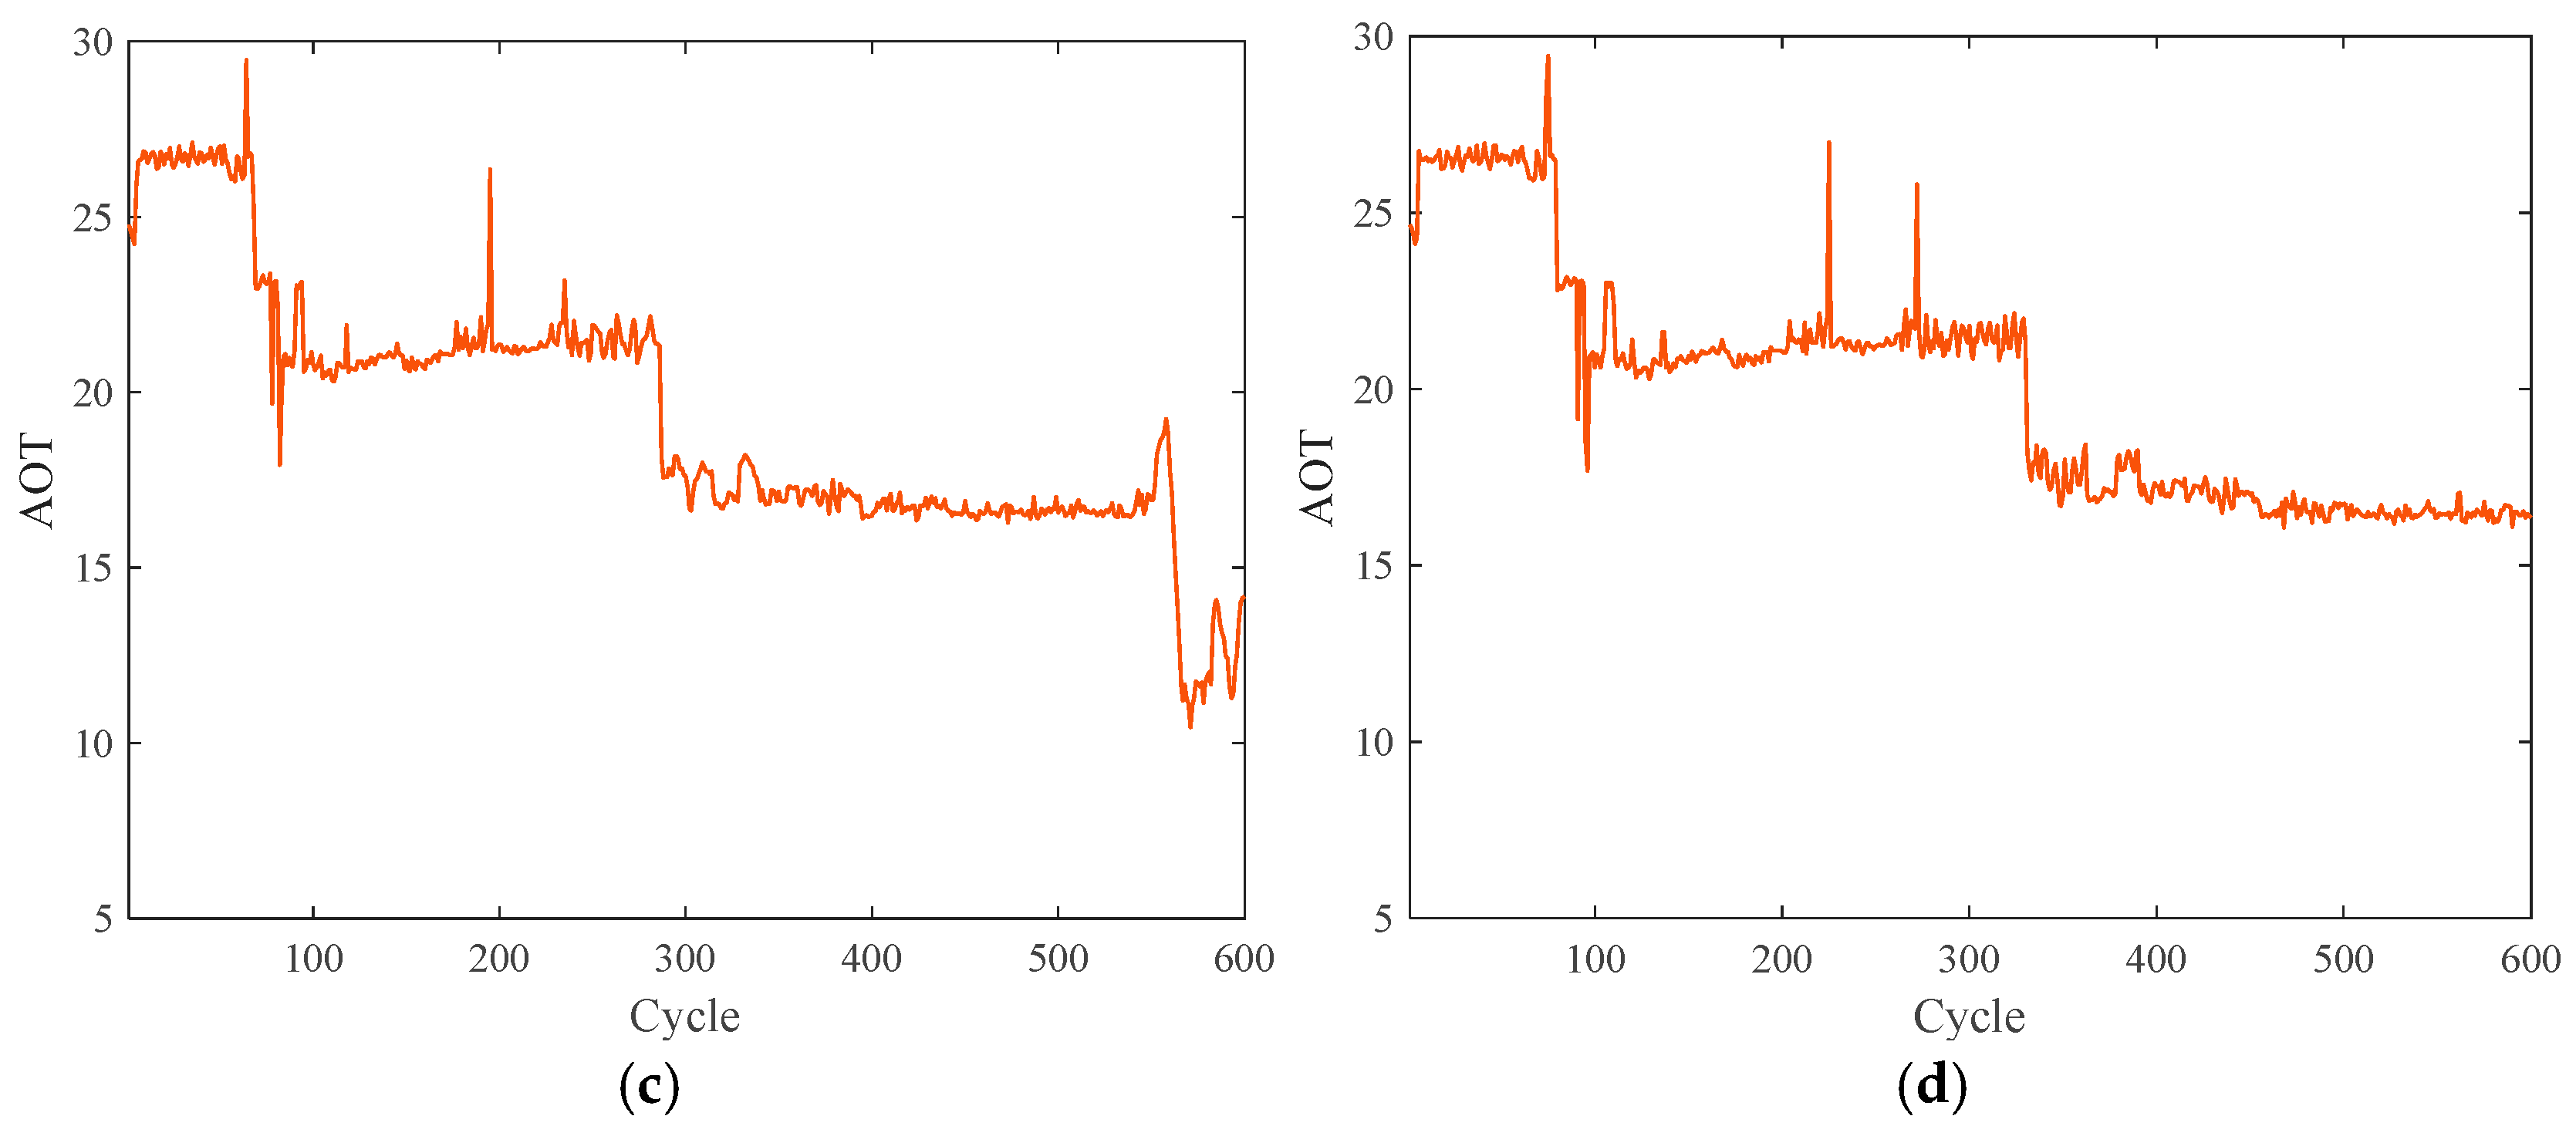
3.2. AOT
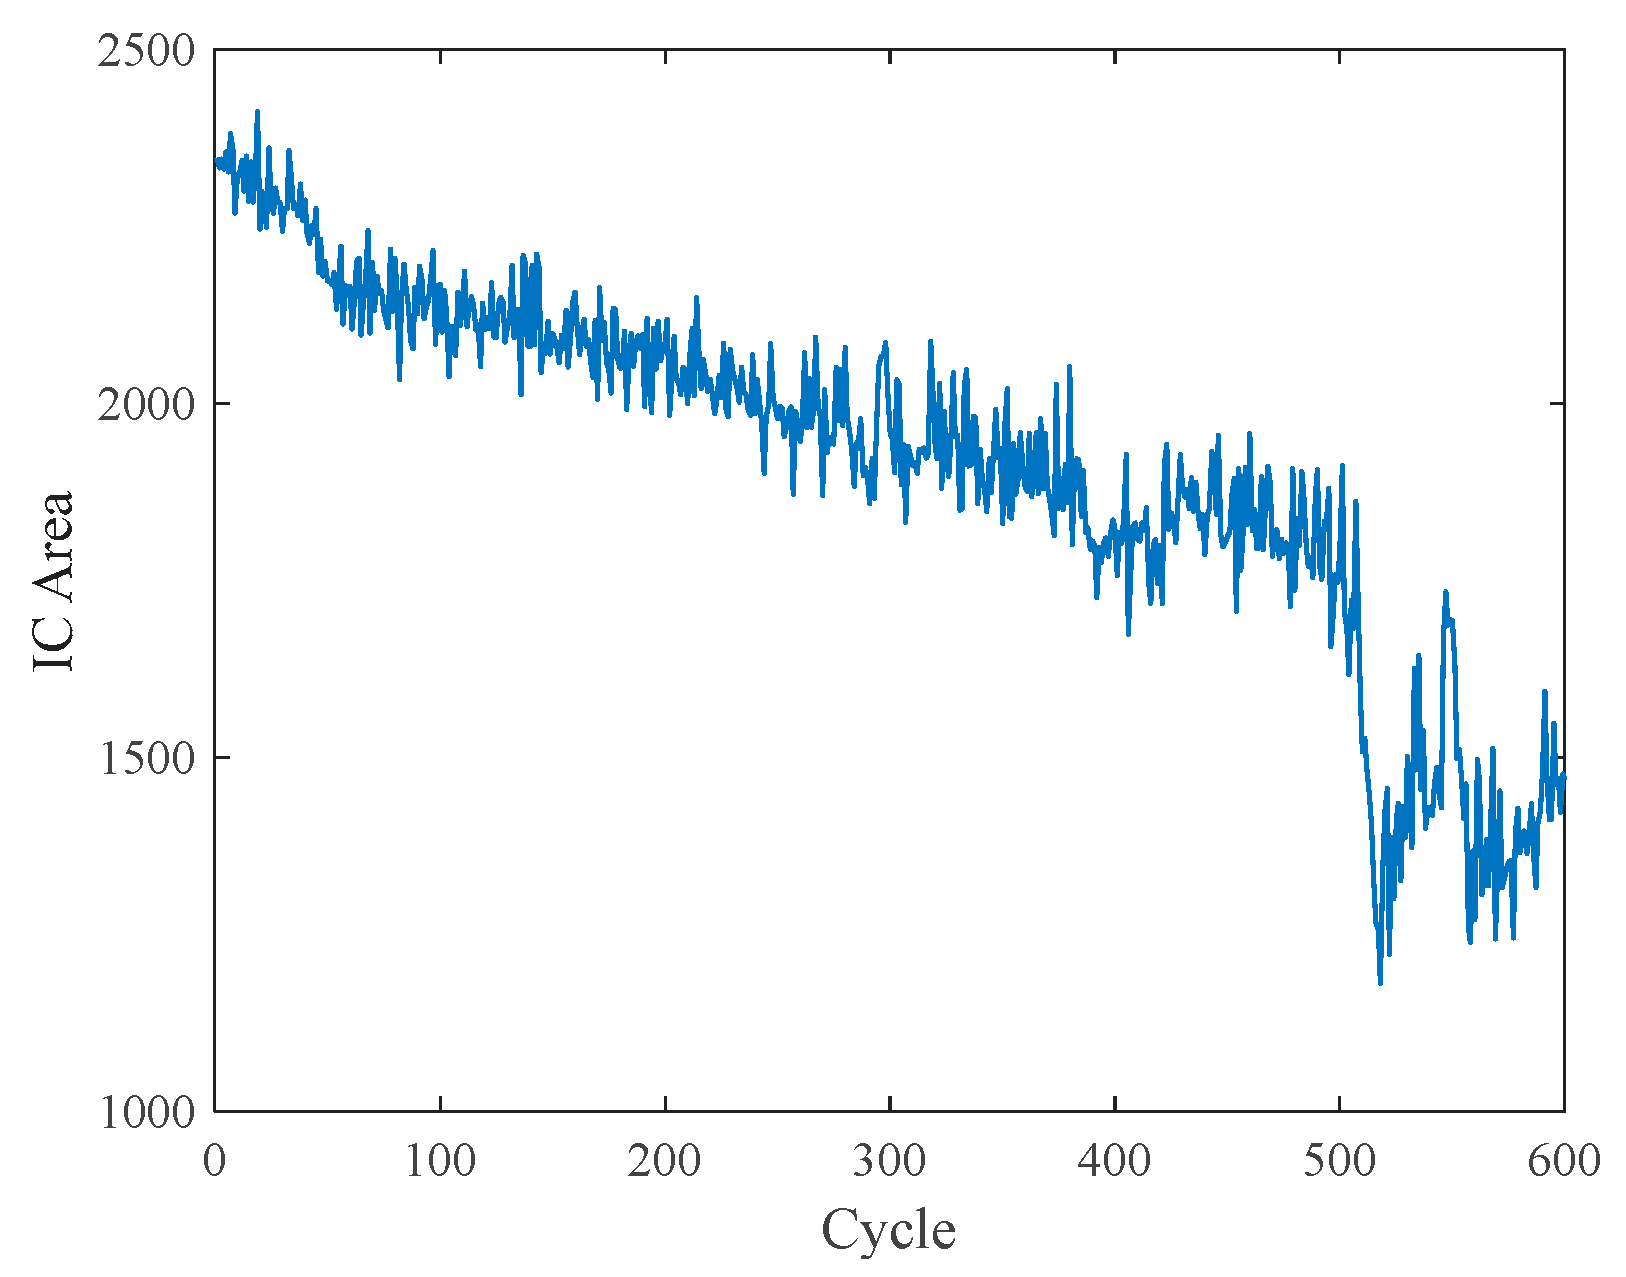
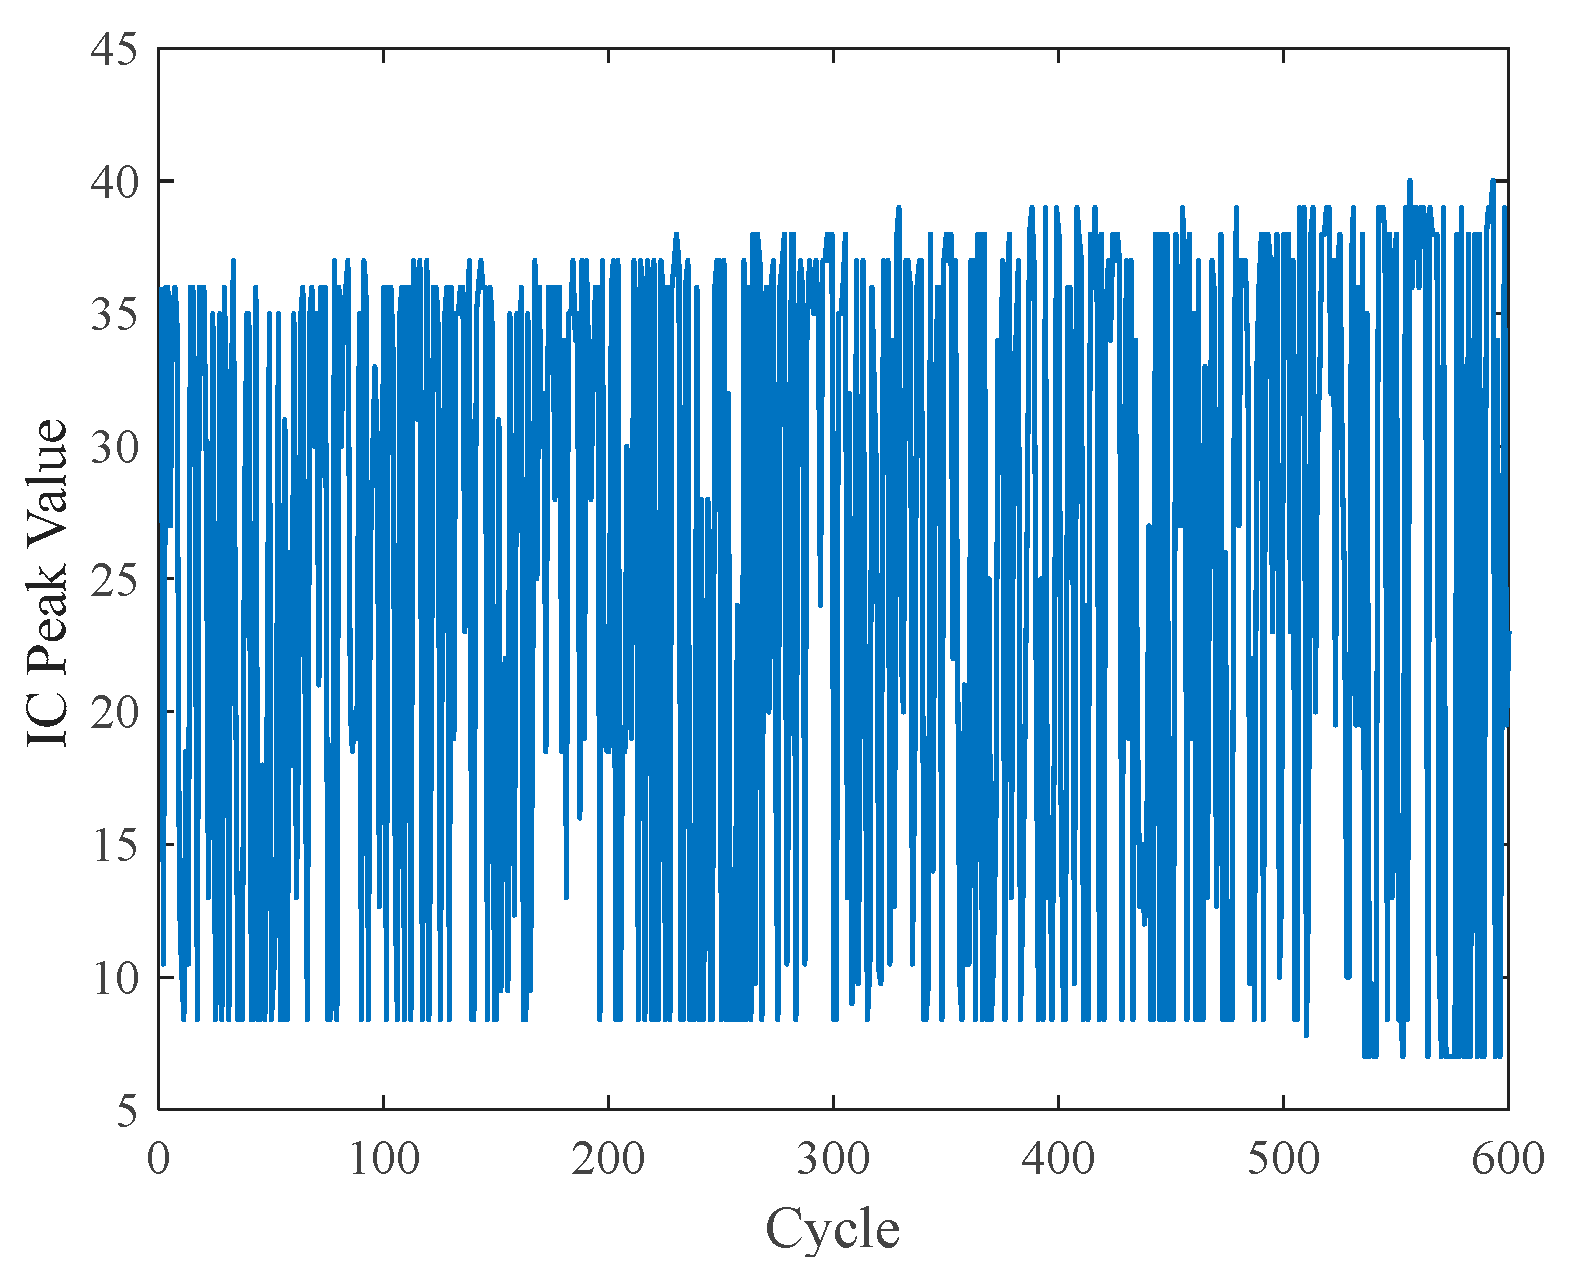
3.3. ICA
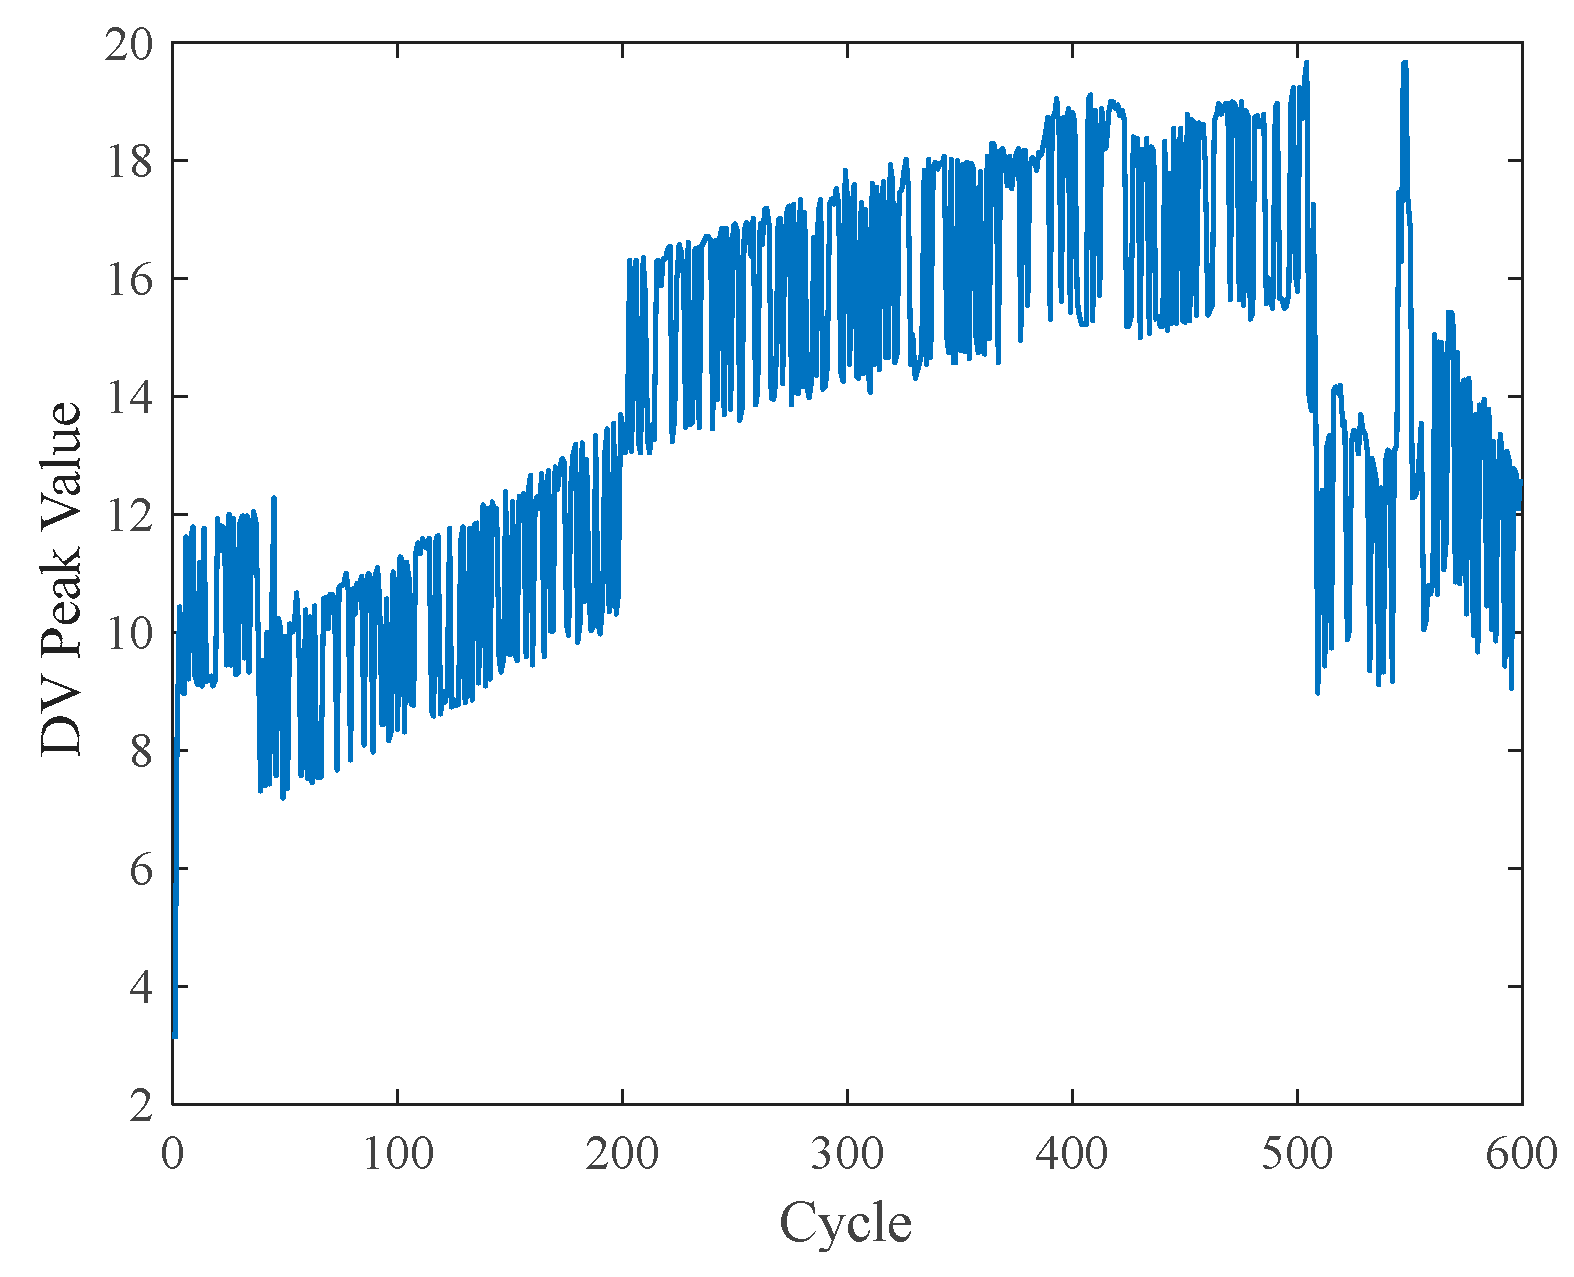
3.4. DVA
3.5. Pearson Correlation Coefficient
4. The CNN-KAN Model
4.1. Convolutional Neural Network
4.2. KAN Model
- (1)
- Adaptive grid construction: its core Equation (11) is shown as follows:
- (2)
- B-spline basis function calculation: its core Equation (12) is shown as follows:
- (3)
- Spline coefficient fitting: the core Equation (13) is shown as follows:
4.3. CNN-KAN Model
5. Experimental Procedure, Results, and Analysis
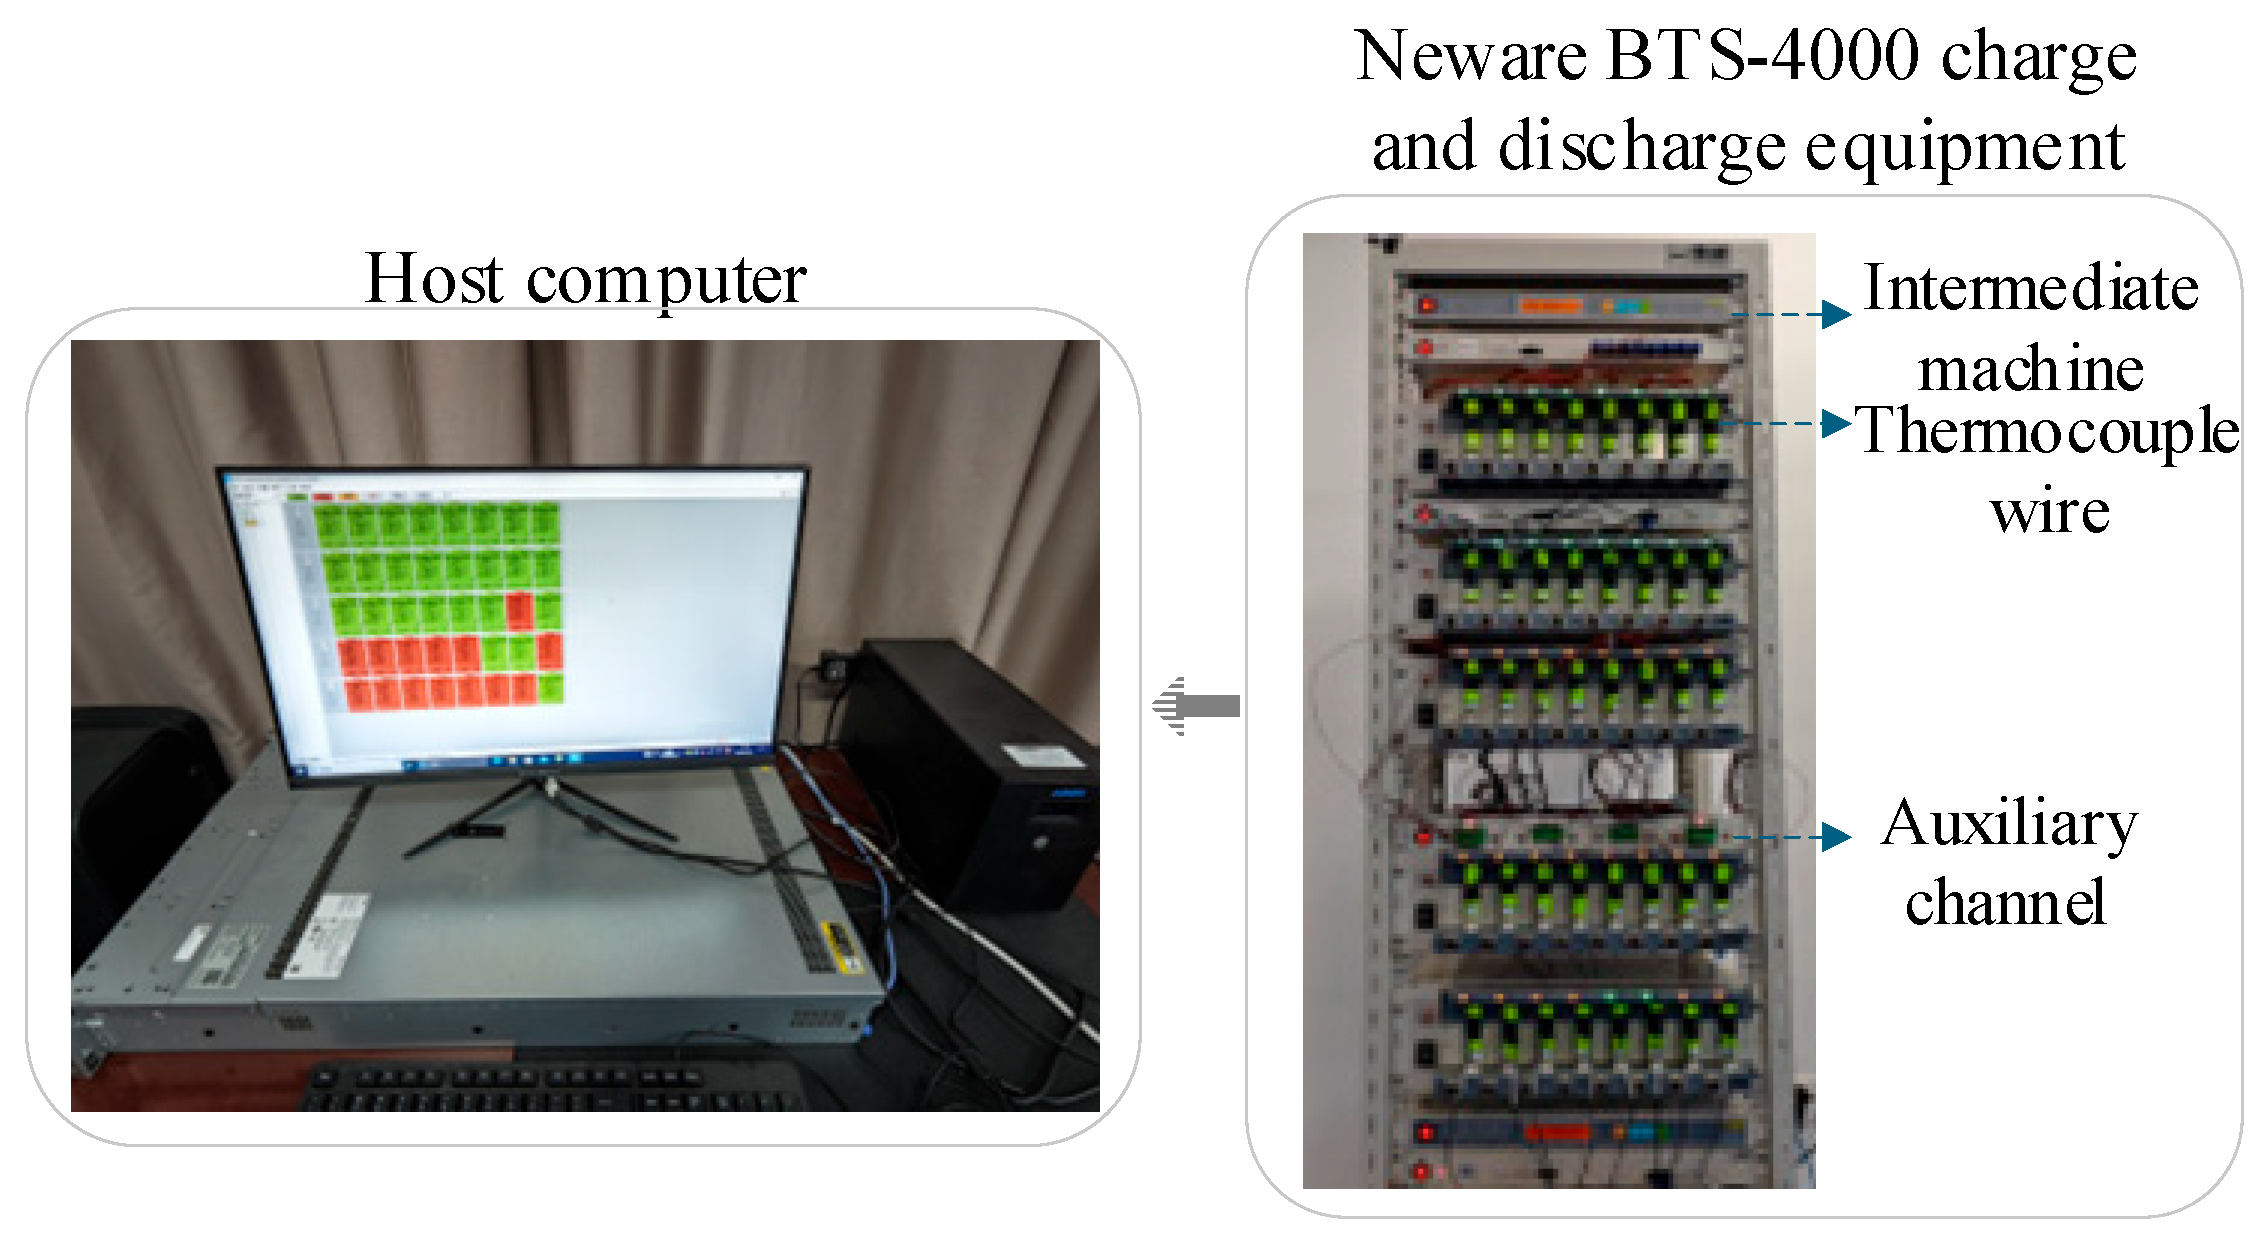
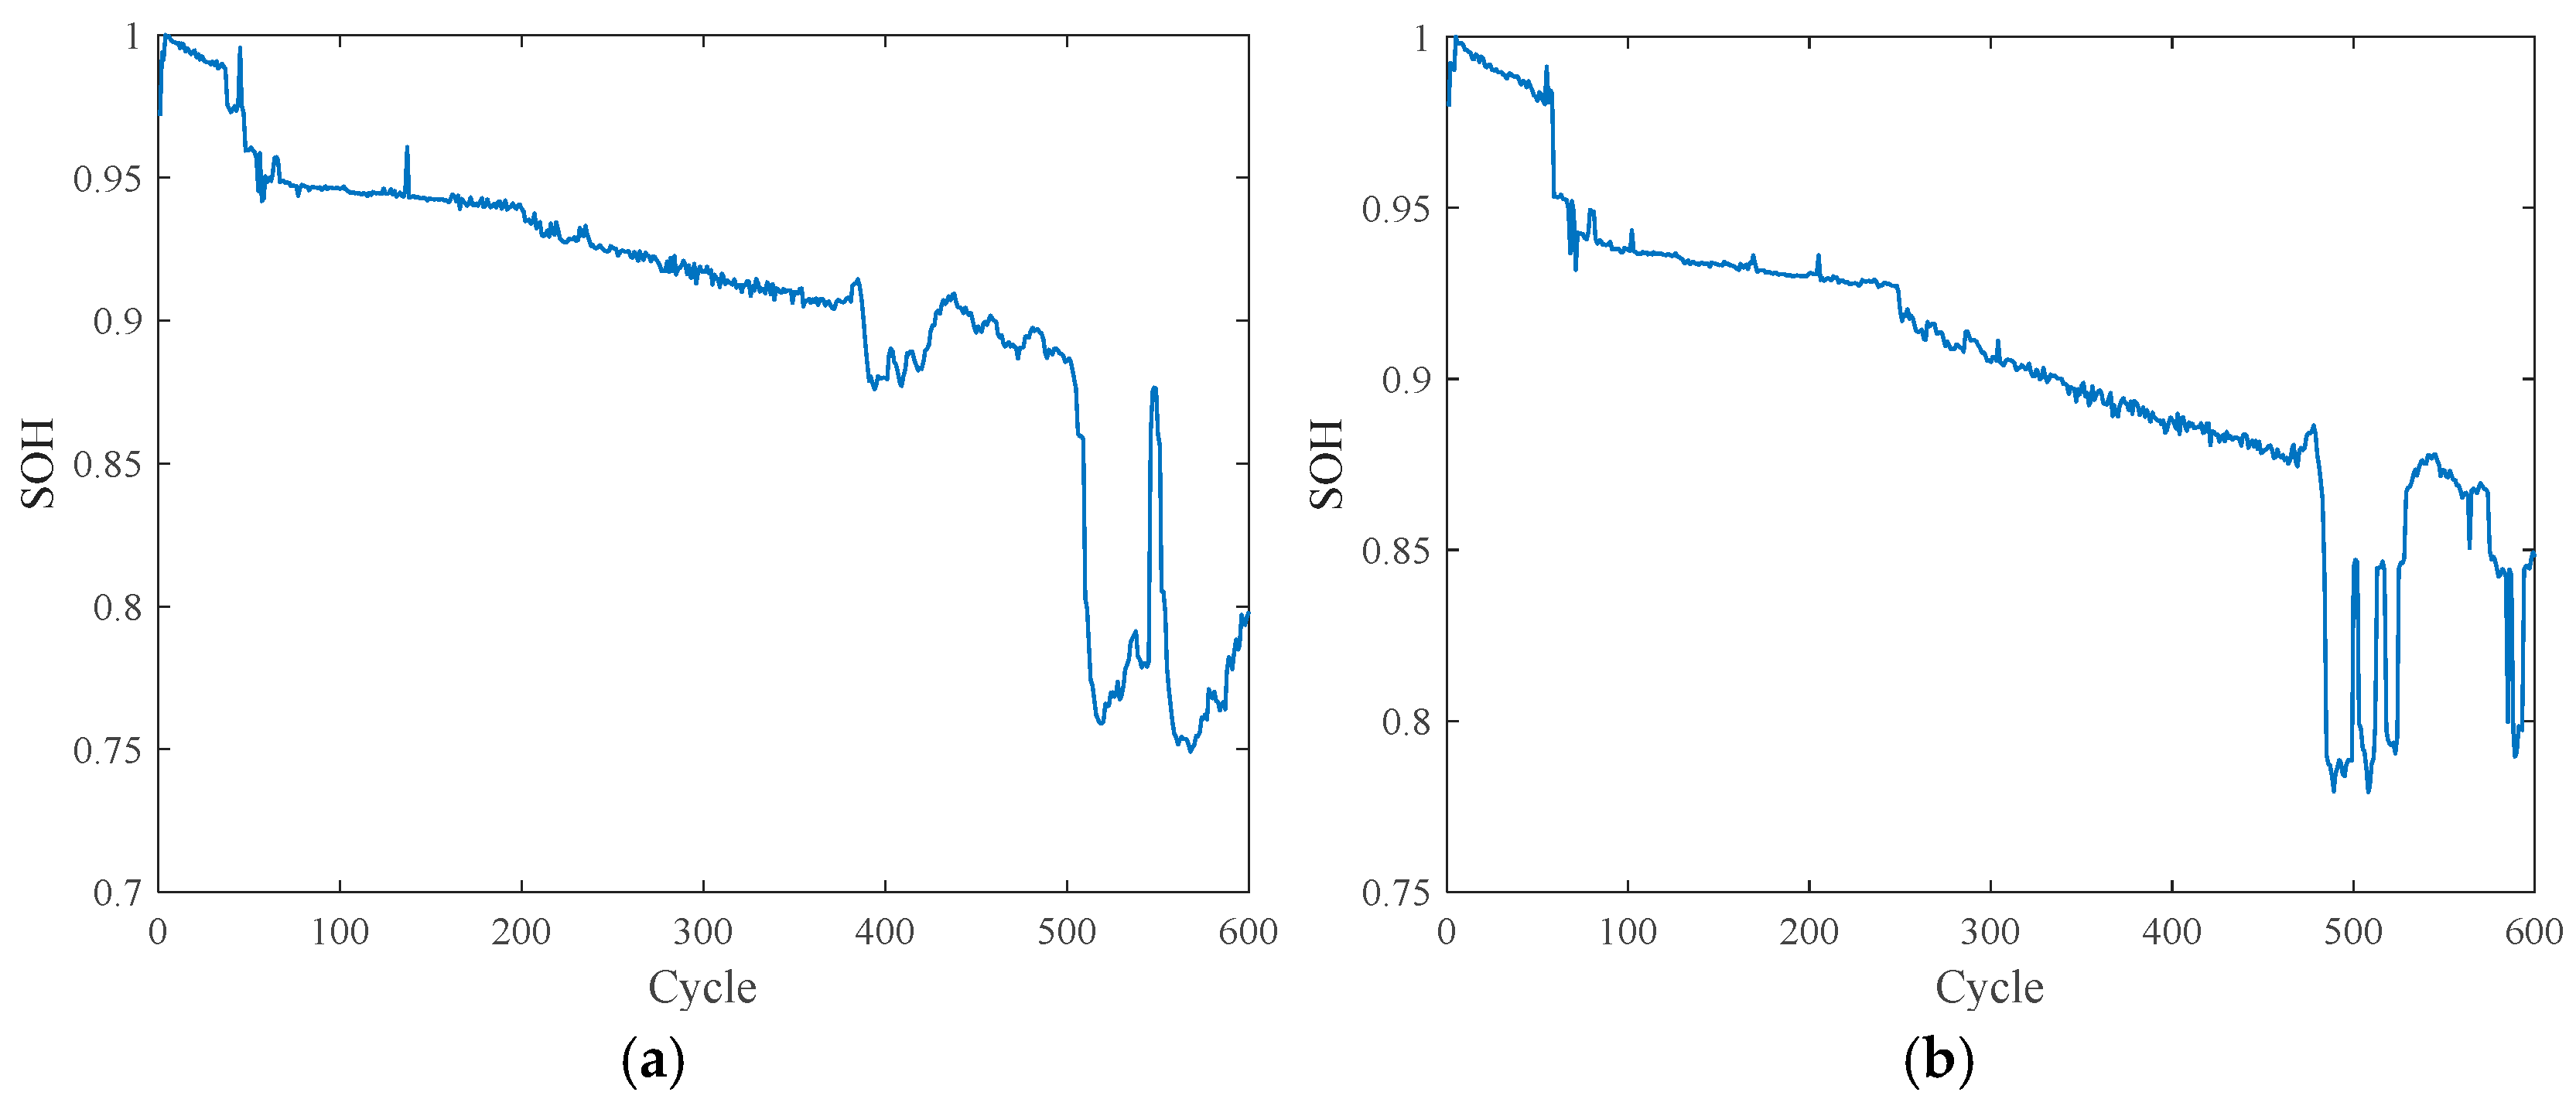
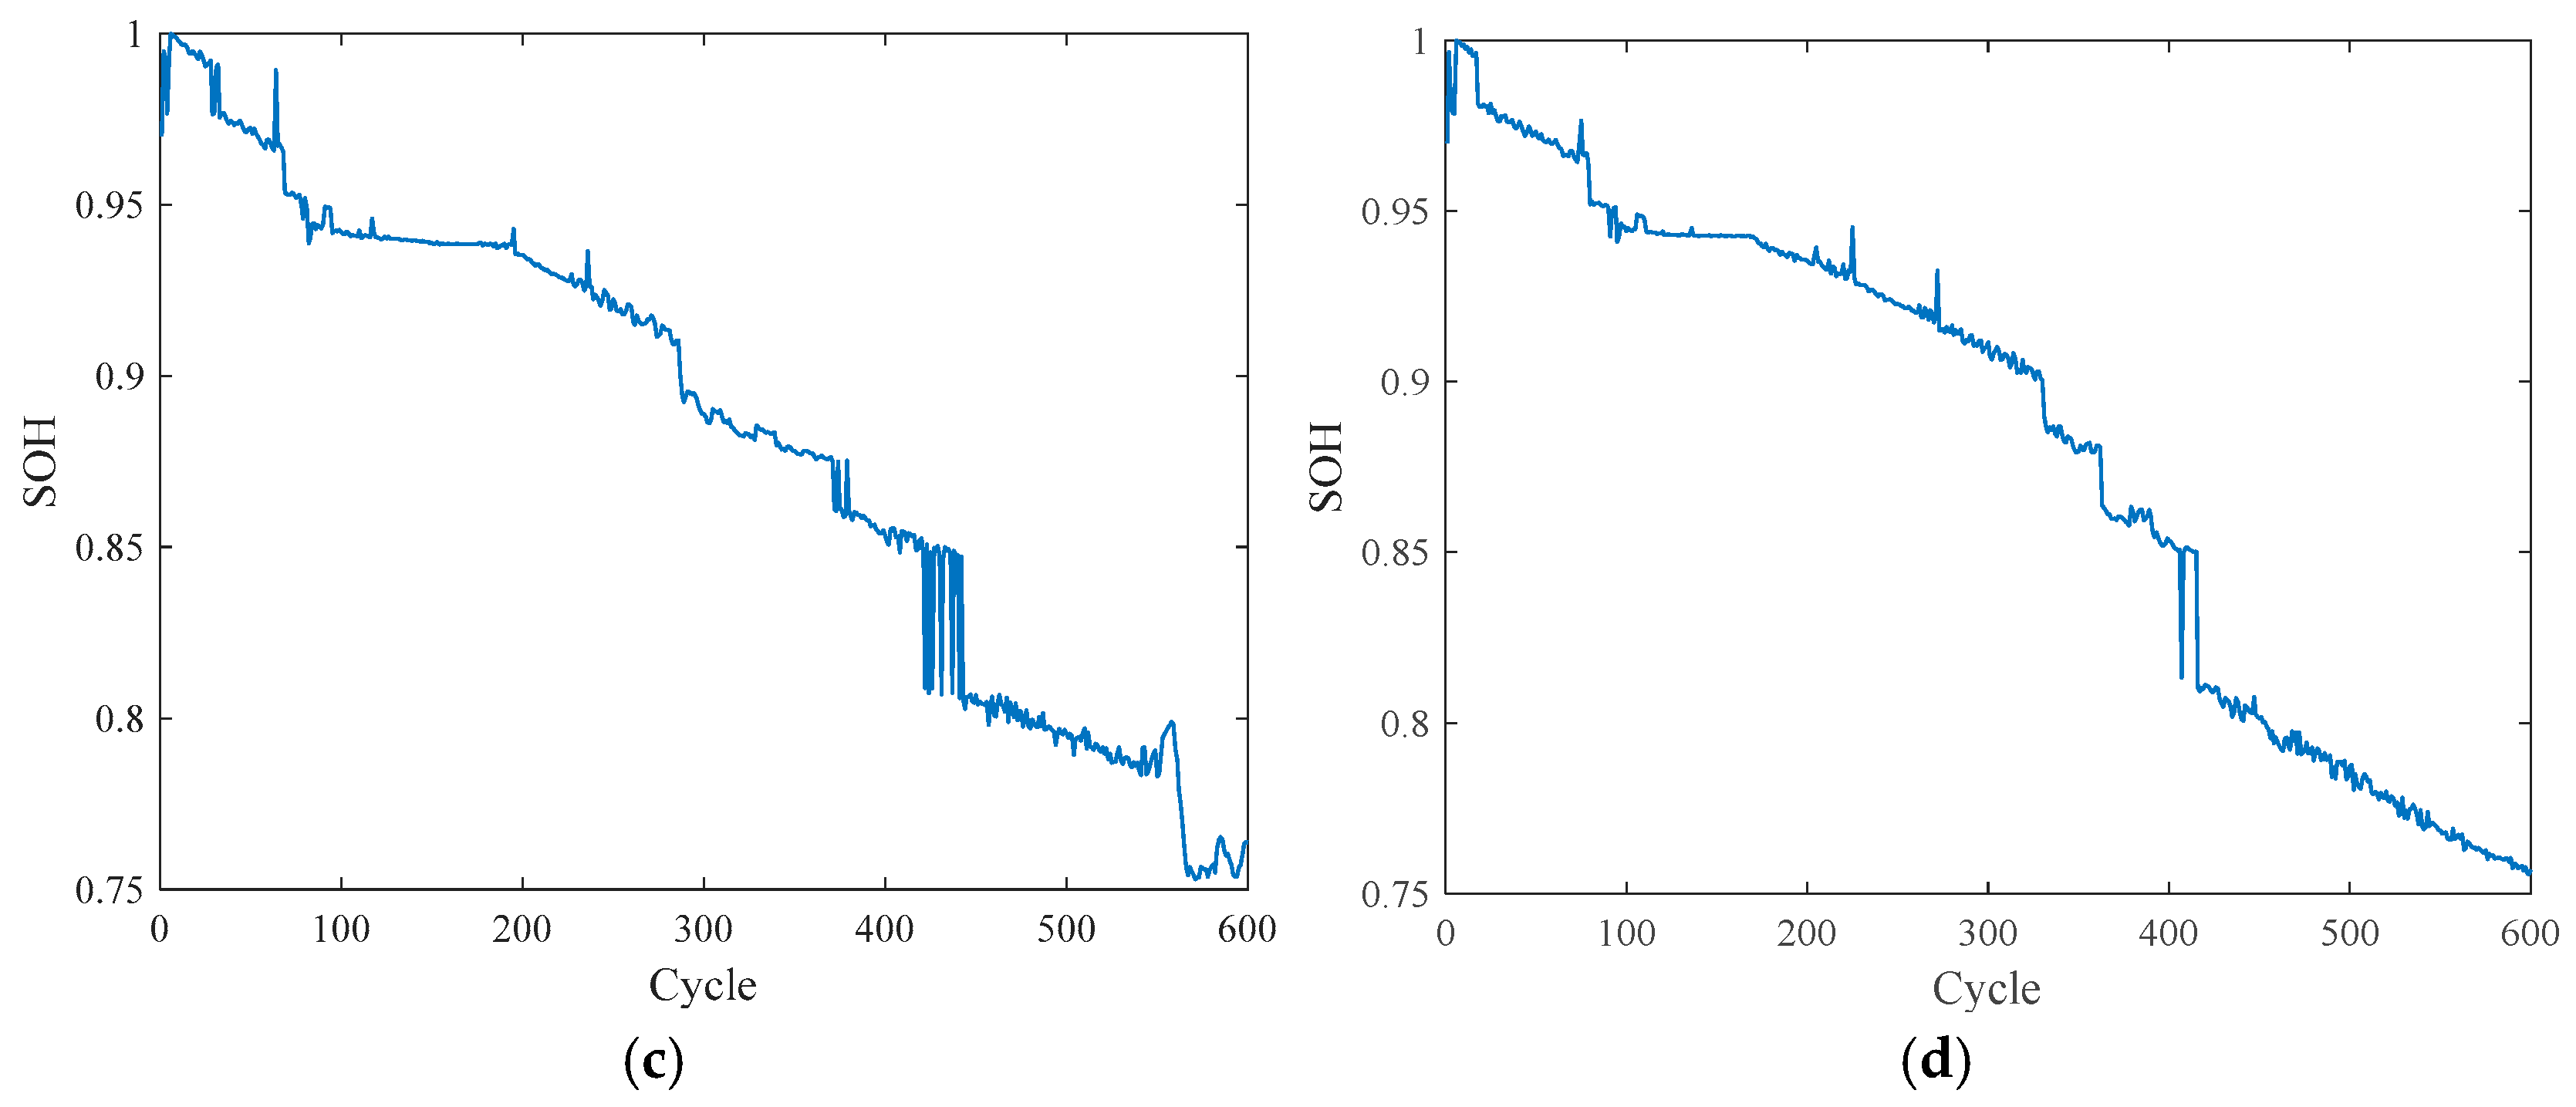
5.1. Experimental Data
5.2. Experimental Procedure
- Step 1
- Measurement of power, capacity, and temperature during the constant current-constant voltage charging phase.
- Step 2
- The CPA area, AOT, and SOH for each charging stage are calculated, resulting in the generation of a processed dataset.
- Step 3
- The processed dataset is divided into a training set and a test set, with each set receiving 50% of the total data.
- Step 4
- Training data and CNN-KAN method were used to establish the SOH estimation model.
- Step 5
- The trained SOH estimation model was employed to evaluate the test data of lithium batteries, thereby validating the model’s performance and estimation accuracy.
5.3. Experimental Results and Analysis
5.3.1. Feature Extraction
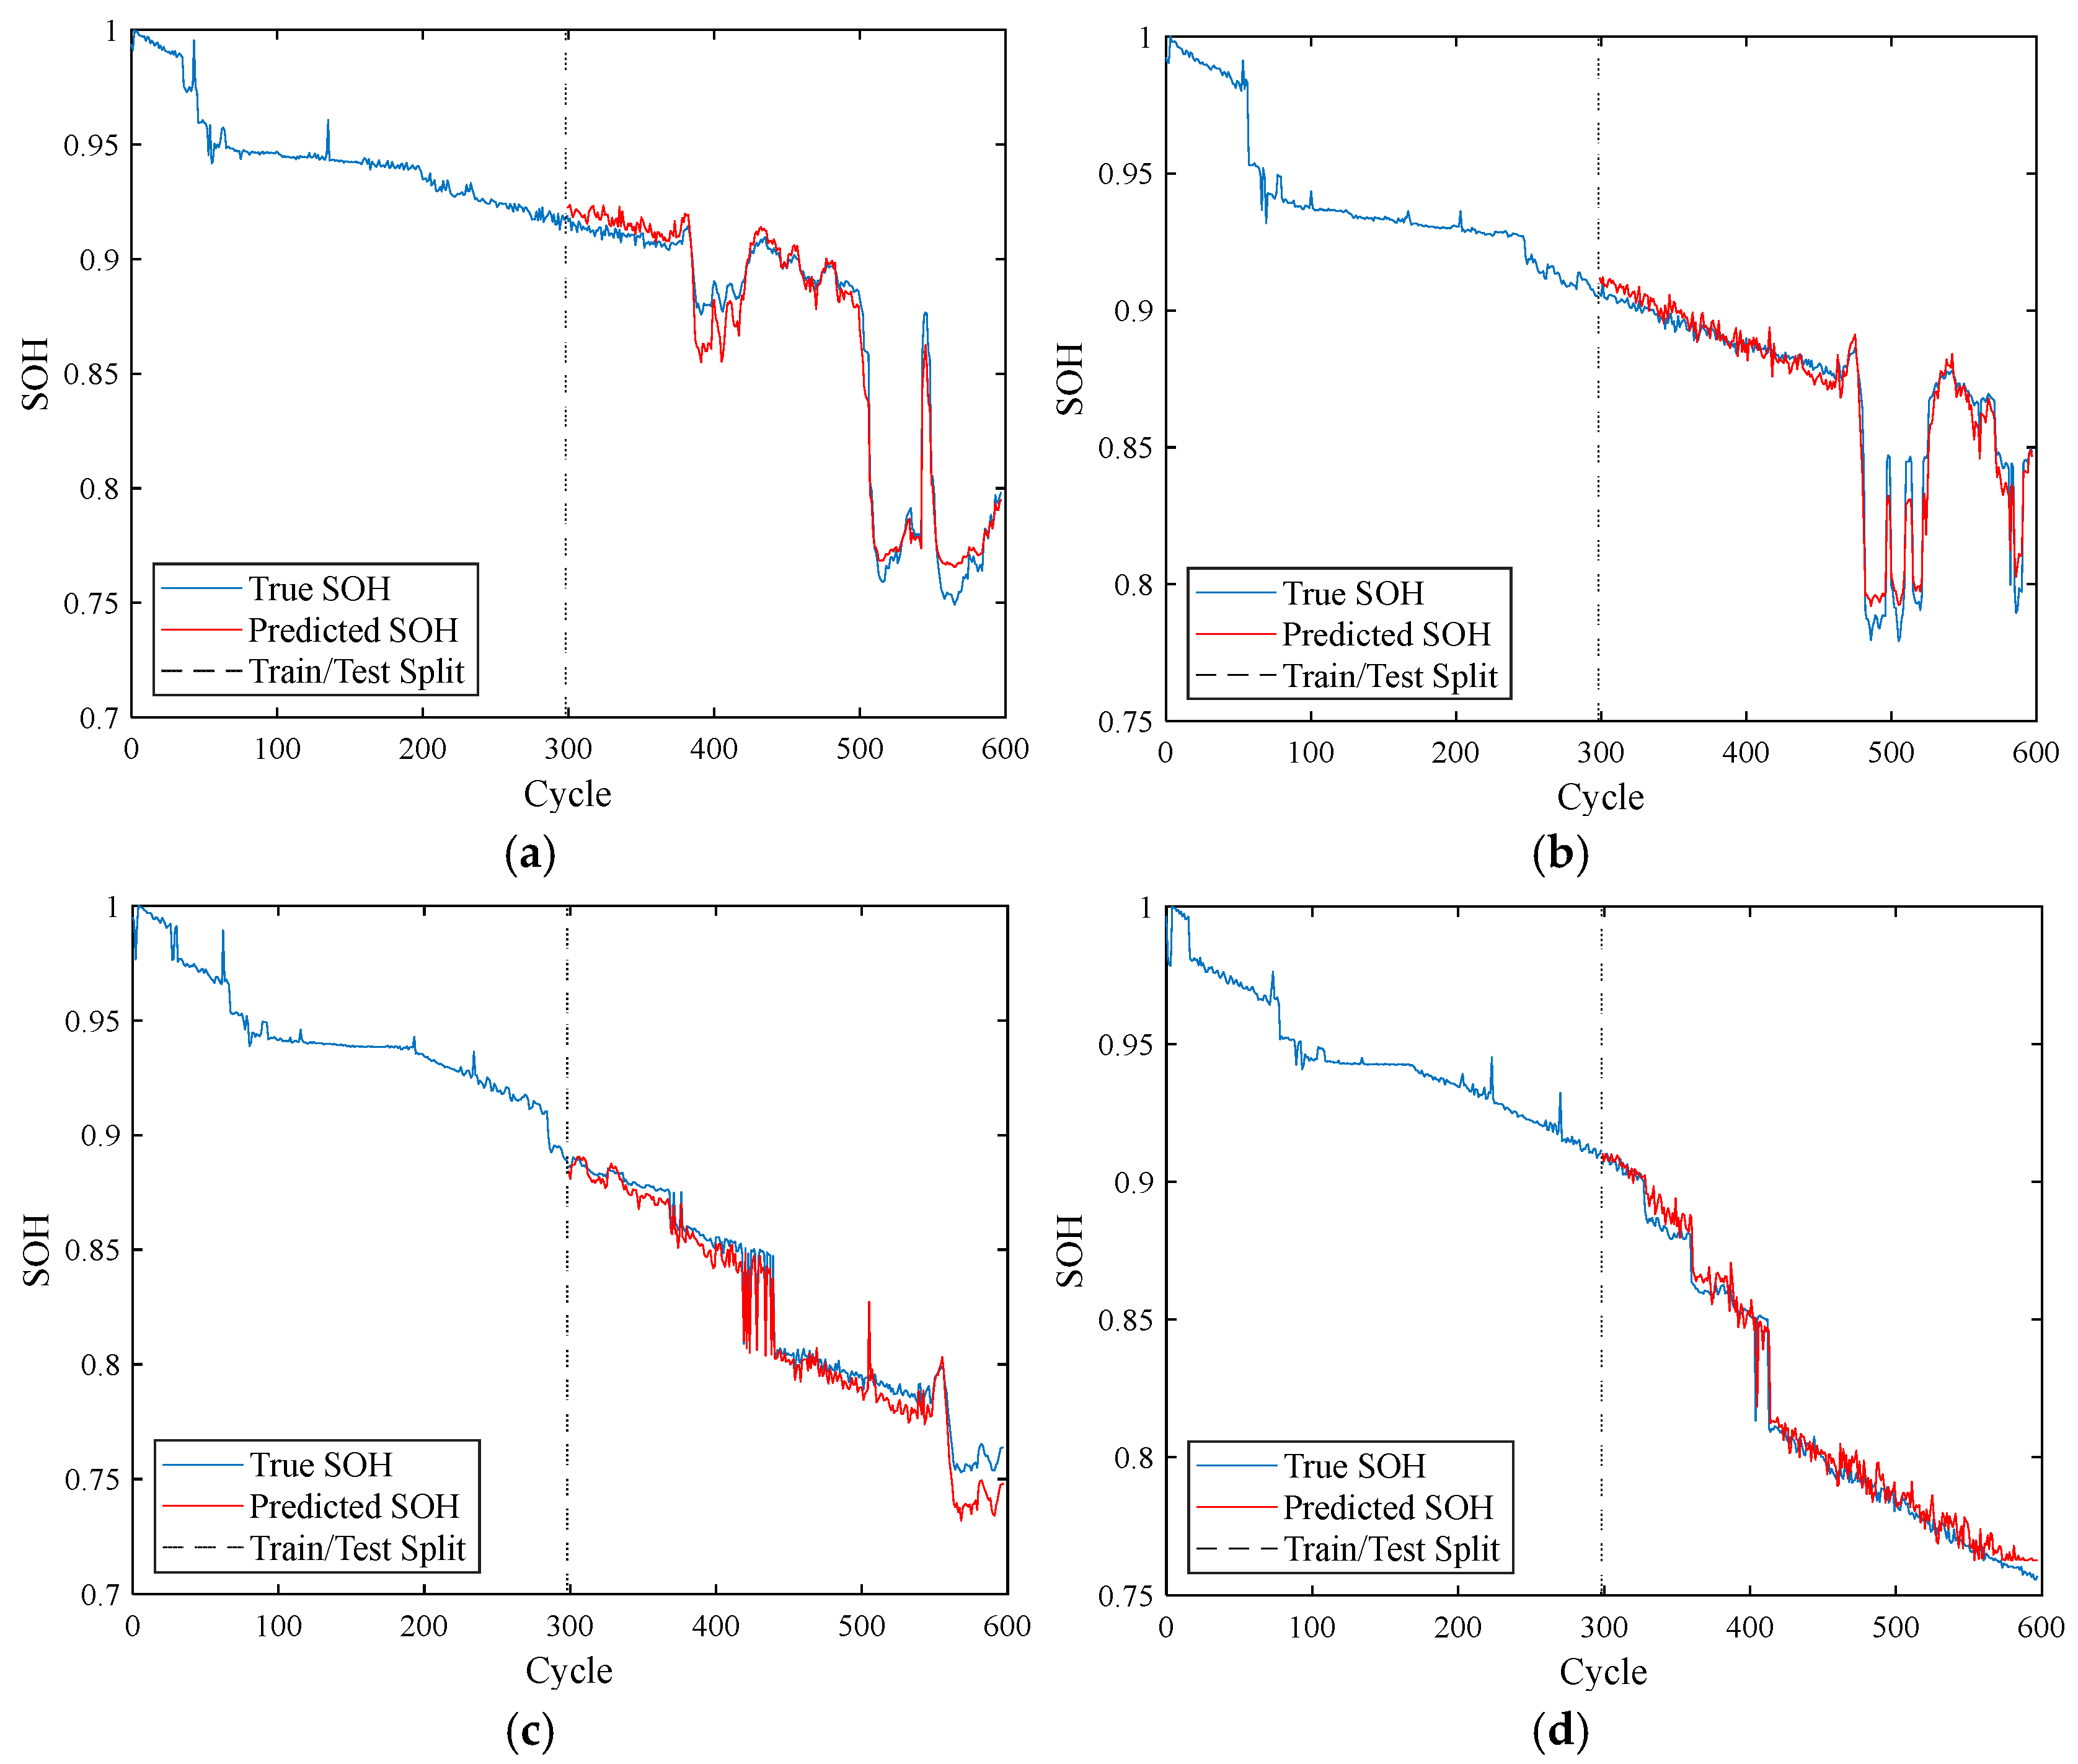
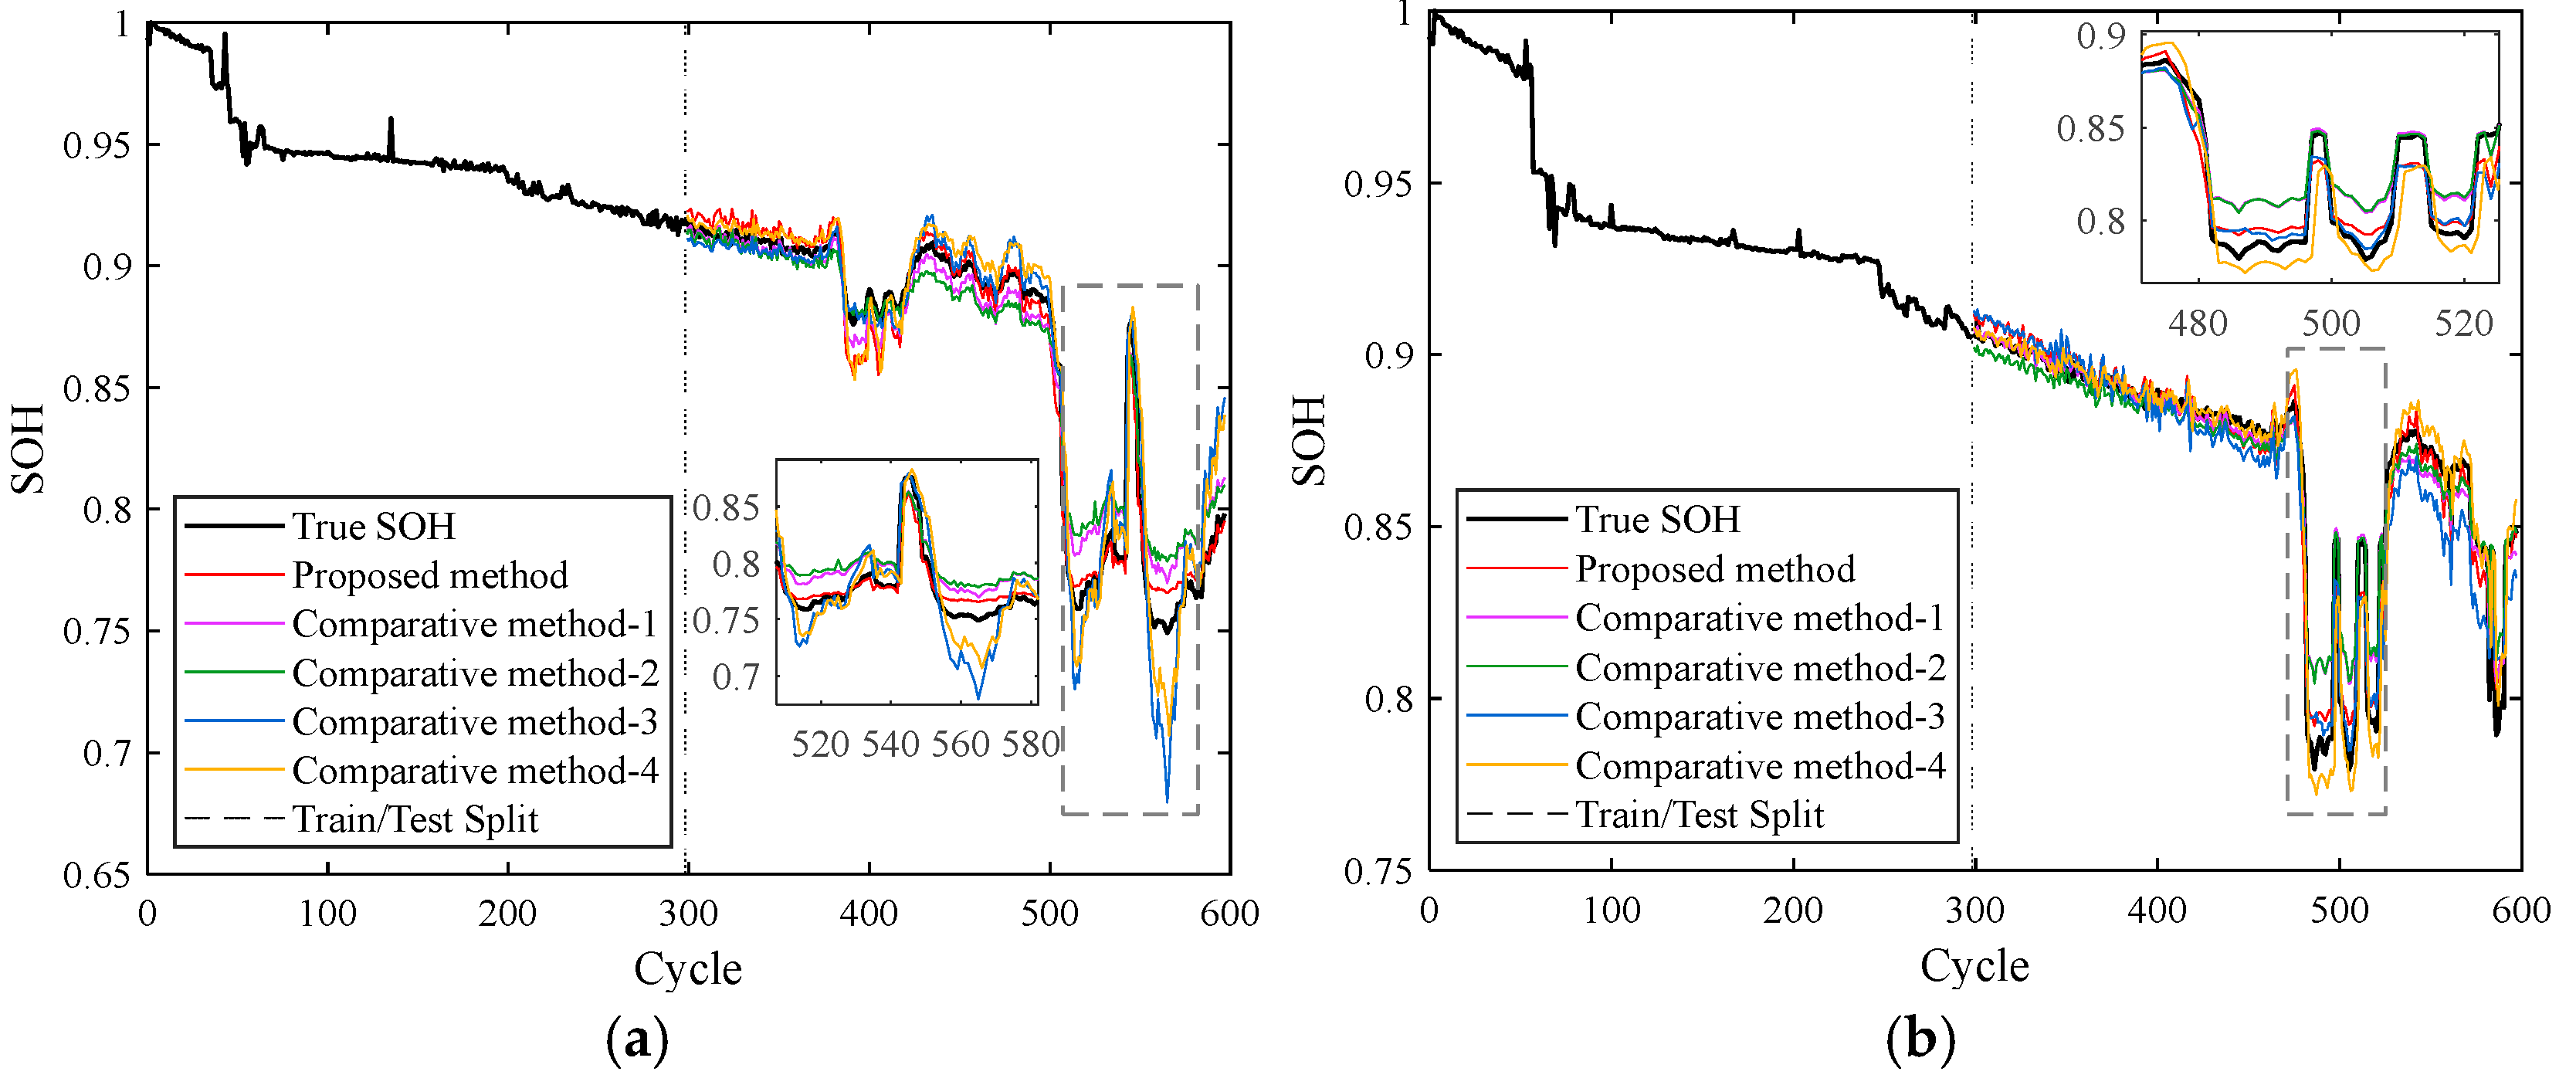
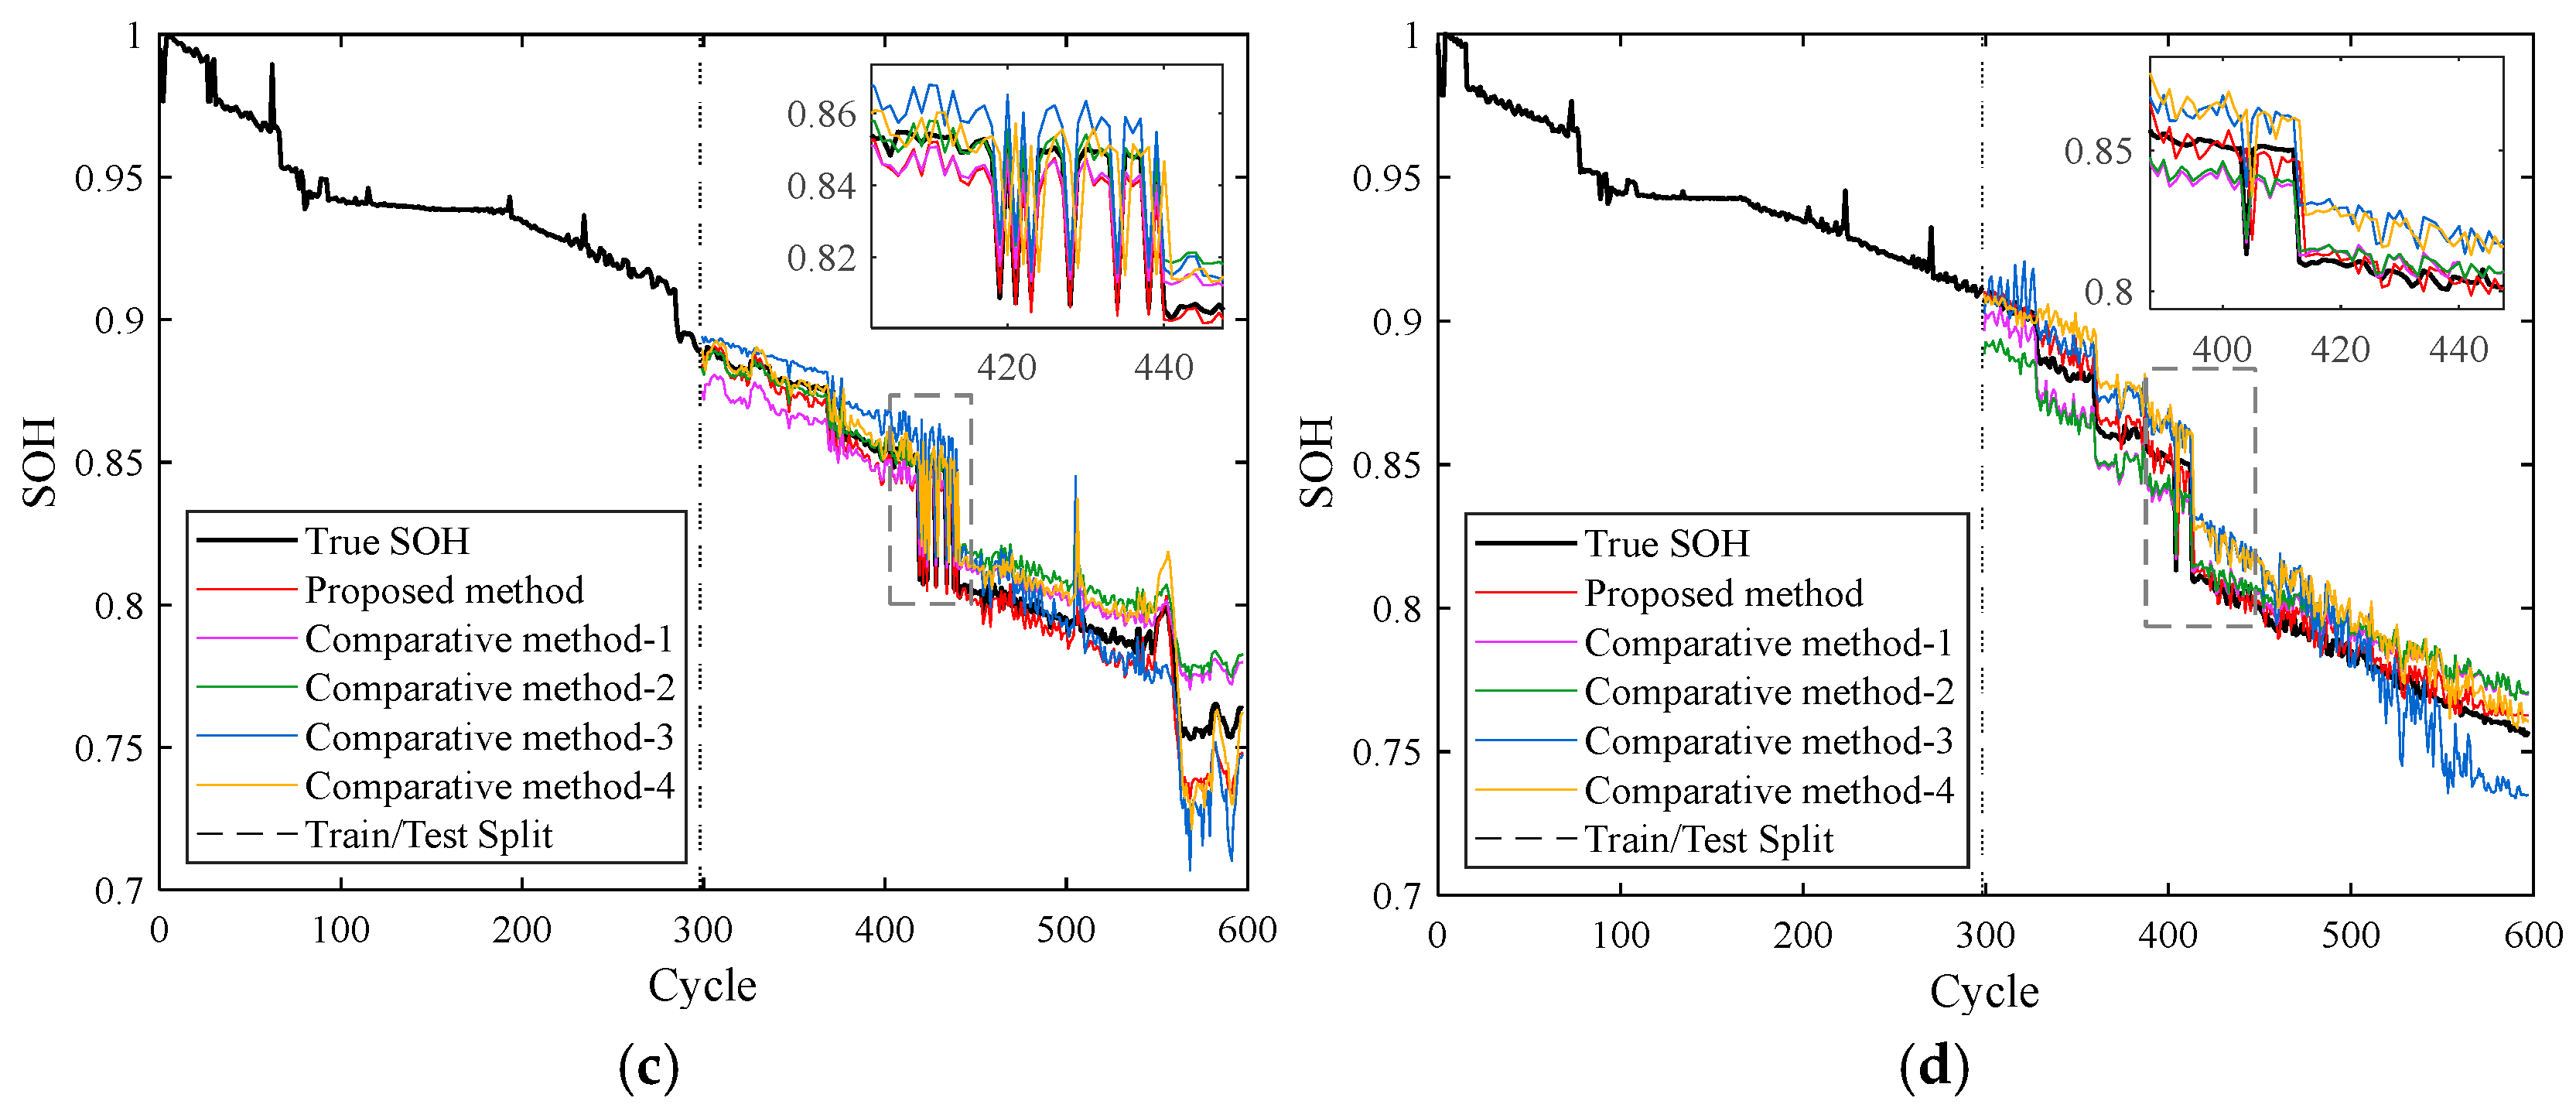
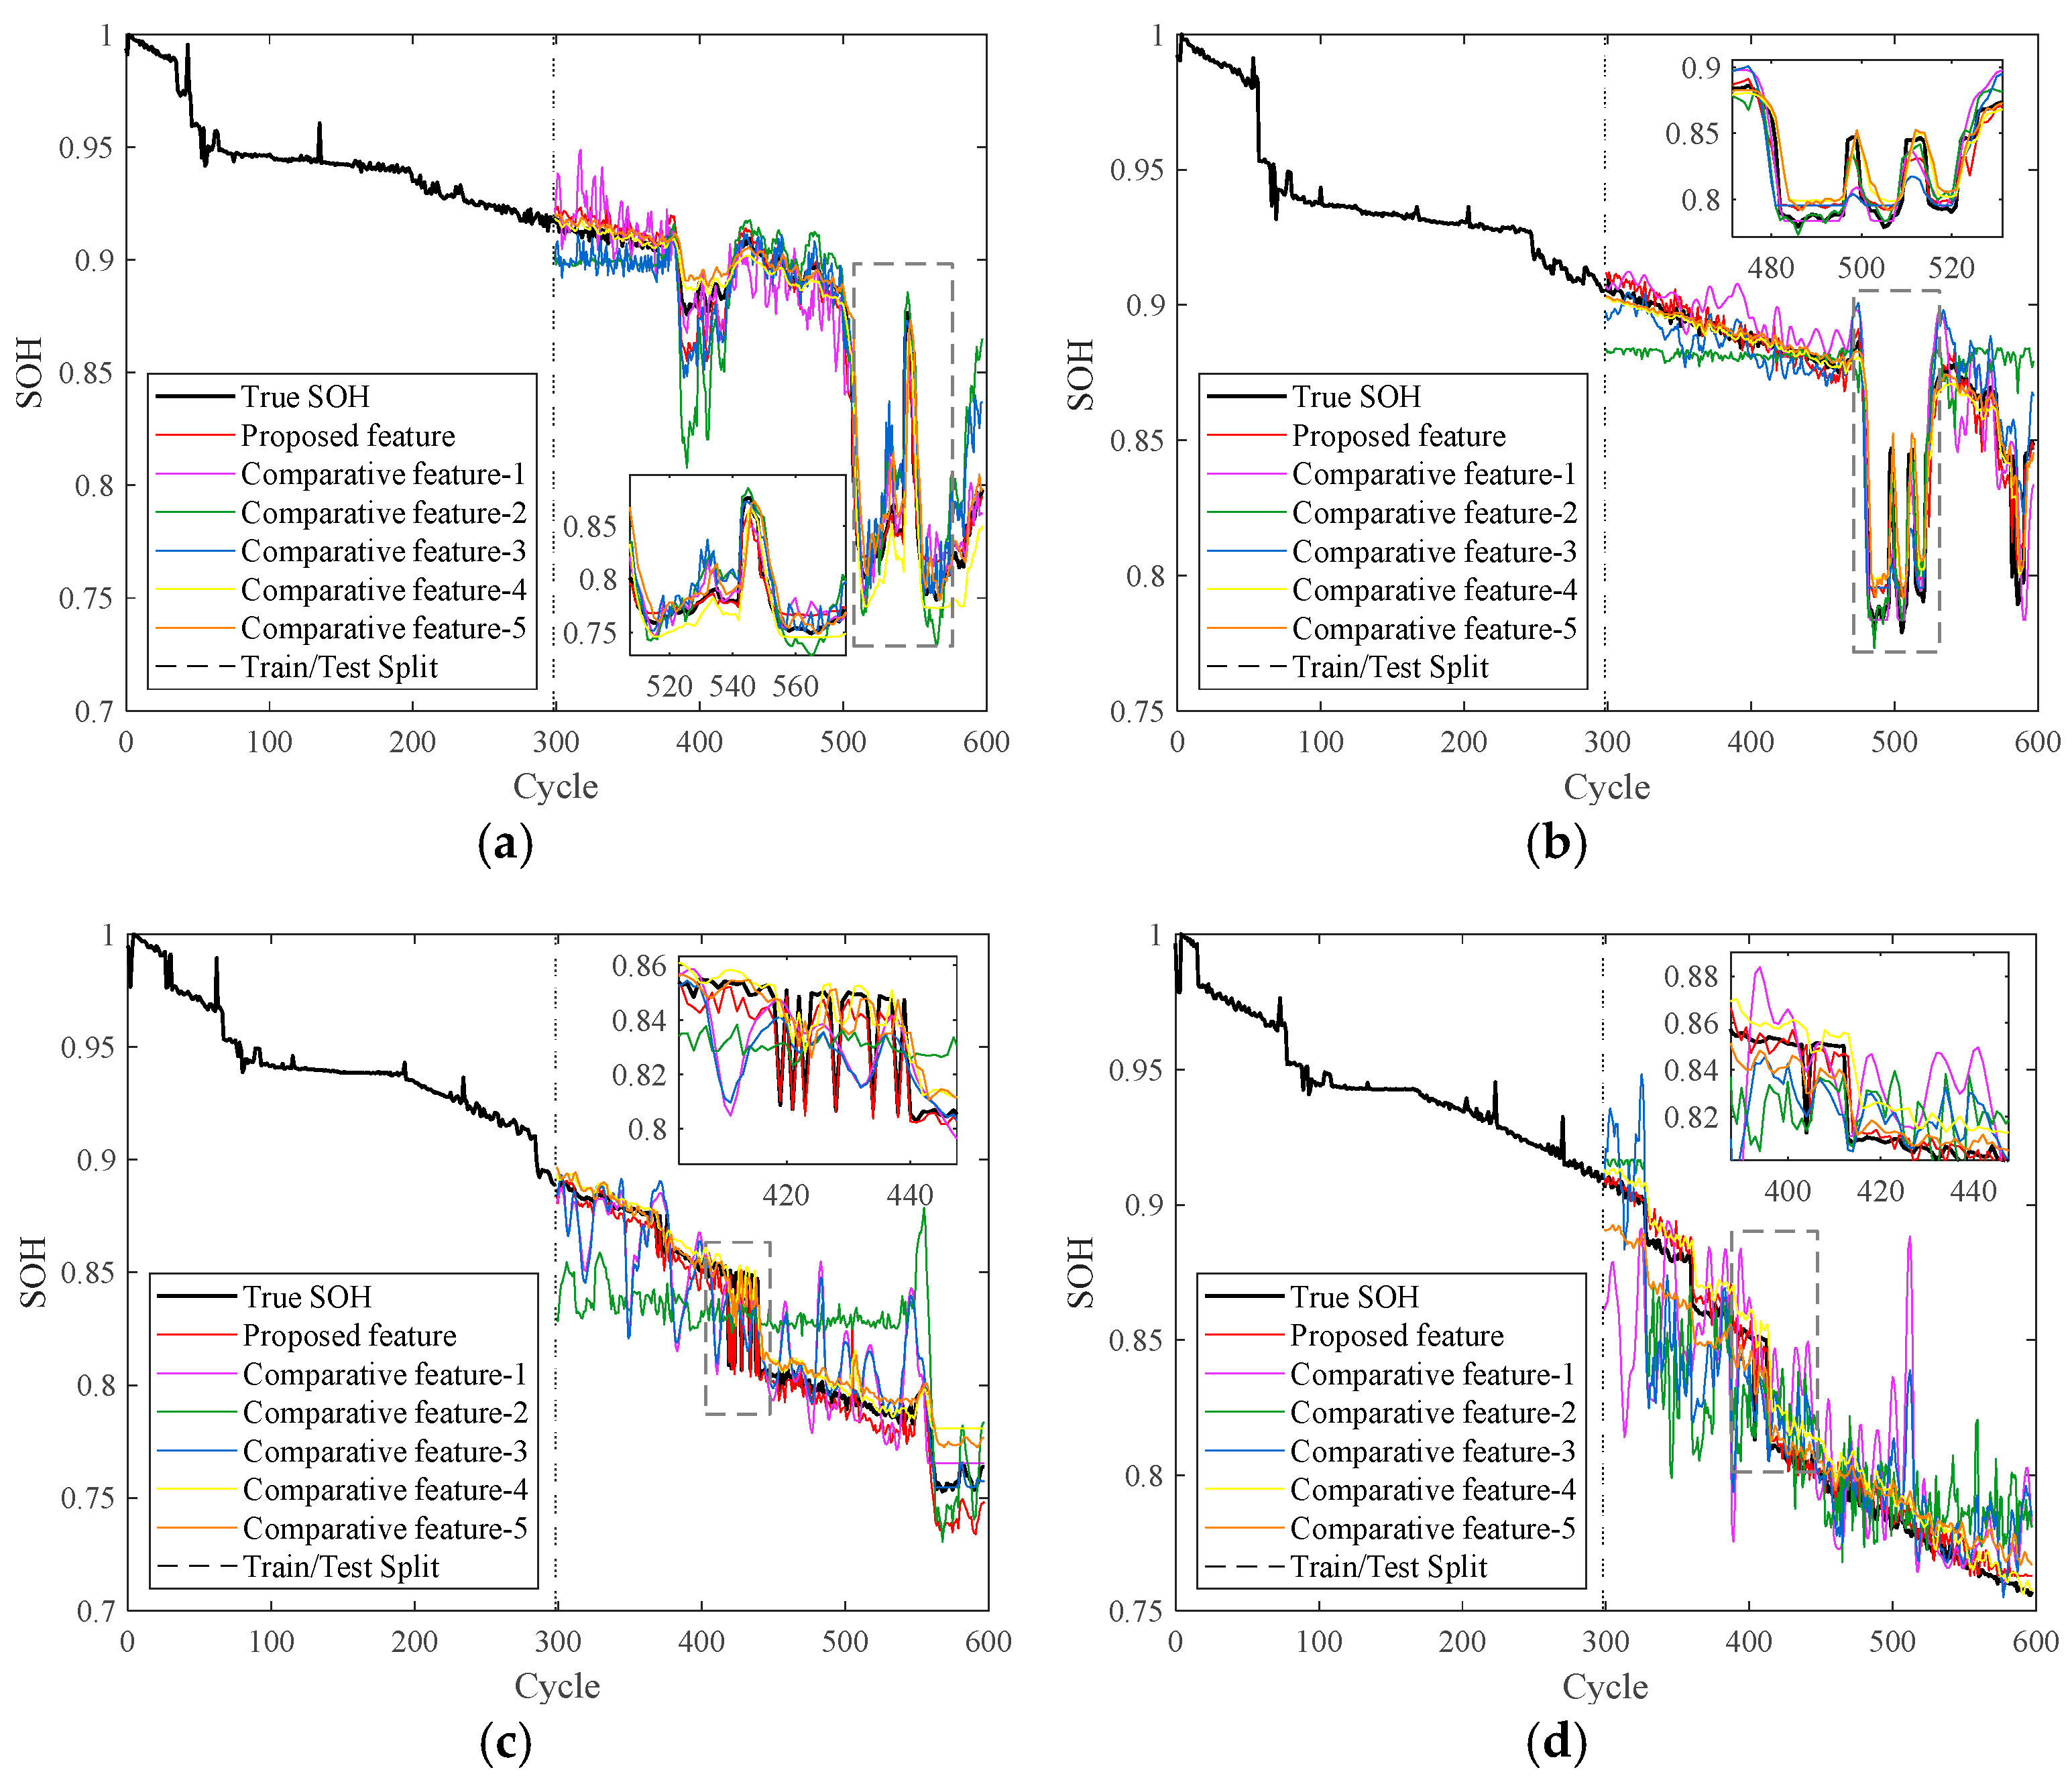
5.3.2. SOH Estimation Results, Comparative Experiments and Analysis
6. Conclusions
Author Contributions
Funding
Data Availability Statement
Conflicts of Interest
References
- Zhang, C.; Wang, J.; Zhang, L.; Zhang, W.; Zhu, T.; Yang, X.-G.; Cruden, A. Decoding battery aging in fast-charging electric vehicles: An advanced SOH estimation framework using real-world field data. Energy Storage Mater. 2025, 78, 104236. [Google Scholar] [CrossRef]
- Xiong, R.; Wang, P.; Jia, Y.; Shen, W.; Sun, F. Multi-factor aging in Lithium Iron phosphate batteries: Mechanisms and insights. Appl. Energy 2025, 382, 125250. [Google Scholar] [CrossRef]
- Deng, Z.; Xu, L.; Liu, H.; Hu, X.; Duan, Z.; Xu, Y. Prognostics of battery capacity based on charging data and data-driven methods for on-road vehicles. Appl. Energy 2023, 339, 120954. [Google Scholar] [CrossRef]
- Meng, J.; Yang, F.; Peng, J.; Gao, F. A proximal policy optimization based control framework for flexible battery energy storage system. IEEE Trans. Energy Convers. 2024, 39, 1183–1191. [Google Scholar] [CrossRef]
- Liu, Y.; Jiang, W.; Zhang, C.; Jia, P.; Zhang, Z.; Zheng, Y.; Yan, K.; Wang, J.; Qian, Y.; Guo, J.; et al. Realizing Environmentally Scalable Pre-Lithiation via Protective Coating of LiSi Alloys to Promote High-Energy-Density Lithium-Ion Batteries. Inorganics 2025, 13, 115. [Google Scholar] [CrossRef]
- Zhu, J.; Xu, W.; Knapp, M.; Darma, M.S.; Mereacre, L.; Su, P.; Hua, W.; Liu-Théato, X.; Dai, H.; Wei, X.; et al. A method to prolong lithium-ion battery life during the full life cycle. Cell Rep. Phys. Sci. 2023, 4, 101464. [Google Scholar]
- Lai, X.; Chen, J.; Chen, Q.; Han, X.; Lu, L.; Dai, H.; Zheng, Y. Comprehensive assessment of carbon emissions and environmental impacts of sodium-ion batteries and lithium-ion batteries at the manufacturing stage. J. Clean. Prod. 2023, 423, 138674. [Google Scholar] [CrossRef]
- Wang, J.; Zhang, C.; Zhang, L.; Su, X.; Zhang, W.; Li, X.; Du, J. A novel aging characteristics-based feature engineering for battery state of health estimation. Energy 2023, 273, 127169. [Google Scholar] [CrossRef]
- Zhang, C.; Zhao, S.; Yang, Z.; He, Y. A multi-fault diagnosis method for lithium-ion battery pack using curvilinear Manhattan distance evaluation and voltage difference analysis. J. Energy Storage 2023, 67, 107575. [Google Scholar] [CrossRef]
- Qian, G.; Zheng, Y.; Li, X.; Sun, Y.; Han, X.; Ouyang, M. State of health estimation for lithium-ion batteries using impedance-based simplified timescale information. Appl. Energy 2025, 382, 125272. [Google Scholar] [CrossRef]
- Xiong, X.; Wang, Y.; Li, K.; Chen, Z. State of health estimation for lithium-ion batteries using Gaussian process regression-based data reconstruction method during random charging process. J. Energy Storage 2023, 72, 108390. [Google Scholar] [CrossRef]
- Che, Y.; Zheng, Y.; Onori, S.; Hu, X.; Teodorescu, R. Increasing generalization capability of battery health estimation using continual learning. Cell Rep. Phys. Sci. 2023, 4, 101743. [Google Scholar] [CrossRef]
- You, H.; Jiang, B.; Zhu, J.; Wang, X.; Shi, G.; Han, G.; Wei, X.; Dai, H. In-situ quantitative detection of irreversible lithium plating within full-lifespan of lithium-ion batteries. J. Power Sources 2023, 564, 232892. [Google Scholar] [CrossRef]
- Vignesh, S.; Che, H.S.; Selvaraj, J.; Tey, K.S.; Lee, J.W.; Shareef, H.; Errouissi, R. State of Health (SoH) estimation methods for second life lithium-ion battery—Review and challenges. Appl. Energy 2024, 369, 123542. [Google Scholar]
- Owejan, J.P.; Gagliardo, J.J.; Harris, S.J.; Wang, H.; Hussey, D.S.; Jacobson, D.L. Direct measurement of lithium transport in graphite electrodes using neutrons. Electrochim. Acta 2012, 66, 94–99. [Google Scholar] [CrossRef]
- Tang, A.; Huang, Y.; Liu, S.; Yu, Q.; Shen, W.; Xiong, R. A novel lithium-ion battery state of charge estimation method based on the fusion of neural network and equivalent circuit models. Appl. Energy 2023, 348, 121578. [Google Scholar] [CrossRef]
- Feng, X.; Zhang, Y. Enhancing interpretability in data-driven battery capacity estimation through degradation mode analysis. J. Power Sources 2025, 642, 236938. [Google Scholar] [CrossRef]
- He, Y.; Deng, Z.; Chen, J.; Li, W.; Zhou, J.; Xiang, F.; Hu, X. State-of-health estimation for fast-charging lithium-ion batteries based on a short charge curve using graph convolutional and long short-term memory networks. J. Energy Chem. 2024, 98, 1–11. [Google Scholar] [CrossRef]
- Deng, Z.; Xu, L.; Liu, H.; Hu, X.; Wang, B.; Zhou, J. Rapid health estimation of in-service battery packs based on limited labels and domain adaptation. J. Energy Chem. 2024, 89, 345–354. [Google Scholar] [CrossRef]
- Zhang, C.; Tu, L.; Yang, Z.; Du, B.; Zhou, Z.; Wu, J.; Chen, L. A CMMOG-based lithium-battery SOH estimation method using multi-task learning framework. J. Energy Storage 2025, 107, 114884. [Google Scholar] [CrossRef]
- Fahmy, H.M.; Hasanien, H.M.; Alsaleh, I.; Ji, H.; Alassaf, A. State of health estimation of lithium-ion battery using dual adaptive unscented Kalman filter and Coulomb counting approach. J. Energy Storage 2024, 88, 111557. [Google Scholar] [CrossRef]
- Lin, M.; Yan, C.; Wang, W.; Dong, G.; Meng, J.; Wu, J. A data-driven approach for estimating state-of-health of lithium-ion batteries considering internal resistance. Energy 2023, 277, 127675. [Google Scholar] [CrossRef]
- Li, Y.; Maleki, M.; Banitaan, S. State of health estimation of lithium-ion batteries using EIS measurement and transfer learning. J. Energy Storage 2023, 73, 109185. [Google Scholar] [CrossRef]
- Tong, Z.; Lv, C.; Bai, G.-D.; Yin, Z.-W.; Zhou, Y.; Li, J.-T. A review on applications and challenges of carbon nanotubes in lithium-ion battery. Carbon Energy 2025, 7, e643. [Google Scholar] [CrossRef]
- Ni, Y.; Song, K.; Pei, L.; Li, X.; Wang, T.; Zhang, H.; Zhu, C.; Xu, J. State-of-health estimation and knee point identification of lithium-ion battery based on data-driven and mechanism model. Appl. Energy 2025, 385, 125539. [Google Scholar] [CrossRef]
- Fang, D.; Wu, W.; Li, J.; Yuan, W.; Liu, T.; Dai, C.; Wang, Z.; Zhao, M. Performance simulation method and state of health estimation for lithium-ion batteries based on aging-effect coupling model. Green Energy Intell. Transp. 2023, 2, 100082. [Google Scholar] [CrossRef]
- Chen, L.; Xie, S.; Lopes, A.M.; Li, H.; Bao, X.; Zhang, C.; Li, P. A new SOH estimation method for Lithium-ion batteries based on model-data-fusion. Energy 2024, 286, 129597. [Google Scholar] [CrossRef]
- Fan, C.; Liu, K.; Ren, Y.; Peng, Q. Characterization and identification towards dynamic-based electrical modeling of lithium-ion batteries. J. Energy Chem. 2024, 92, 738–758. [Google Scholar] [CrossRef]
- Fan, C.; Zhang, K.; Peng, Q.; Tian, J.; Liu, K.; Chung, C.Y. Fast Characterization of Lithium-Ion Battery Impedance and Nonlinearity Using Optimized Multisine Perturbation Signal. IEEE Trans. Ind. Electron. 2025, 1–11. [Google Scholar] [CrossRef]
- Li, X.; Lyu, M.; Li, K.; Gao, X.; Liu, C.; Zhang, Z. Lithium-ion battery state of health estimation based on multi-source health indicators extraction and sparse Bayesian learning. Energy. 2023, 282, 128445. [Google Scholar] [CrossRef]
- Zhang, F.; Xing, Z.-X.; Wu, M.-H. State of health estimation for Li-ion battery using characteristic voltage intervals and genetic algorithm optimized back propagation neural network. J. Energy Storage 2023, 57, 106277. [Google Scholar]
- Wu, M.; Zhong, Y.; Wu, J.; Wang, Y.; Wang, L. State of health estimation of the lithium-ion power battery based on the principal component analysis-particle swarm optimization-back propagation neural network. Energy 2023, 283, 129061. [Google Scholar] [CrossRef]
- Li, Y.; Ye, M.; Wang, Q.; Lian, G.; Xia, B. An improved model combining machine learning and Kalman filtering architecture for state of charge estimation of lithium-ion batteries. Green Energy Intell. Transp. 2024, 3, 100163. [Google Scholar] [CrossRef]
- Sulaiman, M.H.; Mustaffa, Z. State of charge estimation for electric vehicles using random forest. Green Energy Intell. Transp. 2024, 3, 100177. [Google Scholar] [CrossRef]
- Zhang, C.; Luo, L.; Yang, Z.; Du, B.; Zhou, Z.; Wu, J.; Chen, L. Flexible method for estimating the state of health of lithium-ion batteries using partial charging segments. Energy 2024, 295, 131009. [Google Scholar] [CrossRef]
- Li, C.; Zhu, S.; Zhang, L.; Liu, X.; Li, M.; Zhou, H.; Zhang, Q.; Rao, Z. State of charge estimation of lithium-ion battery based on state of temperature estimation using weight clustered-convolutional neural network-long short-term memory. Green Energy Intell. Transp. 2025, 4, 100226. [Google Scholar] [CrossRef]
- Zhang, C.; Luo, L.; Yang, Z.; Zhao, S.; He, Y.; Wang, X.; Wang, H. Battery SOH estimation method based on gradual decreasing current, double correlation analysis and GRU. Green Energy Intell. Transp. 2023, 2, 100108. [Google Scholar] [CrossRef]
- Xu, R.; Wang, Y.; Chen, Z. A hybrid approach to predict battery health combined with attention-based transformer and online correction. J. Energy Storage 2023, 65, 107365. [Google Scholar] [CrossRef]
- Bao, X.; Chen, L.; Lopes, A.M.; Li, X.; Xie, S.; Li, P.; Chen, Y. Hybrid deep neural network with dimension attention for state-of-health estimation of Lithium-ion Batteries. Energy 2023, 278, 127734. [Google Scholar] [CrossRef]
- Wang, T.; Zhu, Y.; Zhang, Z.; Bi, F.; Sun, L.; Kim, T.; Shang, Y. A SOH estimation method within micro-voltage interval based on ICA peak distribution for lithium-ion batteries. IEEE Trans. Transp. Electrif. 2025. [Google Scholar] [CrossRef]
- Xu, W.; Zhu, J.; Zhang, J.; Tian, M.; Cai, J.; Wu, H.; Wei, G.; Chen, T.; Wei, X.; Dai, H. Investigation of lithium-ion battery degradation by corrected differential voltage analysis based on reference electrode. Appl. Energy 2025, 389, 125735. [Google Scholar] [CrossRef]
- Wang, Y.; Feng, X.; Guo, D.; Hsu, H.; Hou, J.; Zhang, F.; Xu, C.; Chen, X.; Wang, L.; Zhang, Q.; et al. Temperature excavation to boost machine learning battery thermochemical predictions. Joule 2024, 8, 2639–2651. [Google Scholar] [CrossRef]
- Shang, Y.; Chen, G.; Peng, Q.; Zhu, T.; Liu, K. An intelligent preheating approach based on high-gain control for lithium-ion batteries in extremely cold environment. IEEE Trans. Ind. Electron. 2024, 71, 4697–4706. [Google Scholar] [CrossRef]
- Sun, Y.; Xie, H.; Diao, Q.; Xu, H.; Tan, X.; Fan, Y.; Wei, L. A novel SOH estimation method with attentional feature fusion considering differential temperature features for lithium-ion batteries. IEEE Trans. Instrum. Meas. 2024, 73, 3538911. [Google Scholar] [CrossRef]
- Zhao, H.; Chen, Z.; Shu, X.; Shen, J.; Lei, Z.; Zhang, Y. State of health estimation for lithium-ion batteries based on hybrid attention and deep learning. Reliab. Eng. Syst. Saf. 2023, 232, 109066. [Google Scholar] [CrossRef]
- Sulaiman, M.H.; Mustaffa, Z.; Mohamed, A.I.; Samsudin, A.S.; Rashid, M.I.M. Battery state of charge estimation for electric vehicle using Kolmogorov-Arnold networks. Energy 2024, 311, 133417. [Google Scholar] [CrossRef]
- Chen, C.; Wu, Y.; Shi, J.; Yue, D.; Shi, G.; Lyu, D. A parallel weighted ADTC-Transformer framework with FUnet fusion and KAN for improved lithium-ion battery SOH prediction. Control Eng. Pract. 2025, 159, 106302. [Google Scholar] [CrossRef]


| Pearson Correlation Coefficient | |||||
|---|---|---|---|---|---|
| IC Area | CP Area | CP Peak | IC Peak | AOT | DV Peak |
| 0.9676 | 0.9887 | 0.8019 | −0.0362 | 0.9137 | −0.1825 |
| Cathode | LiFePO4 |
| Anode | Graphite |
| Rated capacity | 2.5 Ah |
| Nominal voltage | 3.6 V |
| Discharge rate | 2600 mA |
| Charging cutoff current | 50 mA |
| Method | Input | Estimation Algorithm |
|---|---|---|
| Proposed method | CP Area, AOT | CNN-KAN |
| Comparative method-1 | CP Area, AOT | CNN-LSTM |
| Comparative method-2 | CP Area, AOT | CNN-GRU |
| Comparative method-3 | CP Area, AOT | CNN-Transformer |
| Comparative method-4 | CP Area, AOT | CNN-SVR |
| Method | Evaluation Metric (%) | Battery-1 | Battery-2 | Battery-3 | Battery-4 |
|---|---|---|---|---|---|
| Proposed method | R2 | 97.88 | 96.44 | 96.56 | 98.34 |
| RMSE | 0.85 | 0.65 | 0.81 | 0.63 | |
| MAE | 0.66 | 0.49 | 0.62 | 0.46 | |
| Comparative method-1 | R2 | 95.51 | 94.00 | 93.93 | 95.50 |
| RMSE | 1.24 | 0.84 | 1.07 | 1.04 | |
| MAE | 1.02 | 0.53 | 0.97 | 0.95 | |
| Comparative method-2 | R2 | 94.29 | 93.04 | 92.47 | 93.98 |
| RMSE | 1.40 | 0.91 | 1.19 | 1.20 | |
| MAE | 1.11 | 0.63 | 0.92 | 1.12 | |
| Comparative method-3 | R2 | 92.81 | 91.40 | 91.27 | 91.36 |
| RMSE | 1.57 | 1.01 | 1.28 | 1.44 | |
| MAE | 1.00 | 0.81 | 1.01 | 1.25 | |
| Comparative method-4 | R2 | 93.50 | 92.04 | 91.37 | 91.81 |
| RMSE | 1.49 | 0.97 | 1.28 | 1.40 | |
| MAE | 1.06 | 0.55 | 0.91 | 1.23 |
| Feature | Input | Estimation Algorithm |
|---|---|---|
| Proposed feature | CP Area, AOT | CNN-KAN |
| Comparative feature-1 | IC Area | CNN-KAN |
| Comparative feature-2 | AOT | CNN-KAN |
| Comparative feature-3 | IC Area, AOT | CNN-KAN |
| Comparative feature-4 | CP Area | CNN-KAN |
| Comparative feature-5 | CP Area, IC Area | CNN-KAN |
| Feature | Evaluation Metric (%) | Battery-1 | Battery-2 | Battery-3 | Battery-4 |
|---|---|---|---|---|---|
| Proposed feature | R2 | 97.88 | 96.44 | 96.56 | 98.34 |
| RMSE | 0.85 | 0.65 | 0.81 | 0.63 | |
| MAE | 0.66 | 0.49 | 0.62 | 0.46 | |
| Comparative feature-1 | R2 | 94.79 | 84.43 | 80.47 | 61.53 |
| RMSE | 1.33 | 1.36 | 1.92 | 3.04 | |
| MAE | 1.02 | 1.02 | 1.43 | 2.21 | |
| Comparative feature-2 | R2 | 84.60 | 67.66 | 40.74 | 74.71 |
| RMSE | 2.29 | 1.96 | 3.35 | 2.46 | |
| MAE | 1.71 | 1.32 | 3.06 | 1.97 | |
| Comparative feature-3 | R2 | 92.48 | 86.17 | 81.88 | 78.48 |
| RMSE | 1.60 | 1.28 | 1.85 | 2.27 | |
| MAE | 1.22 | 0.89 | 1.32 | 1.76 | |
| Comparative feature-4 | R2 | 97.05 | 93.91 | 94.18 | 95.81 |
| RMSE | 1.00 | 0.85 | 1.05 | 1.00 | |
| MAE | 0.67 | 0.51 | 0.74 | 0.84 | |
| Comparative feature-5 | R2 | 95.50 | 93.51 | 94.15 | 94.65 |
| RMSE | 1.24 | 0.88 | 1.05 | 1.13 | |
| MAE | 0.72 | 0.49 | 0.77 | 1.03 |
Disclaimer/Publisher’s Note: The statements, opinions and data contained in all publications are solely those of the individual author(s) and contributor(s) and not of MDPI and/or the editor(s). MDPI and/or the editor(s) disclaim responsibility for any injury to people or property resulting from any ideas, methods, instructions or products referred to in the content. |
© 2025 by the authors. Licensee MDPI, Basel, Switzerland. This article is an open access article distributed under the terms and conditions of the Creative Commons Attribution (CC BY) license (https://creativecommons.org/licenses/by/4.0/).
Share and Cite
Cheng, K.; Zhang, C.; Shao, K.; Tong, J.; Wang, A.; Zhou, Y.; Zhang, Z.; Zhang, Y. A SOH Estimation Method for Lithium-Ion Batteries Based on CPA and CNN-KAN. Batteries 2025, 11, 238. https://doi.org/10.3390/batteries11070238
Cheng K, Zhang C, Shao K, Tong J, Wang A, Zhou Y, Zhang Z, Zhang Y. A SOH Estimation Method for Lithium-Ion Batteries Based on CPA and CNN-KAN. Batteries. 2025; 11(7):238. https://doi.org/10.3390/batteries11070238
Chicago/Turabian StyleCheng, Kaixin, Chaolong Zhang, Kui Shao, Jin Tong, Anxiang Wang, Yujie Zhou, Zhao Zhang, and Yan Zhang. 2025. "A SOH Estimation Method for Lithium-Ion Batteries Based on CPA and CNN-KAN" Batteries 11, no. 7: 238. https://doi.org/10.3390/batteries11070238
APA StyleCheng, K., Zhang, C., Shao, K., Tong, J., Wang, A., Zhou, Y., Zhang, Z., & Zhang, Y. (2025). A SOH Estimation Method for Lithium-Ion Batteries Based on CPA and CNN-KAN. Batteries, 11(7), 238. https://doi.org/10.3390/batteries11070238