Article

Optimized Flow Field Design with Dead-Zone Compensation for Enhanced Performance in Aqueous AgO-Al Batteries

1
College of Power and Energy Engineering, Harbin Engineering University, Harbin 150001, China
2
Institute of Systems Engineering, Academy of Military Sciences, Beijing 102300, China
*
Authors to whom correspondence should be addressed.
Batteries 2025, 11(7), 237; https://doi.org/10.3390/batteries11070237
Submission received: 14 April 2025 / Revised: 12 June 2025 / Accepted: 18 June 2025 / Published: 20 June 2025
(This article belongs to the Section Aqueous Batteries)

Abstract

:
The electrolyte flow field plays a pivotal role in determining the electrochemical performance of aqueous AgO-Al batteries. However, traditional flow field structures often suffer from the formation of dead zones, leading to uneven mass transport and side reactions. In this study, a flow field optimization strategy incorporating dead-zone compensation is proposed, which identifies localized dead zones and implements structural corrections to enhance electrolyte distribution. Numerical simulations reveal improved flow uniformity and reduced concentration polarization, while experimental validation confirms enhanced battery performance under the optimized configuration. This work provides a generalizable approach for electrolyte flow field design that improves mass transfer and electrochemical efficiency, offering practical insights for the development of high-performance aqueous batteries.

Graphical Abstract

1. Introduction

The aqueous AgO-Al battery is considered to be a promising new energy supply device because of its various advantages, such as a good heat dissipation performance, no requirement to carry an electrolyte device during operation, and a relatively long service life [1]. The battery is mainly composed of a bipolar plate engraved with a flow channel, an electrode, and a separator particle to form an open structure [2]. Its discharge principle is similar to that of the flow battery, but both battery types have relatively high manufacturing costs and challenges regarding a wide range of commercial applications [3,4]. Further, the improvement of electrolyte utilization and power density is currently recognized as a significant issue in terms of the reduction in manufacturing costs [5,6]. This can be solved through the design of a new electrolyte flow channel structure and by optimizing the electrolyte flow field [7,8].
The flow channel structure of the battery is an important component that guides the electrolyte into the battery body and distributes it onto the electrode, which in turn produces an electrochemical reaction for the release of electrical energy [9]. More specifically, the flow channel structure is a significant factor that affects the performance of the battery by affecting the uniform distribution of the electrolyte on the electrode and the power consumption of the circulating pump [10,11,12,13]. Thus, an unsuitable design of the flow channel structure will lead to the poor mass transfer capacity of the electrolyte that flows through the flow channel, which can easily lead to a local concentration overpotential and low electrode utilization [14,15,16].
In the past few decades, a great deal of research has been conducted on the flow channel structures of batteries [17,18,19]. A parallel flow field [20,21], cross-flow field [22,23], and serpentine flow field [24,25] have been used in water-activated batteries. In a comparative study of different flow channel structures, there was a focus on the uniformity of the electrolyte distribution. It was found that the distribution of the electrochemical reaction rate and current density in the electrode were affected by this distribution [26,27,28]. By establishing a three-dimensional multi-physical field coupling model of the battery, Xu et al. [29] explored the influence of different flow channel structures (without a flow channel, with a parallel flow channel, and with a serpentine flow channel) on the uniformity of the electrolyte distribution on the battery electrode. They formulated an equation for the calculations of the uniformity of the electrolyte distribution. Messaggi et al. [30] compared the effects of the serpentine flow field and cross-flow field on the distribution of the electrochemical reaction rate on the electrode of the flow battery. For the serpentine flow channel, the inhomogeneity of the electrochemical reaction rate distribution in the electrode plane direction was found to be larger than for the cross-flow channel. It showed a distribution trend of higher reaction rates on both sides of the electrode, and a lower reaction rate in the middle. This observation was mainly explained by the uneven distribution of the electrolyte infiltration in the serpentine flow channel battery. In addition, the electrochemical reaction rate at the lower part of the rib was significantly higher than that at the lower part of the flow channel, whether it was a serpentine flow channel or a cross-flow channel.
Although characterized by relative simplicity and notable processing merits, the three conventional flow channel structures suffer from performance limitations under certain operating conditions. For example, the electrolyte cannot fully penetrate the electrode when the parallel flow field is used, which results in an increase in the polarization [31]. Further, when using the serpentine flow channel, the pressure drop is large and the electrolyte distribution is uneven in the local area [32]. Furthermore, the cross-flow channel is prone to an uneven flow distribution when the electrode area is large [33]. To further improve the battery performance, a series of designs and optimizations of new channel structures have been performed [34,35,36,37]. Pan et al. [38] proposed a linear decrease along the direction of the fluid flow in the depth of the flow channel, which accelerated the fluid flow rate and increased the downstream velocity. Compared with the serpentine flow channel, the energy efficiency and electrolyte utilization of the battery increased by 5% and 27.7%, respectively, for relatively high current density and low flow rate operating conditions (400 mA/cm2 and 12 mL/min·cm2, respectively). Many researchers have also conducted studies on the flow field design of different flow channel depths/widths in batteries. These studies have shown that the depth and width of the flow channels have a considerable impact on the discharge characteristics of batteries [39,40,41]. Obviously, large energy efficiency improvements have been made for these specific designs. However, there are different degrees of flow dead-zone areas in these designs. Eliminating this specific region offers significant potential for enhancing electrolyte utilization and improving mass transfer between the electrode plates. Consequently, developing robust methodologies to identify electrolyte flow field dead zones in aqueous silver oxide–aluminum (AgO-Al) batteries, along with effective strategies for their mitigation, remains a key research challenge. Overall, battery discharge performance is critically dependent on the electrolyte flow field architecture. However, investigations specifically addressing the flow field design in AgO-Al systems are scarce. Critically, the presence of such stagnant zones induces localized concentration overpotential and promotes parasitic side reactions.
In this paper, a general dead-zone compensation method for the electrolyte flow field is proposed, which surpasses the conventional four-channel straight-through channel structure design method. The commercial software Ansys CFD 18.0 has been used to model the traditional flow channel structure and to conduct numerical calculations on the electrolyte flow characteristics in this channel. By detecting the dead-zone area, the local flow channel design has been reasonably adjusted to compensate the electrolyte momentum dissipation and strengthen the electrolyte mass transfer capacity. The specific technical route is presented in Figure 1. In this framework, the conventional flow-guided structure is numerically analyzed, and the dead zone is identified. Subsequently, ten variants of flow-guided structures are proposed by adjusting local structure parameters. Finally, the performance of the conventional flow-guided structure is compared with that of the optimal flow-guided structure. In addition, the effects of channel width and inclination angle on the flow characteristics of the electrolyte were studied, and performance analyses of aqueous AgO-Al batteries with dead-zone-compensated designs were undertaken. The proposed dead-zone compensation method has effectively improved the uniform distribution of the electrolyte. It has also enhanced the power density and electrolyte utilization, reduced the activation time, and provided promising technical guidance for the development of high-performance aqueous AgO-Al batteries.

2. Numerical Methods

2.1. Physical Model

Figure 2 shows the typical structure and boundary conditions of the aqueous AgO-Al battery. R1 (12 mm), h1 (0.5 mm), and h2 (1 mm) represent the radius of the inlet and outlet, the depth of the reaction area, and the depth of the inlet and outlet, respectively. In the present study, the reaction area was square in shape with a side length L (100 mm). The other structural parameters were as follows. The widths of the primary and secondary branch channels were d1 (4 mm) and d2 (3 mm), respectively. The distance between the secondary branch channels on both sides of the import and export was S2 = 31 mm, the distance between the other secondary branch channels was S1 = 20 mm, the length of the branch channel was l1 = 11 mm, and the secondary branch channels on both sides of the import and export were symmetrically distributed. In addition, aiming at the problems of poor mass transfer and the flow characteristics of the electrolyte in the reaction zone of the aqueous AgO-Al battery, the detailed parameters of the flow channel structure in the proposed dead-zone compensation method are presented in detail in Section 3.

2.2. Numerical Details

CFD software was used in the detailed study of the electrolyte mass transfer in the flow channel and its influence on the flow characteristics of the electrolyte (i.e., pressure drop and velocity distribution), which is difficult to investigate experimentally. This study was based on the dead-zone compensation design method, which has been proposed in the present study. CFD software was used for three-dimensional modeling and simulations of different flow channel structures. The model employed several simplifying assumptions: (1) electrolytes were incompressible, (2) electrodes and frames were isotropic and homogeneous, (3) battery operation was steady-state, (4) side reactions (e.g., hydrogen evolution) were neglected, and (5) the conditions were isothermal. Complete details of the governing equations, boundary conditions, and numerical approach are available in the authors’ earlier publication [42]. Further, the governing equations for fluid mechanics, grid-independent testing, and model validation are described in detail in Supplementary Materials (Figures S1–S4).

2.3. Post-Process Simulations

2.3.1. Pressure Drop

The pressure drop did not only affect the flow rate of the electrolyte in the flow channel, but it also had a large effect on the pump consumption, which provided power for the continuous circulation of the electrolyte [43]. Therefore, this parameter needed to be analyzed, and the inlet and outlet pressure drop is defined as follows:
P = P i n P o u t
where Pin represents the inlet pressure (Pa) and Pout indicates the outlet pressure (Pa) [44].

2.3.2. Ratio of the Dead-Zone Area

The dead-zone area ratio (ADR), representing the quotient between the inactive zone area and the total reaction area, is defined mathematically as [44]
A D R = A D A t = 1 A A R
A A R = A A A t
where ADR is defined as the dead-zone area ratio, AD is the dead-zone area (mm2), At is the total reaction area (mm2), AAR is the ratio of the active area, and AA is the active area (mm2). ImageJ 2.0 software-based image processing was employed to accurately quantify ADR by identifying and measuring these respective areas [44,45,46].

2.3.3. Branch Resistance

Branch resistance denotes the electrical resistance at the inlet and outlet channels of the aqueous AgO-Al battery bipolar plates. Higher resistance reduces leakage current, thus decreasing current losses. The formula for the branch resistance calculation is as follows [43,44]:
R = ρ L m S
where ρ represents electrical resistivity (Ω·m), Lm denotes the material length (m), and S indicates the cross-sectional area of the material (m2).

3. Experimental

3.1. Battery Setup

A laboratory-scale single-cell aqueous AgO-Al battery was constructed to evaluate its electrochemical performance. As shown in Figure 2, epoxy resin plates featured optimized flow-guided channels, with a silver oxide electrode as the cathode and an aluminum foil electrode as the anode. Electrodes (0.25 mm in thickness) were fabricated via rolling at speeds below 100 mm/s. Copper current collectors were placed at both terminals. The galvanostatic discharge and polarization behaviors were characterized using a custom-built testing system (Figure S5), with electrolyte (4 mol/L NaOH) supplied via a peristaltic pump (BT300-1F, Longerpump Ltd., UK). Whilst aluminum was an ideal anode material, there were still problems with anode passivation and self-corrosion for practical applications. The addition of Na₂SnO₃ (20 g/L) to the electrolyte aimed to suppress hydrogen self-corrosion at the aluminum anode. However, the presence of a dense protective oxide layer on the anode surface resulted in limited discharge capabilities at ambient temperature. To mitigate this effect and maintain optimal reaction kinetics, the electrolyte was maintained at 85 °C using a thermostatic water bath.

3.2. Battery Tests

To assess the optimized flow-guided structure’s impact on battery performance, key metrics—including discharge voltage U (V), discharge duration time t (s), electrolyte utilization (EU), dry-mass specific energy (EM), dry-mass power density (WM), and pumping loss (Wpump)—were calculated as follows [44]:
E U = Q d i s c h a r g e Q t h e o r y
E M = E d i s c h a r g e M
W M = W b a t t e r y M
W p u m p = q P η
where Qdischarge is the available discharge capacity and Qtheory is the theoretical capacity of the electrode (433 mAh/g in this study) [47]. Further, Edischarge is the discharge energy, M is the mass of the electrode, Wbattery is the power of the battery, q is the flow rate, and the pump efficiency η is equal to 0.6 [44].

4. Results

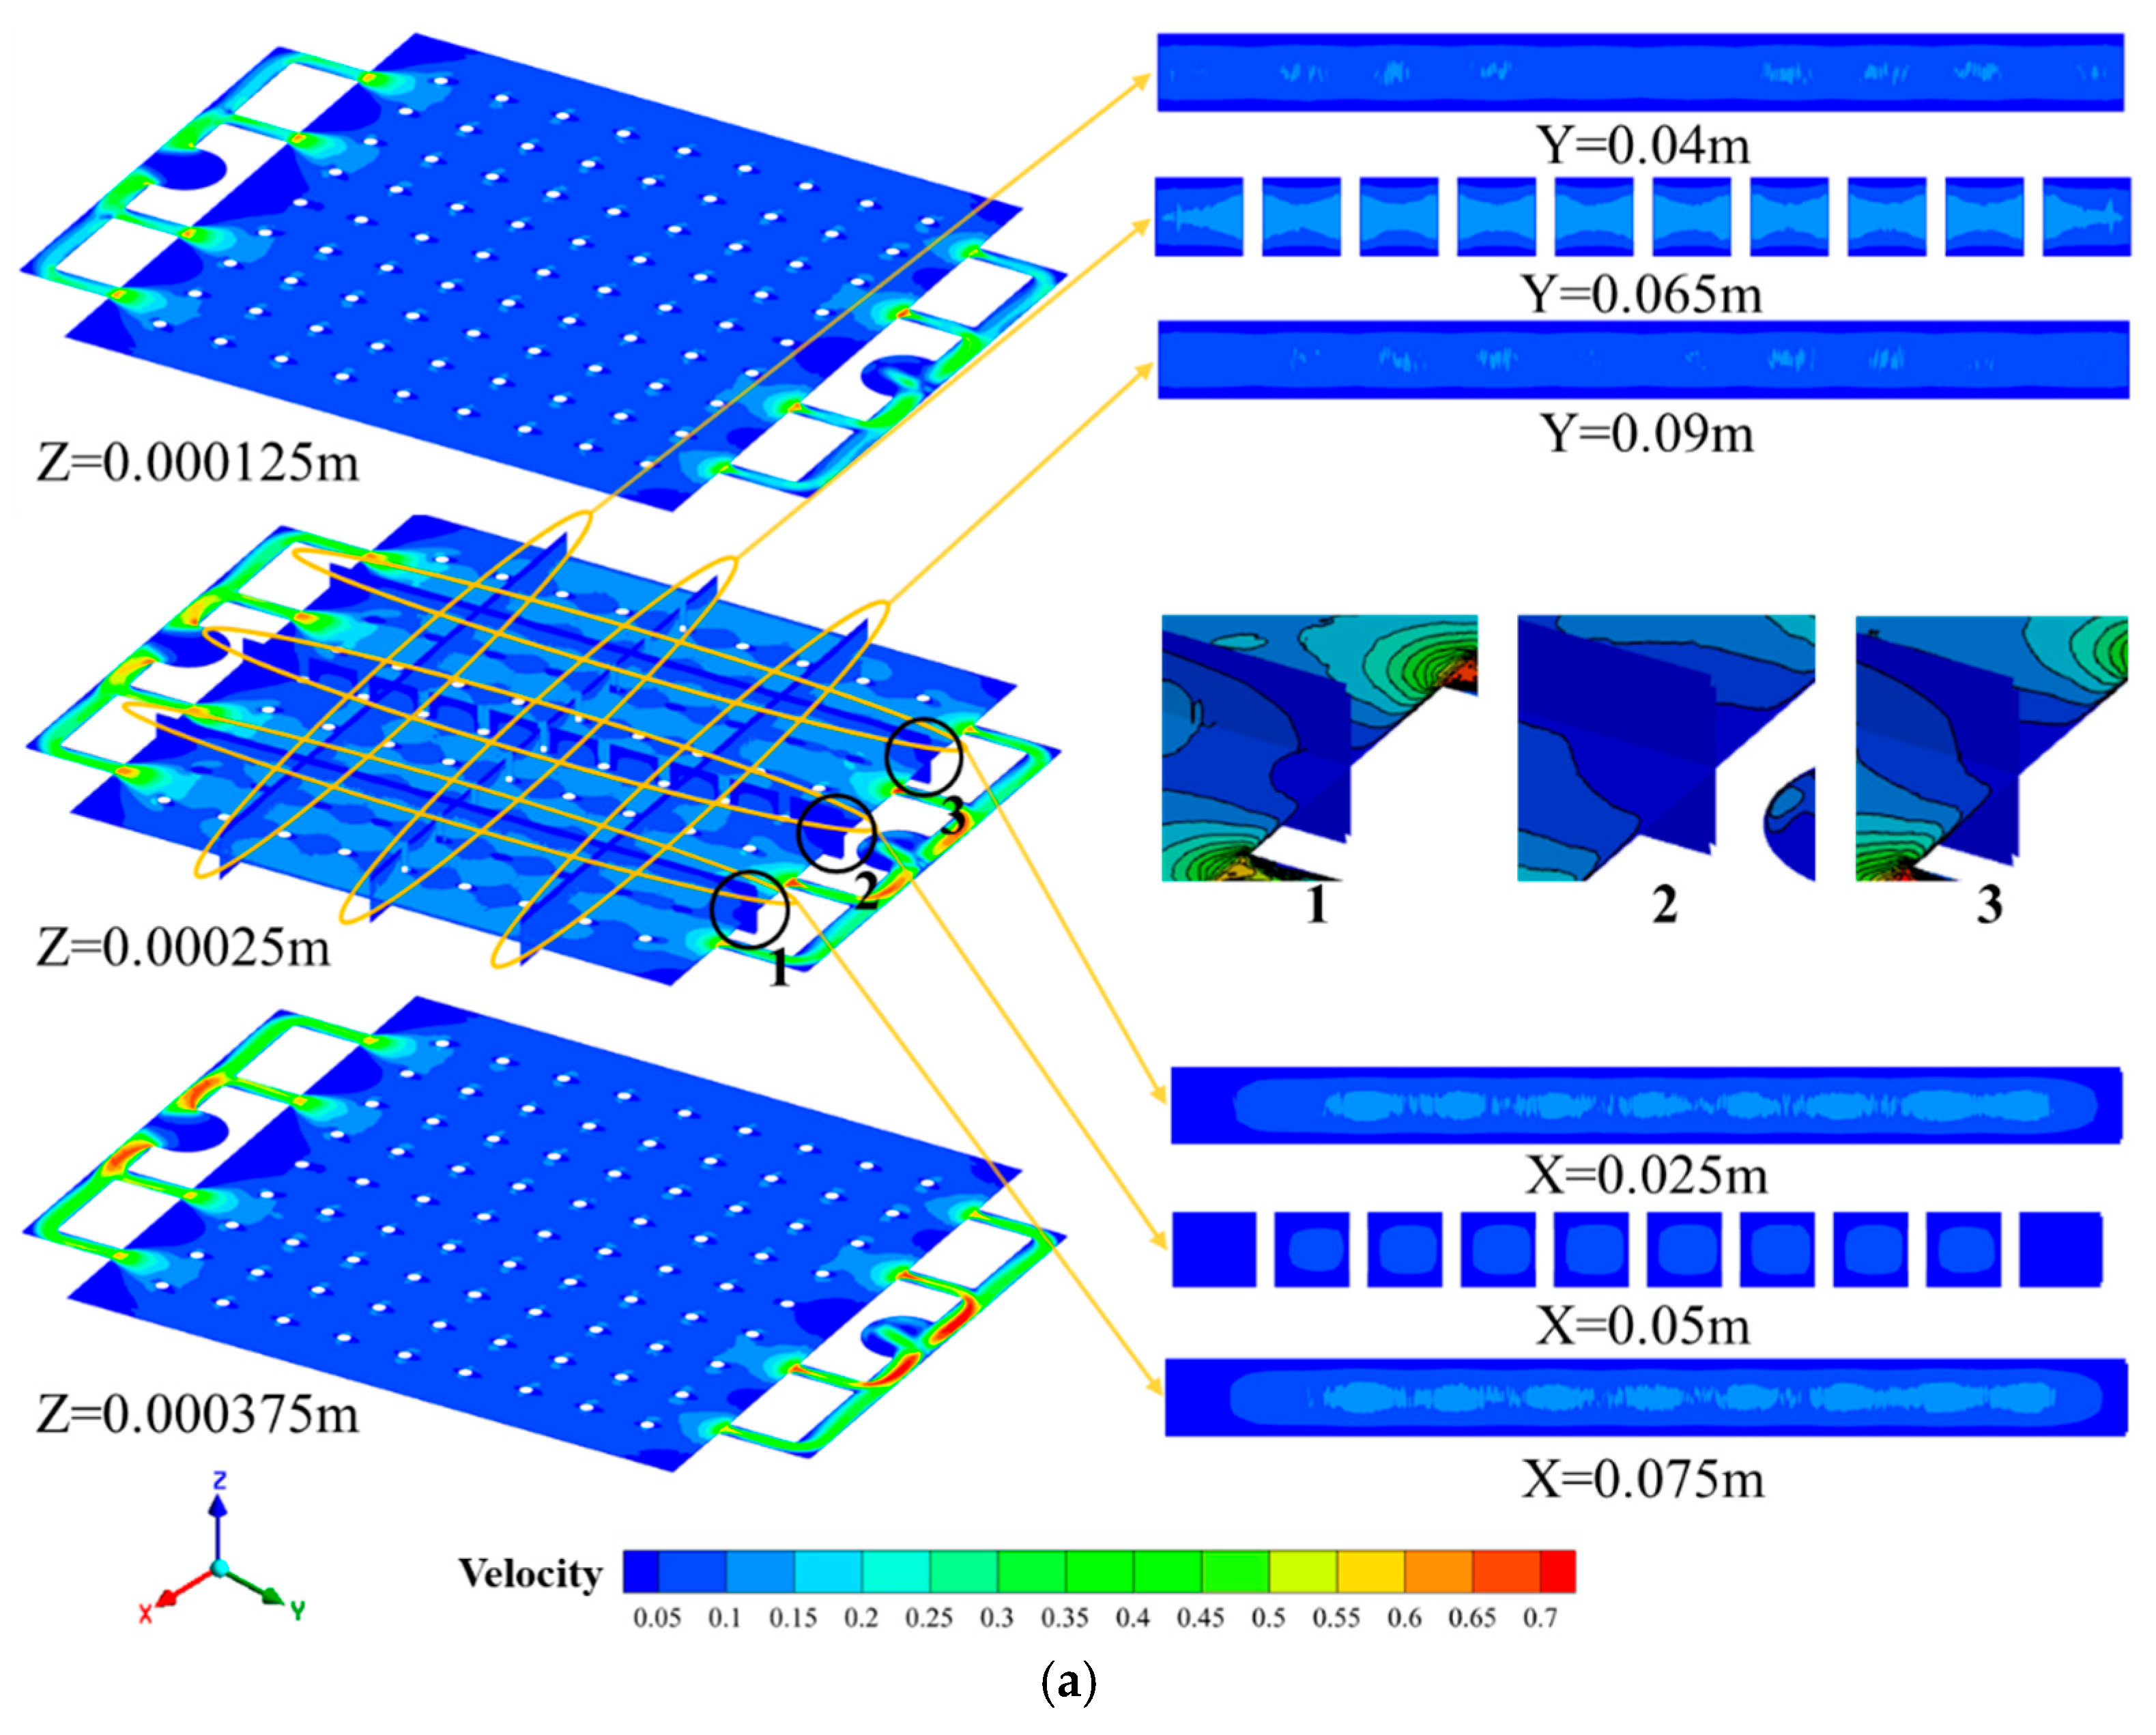
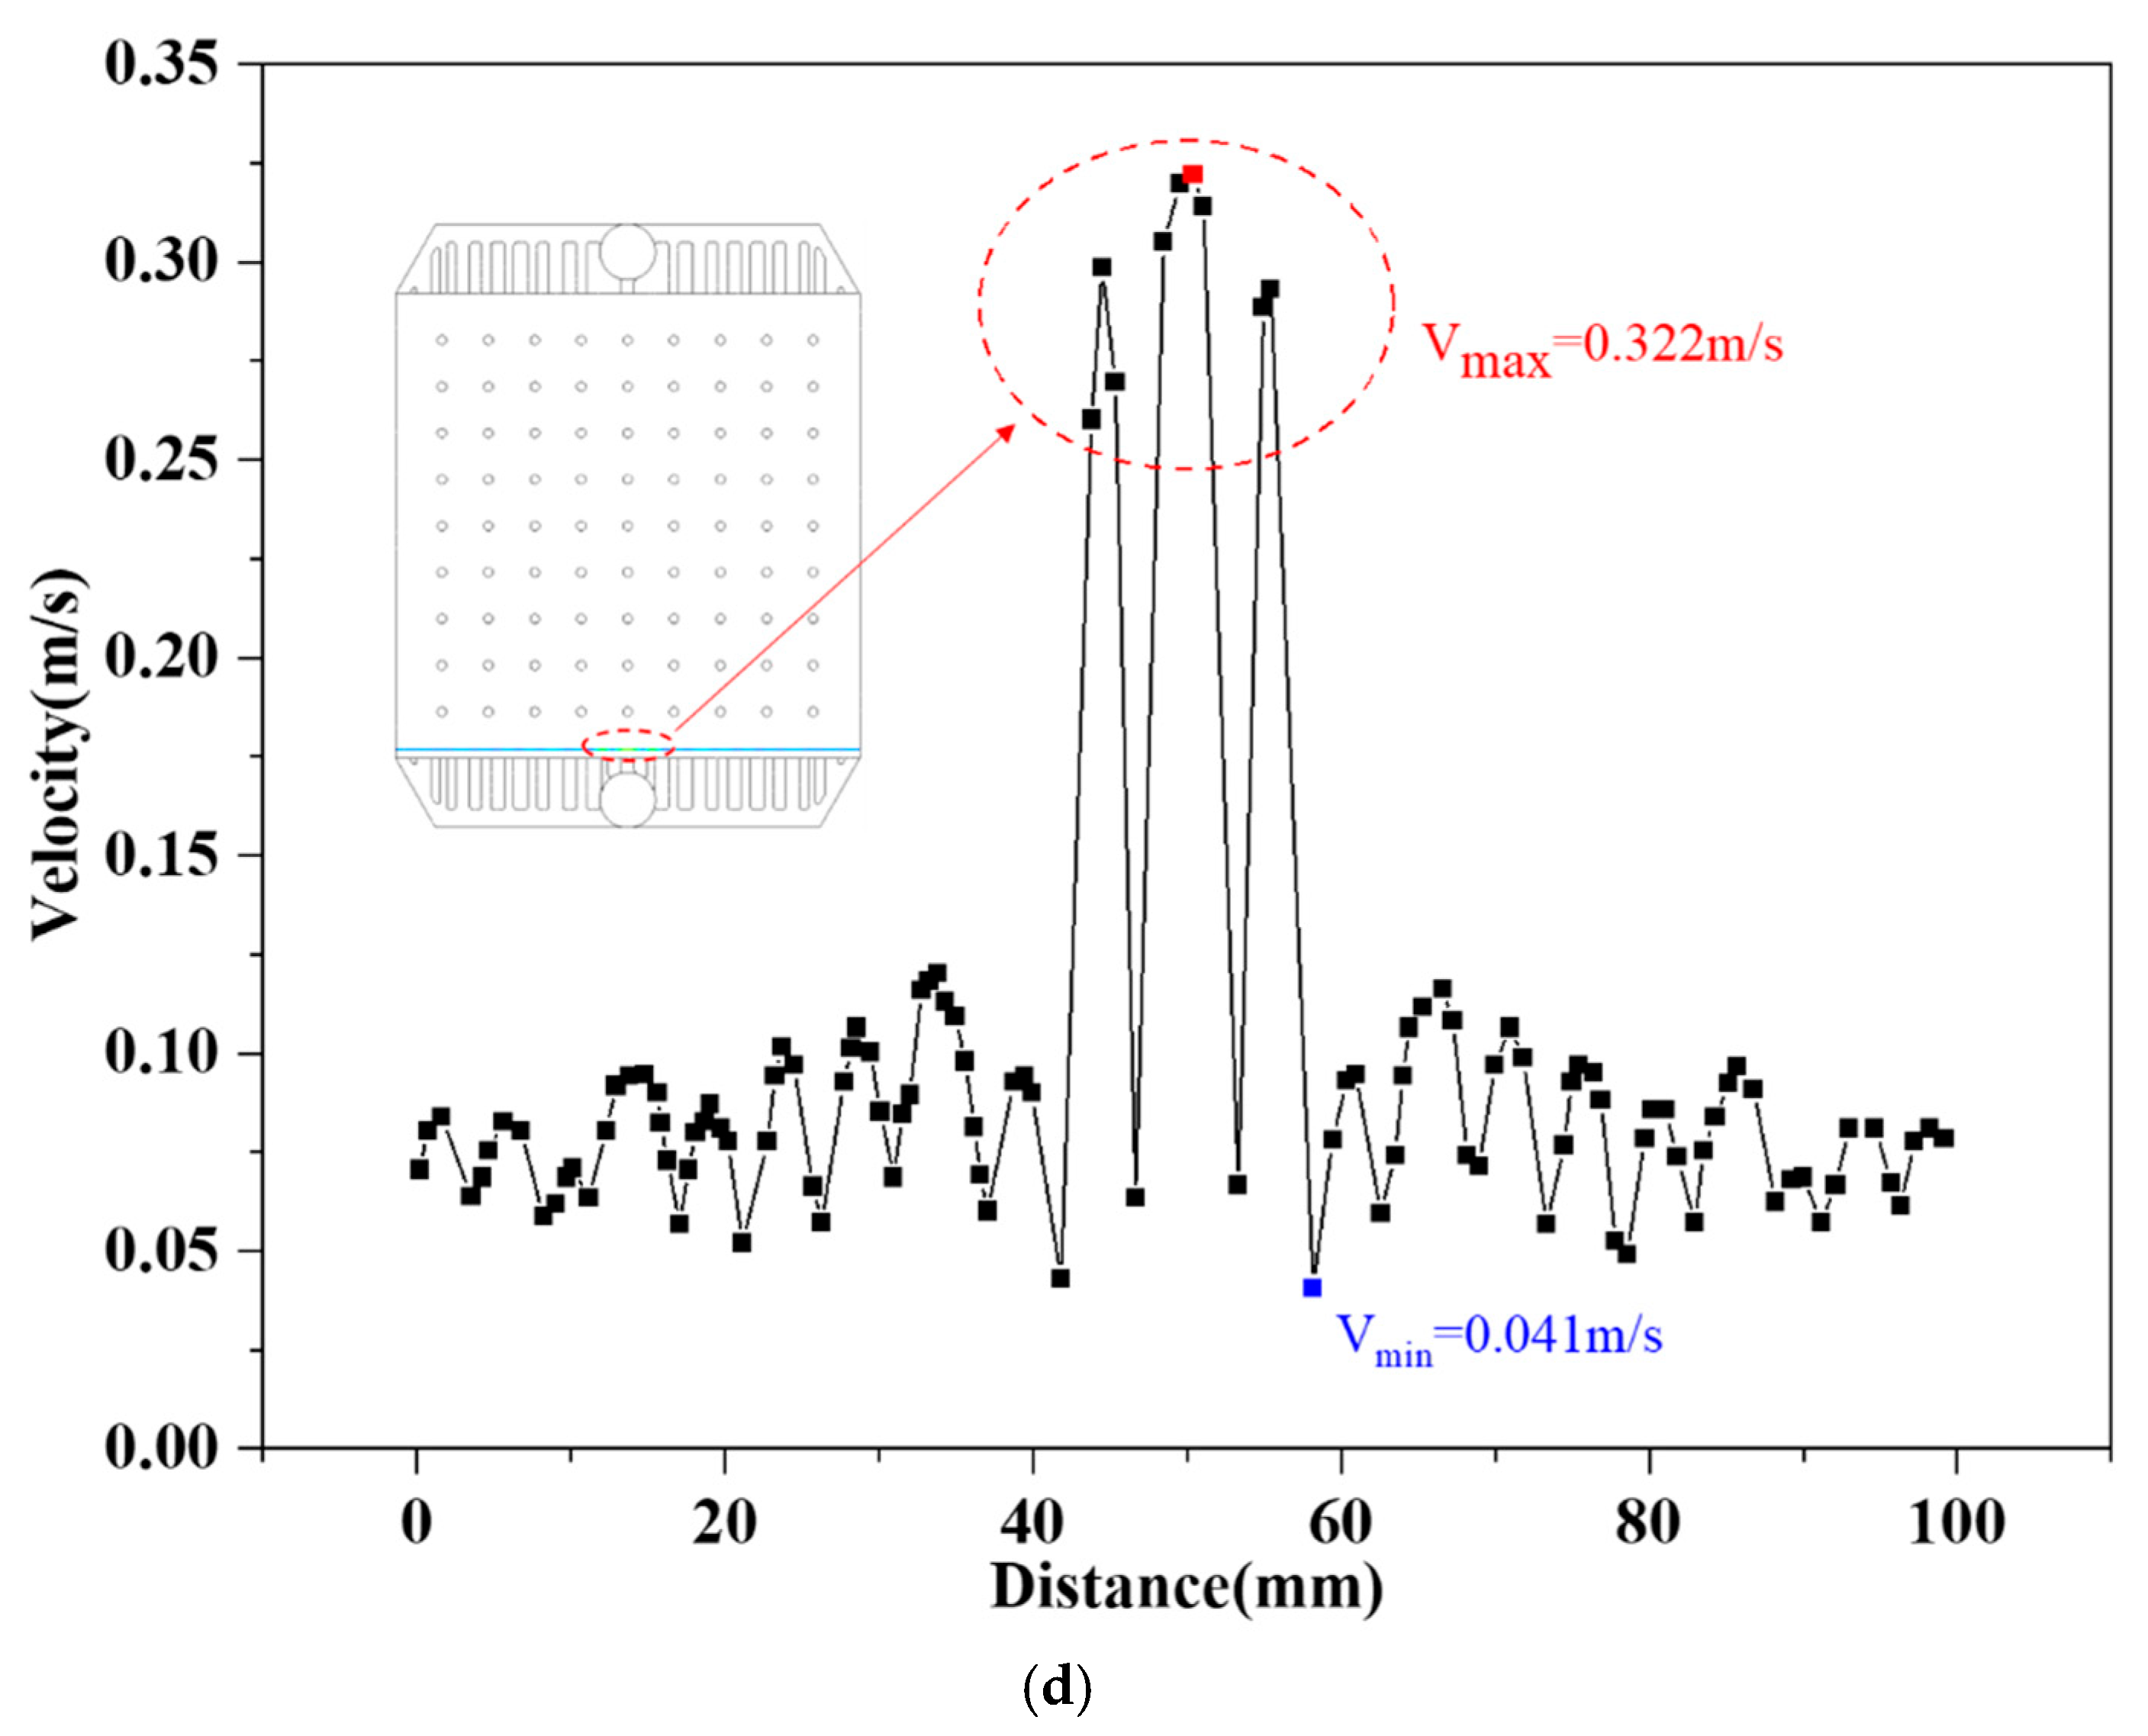
4.1. Simulations of Electrolyte Flow Field

Figure 3 shows the velocity cloud and vector diagram, which are based on the given flow channel structure. In the whole flow -field area, the velocity distribution in the middle of the reaction zone was relatively uniform, and large velocity gradients were mainly observed on the inlet and outlet sides, especially near the secondary branch channel. Further, the velocity vector in the reaction zone was mainly the direction from the inlet to the outlet, but there were different degrees of eddy currents on both sides of the inlet channel. This is because when the fluid flowed from a narrow channel to a wide channel, the momentum in the impact retention zone increased. Obviously, the fluid in the region where the vortex was generated had difficulty circulating, and it continued to exist in some areas of the reaction zone to produce a poor mass transfer zone. This is usually called the ‘dead zone’ [48,49]. In the discharge process of the aqueous AgO-Al battery, it was necessary to provide a uniform and fresh electrolyte for the reaction zone. However, the dead zones limited the amount of electrolyte that could flow into the reaction zone. In these dead zones, there was a serious lack of sufficient reactant supply, which resulted in a local overpotential and side reactions (such as hydrogen evolution [50,51,52]), and the generated bubbles were difficult to completely discharge. This further inhibited the mass transfer ability of the fluid in the reaction zone [53,54]. Further, this effect reduced the electrolyte utilization and discharge performance of the aqueous AgO-Al battery. In addition, the jet velocities in the four inlet secondary branch channels reached up to 0.59 m/s, while the minimum jet velocity was only 0.005 m/s (Figure 3). The maximum velocity in the vortex zone on both sides of the inlet secondary branch channel was 0.055 m/s. Therefore, for the research object in the present study, the area below the maximum velocity in the eddy current zone was defined as the dead zone.

4.2. Dead--Zone-Compensated Design

According to the analyses presented in Section 3.1, the dead zone in the flow field could be effectively detected under given conditions. In view of the above-presented dead-zone area, the proposed dead-zone compensation design method mainly achieved the following three purposes: (1) a reduction in the dead-zone area of the reaction zone; (2) an improvement in the uniformity of the electrolyte flow rate distribution in the reaction zone; (3) reduction in the pressure loss of import and export. Specifically, a secondary branch channel was locally added to compensate for the mass transfer characteristics near the inlet and outlet. Ten types of dead-zone compensation channel structures are presented in Figure 4. The channel types were as follows: type I (d3 = 3 mm, d4 = 3 mm, and d5 = 3 mm), type II (α = 50°), type III (α = 55°), type IV (α = 60°), type V (α = 60°; d6 = 3 mm, d7 = 3 mm, d8 = 3 mm, and d9 = 3 mm), type VI (α = 60°; d10 = 1.5 mm), type VII (α = 60°; d11 = 1.5 mm), type VIII (α = 60°; d7 = 2 mm, d8 = 2 mm, and d9 = 2 mm), type IX (α = 60°; d4 = 2 mm, d7 = 2 mm, d8 = 2 mm, and d9 = 2 mm), and type X (α = 60°; d4 = 1 mm, d7 = 1 mm, d8 = 1 mm, and d9 = 1 mm).

4.3. Effects of Channel Width and Angle

Figure 5a,b present the velocity contours with velocity distributions above 0.055 m/s for different fluid channel types. By using the dead-zone compensation design method, it could be seen that the dead-zone area of the flow field was improved after optimization of the flow channel structure. In channel structure I, the velocity was very small even though the uniformity of the velocity distribution in the reaction zone was largely improved. By comparing flow channel structures II, III, and IV, it is clear that the change in the deflection angle of the flow channel (on both sides) had only a small effect on the velocity distribution of the mainstream field. However, it had a certain effect on the jet velocity of the secondary branch channel at the inlet. Further, for the given conditions, when the deflection angle of the flow channel was 60°, the jet velocity of the secondary branch channel was relatively uniform. As compared with channel structures I, II, III, and IV, the flow dead zones in the reaction zones of channel structures V, VI, VII, VIII, IX, and X were largely improved. Reduced stagnant-flow areas augmented mass transport within the reaction zone. This ensured sufficient reactant supply, effectively suppressing parasitic reactions and enhancing the electrochemical output of the aqueous AgO-Al system.
Correlations are especially useful for the design of the fluid channel structure. For each of the channel structures II, III, and IV, there was a correlation between the deflection angle of the flow channel and the pressure drop at the inlet and outlet within a given range (Figure 6). With the increase in the deflection angle, the pressure drops at the inlet and outlet increased rapidly. Studies have shown that these pressure drops have a strong correlation with the pump consumption generated by the conveying fluid. The larger the pressure drop, the larger the pump consumption and the lower the system efficiency, and vice versa [49]. Therefore, this finding was particularly useful for the design of the flow channel structure of the aqueous AgO-Al battery, and the optimal flow channel deflection angle could be quickly determined within a given range.
Figure 7a presents the velocity distribution of the reference channel structure (Ref) for a more thorough investigation of the flow fields of the Ref and IX channels (the location of each section is detailed in Supplementary Materials Figures S6 and S7). A large-area flow dead zone was generated on both sides of the inlet and outlet secondary branch channels and in the thickness direction for Z = 0.000125 m, 0.00025 m, and 0.000375 m. This observation was consistent with the results of the analysis in Section 3.1. For the planes at Y = 0.04 m, 0.065 m, and 0.09 m, it was not difficult to see that the near-wall fluid velocity remained at a lower level. This was due to the viscous force of the fluid itself, which caused the fluid near the wall to adhere to the solid in avoiding stagnation, and the velocity was almost 0. Further, the static fluid layer experienced friction towards its adjacent flowing fluid layer, causing the velocity of the adjacent fluid to slow down. This effect was transmitted to the entire fluid domain, thus forming the velocity distribution that is presented in Figure 7a. This velocity distribution was also reflected in the planes at X = 0.025 m, 0.05 m, and 0.075 m, so it was no longer repeated. At the intersections of the three X planes with the Z = 0.00025 m plane, the velocity contours of the three flow fields were clearly enlarged. There was almost no velocity gradient in the low-speed region, which was not favorable for the improvement of the speed in this region. Moreover, Figure 7b presents the velocity distribution in the IX channel structure. Compared with the Reference channel structure, the fluid flow velocity was faster and the distribution characteristics were better on the Z-axis sliced plane. In particular, the proportion of the flow dead-zone area was significantly reduced to almost 0. For the low-speed zone, there was an obvious velocity gradient in the velocity contour at the intersection of the X plane with the Z = 0.00025 m plane. This indicated that the fluid flow rate could be further improved, which was important for the elimination of the flow dead-zone area in the reaction zone.
Figure 7c presents the inlet and outlet pressure drop and dead-zone area. A comparison of channel structures I, II, III, and IV showed that the deflection angle of the flow channel, on both sides of the inlet and outlet, had almost no effect on the pressure drop at the inlet and outlet. However, it had a certain effect on the elimination of the flow dead-zone area. Further, a comparison of the V, VI, VII, VIII, IX, X, and Reference channel structures showed that the addition of a secondary branch channel at the inlet and outlet will have a certain impact on the pressure drop at the inlet and outlet. Regarding the reaction zone, the extent of the flow dead zone exhibited greater sensitivity. Specifically, its size decreased progressively with the addition of secondary branch channels at the inlet/outlet. Among the configurations evaluated, flow channel IX demonstrated the most effective reduction in stagnant regions within the reaction zone, achieving a minimal dead-zone area of 0.507% alongside inlet/outlet pressures of 1397.46 Pa.
Figure 7d presents the velocity distribution of channel structure IX at 0.017 mm (inlet side), which was used to more thoroughly analyze the velocity distribution of the optimized structure. Compared with the Reference channel structure presented in Section 3.1, the jet velocity of the secondary branch channel on the inlet side was significantly improved. The maximum jet velocity decreased by 45.4%, the minimum jet velocity increased by 720%, and the range of the velocity distribution on the characteristic line decreased by 51.97%. The reason for these findings is that the fluid in the Reference channel structure was strongly geometrically variable when flowing from the single inlet into the reaction zone, and from the fluid jets to the reaction zone through the secondary branch channel, which easily produced a flow dead zone. However, the addition of a secondary branch channel at the corresponding flow dead zone increased the jet flow path, improved the fluid mass transfer capacity of the original dead zone, and then increased the flow rate in this zone. However, incorporating secondary branch channels diminished the fluid momentum within the inlet branches, consequently lowering the inlet velocity. This dead-zone compensation strategy thus offers considerable utility in enhancing flow field uniformity for aqueous AgO-Al batteries.

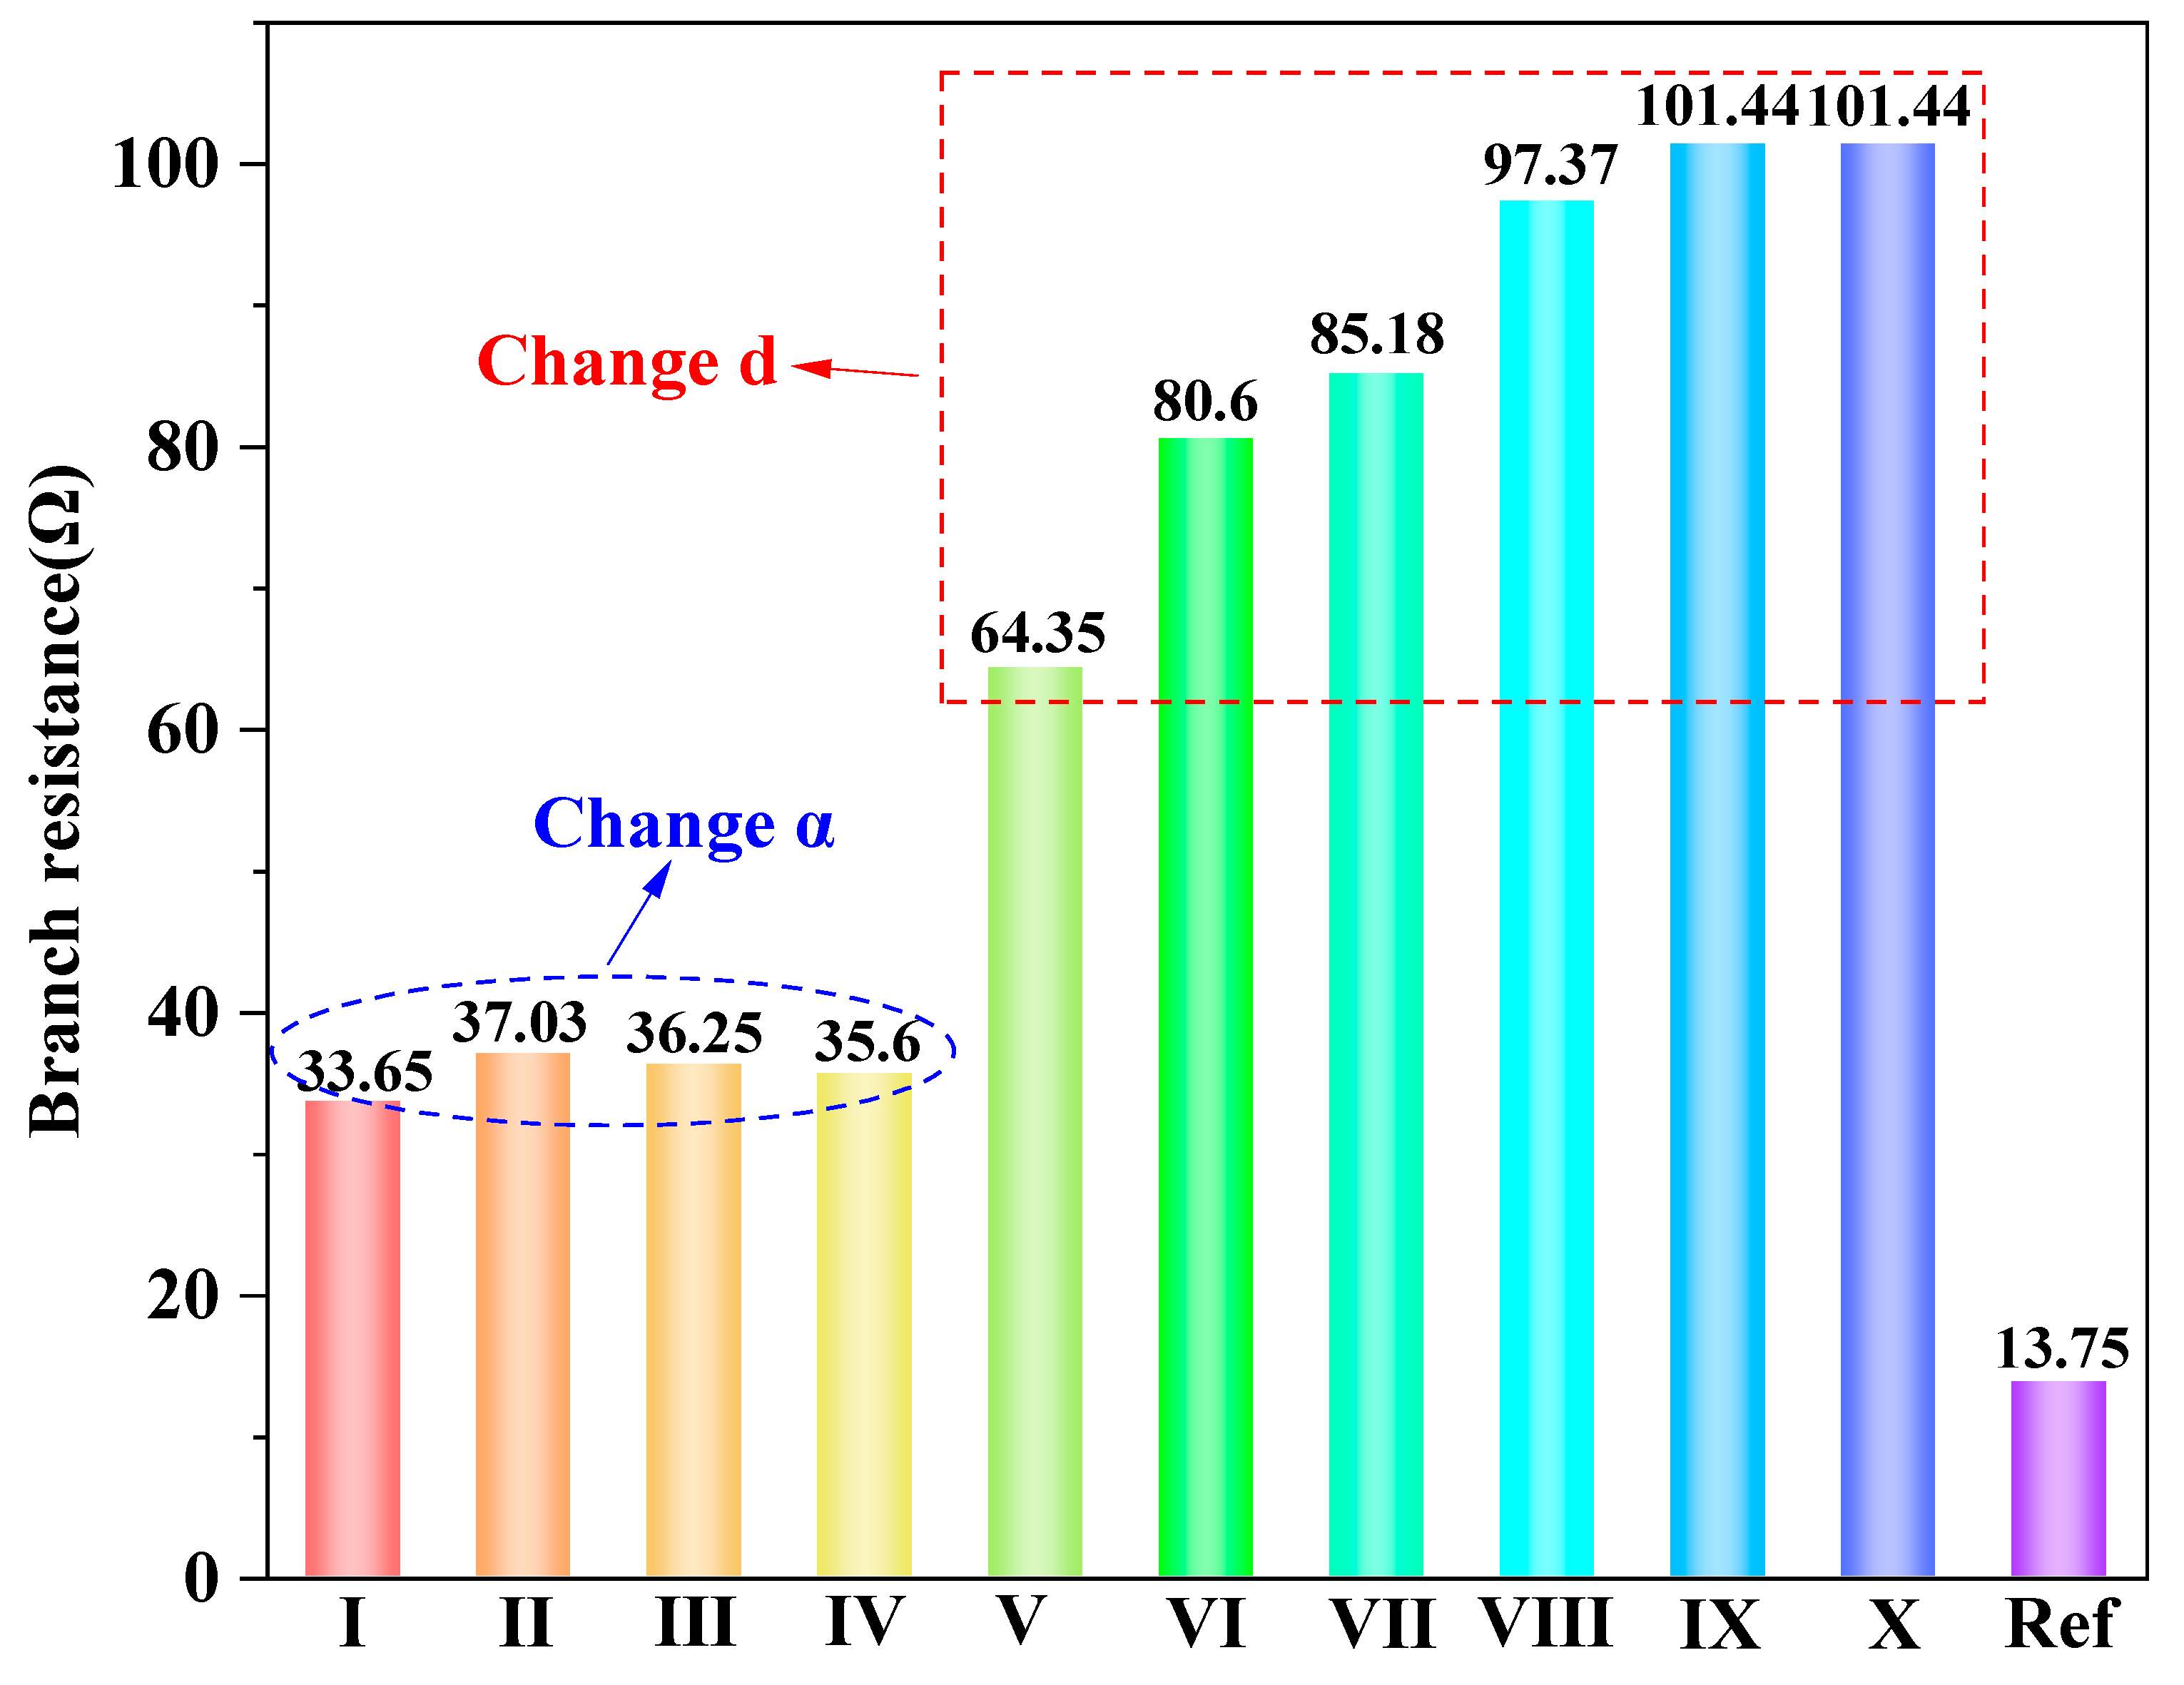
4.4. Branch Resistance Analyses

Figure 8 presents the branch resistance of different channel types. It can be clearly seen that the branch resistance of the Reference channel was the smallest (13.75 Ω), and the branch resistances of channels IX and X were the largest (both were 101.44 Ω). Compared with the traditional Reference channel, the branch resistance of each channel type after optimization was improved by varying degrees, and the maximum increase was up to 637.8%. From the perspective of the increase in branch resistance, the deflection angle α of the flow channel had a small effect on the branch resistance, but the width and number of the flow channels had a large effect on the branch resistance and showed a significant linear growth relationship. The reason was that the branch resistance of the flow channel was largely affected by its length, cross-sectional area, and material. Furthermore, the difference between the first four types of flow channels (I, II, III, and IV) was the deflection angles on both sides of the bipolar plate, which were 50°, 55°, and 60°, respectively. However, due to the limitation of the first-order branch channel and the edge of the reaction zone, it was obvious that the change in the deflection angle of the flow channel had a small effect on its length and cross-sectional area. This led to a small difference in the branch resistance of the first four types of flow channels (I, II, III, and IV). Further, this corresponded to the mathematical relationship (Equation (4)) of the parameters in the calculations of the branch resistance. Notably, the branch resistance of the latter six channels (V, VI, VII, VIII, IX, and X) increased linearly. However, there was a critical value, which appeared in channel IX. It could then be concluded that the branch resistance of the flow channel did not always increase linearly under the given conditions. In addition, there was a critical value for a certain state, which provides significant guidance for the design of a flow channel for an aqueous AgO-Al battery in the future.

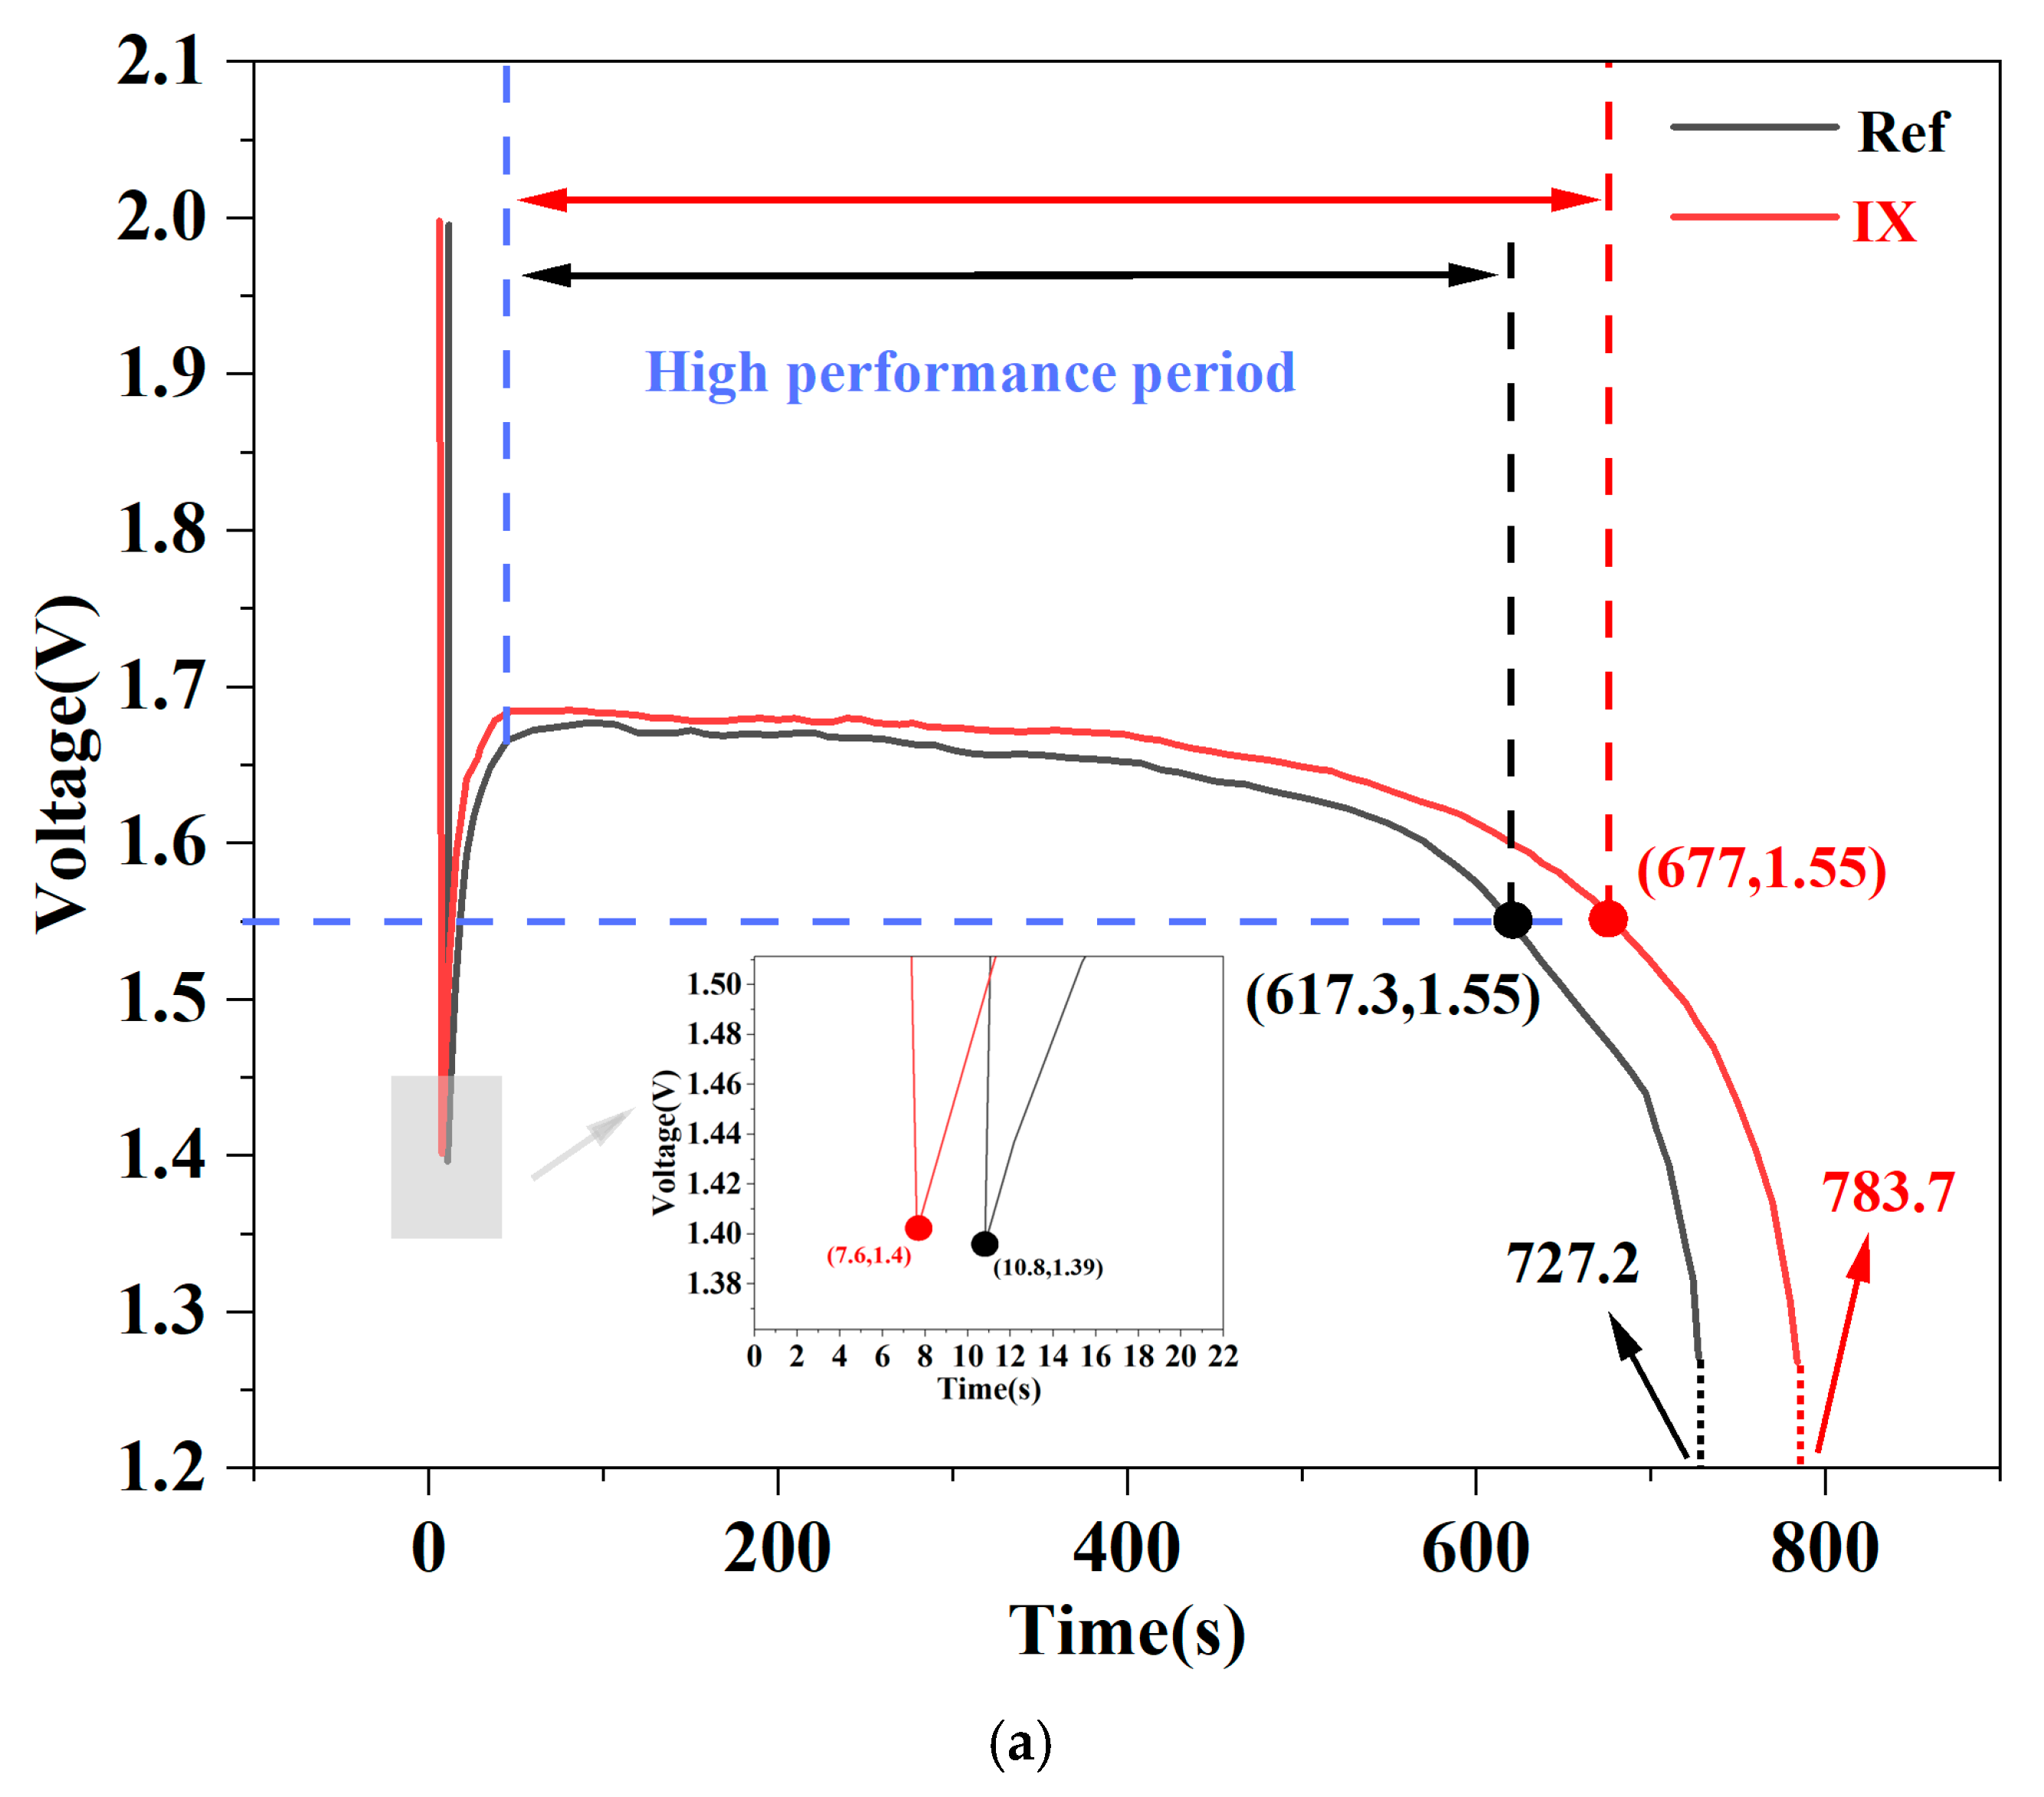
4.5. Performance of Aqueous AgO-Al Batteries with DZCD

According to the computational analysis, channel IX was a promising candidate for the dead-zone-compensated design. To fully confirm the effect of the novel flow field design, the two comparative channels (Ref and IX) were engraved onto the bipolar plate as aqueous AgO-Al battery flow fields. Subsequently, the battery cell was assembled, and the discharge performance was tested using the battery test system presented in Section 3.1. Figure 9 shows the discharge performance of the aqueous AgO-Al battery for the flow channels Ref and IX. The discharge voltage curves of the two flow channels were basically the same for a current density of 600 mA/cm2 (Figure 9a). Analysis revealed a superior discharge performance for channel IX during the high-current/peak operational phase. Compared with the Ref channel, the discharge time of channel IX was longer in the high-performance period (Ref: 617.3 s and IX: 677 s), and the discharge time was prolonged by 9.67%. Additionally, key performance metrics—activation latency, mean discharge voltage during the high-current phase, and discharge duration—were quantified for both flow channel configurations: Ref (10.8 s, 1.65 V, and 727.2 s, respectively) and IX (7.6 s, 1.66 V, and 783.7 s, respectively). Flow channel IX demonstrated significant performance enhancements: a 3.2 s reduction in activation latency, a 0.61% increase in mean discharge voltage, and a 7.77% extension in discharge duration. As can be seen in Figure 9b, the EU, EM, and WM values of the optimized flow channel IX were improved by varying degrees, and Wpump was lower. The EU, EM, and WM values for the two flow channels were as follows: Ref (26.6%, 184.52 Wh/kg, 1076.09 W/kg, and 0.504 W/cm2, respectively) and IX (29.2%, 203.59 Wh/kg, 1082.61 W/kg, and 0.28 W/cm2, respectively). Compared with the Reference flow channel, the EU, EM, and WM values of flow channel IX increased by 9.77%, 10.35%, and 0.61%, respectively, and Wpump decreased by 44.44%. Further, flow channel IX increased the EU by 29.2% at a current density of 600 mA/cm2. Compared with the work by Pan et al. [38], the EU was further improved. Moreover, the obtained specific capacity is 7.05% higher than the value of 381.3 mAh/g at a current density of 650 mA/cm2 as previously reported by He et al. [55]. In light of the discussions presented above, the proposed DZC design can be regarded as a general method for the flow field optimization of aqueous AgO-Al batteries.

5. Discussion

In this study, a dead-zone-compensated design for the optimization of the flow field topology in aqueous AgO-Al batteries has been proposed. In conventional flow field designs, parameters such as channel width and angle, specifically in four-channel straight configurations, were not previously optimized. To optimize flow field design and enhance battery discharge performance, the dead-zone-compensated design proposed in this work involves optimizing channel width and angle. Based on the Nernst–Planck equation, the present flow field design facilitates enhanced convection [56]. This augmented convective transport effectively counteracts concentration depletion, leading to significant improvements in power density and electrolyte utilization. Consequently, the proposed dead-zone-compensated flow field, with its systematically adjusted channel width and angle, represents an optimized configuration for aqueous AgO-Al batteries. All the key parameters corresponding to the flow channel structures involved in the text are described in detail in Supplementary Materials (Tables S1 and S2). Additionally, the battery typically comprises a stack consisting of 220 individual cells. In the present study, when the stack consisted of cells with optimized flow paths, the discharge capacity of the battery increased by 10.3% compared to conventional designs.

6. Conclusions

In this study, a flow field optimization strategy based on dead-zone compensation was proposed to enhance the mass transport characteristics of aqueous AgO-Al batteries. By identifying and mitigating regions of electrolyte stagnation through targeted structural adjustments—including modifications to channel width, number, and deflection angle—the proposed method successfully improved flow uniformity and reduced concentration polarization.
The effectiveness of the approach was validated through a combination of numerical simulations and experimental testing. The optimized flow field not only enhanced electrolyte utilization and discharge performance but also reduced hydraulic losses, demonstrating the feasibility of the design strategy for practical applications. Importantly, this method provides a generalizable framework for optimizing flow distribution in aqueous battery systems without relying on the absolute performance metrics of a specific conventional configuration.
Future work will focus on extending this design methodology to various operating conditions and structural configurations. Coupled with advanced material characterization techniques (e.g., SEM, EDS, and XRD), further investigations will aim to correlate flow field structure with electrochemical behavior, elucidating discharge mechanisms under different current densities and flow regimes.

Supplementary Materials

The following supporting information can be downloaded at: https://www.mdpi.com/article/10.3390/batteries11070237/s1, Figure S1. Computation mesh of geometric model; Figure S2. Mesh independence test; Figure S3. Electrolyte flow field visualization test system schematic diagram; Figure S4. Comparison between numerical and experimental results; Figure S5. Schematic diagram of the battery test system; Figure S6. X, Y, Z axis section location diagram (Reference channel structure); Figure S7. X, Y, Z axis section location diagram (IX channel structure); Table S1. Electrolyte flow field parameters and branch resistance; Table S2. Electrochemical parameters.

Author Contributions

Conceptualization, P.C.; methodology, P.C.; software, P.C.; validation, Q.Z.; formal analysis, Q.Z.; investigation, C.X.; resources, J.C.; data curation, X.W.; writing—original draft preparation, X.S.; writing—review and editing, L.H.; visualization, P.L.; supervision, W.X.; project administration, M.R. All authors have read and agreed to the published version of the manuscript.

Funding

This research received no external funding.

Data Availability Statement

The dataset is available on request from the authors.

Conflicts of Interest

The authors declare no conflict of interest.

Nomenclature

RRadius of inlet and outlet, mm
h1Depth of reaction area, mm
h2Depth of flow channel at inlet and outlet, mm
L1Side length of reaction area, mm
d1Primary branch channel width, mm
d2Secondary branch channel width, mm
S1Branch channel spacing, mm
S2Branch channel spacing on both sides of the inlet/outlet, mm
LLength of branch channel, mm
ΔPPressure drop, Pa
ADRDead-zone area ratio
ADDead-zone area, mm2
AtTotal reaction area, mm2
AARActive-zone area ratio
AAActive-zone area, mm2
MMass of battery, kg
WbatteryPower of battery, W
ΔPPressure drop, Pa
EMDry-mass-specific energy, Wh/kg
RBranch resistance, Ω
LmMaterial length, m
SMaterial cross-sectional area, m2
EUElectrolyte utilization
QdischargeAvailable discharge capacity, mAh·g−1
QtheoryTheoretical capacity of the electrode, 433 mAh·g−1
EdischargeDischarge energy, Wh
WMDry power density, W/kg
WpumpPump loss, mW·cm−2
qFlow rate, m3·s−1
Greek symbols
αDeflection angle of flow channel, °
ρElectrical resistivity, Ω·m
Subscripts
inInlet
outOutlet

References

  1. Jeong, H.; Ahn, S.H.; Jo, C.S. Effects of chelating agent on the nanostructure of nickel hexacyanoferrate and its performance in seawater battery application. Chem. Eng. J. 2023, 465, 142834. [Google Scholar] [CrossRef]
  2. Chen, J.L.; Sun, L.; Wang, K.; Zhang, Y.H. Research and applications of rechargeable seawater battery. J. Energy Storage 2024, 76, 109659. [Google Scholar] [CrossRef]
  3. Park, M.; Ryu, J.; Wang, W.; Cho, J. Material design and engineering of next-generation flow-battery technologies. Nat. Rev. Mater. 2017, 2, 16080. [Google Scholar] [CrossRef]
  4. Wang, Z.Y.; Ren, J.Y.; Sun, J.; Guo, Z.X.; Wei, L.; Fan, X.Z.; Zhao, T.S. Characterizations and selections of electrodes with optimal performance for large-scale vanadium redox flow batteries through lab-scale experiments. J. Power Sources 2022, 549, 232094. [Google Scholar] [CrossRef]
  5. Houser, J.; Pezeshki, A.; Clement, J.; Aaron, D.; Mench, M.M. Architecture for improved mass transport and system performance in redox flow batteries. J. Power Sources 2017, 351, 96–105. [Google Scholar] [CrossRef]
  6. Ren, J.Y.; Wei, L.; Wang, Z.Y.; Yue, Q.L.; Liu, B.; Jia, G.C.; Fan, X.Z.; Zhao, T.S. An electrochemical-thermal coupled model for aqueous redox flow batteries. Int. J. Heat Mass Transf. 2022, 192, 122926. [Google Scholar] [CrossRef]
  7. Yue, M.; Yan, J.W.; Zhang, H.M.; Zheng, Q.; Li, X.F. The crucial role of parallel and interdigitated flow channels in a trapezoid flow battery. J. Power Sources 2021, 312, 230497. [Google Scholar] [CrossRef]
  8. Gundlapalli, R.; Jayanti, S. Effective splitting of serpentine flow field for applications in large-scale flow batteries. J. Power Sources 2021, 487, 229409. [Google Scholar] [CrossRef]
  9. Satola, B. Review-Bipolar Plates for the Vanadium Redox Flow Battery. J. Electrochem. Soc. 2021, 168, 060503. [Google Scholar] [CrossRef]
  10. Esan, O.C.; Shi, X.Y.; Pan, Z.F.; Huo, X.Y.; An, L.; Zhao, T.S. Modeling and simulation of flow batteries. Adv. Energy Mater. 2020, 10, 2000758. [Google Scholar] [CrossRef]
  11. Ke, X.; Prahl, J.M.; Alexander, J.I.D.; Wainright, J.S.; Zawodzinski, T.A.; Savinell, R.F. Rechargeable redox flow batteries: Flow fields, stacks and design considerations. Chem. Soc. Rev. 2018, 23, 8721–8743. [Google Scholar] [CrossRef] [PubMed]
  12. Gundlapalli, R.; Bhattarai, A.; Ranjan, R.; Ghimire, P.C.; Yeo, X.M.; Zainudin, N.A.B.; Wai, N.; Mahlendorf, F.; Jasincuk, A.; Thorsten, H. Characterization and scale-up of serpentine and interdigitated flow fields for application in commercial vanadium redox flow batteries. J. Power Sources 2022, 542, 231812. [Google Scholar] [CrossRef]
  13. Messaggi, M.; Gambaro, C.; Casalegno, A.; Zago, M. Development of innovative flow fields in a vanadium redox flow battery: Design of channel obstructions with the aid of 3D computational fluid dynamic model and experimental validation through locally-resolved polarization curves. J. Power Sources 2022, 526, 231155. [Google Scholar] [CrossRef]
  14. Zhang, B.W.; Lei, Y.; Bai, B.F.; Zhao, T.S. A two-dimensional model for the design of flow fields in vanadium redox flow batteries. Int. J. Heat Mass Transf. 2019, 135, 460–469. [Google Scholar] [CrossRef]
  15. Eifert, L.; Jusys, Z.; Behm, R.J.; Zeis, R. Side reactions and stability of pre-treated carbon felt electrodes for vanadium redox flow batteries: A DEMS study. Carbon 2020, 158, 580–587. [Google Scholar] [CrossRef]
  16. Ye, Q.; Zhang, Y.J.; Cheng, P.; Shao, Z.G. Effects of wettability and flow direction on gas retention and flow resistance of water flowing through carbon felts with thermally induced gas evolutions. Int. J. Heat Mass Transf. 2020, 156, 119911. [Google Scholar] [CrossRef]
  17. Aaron, D.S.; Liu, Q.; Tang, Z.; Grim, G.M.; Papandrew, A.B.; Turhan, A.; Zawodzinski, T.A.; Mench, M.M. Dramatic performance gains in vanadium redox flow batteries through modified cell architecture. J. Power Sources 2012, 206, 450–453. [Google Scholar] [CrossRef]
  18. Kumar, S.; Jayanti, S. Effect of flow field on the performance of an all-vanadium redox flow battery. J. Power Sources 2016, 307, 782–787. [Google Scholar] [CrossRef]
  19. Zheng, Q.; Xing, F.; Li, X.F.; Ning, G.L.; Zhang, H.M. Flow field design and optimization based on the mass transport polarization regulation in a flow-through type vanadium flow battery. J. Power Sources 2016, 324, 402–411. [Google Scholar] [CrossRef]
  20. Chen, J.Q.; Wang, B.G.; Lv, H.V. Numerical simulation and experiment on the electrolyte flow distribution for all vanadium redox flow battery. Adv. Mater. Res. 2011, 236–238, 604–607. [Google Scholar]
  21. Lisboa, K.M.; Marschewski, J.; Ebejer, N.; Ruch, P.; Cotta, R.M.; Michel, B.; Poulikakos, D. Mass transport enhancement in redox flow batteries with corrugated fluidic networks. J. Power Sources 2017, 359, 322–331. [Google Scholar] [CrossRef]
  22. Guo, Z.X.; Sun, J.; Wang, Z.Y.; Fan, X.Z.; Zhao, T.S. Numerical modeling of interdigitated flow fields for scaled-up redox flow batteries. Int. J. Heat Mass Transf. 2023, 201, 123548. [Google Scholar] [CrossRef]
  23. Sun, J.; Zheng, M.L.; Yang, Z.S.; Yu, Z.T. Flow field design pathways from lab-scale toward large-scale flow batteries. Energy 2019, 173, 637–646. [Google Scholar] [CrossRef]
  24. Sun, J.; Liu, B.C.; Zheng, M.L.; Luo, Y.S.; Yu, Z.T. Serpentine flow field with changing rib width for enhancing electrolyte penetration uniformity in redox flow batteries. J. Energy Storage 2022, 49, 104135. [Google Scholar] [CrossRef]
  25. Sun, J.; Zheng, M.L.; Luo, Y.S.; Yu, Z.T. Three-dimensional detached serpentine flow field design for redox flow batteries. J. Power Sources 2019, 428, 136–145. [Google Scholar] [CrossRef]
  26. Wang, Q.; Qu, Z.G.; Jiang, Z.Y.; Yang, W.W. Numerical study on vanadium redox flow battery performance with non-uniformly compressed electrode and serpentine flow field. Appl. Energy 2018, 220, 106–116. [Google Scholar] [CrossRef]
  27. Clement, J.T.; Zawodzinski, T.A.; Mench, M.M. Measurement of localized current distribution in a vanadium redox flow battery. ECS Trans. 2014, 58, 9–16. [Google Scholar] [CrossRef]
  28. Ertugrul, T.Y.; Clement, J.T.; Gandomi, Y.A.; Aaron, D.S.; Mench, M.M. In-situ current distribution and mass transport analysis via strip cell architecture for a vanadium redox flow battery. J. Power Sources 2019, 437, 226920. [Google Scholar] [CrossRef]
  29. Xu, Q.; Zhao, T.S.; Leung, P.K. Numerical investigations of flow field designs for vanadium redox flow batteries. Appl. Energy 2013, 105, 47–56. [Google Scholar] [CrossRef]
  30. Messaggi, M.; Canzi, P.; Mereu, R.; Baricci, A.; Inzoli, F.; Casalegno, A.; Zago, M. Analysis of flow field design on vanadium redox flow battery performance: Development of 3D computational fluid dynamic model and experimental validation. Appl. Energy 2018, 228, 1057–1070. [Google Scholar] [CrossRef]
  31. Xu, Q.; Zhao, T.S.; Zhang, C. Performance of a vanadium redox flow battery with and without flow fields. Electrochim. Acta 2014, 142, 61–67. [Google Scholar] [CrossRef]
  32. Ishitobi, H.; Saito, J.; Sugawara, S.; Oba, K.; Nakagawa, N. Visualized cell characteristics by a two-dimensional model of vanadium redox flow battery with interdigitated channel and thin active electrode. Electrochim. Acta 2019, 313, 513–522. [Google Scholar] [CrossRef]
  33. Lu, M.Y.; Deng, Y.M.; Yang, W.W.; Ye, M.; Jiao, Y.H.; Xu, Q. A novel rotary serpentine flow field with improved electrolyte penetration and species distribution for vanadium redox flow battery. Electrochim. Acta 2020, 361, 137089. [Google Scholar] [CrossRef]
  34. Liu, X.; Zhang, P.F.; Yang, J.L.; Li, J.; Chu, F.M. Effect of variable cross-section electrode on the battery performance of all-vanadium redox flow battery. Int. J. Heat Mass Transf. 2023, 215, 124382. [Google Scholar] [CrossRef]
  35. Zeng, Y.K.; Li, F.H.; Lu, F.; Zhou, X.L.; Yuan, Y.P.; Cao, X.L.; Xiang, B. A hierarchical interdigitated flow field design for scale-up of high performance redox flow batteries. Appl. Energy 2019, 238, 435–441. [Google Scholar] [CrossRef]
  36. Pan, L.M.; Xie, J.Y.; Guo, J.C.; Wei, D.B.; Qi, H.H.; Rao, H.Y.; Leung, R.; Zeng, L.; Zhao, T.S.; Wei, L. In-plane gradient design of flow fields enables enhanced convections for redox flow batteries. Energy Adv. 2023, 2, 1973–2152. [Google Scholar] [CrossRef]
  37. Pan, L.M.; Sun, J.; Qi, H.H.; Han, M.S.; Dai, Q.X.; Xu, J.H.; Yao, S.X.; Li, Q.L.; Wei, L.; Zhao, T.S. Dead-zone-compensated design as general method of flow field optimization for redox flow batteries. Proc. Natl. Acad. Sci. USA 2023, 120, e2305572120. [Google Scholar] [CrossRef]
  38. Pan, L.M.; Sun, J.; Qi, H.H.; Han, M.S.; Chen, L.P.; Xu, J.H.; Wei, L.; Zhao, T.S. Along-flow-path gradient flow field enabling uniform distributions of reactants for redox flow batteries. J. Power Sources 2023, 570, 233012. [Google Scholar] [CrossRef]
  39. Su, R.H.; Wang, Z.M.; Cai, Y.H.; Ying, J.H.; Li, H.J.; Zhao, T.S.; Jiang, H.R. Scaling up flow fields from lab-scale to stack-scale for redox flow batteries. Chem. Eng. J. 2024, 486, 149946. [Google Scholar] [CrossRef]
  40. Sun, Y.; Lin, Y.X.; Wang, Q.L.; Yang, C.; Yin, W.; Wan, Z.M.; Qiu, T. Novel design and numerical investigation of a windward bend flow field for proton exchange membrane fuel cell. Energy 2024, 290, 130142. [Google Scholar] [CrossRef]
  41. Zhang, S.Y.; Lin, S.; Xu, H.T.; Liu, G.J.; Wang, K. Performance of proton exchange membrane fuel cells with honeycomb-like flow channel design. Energy 2022, 239, 122102. [Google Scholar] [CrossRef]
  42. Chen, P.Q.; Zheng, Q. Investigation on flow field optimization of seawater activated battery based on flow channel structure design. J. Energy Storage 2024, 84, 110798. [Google Scholar] [CrossRef]
  43. Chen, W.S.; Xiang, Q.J.; Li, Y.J.; Liu, Z.Q. On the mechanisms of pressure drop and viscous losses in hydrofoil tip-clearance flows. Energy 2023, 269, 126712. [Google Scholar] [CrossRef]
  44. Chen, P.Q.; Xiong, C.H.; Zheng, Q.; Ruan, M.; Xu, W.L. Numerical simulation and experimental investigation on the optimization of flow-guided structures for high-performance aqueous AgO-Al batteries. Int. J. Heat Mass Transf. 2024, 235, 126167. [Google Scholar] [CrossRef]
  45. Zhao, W.K.; Wang, L.J.; Zhang, Y.N.; Cao, X.Y.; Wang, W.; Liu, Y.; Li, B.X. Snow melting on a road unit as affected by thermal fluids in different embedded pipes. Sustain. Energy Technol. Assess. 2021, 46, 101221. [Google Scholar] [CrossRef]
  46. Zhao, W.K.; Zhang, Y.N.; Cao, X.Y.; Wang, L.J.; Li, B.X. Applied thermal process for a hydronic snow-melting system in the coldest provincial capital of China. Appl. Therm. Eng. 2023, 218, 119421. [Google Scholar] [CrossRef]
  47. He, X.H.; Li, Z.; Wang, Y.K.; Xu, W.L.; Zhang, Q.; Wang, X.Y.; Liu, H.; Yang, G.Z.; Zhang, H.T.; Song, J.M.; et al. A high-purity AgO cathode active material for high-performance aqueous AgO-Al batteries. J. Power Sources 2022, 551, 232151. [Google Scholar] [CrossRef]
  48. Guo, Z.X.; Ren, J.Y.; Sun, J.; Wang, Z.Y.; Wei, L.; Liu, B.; He, C.X.; Fan, X.Z.; Zhao, T.S. A split convection-enhanced flow field for stack-scale redox flow batteries . Chem. Eng. J. 2025, 511, 1161937. [Google Scholar] [CrossRef]
  49. Wan, S.B.; Jiang, H.R.; Guo, Z.X.; He, C.X.; Liang, X.W.; Djilali, N.; Zhao, T.S. Machine learning-assisted design of flow fields for redox flow batteries. Energy Environ. Sci. 2022, 7, 2874–2888. [Google Scholar] [CrossRef]
  50. Schweiss, R.; Pritzl, A.; Meiser, C. Parasitic hydrogen evolution at different carbon fiber electrodes in vanadium redox flow batteries. J. Electrochem. Soc. 2016, 163, A2089–A2094. [Google Scholar] [CrossRef]
  51. Shah, A.A.; Al-Fetlawi, H.; Walsh, F.C. Dynamic modelling of hydrogen evolution effects in the all vanadium redox flow battery. Electrochim. Acta 2010, 55, 1125–1139. [Google Scholar] [CrossRef]
  52. Al-Fetlawi, H.; Shah, A.A.; Walsh, F.C. Modelling the effects of oxygen evolution in the all-vanadium redox flow battery. Electrochim. Acta 2010, 55, 3192–3205. [Google Scholar] [CrossRef]
  53. Eifert, L.; Bevilacqua, N.; Köble, K.; Fahy, K.; Xiao, L.S.; Li, M.; Duan, K.J.; Bazylak, A.; Sui, P.C.; Zeis, R. Synchrotron X-ray radiography and tomography of vanadium redox flow batteries-cell design, electrolyte flow geometry, and gas bubble formation. Chem. Sustain. Energy Mater. (ChemSusChem) 2020, 13, 3154–3165. [Google Scholar] [CrossRef] [PubMed]
  54. Köble, K.; Eifert, L.; Bevilacqua, N.; Fahy, K.F.; Bazylak, A.; Zeis, R. Synchrotron X-ray radiography of vanadium redox flow batteriesTime and spatial resolved electrolyte flow in porous carbon electrodes. J. Power Sources 2021, 492, 229660. [Google Scholar] [CrossRef]
  55. He, X.H.; Wang, X.Y.; Zhang, Q.; Wang, Y.K.; Song, J.M.; Li, Z.; Li, H.X.; Wang, S.G.; Yu, K. In-situ synthesis AgO/AgNPs composite as binder-free cathode for high-performance aqueous AgO-Al batteries. J. Energy Storage 2024, 101, 113960. [Google Scholar] [CrossRef]
  56. Huang, Z.B.; Mu, A.L.; Wu, L.X.; Wang, H. Vanadium redox flow batteries: Flow field design and flow rate optimization. J. Energy Storage 2022, 45, 103526. [Google Scholar] [CrossRef]
Figure 1. Framework of dead-zone-compensated design of flow field for aqueous AgO-Al battery.
Batteries 11 00237 g001
Figure 2. Structural diagram of the aqueous AgO-Al battery. (a) Fully assembled battery unit. (b) Exploded view of the internal components of (a), including end plates, anode, copper grid, cathode, and frame. (c) Flow channel plan diagram. (d) Flow path diagram.
Batteries 11 00237 g002
Figure 3. Original flow field simulation results (the dashed area of the ellipse is the dead zone of electrolyte flow).
Batteries 11 00237 g003
Figure 4. Geometric evolution of flow field designs (Models I–X) highlighting structural modifications for dead-zone compensation (black regions represent the original channels; red regions indicate newly introduced or modified channels across models. Arrows indicate the direction of design iteration).
Batteries 11 00237 g004
Figure 5. Velocity contours with velocity distributions above 0.055 m/s for different fluid channel types: (a) channel structures I–VI; (b) channel structures VII–X.
Batteries 11 00237 g005
Figure 6. The correlation between the pressure drop (ΔP) and the channel deflection angle (α).
Batteries 11 00237 g006
Figure 7. A comparison of the electrolyte flow characteristics between the Reference channel structure and channel structure IX. (a) Velocity distributions for the Reference channel structure. (b) Velocity distributions for channel structure IX. (c) The inlet and outlet pressure drop and dead-zone area. (d) The velocity distribution of channel structure IX at 0.017 mm (inlet side, The position circled by the red dotted line is the peak flow velocity area).
Batteries 11 00237 g007aBatteries 11 00237 g007bBatteries 11 00237 g007c
Figure 8. The branch resistance of different fluid channel types. (I–IV indicate that the deflection angle of the flow channel is changed, and V–X indicate that the width of the flow channel is changed.).
Batteries 11 00237 g008
Figure 9. A comparison of the aqueous AgO-Al battery performances for the Reference channel and channel IX. (a) Galvanostatic discharge curves at the discharge current density of 600 mA/cm2. (b) A comparison of the discharge-specific energies.
Batteries 11 00237 g009aBatteries 11 00237 g009b
Disclaimer/Publisher’s Note: The statements, opinions and data contained in all publications are solely those of the individual author(s) and contributor(s) and not of MDPI and/or the editor(s). MDPI and/or the editor(s) disclaim responsibility for any injury to people or property resulting from any ideas, methods, instructions or products referred to in the content.

