DoE Analysis
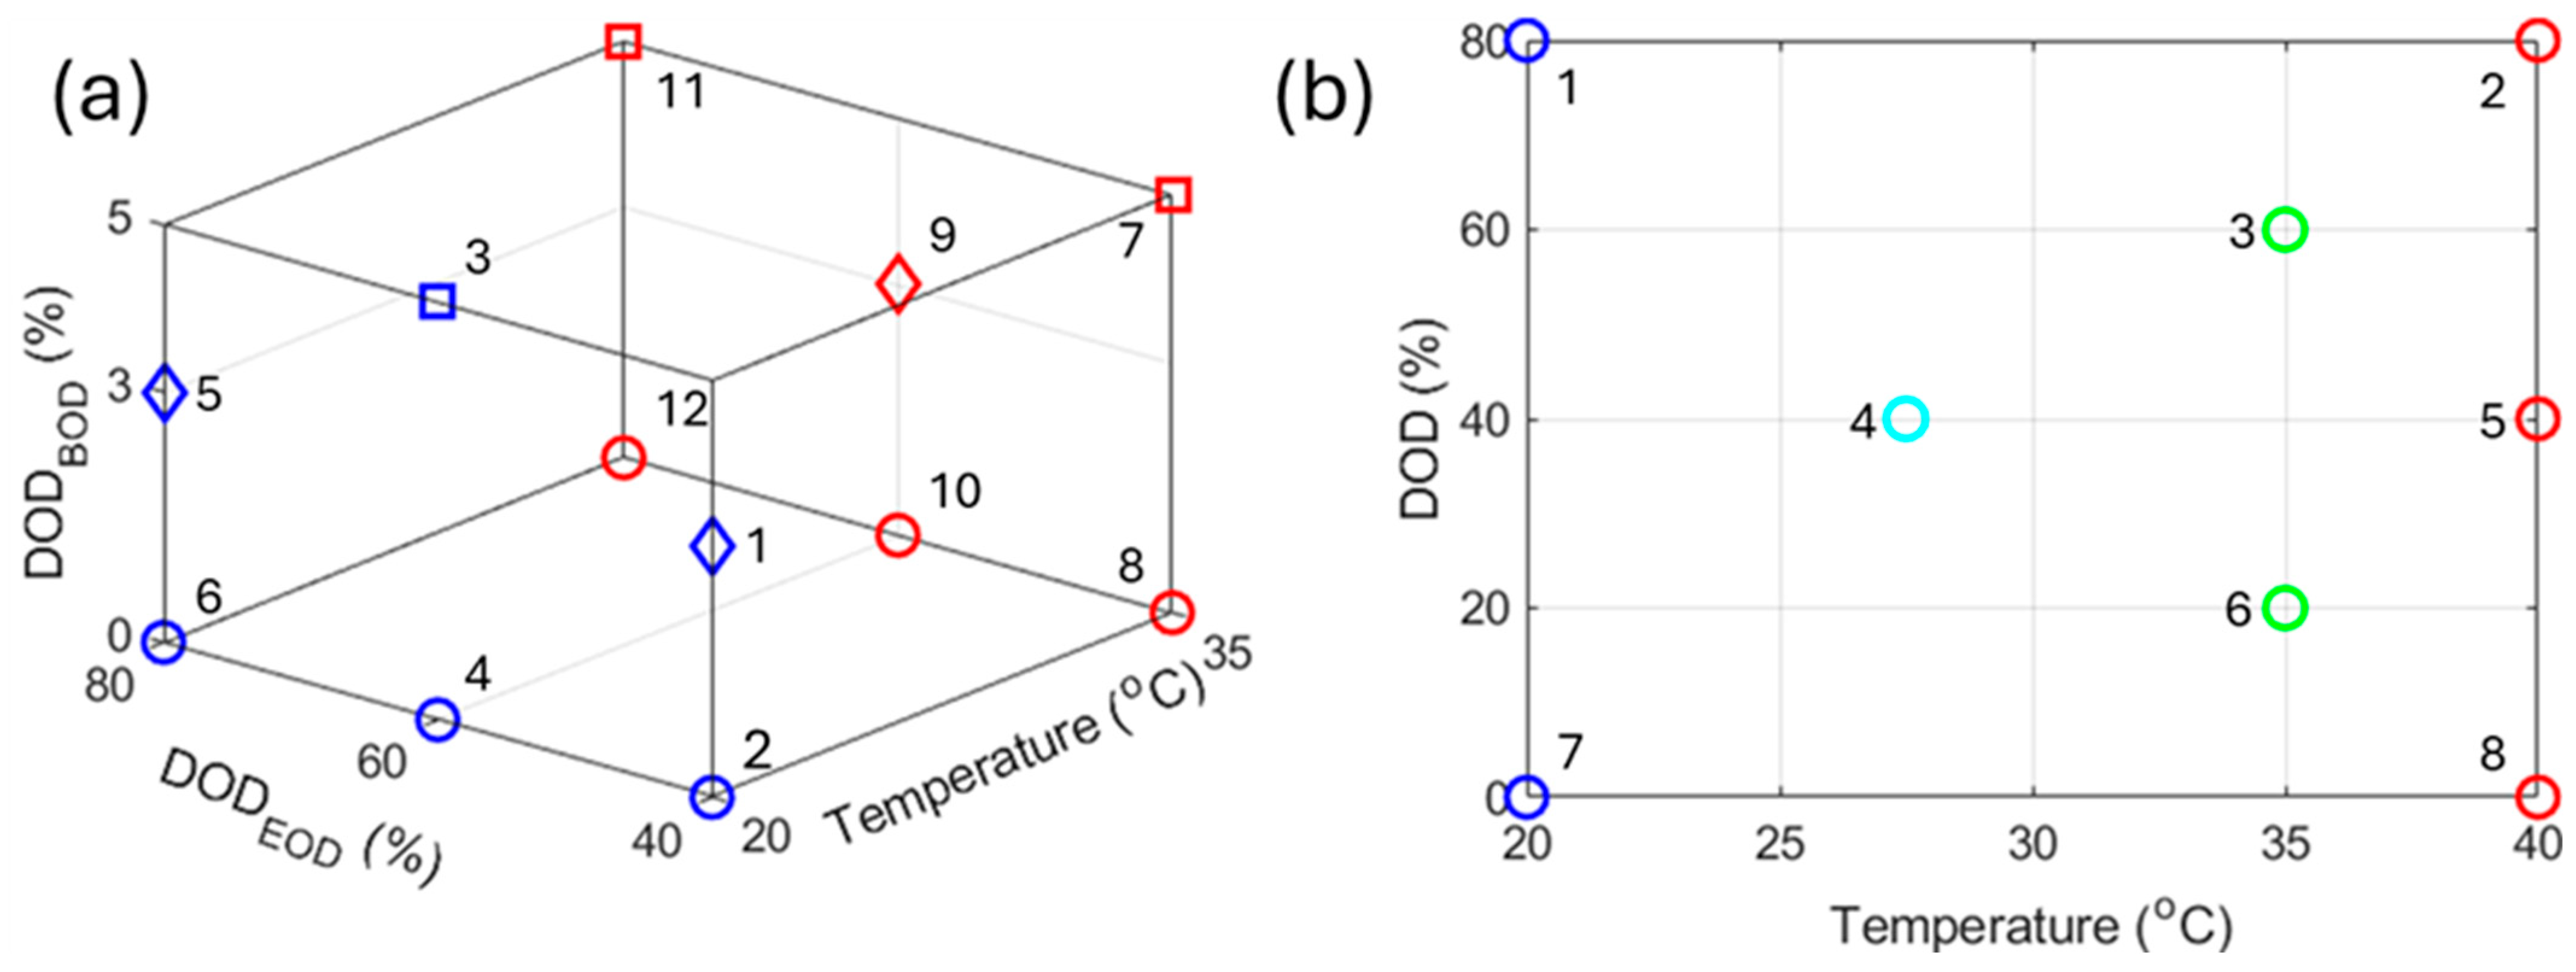
Because of the number of experiments, it is difficult to visualize the impact of the different DoE factors (temperature, DOD
EOD, and DOD
BOD) on the different responses in
Figure 4. The impact is better visualized by using the 3D representation presented in
Figure 1a.
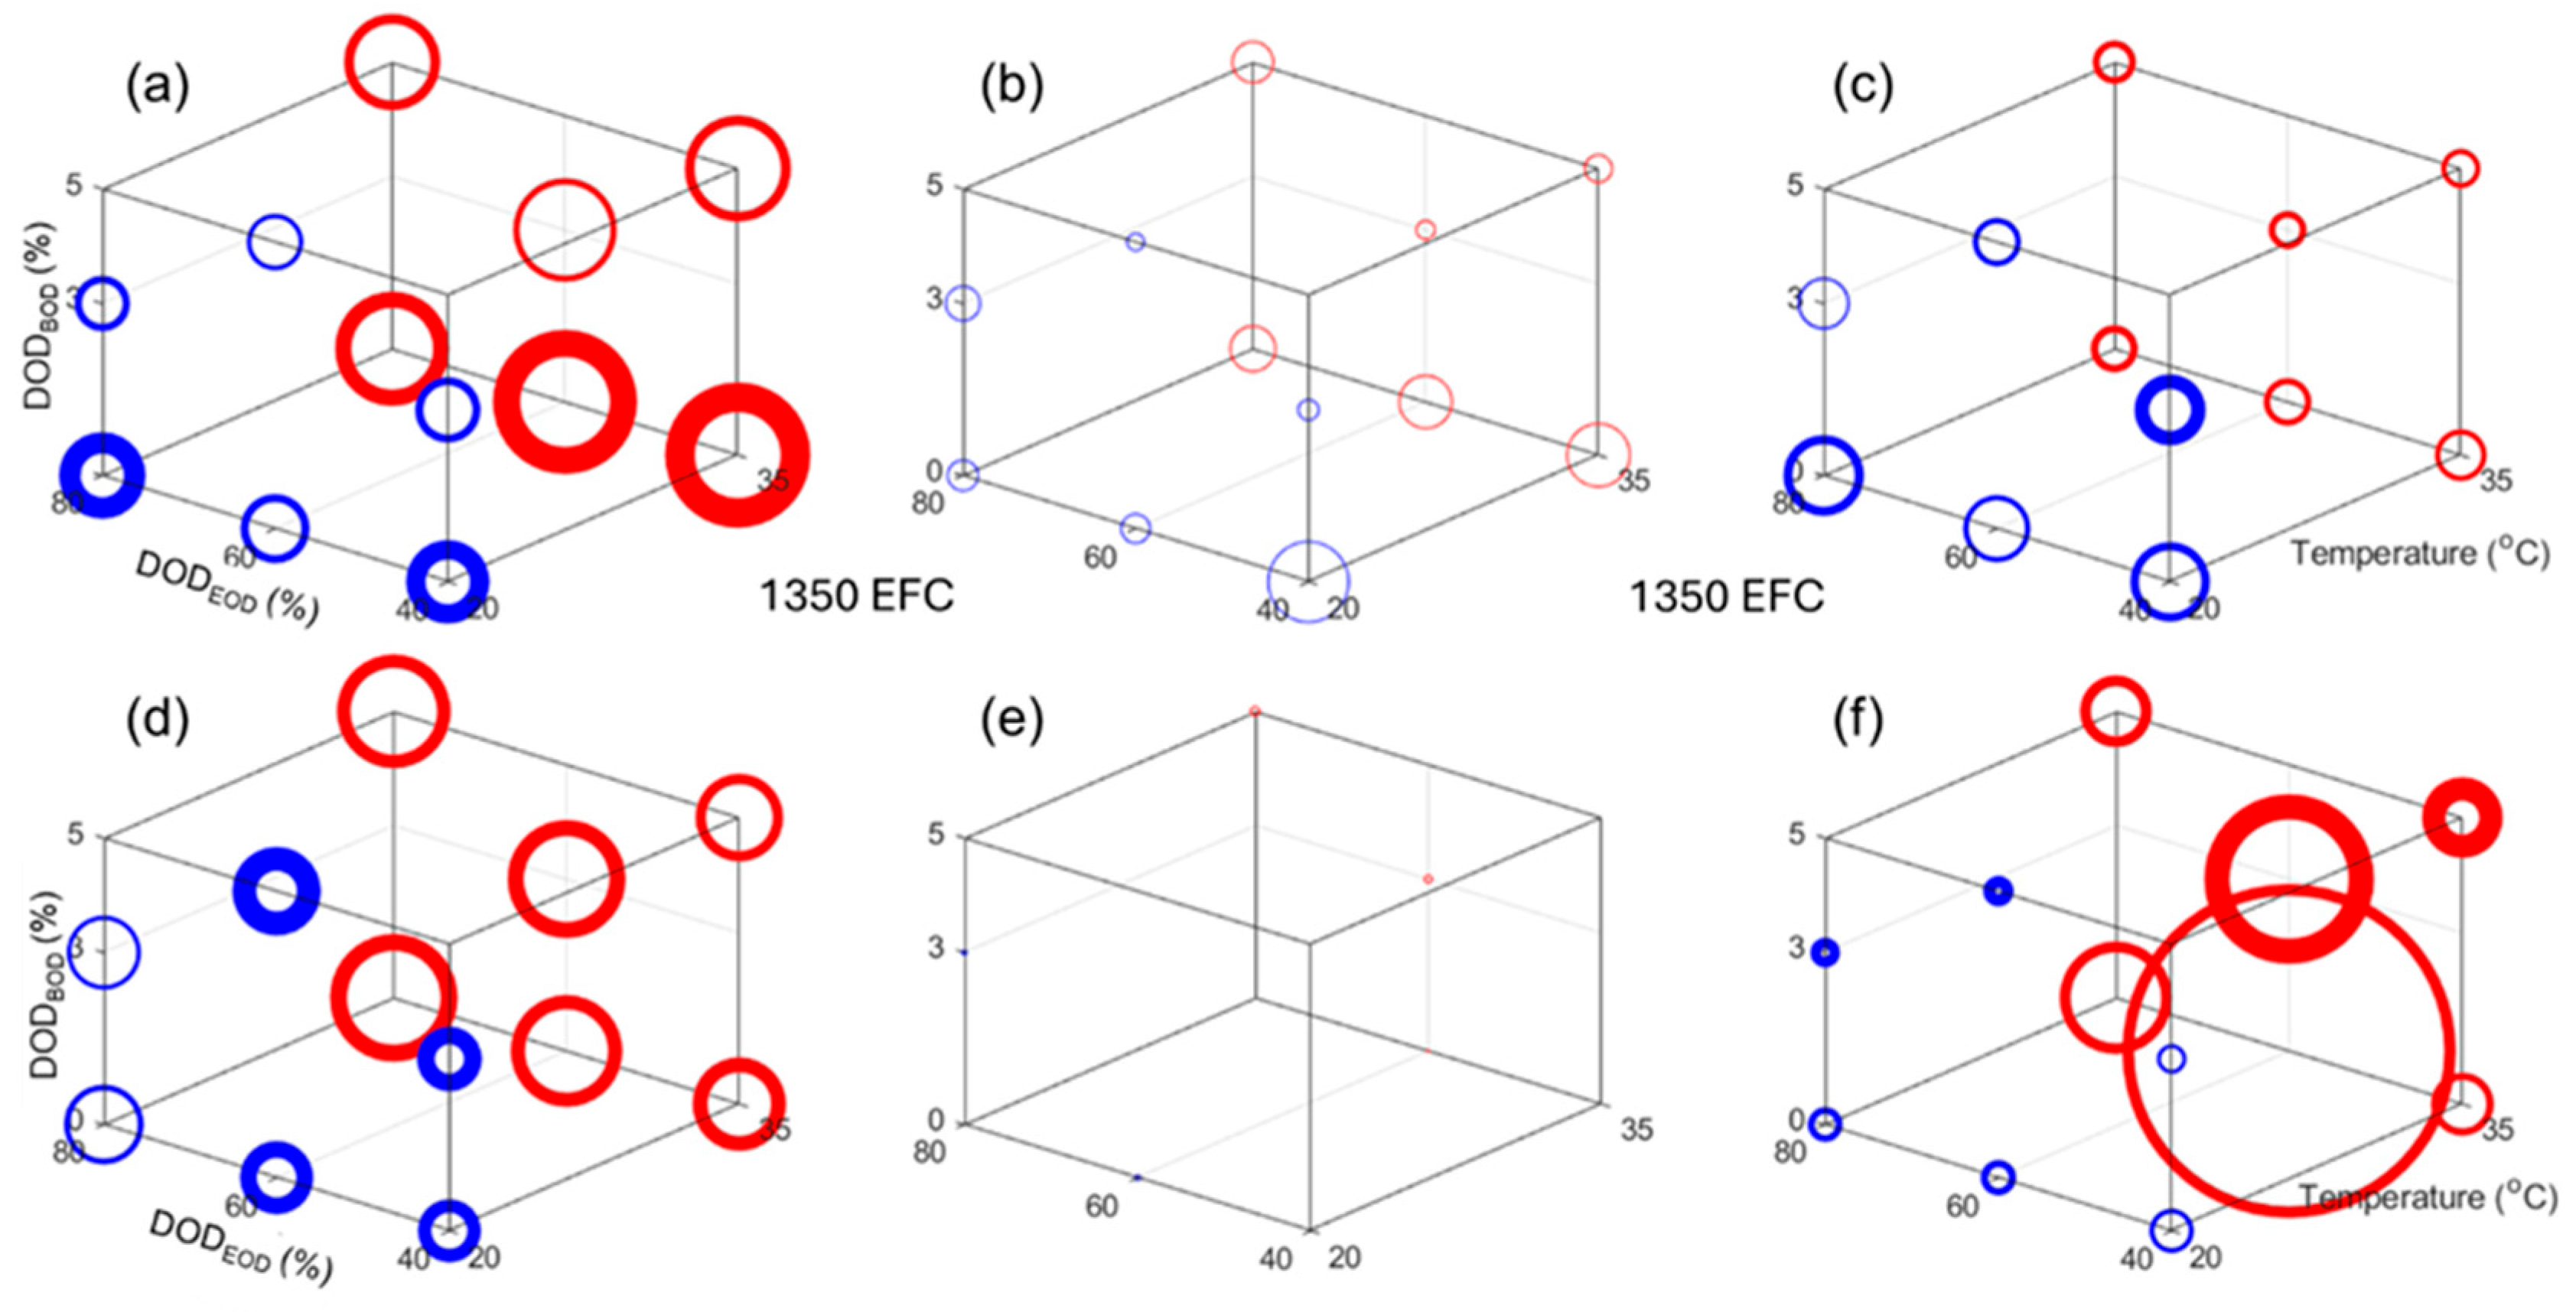
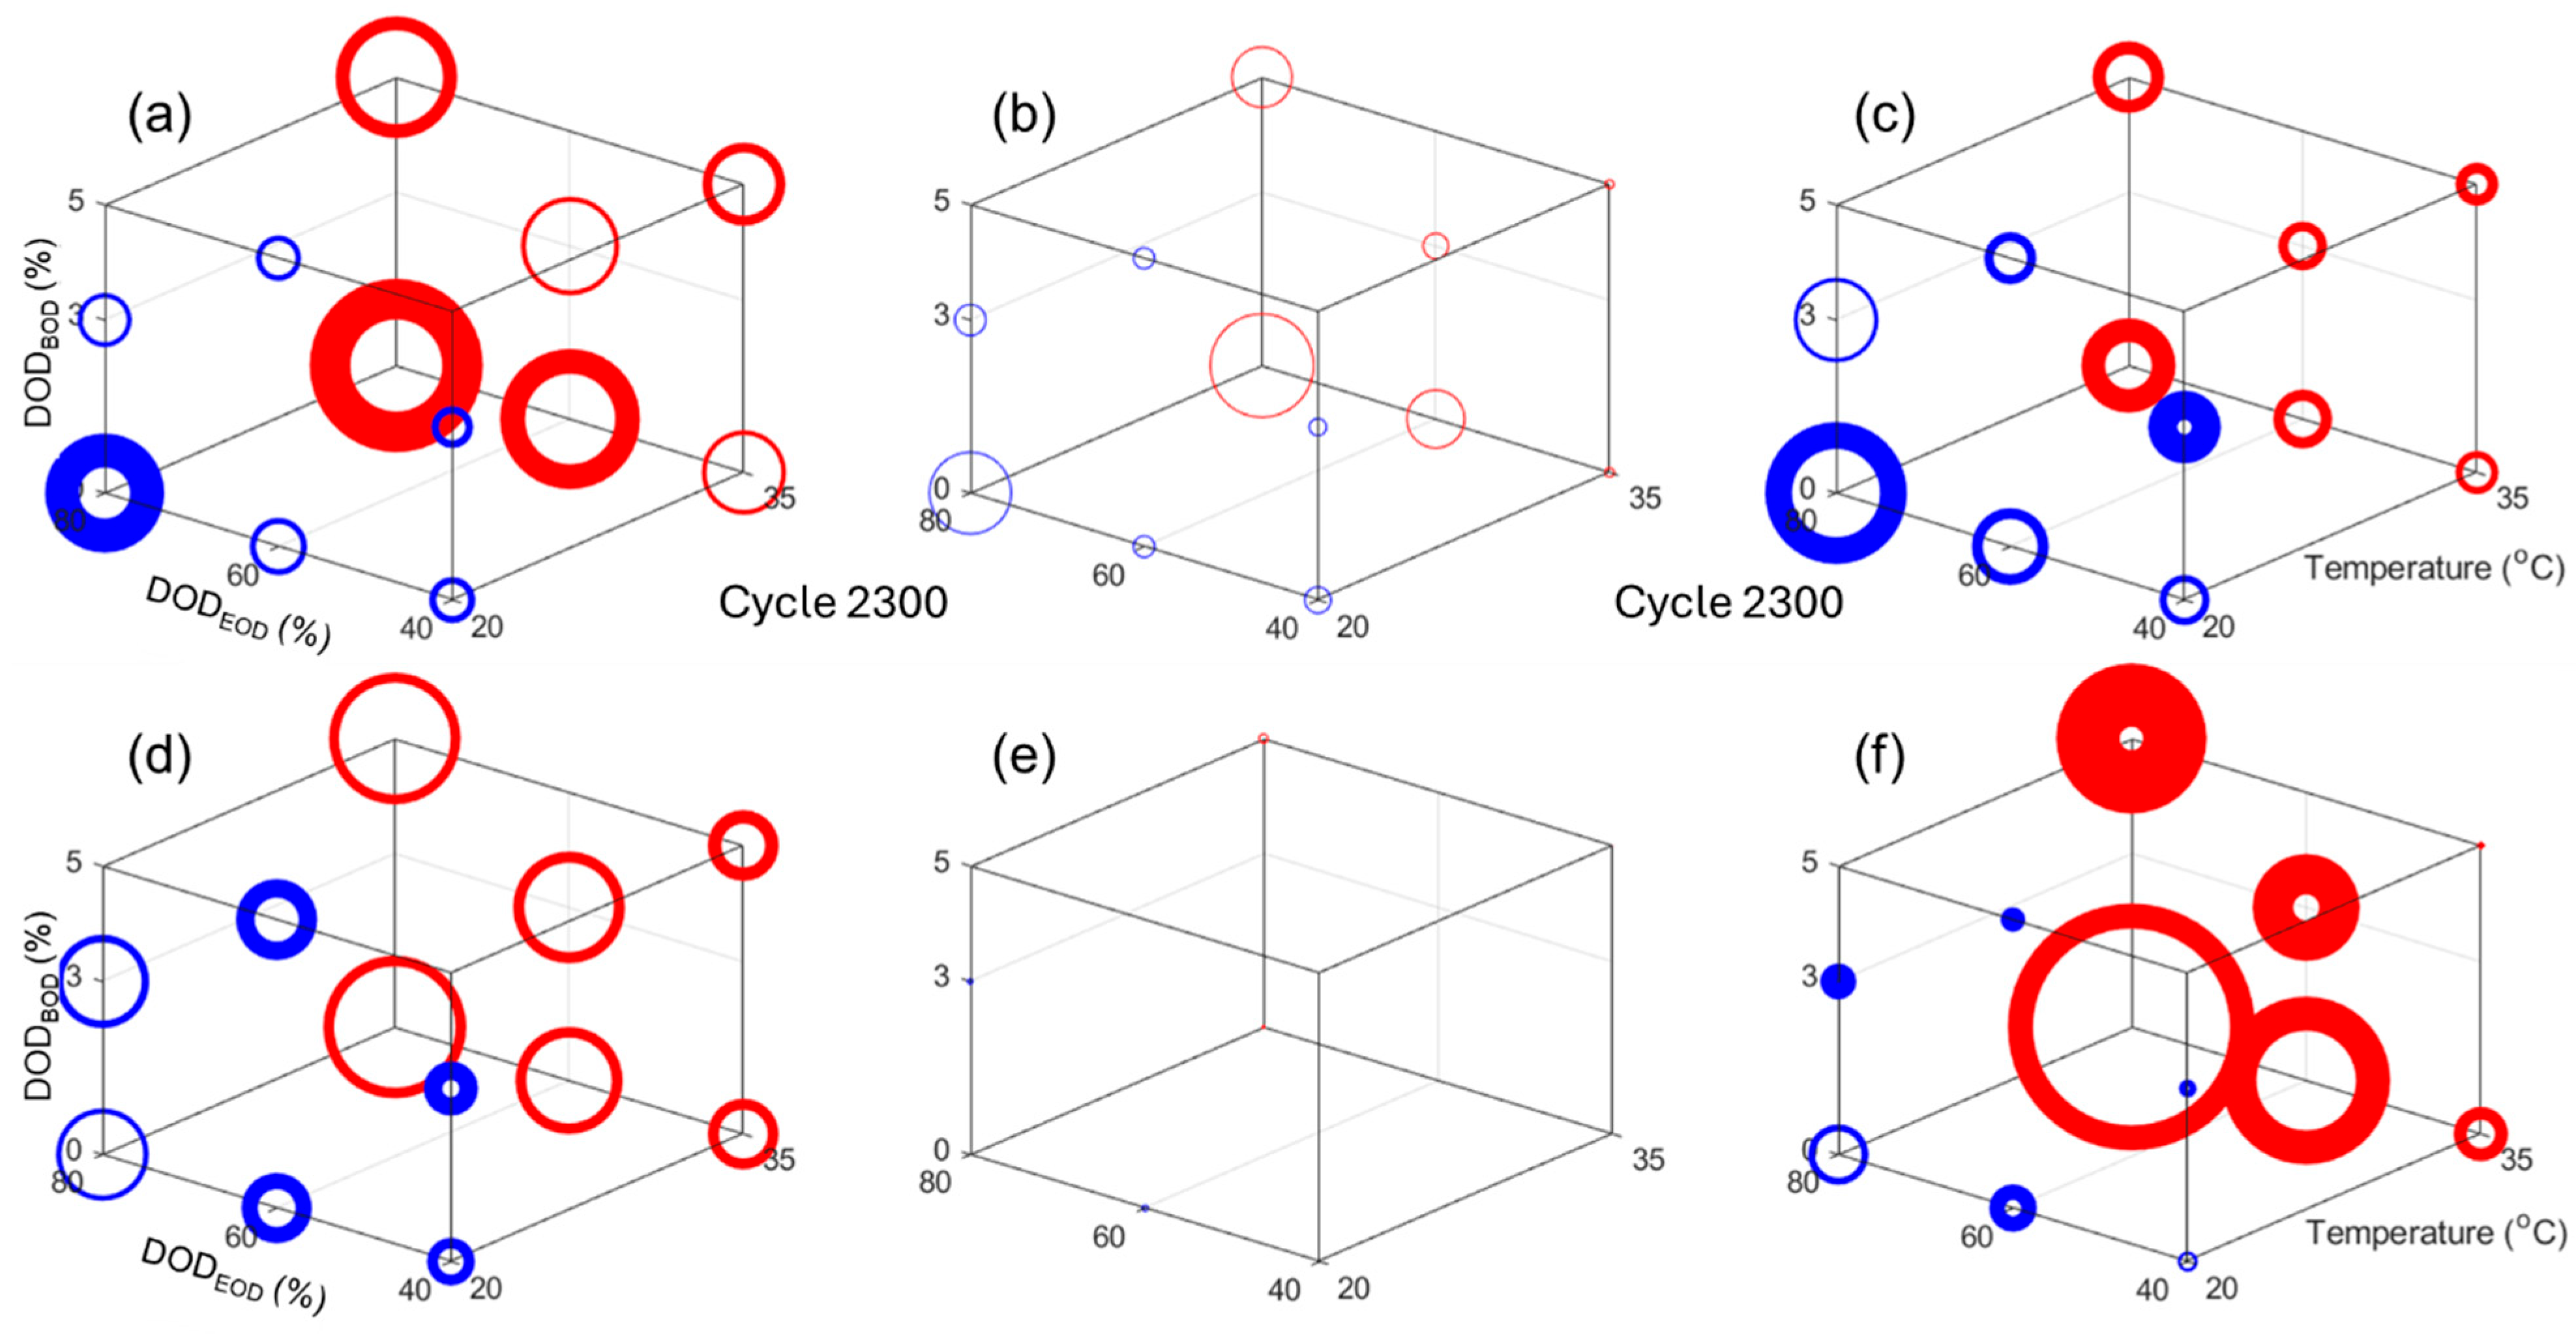
Figure 8 presents the impact of the design factors on (a, d) the capacity loss, (b, e) the rate capability deviation from 100%, and (c, f) the normalized resistance increased for cycle 2300, which is the highest common cycle between all the experiments for the NMC and LFP cells, respectively. In
Figure 8, the circle size is proportional to the changes and the line width is proportional to the deviation within the replicates. The scale was also kept consistent between chemistries. Looking at the capacity loss,
Figure 8a,d, there is a clear direct impact of temperature, a direct impact of the DOD
EOD, and the smallest impact seemed to be DOD
BOD, which is inverted (more loss for lower DODs
BOD). All impacts seemed slightly larger for the NMC cells, but overall they seem close. For the rate capabilities,
Figure 8b,e, there was no change for the LFP cells, but for the NMC ones, the impacts seemed similar to the one observed on capacity losses. For the normalized resistances,
Figure 8c,f, the impact order also seemed to be the same, but this time temperature affected the LFP cells much more than the NMC ones.
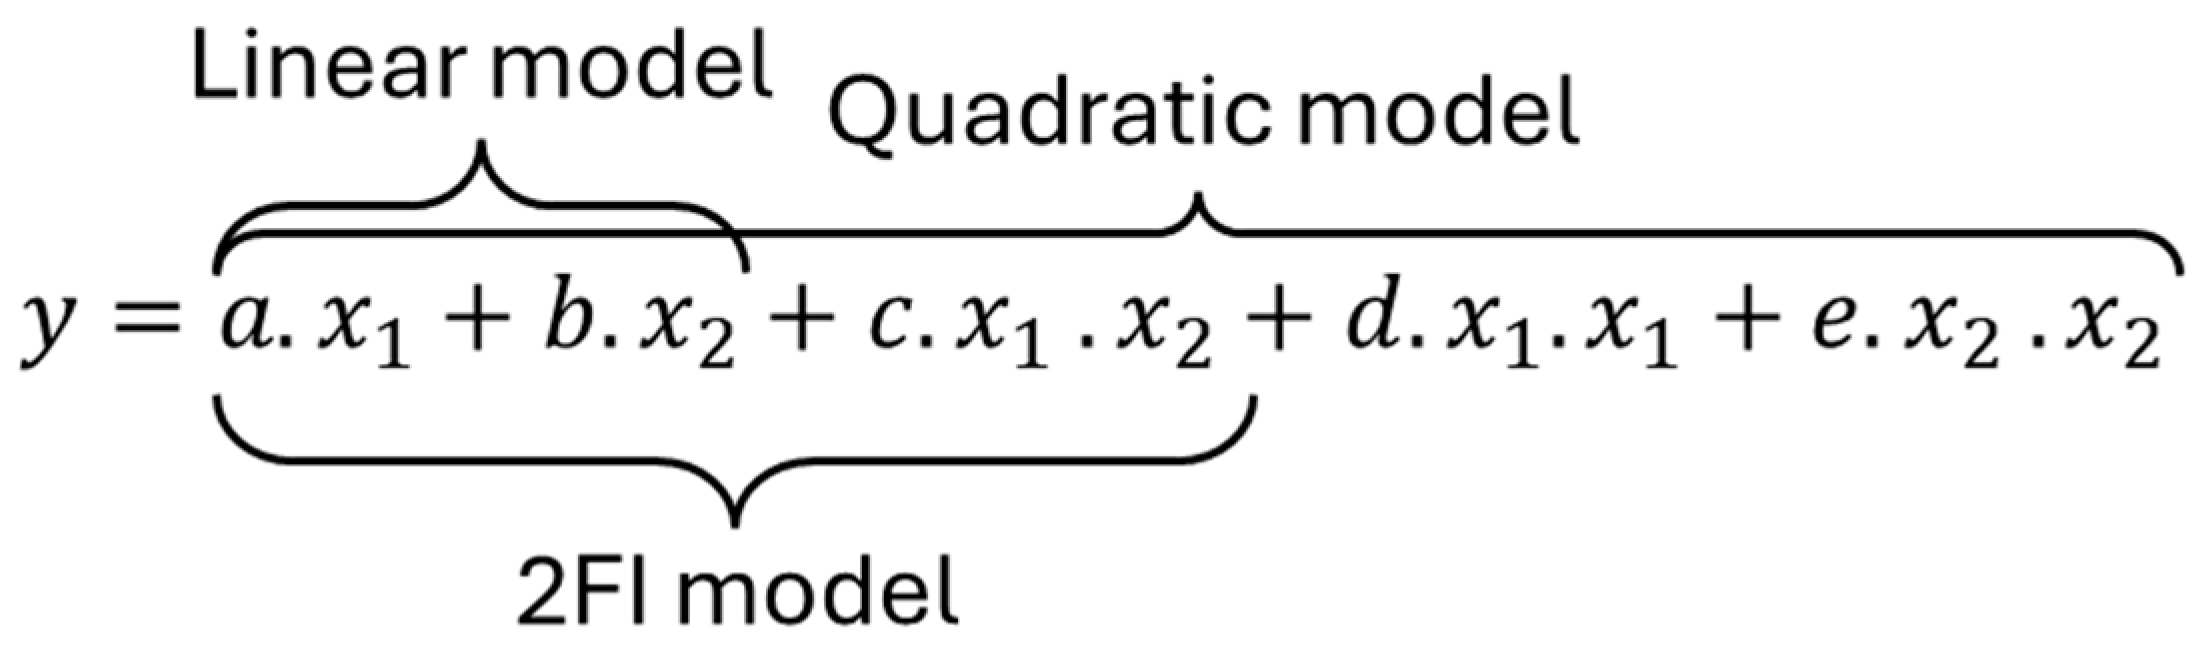
To quantify the impact of the different design parameters, the capacity, rate capability, and normalized resistance changes after 2300 cycles were analyzed using an ANOVA, of which the results are summarized in
Table A4. For the NMC cell, the best statistical metrics were obtained for a linear model where the
p-values were the only ones below 0.05, and where the R
2s were of 0.93, 0.64, and 0.76, respectively, for the capacity, rate capability, and resistance changes. The 2FI models offered slightly higher R
2 values (0.95, 0.77, and 0.86) but their
p-values were above the threshold. For the LFP cells, the capacity loss could also be fitted best with a linear model, whereas the RC changes were not significant enough (
p-value > 0.19), which was expected since negligible changes were observed. The normalized resistance changes were best fitted with a 2FI model with combined effects of the temperature and DODs (similar
p-value but much higher R
2 and F).
Because of the coded variables, the weights for each parameter of the fitted equations can be compared directly. For the capacity loss, the impact of temperature was found to be larger for the NMC cells than for the LFP ones (4.84 vs. 3.20), whereas the opposite is true for the DODs
EOD (3.46 vs. 5.52), which is consistent with Neumann at al. [
35]. The DODs
BOD had an inverse impact on both cells but they were only significant for the NMC cells (−1.90 vs. −0.18). Overall, this confirms the observations from
Figure 7, and there were therefore differences in the impact of the three parameters depending on cell PE chemistry. The results for the LFP cells contradicts the observations by Xiong et al. [
26] as the impact of DOD
EOD was larger than the one of temperature and DOD
BOD. This could be due to different additives in the electrolytes or to the different discharging schedule. For the results for the NMC cells, the impact ordering was consistent with the literature [
22]. For the rate capability changes, the model for the LFP cell was not significant because the variations were negligeable,
Figure 4, and, for the NMC cell, while the
p-value for the model was overall below 0.05, the individual
p-values for temperature and DOD
BOD were not significant. It therefore seemed that the DOD
EOD had the only significant impact on the changes of rate capability for the NMC cells. Finally, looking at the changes in normalized resistances, the results were also PE chemistry dependent. For the NMC cells, the biggest impact was for the DOD
EOD (29.75) with the temperature and DOD
BOD having similar inverse impacts (around −11). For the LFP cells, the highest impact was for the temperature (50.33), followed by the DOD
EOD (41.36), which was larger than the one for the NMC cell, as observed in
Figure 8. The DODs
BOD also had a much more significant inverse impact (−35.52) on the LFP cells and there were also noteworthy combined effects (over 35 for temperature and DOD
EOD and between DODs, −17.06 for the temperature and DOD
BOD).
Because the cells cycled from different DODs
BOD and to different DODs
EOD, the cycle number might not be the best way to compare the results, and an equivalent full cycle scale (efc) allowed comparison of the results on a common exchanged capacity scale. The equivalent of
Figure 8, but after 1350 efc instead of 2300 cycles, is provided in
Figure A11. From this representation, it seemed that the impact of temperature remained, but that the impact of the DOD
EOD diminished. This was confirmed by the ANOVA analysis,
Table A5, that showed a lowering of the coded DOD
EOD parameter from 3.46 to −0.84 for the NMC capacity loss, from 29.75 to −1.86 for the NMC resistance increase, and from 5.52 to 2.39 for the LFP cell capacity loss. In all three cases, the other parameters were stable. All the other models (rate capability for both and resistance for LFP) were not significant because the variations were small and within cell-to-cell variations.
Figure 9 presents a similar visualization for the calendar aging experiments, where a similar impact of DOD on both chemistries can be seen, but a much larger impact of temperature on the NMC cells capacity loss can be observed, as shown in
Figure 9a,d. For the rate capabilities, the only significant variation was observed for the NMC cells calendared aged at 40 °C and 0% DOD, as shown in
Figure 9b. The normalized resistance increase,
Figure 9c,f, seemed to be mild below 35 °C for the NMC cells and 40 °C for the LFP cells. Above those temperatures, the resistance increased more, with an additional impact of DOD, with the lower DODs increasing the degradation. The ANOVA analysis is presented in
Table A6. Sadly, the models for the rate capabilities and the LFP resistance increase were not significant. For NMC cells’ capacity loss, the best fit was obtained for a quadratic model (although the
p-value for the linear one was also below 0.05), which showcased a similar impact but with opposite signs for the temperature and SOC (around 4.5). The combined and square effects were lower and around 1.5. For LFP cells; the best fit was obtained for a linear model with an impact close to twice as small than of the one observed for the NMC cells with a slightly larger impact of DOD (−1.97 versus 2.62). This is consistent with the literature [
38], where NMC was shown to have significant combined effects, but not LFP, and where LFP’s DOD impact was larger than the temperature one. Lastly, for the NMC resistance, the best statistics were obtained for a quadratic model with a strong impact of the DOD (−18.57 and 25.61 squared). The temperature only had a significant impact non-squared values (15.17). The combined effect of DOD and temperature was the smallest (−11.43). This analysis confirmed the observations from
Figure 9.
The results analysis can be pushed further with the quantification of the degradation modes [
4,
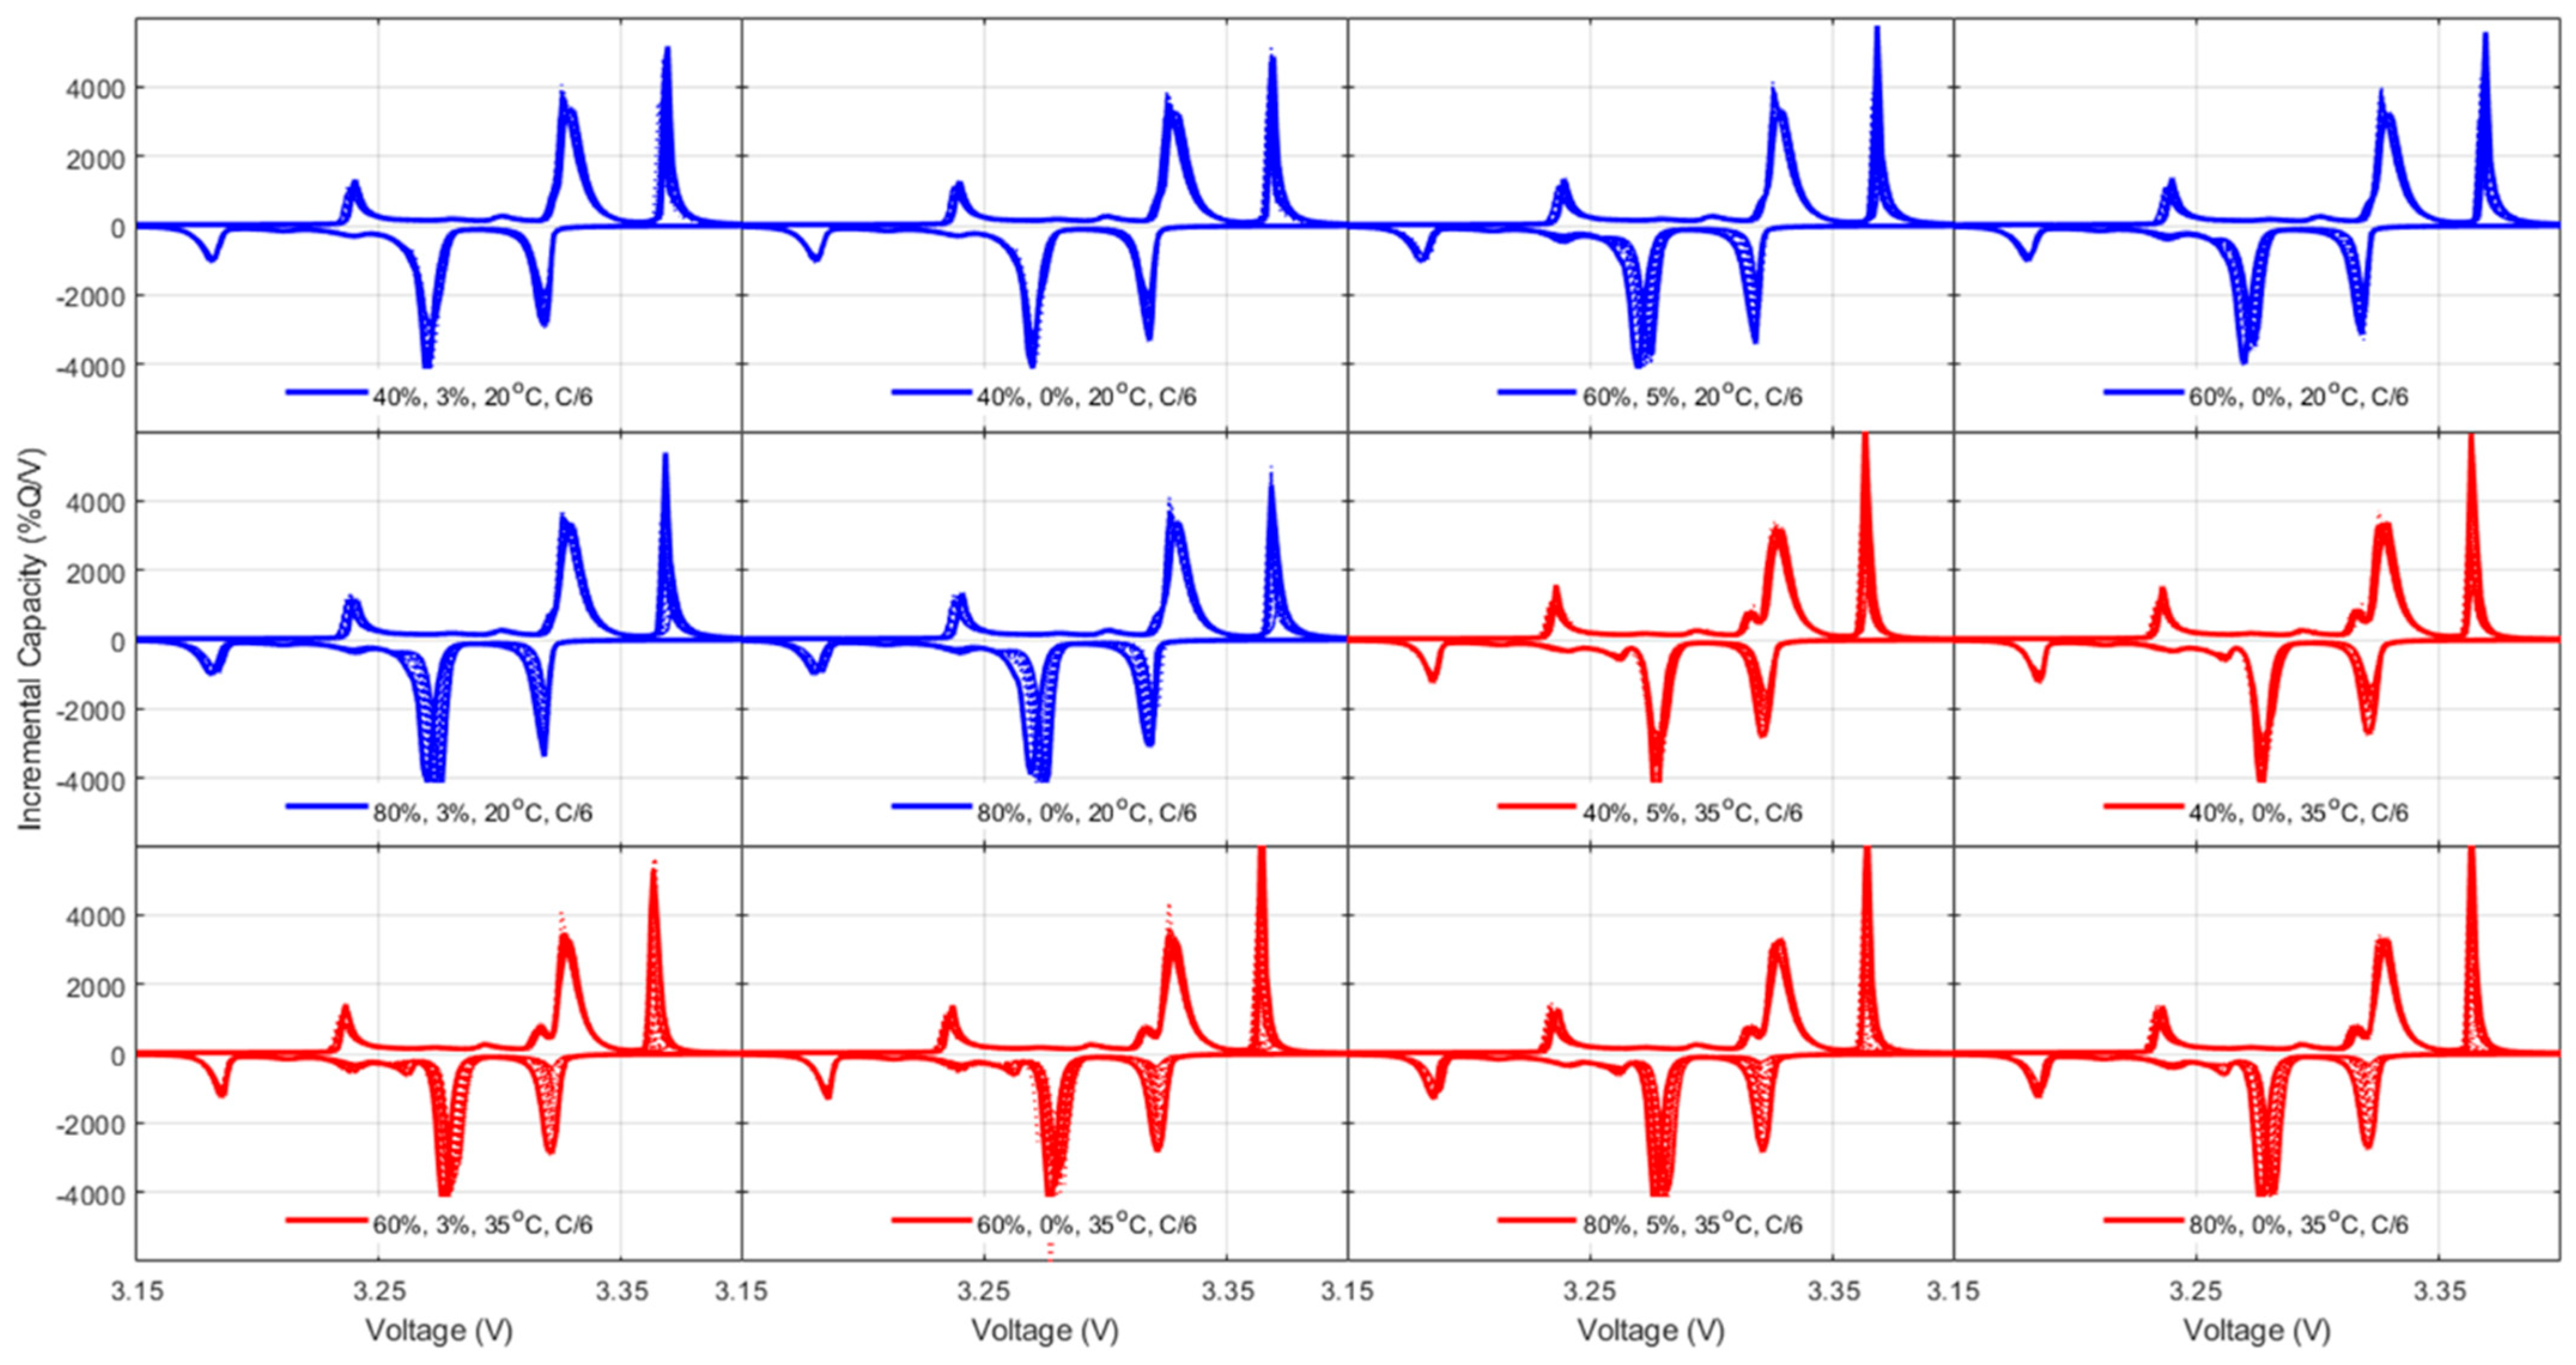
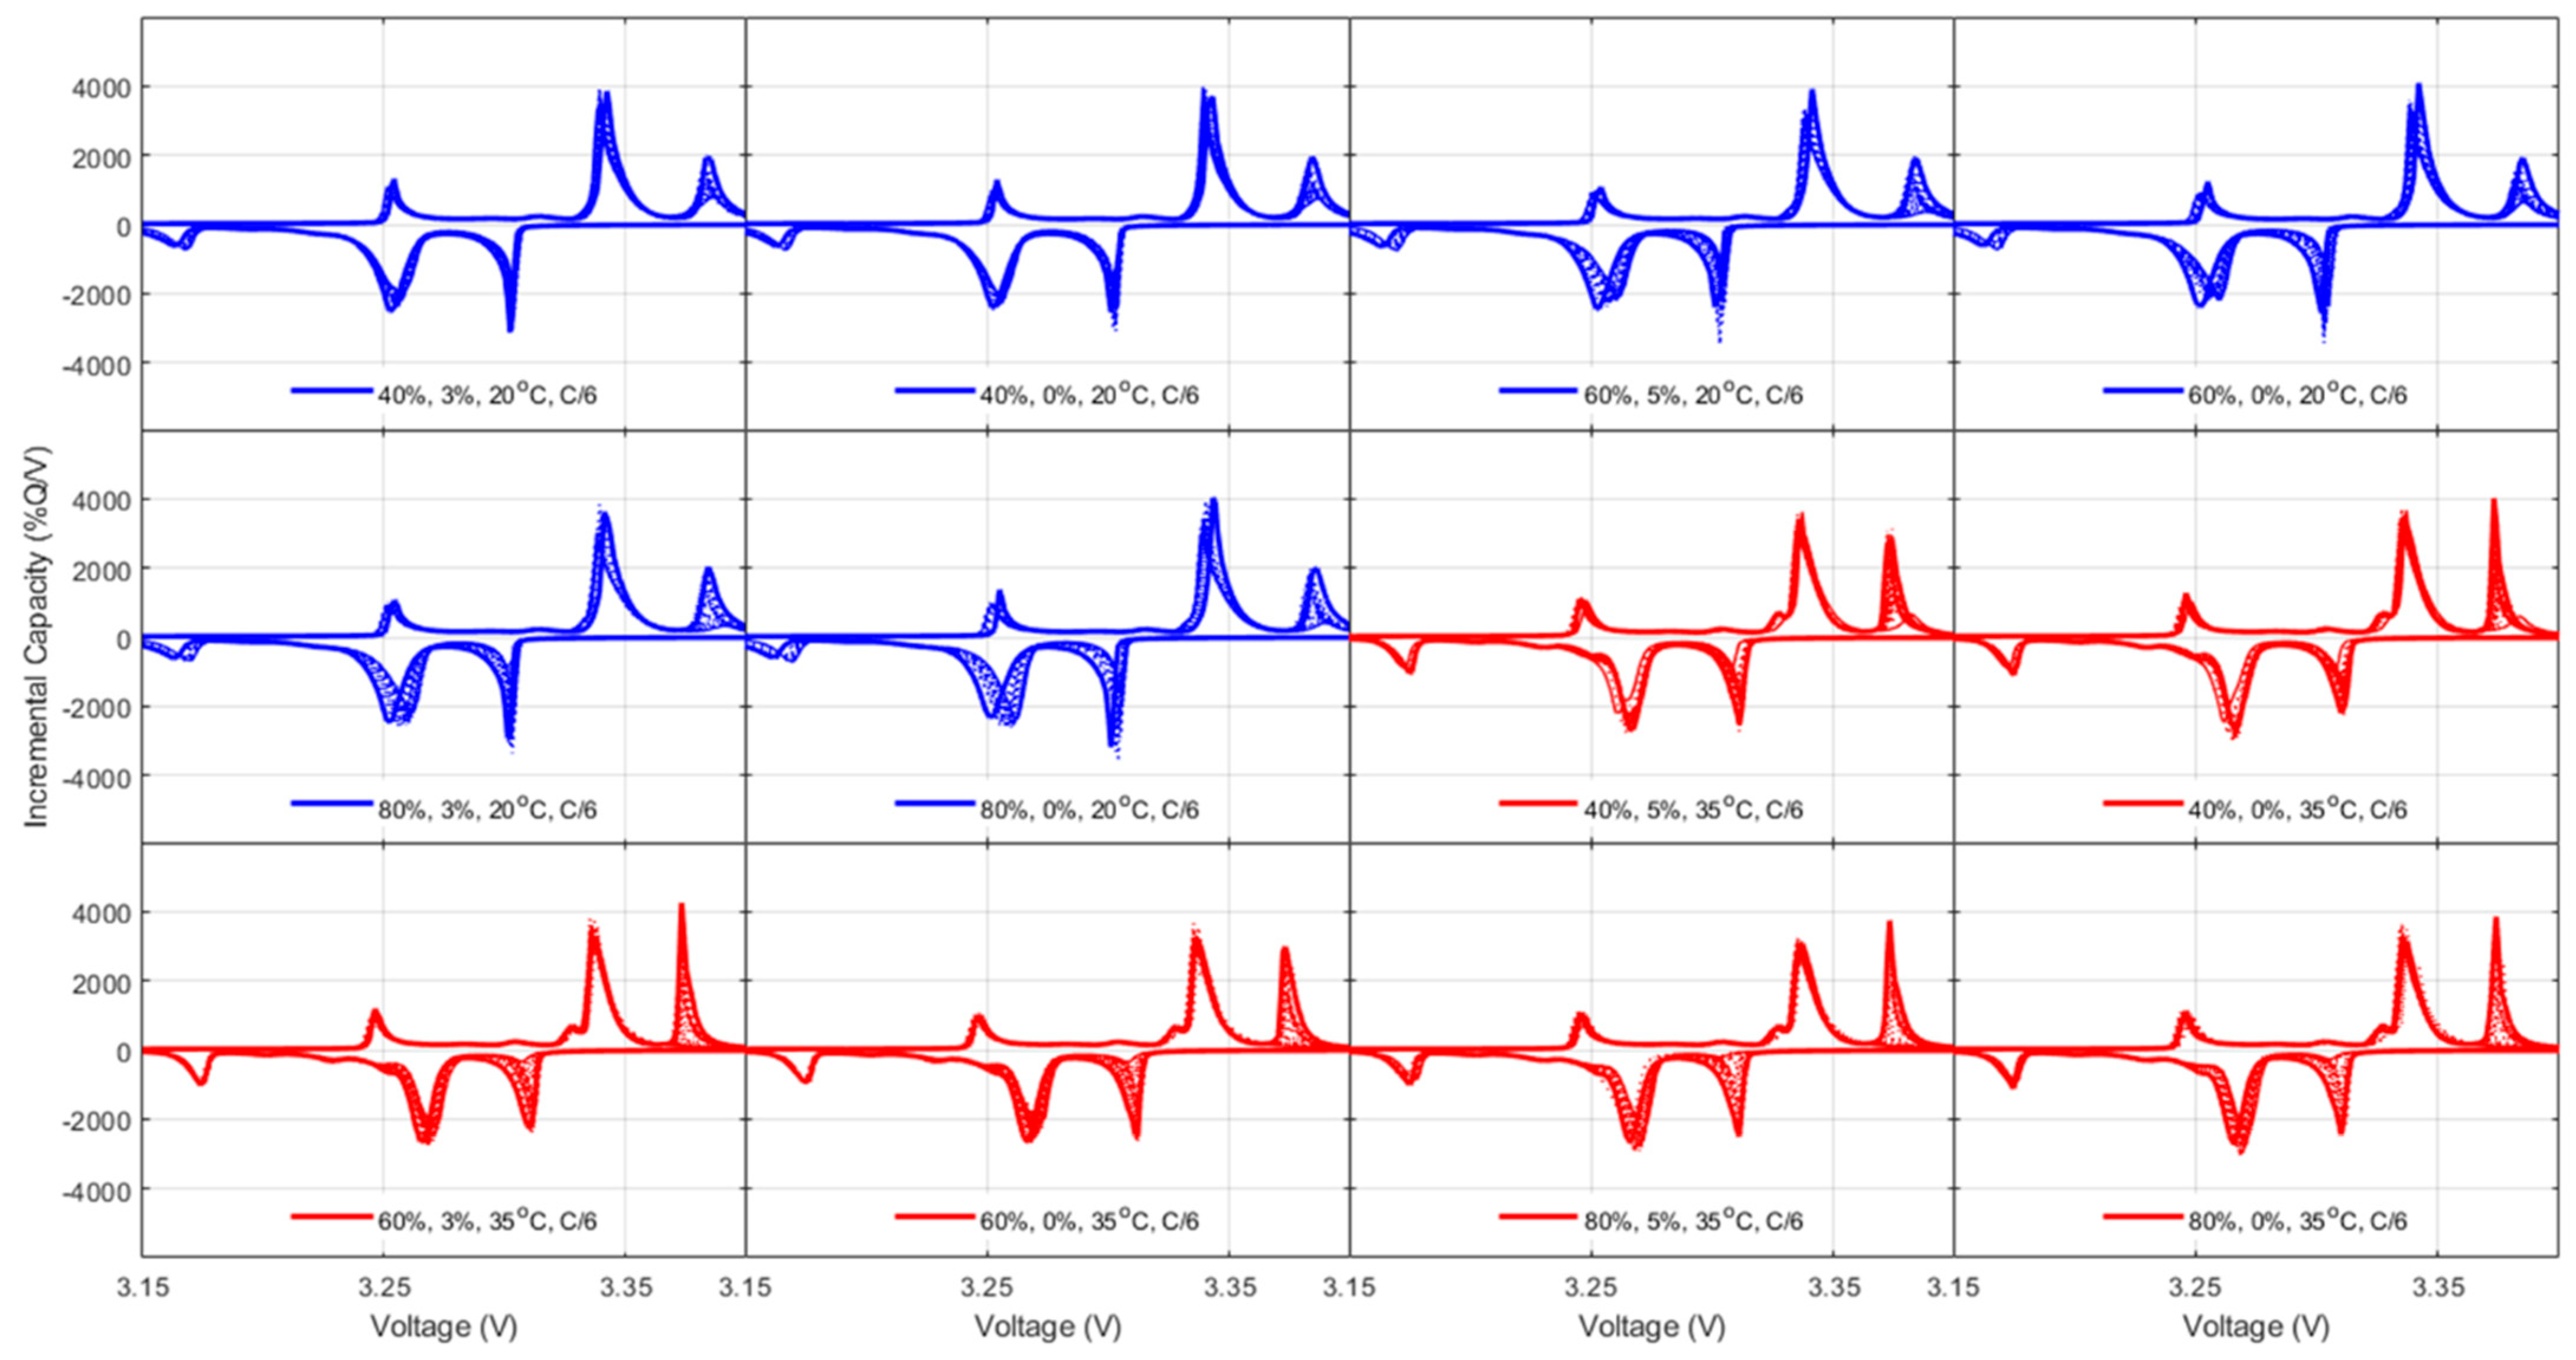
42], both thermodynamics, LLI and LAMs, and kinetic, rate degradation factor, and ohmic resistance increase, the latest being equivalent to the specific resistance increase and thus already covered. For the thermodynamic ones, a closer analysis to the changes in the voltage response of the cells upon aging,
Figure 5,
Figure A5 and
Figure A7 allowed quantification of the LLI and LAM
PE for the NMC cells and the LLI, LAM
NE, and LAM
PE on the high voltage phase for the LFP cells, following guidelines from the literature [
48].
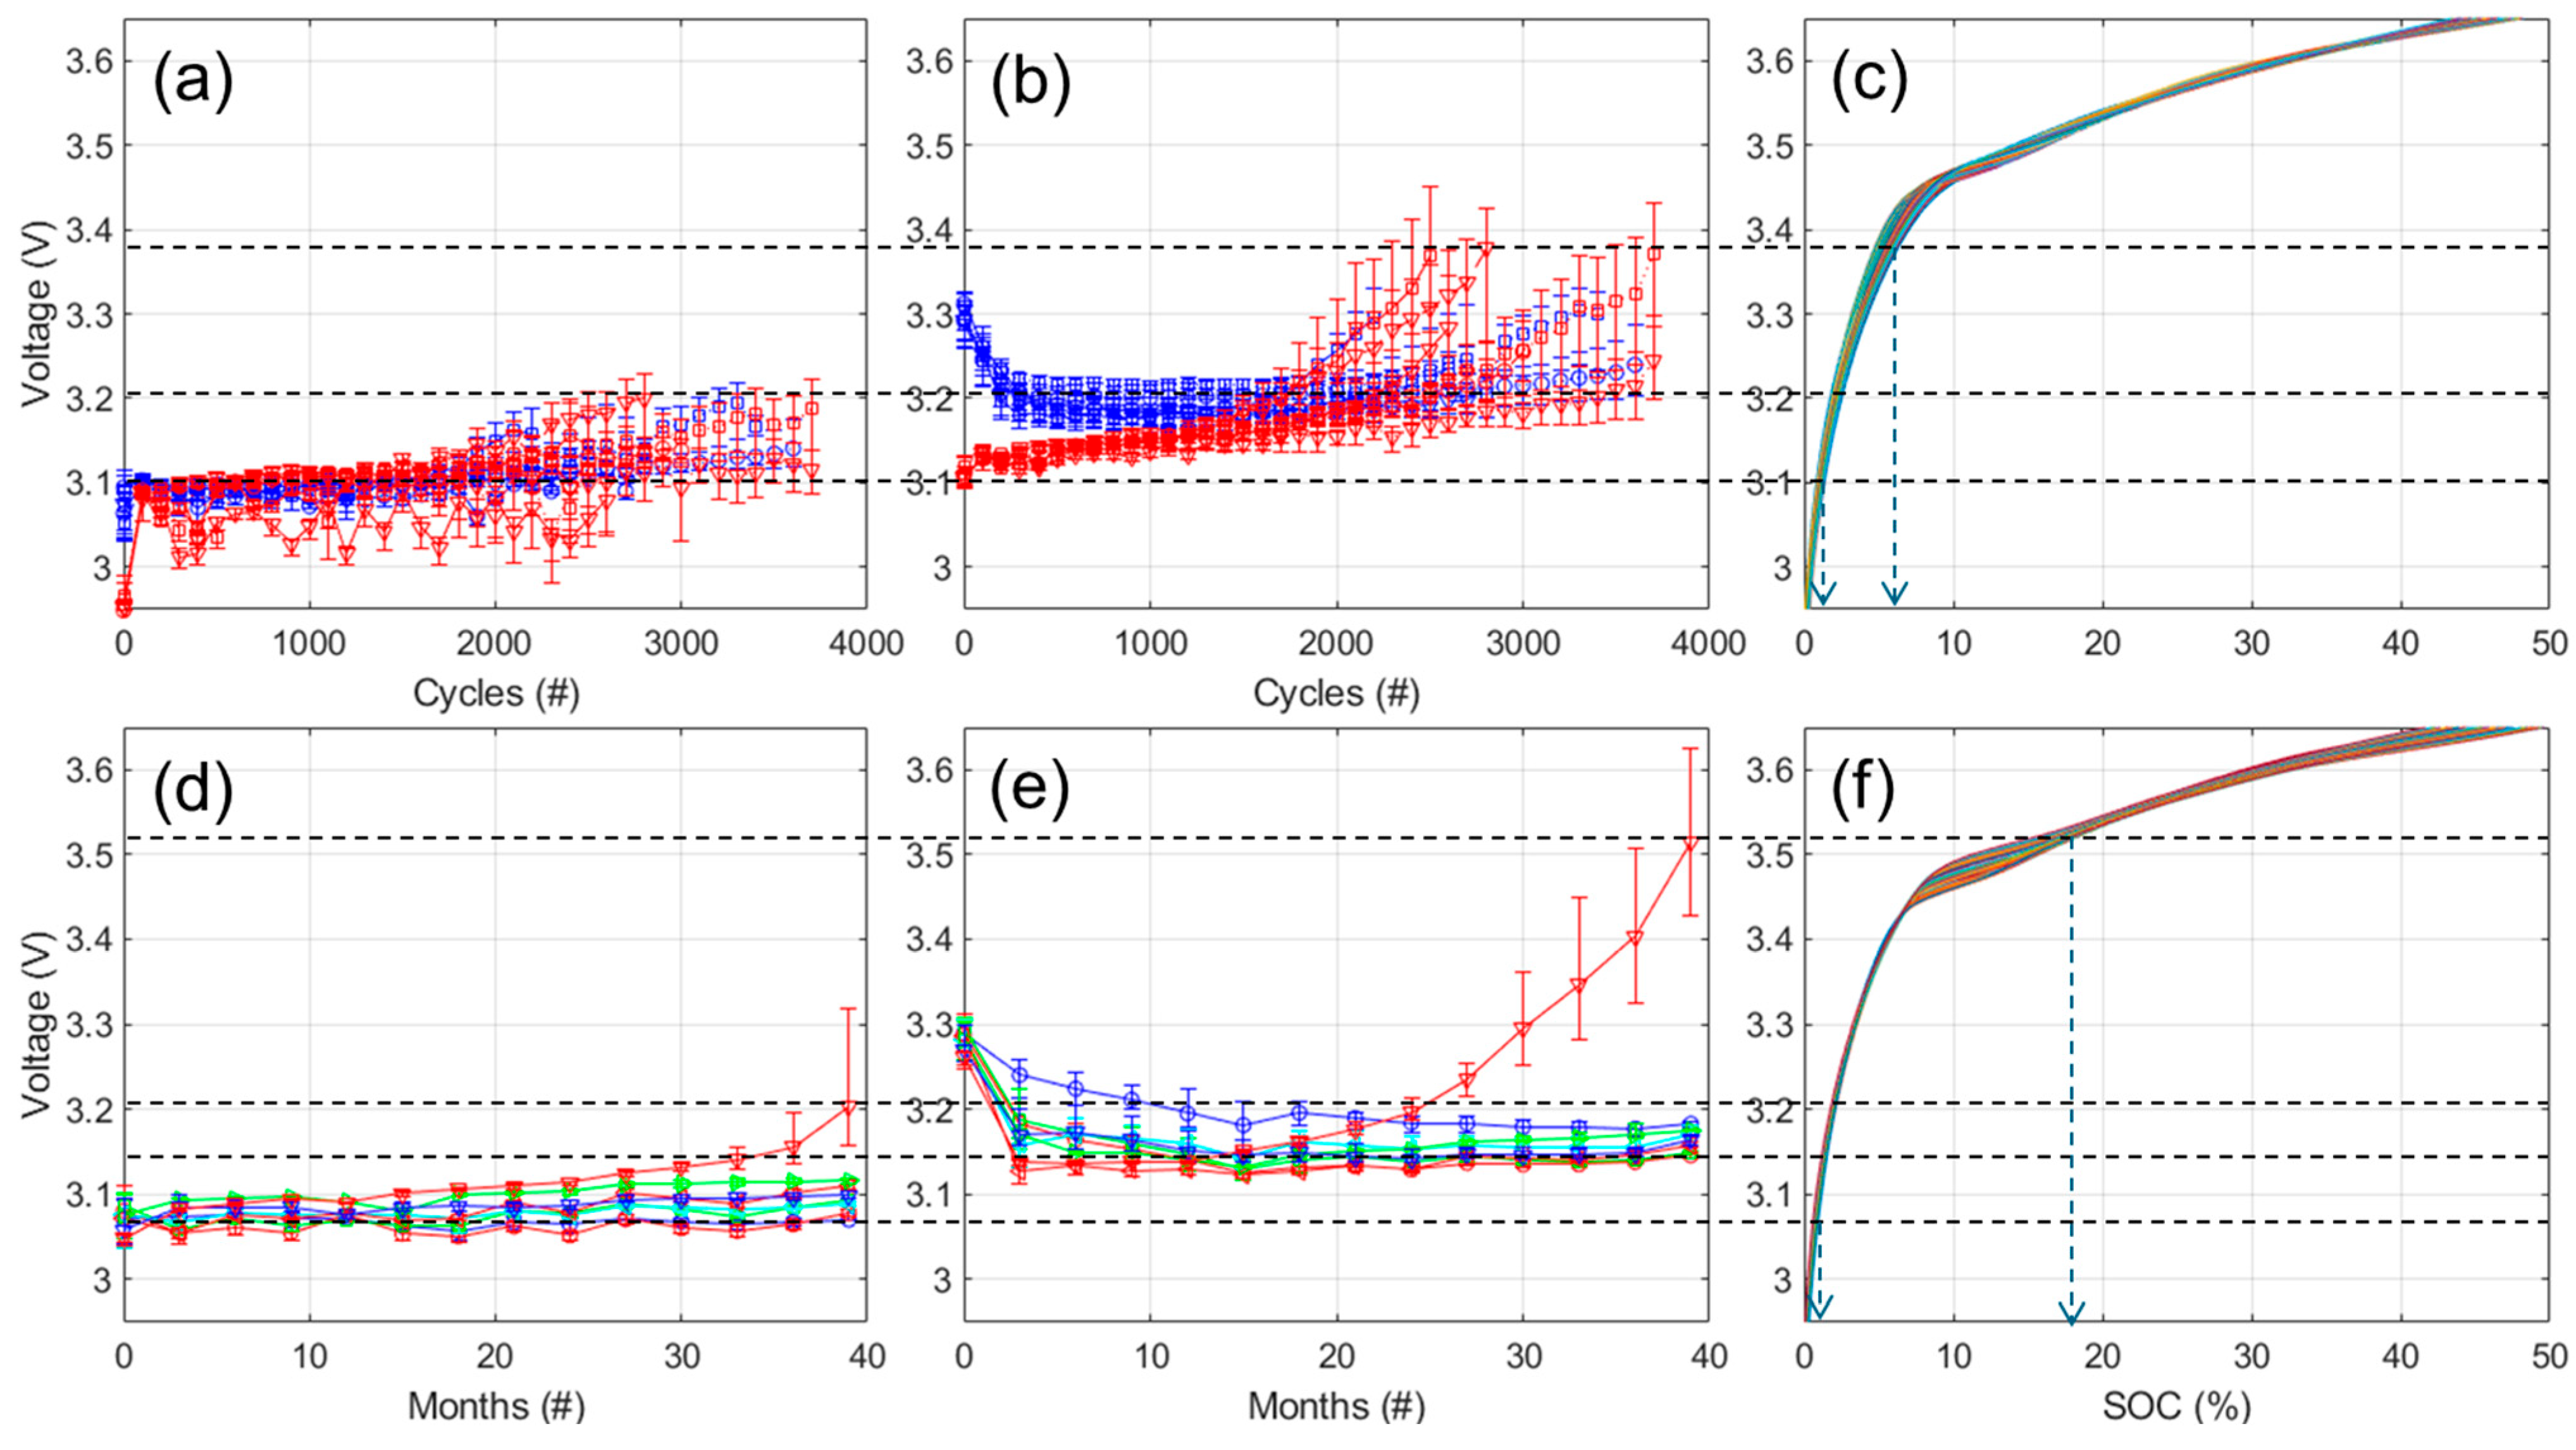
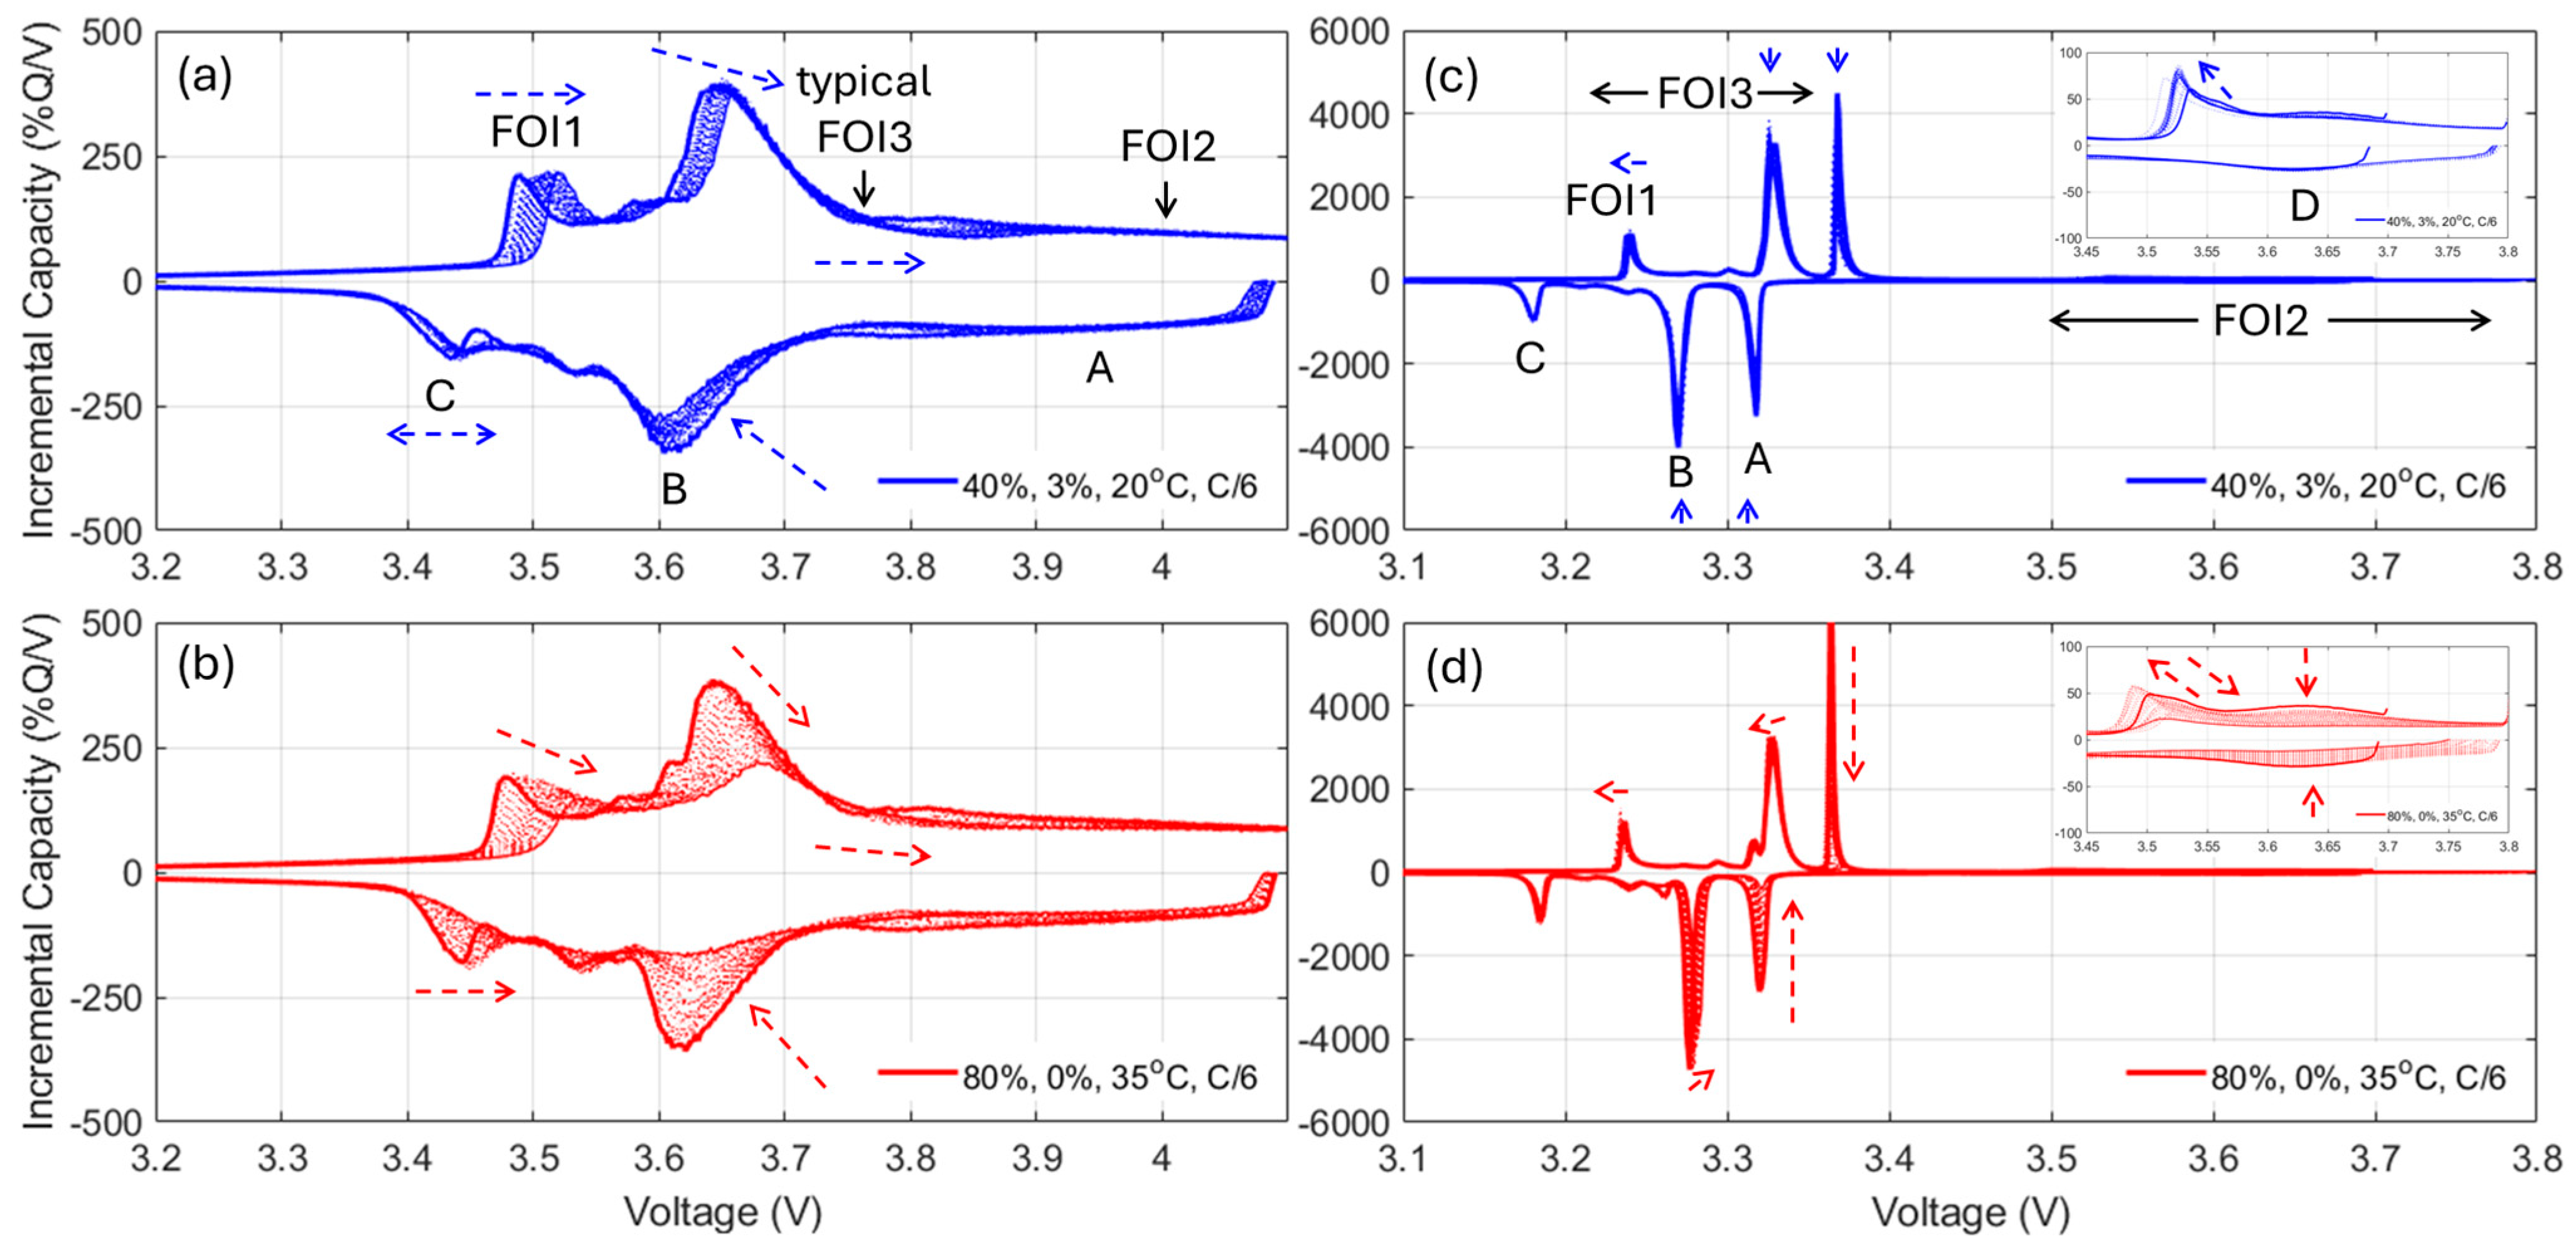
For the NMC cells, since FOI1 is always present and moving towards higher voltages, it can be concluded that the NE remained limiting at EOD [
48]. Therefore, the capacity loss can only be imputable to the LLI. The LLI is thus directly proportional to the capacity loss with a ratio of about 0.9, assuming a 10% offset between the PE and the NE. For the NMC chemistry, the LAM
PE can be directly inferred from the changes of intensity of the high voltage shoulder (FOI2). The LAM
NE is much harder to decipher automatically, especially when kinetic limitations are present, since the usual FOI to use is the area between the beginning of charge and the local minima after the main peak (FOI3). In this work, unfortunately, this local minimum is not visible for most of the conditions, and the LAM
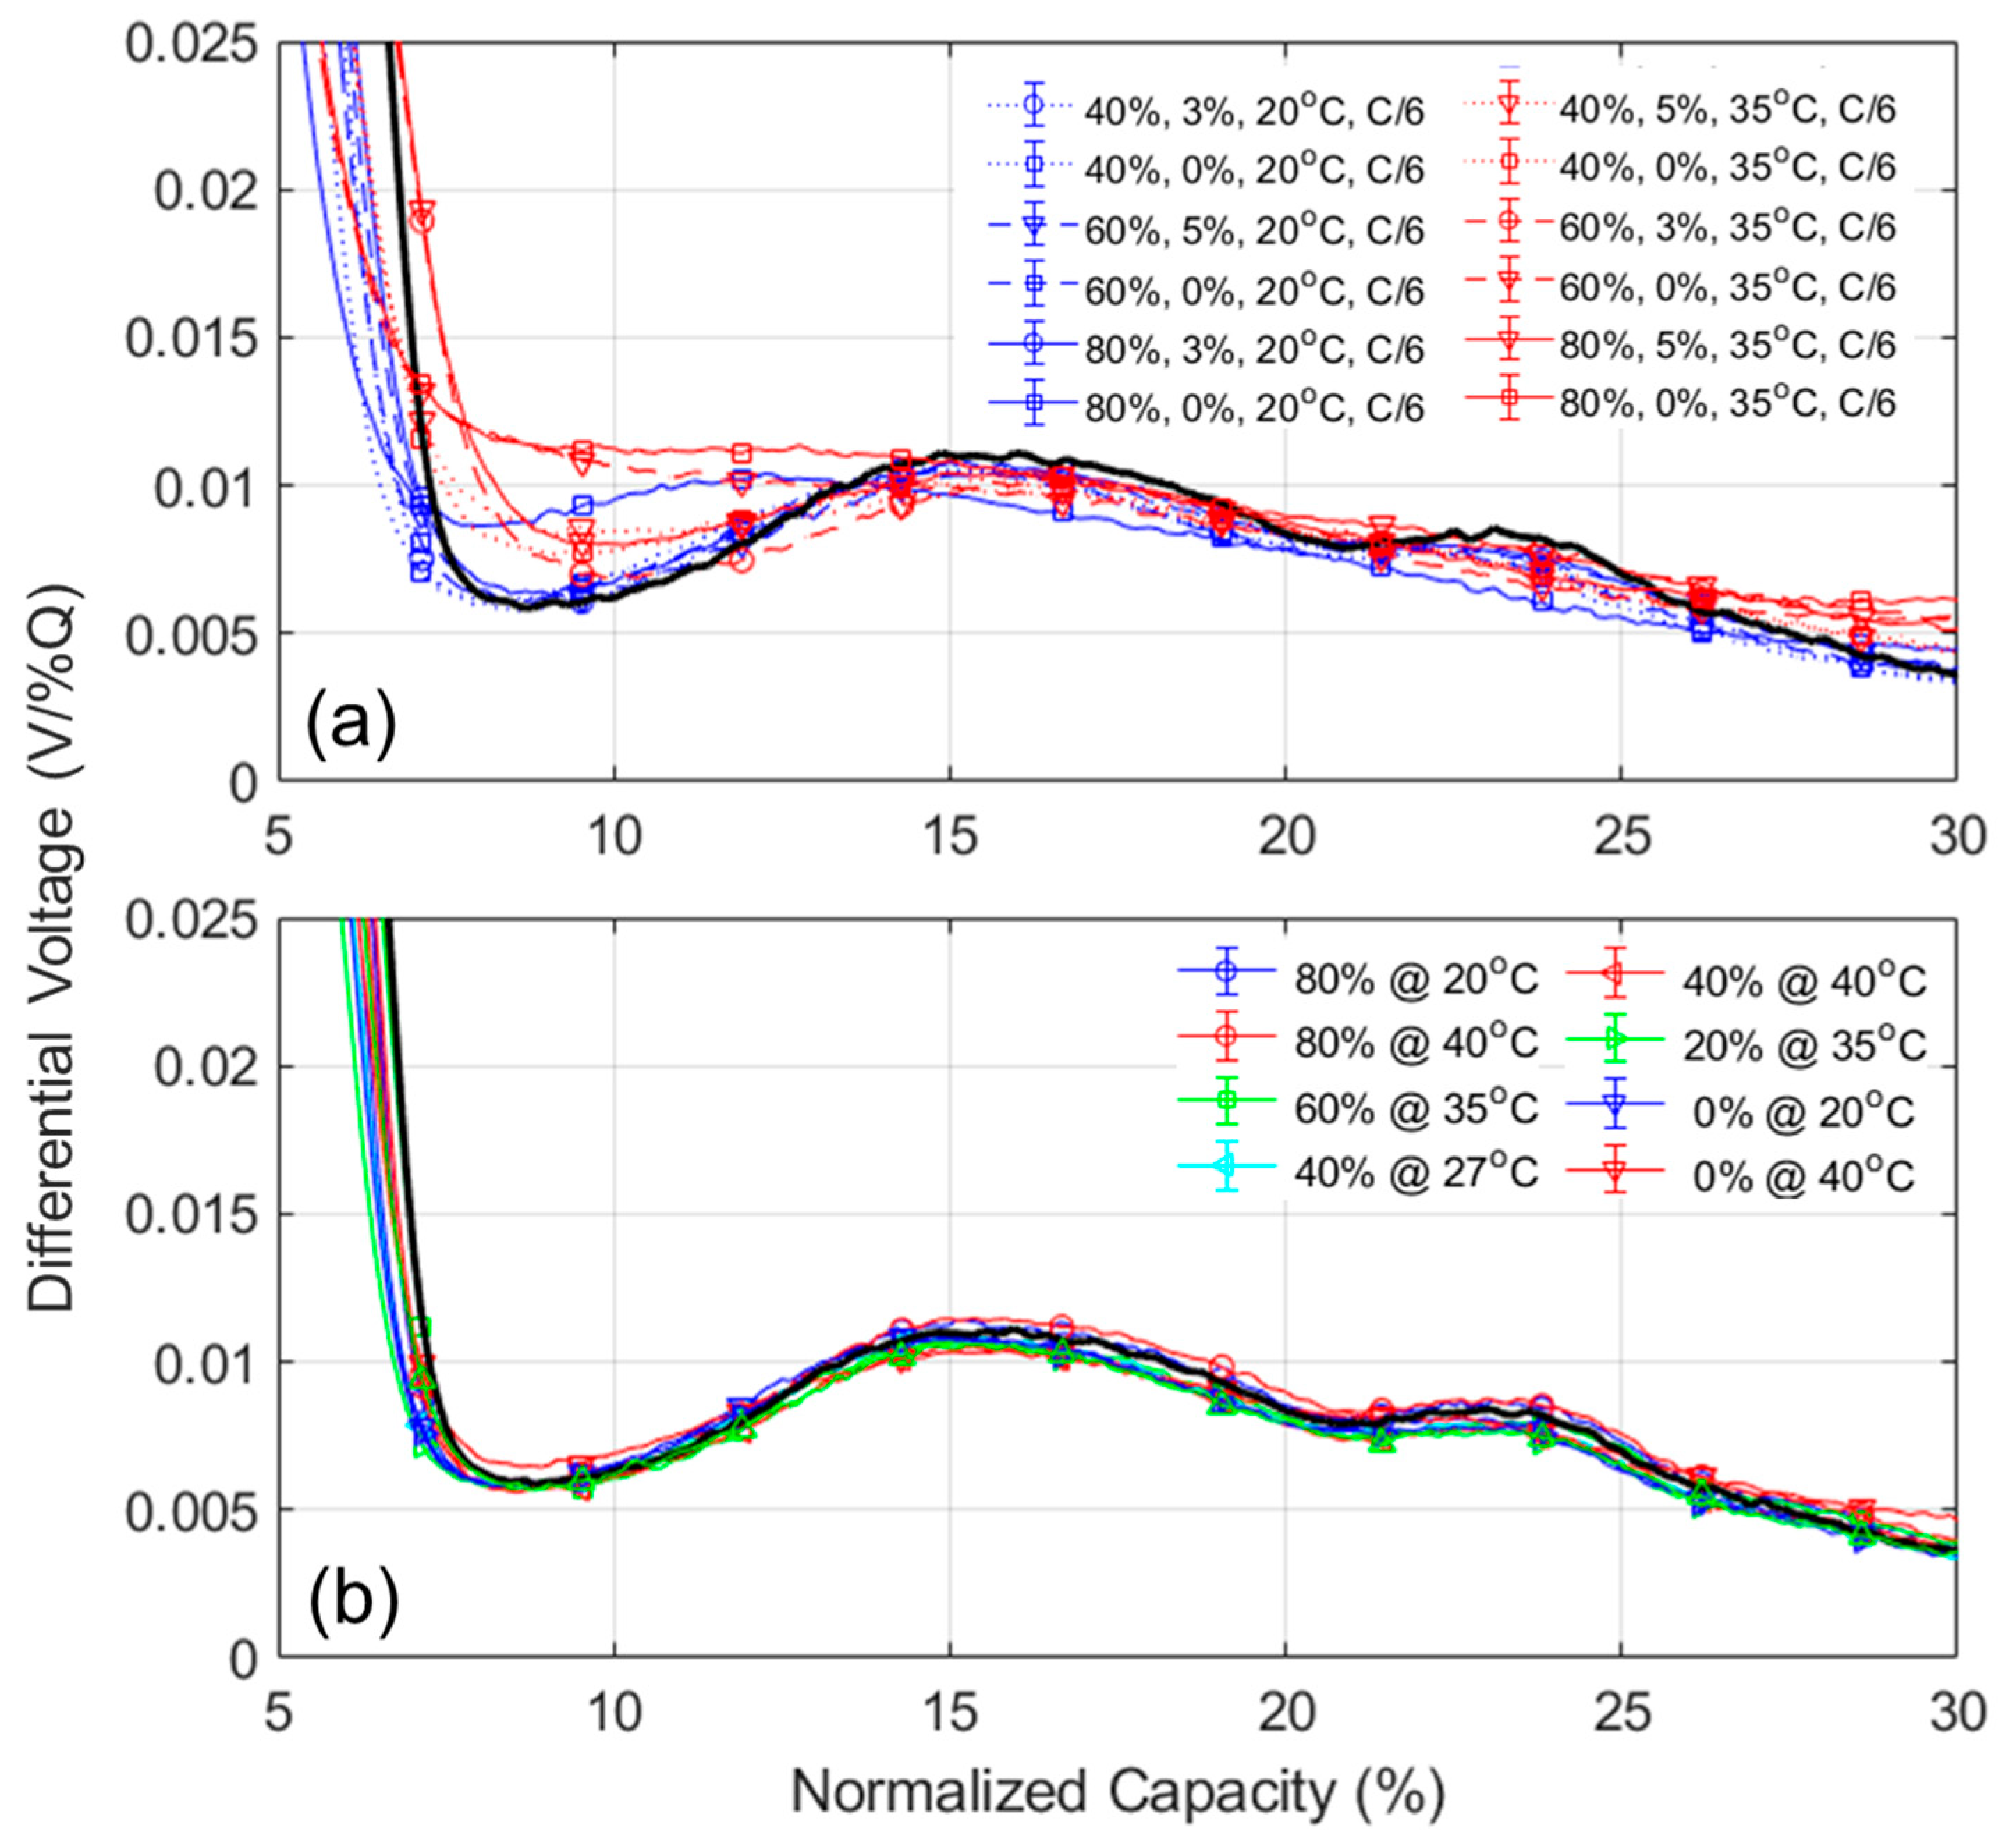
NE could not be deciphered using this method. A typical alternative solution is to investigate the other derivative of the voltage curve, the differential voltage (DV, dV/dQ = f(Q)),
Figure A12, with the tracking of the capacity difference between the center graphitic peak and BOD or another low-capacity peak. Sadly, for the same reasons as for the IC method, this is not working when kinetic limitation occurs because the peak is broadened.
Figure A12 showcased the DV variations for the most degraded cells for both the cycle aging (left column) and calendar aging (right column) at both 20 °C (top row) and 35 °C (bottom row). While the center peak is clearly marked initially, it quickly fades for most of the experiments, especially at 35 °C. A possible solution is to use a less desirable configuration and the capacity between the beginning of charge and the first of the low-capacity graphitic peaks, FOI4. As can be seen on
Figure A12, this peak was not affected much by the kinetic limitations and remained clearly visible throughout most of the experiments.
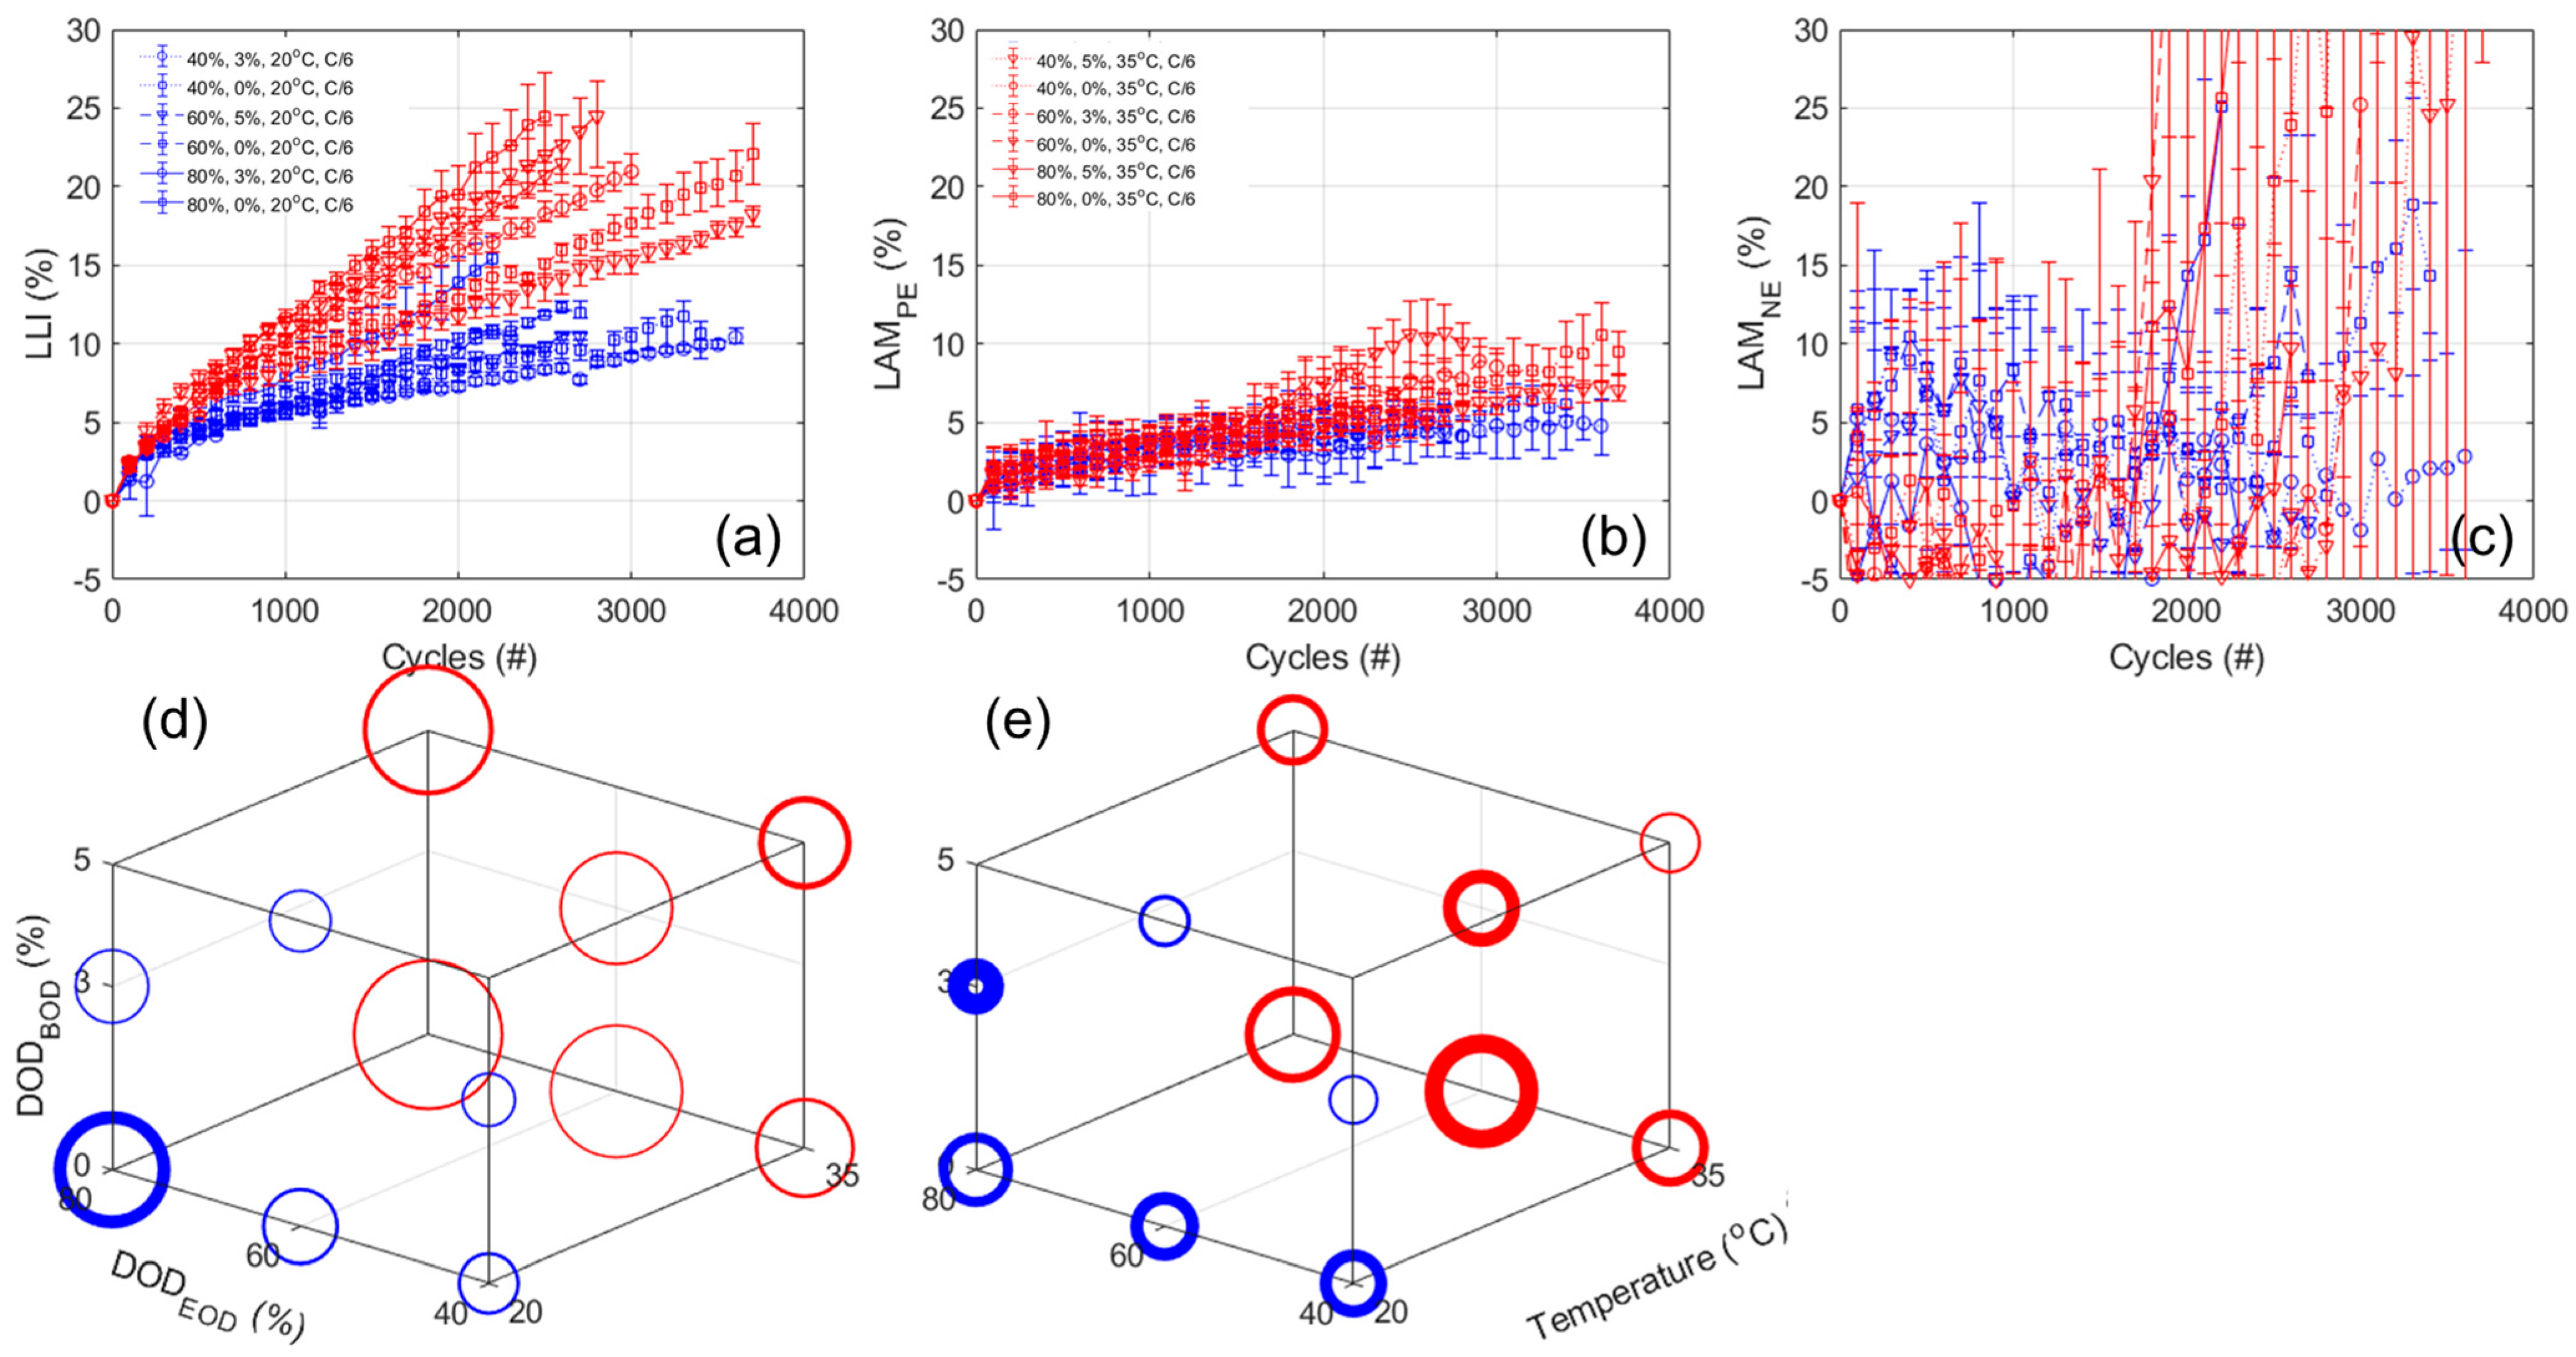
Figure 10a,b,c presents the evolution of the estimated LLI, LAM
PE, and LAM
NE, respectively, with
Figure 10d,e displaying the 3D representation of the results after 2300 cycles for the LLI and LAM
PE. The results for the ANOVA analysis are provided in
Table A7. For the LLI, and unsurprisingly, the results are similar to the one observed for the capacity loss, with a bigger impact for temperature (3.52 from the ANOVA analysis), then the DOD
EOD (2.87), and finally a lower inverse impact for the DOD
BOD (−1.45). For the LAM
PE, there seems to be mostly an impact of temperature, which is confirmed by the ANOVA analysis (1.55, 0.47, and −0.64, respectively, for temperature, DOD
EOD, and DOD
BOD). From the LAM
NE, the automatic quantification is unfortunately very noisy,
Figure 10c, and the variations between replicates cover the same range as the evolution with cycle. However, a closer look at the variations cell by cell,
Figure A14a allowed the estimation that no significant LAM
NE was occurring for all but three cells, the one tested up to 60% and 80% DOD from 0% at 20 °C and the one tested up to 60% DOD from 0% at 35 °C, that likely experienced around 5% LAM
NE only starting to occur from the latest 600 cycles; however, a more precise quantification is not possible without significant modeling which was out of the scope of this work.
Concerning kinetic limitations,
Figure 10 and
Figure A12 showcased significant peak broadening. This is confirmed by an analysis of the RCVs at EOD,
Figure A13a,b, that showed an increase with cycle number, especially for the higher rate. When compared to the pseudo-OCV curves calculated from each state of health,
Figure A13c, this kinetic induced undercharge accounted for up to 5% capacity loss for the higher rate, which explains the lowering of the rate capability. Because the broadening is visible at the beginning of charge, it is likely induced by kinetic limitations on the NE because, while the NE is undergoing several phase transformations, the PE is only undergoing one, which should go fast initially, but a quantification without modeling is not possible.
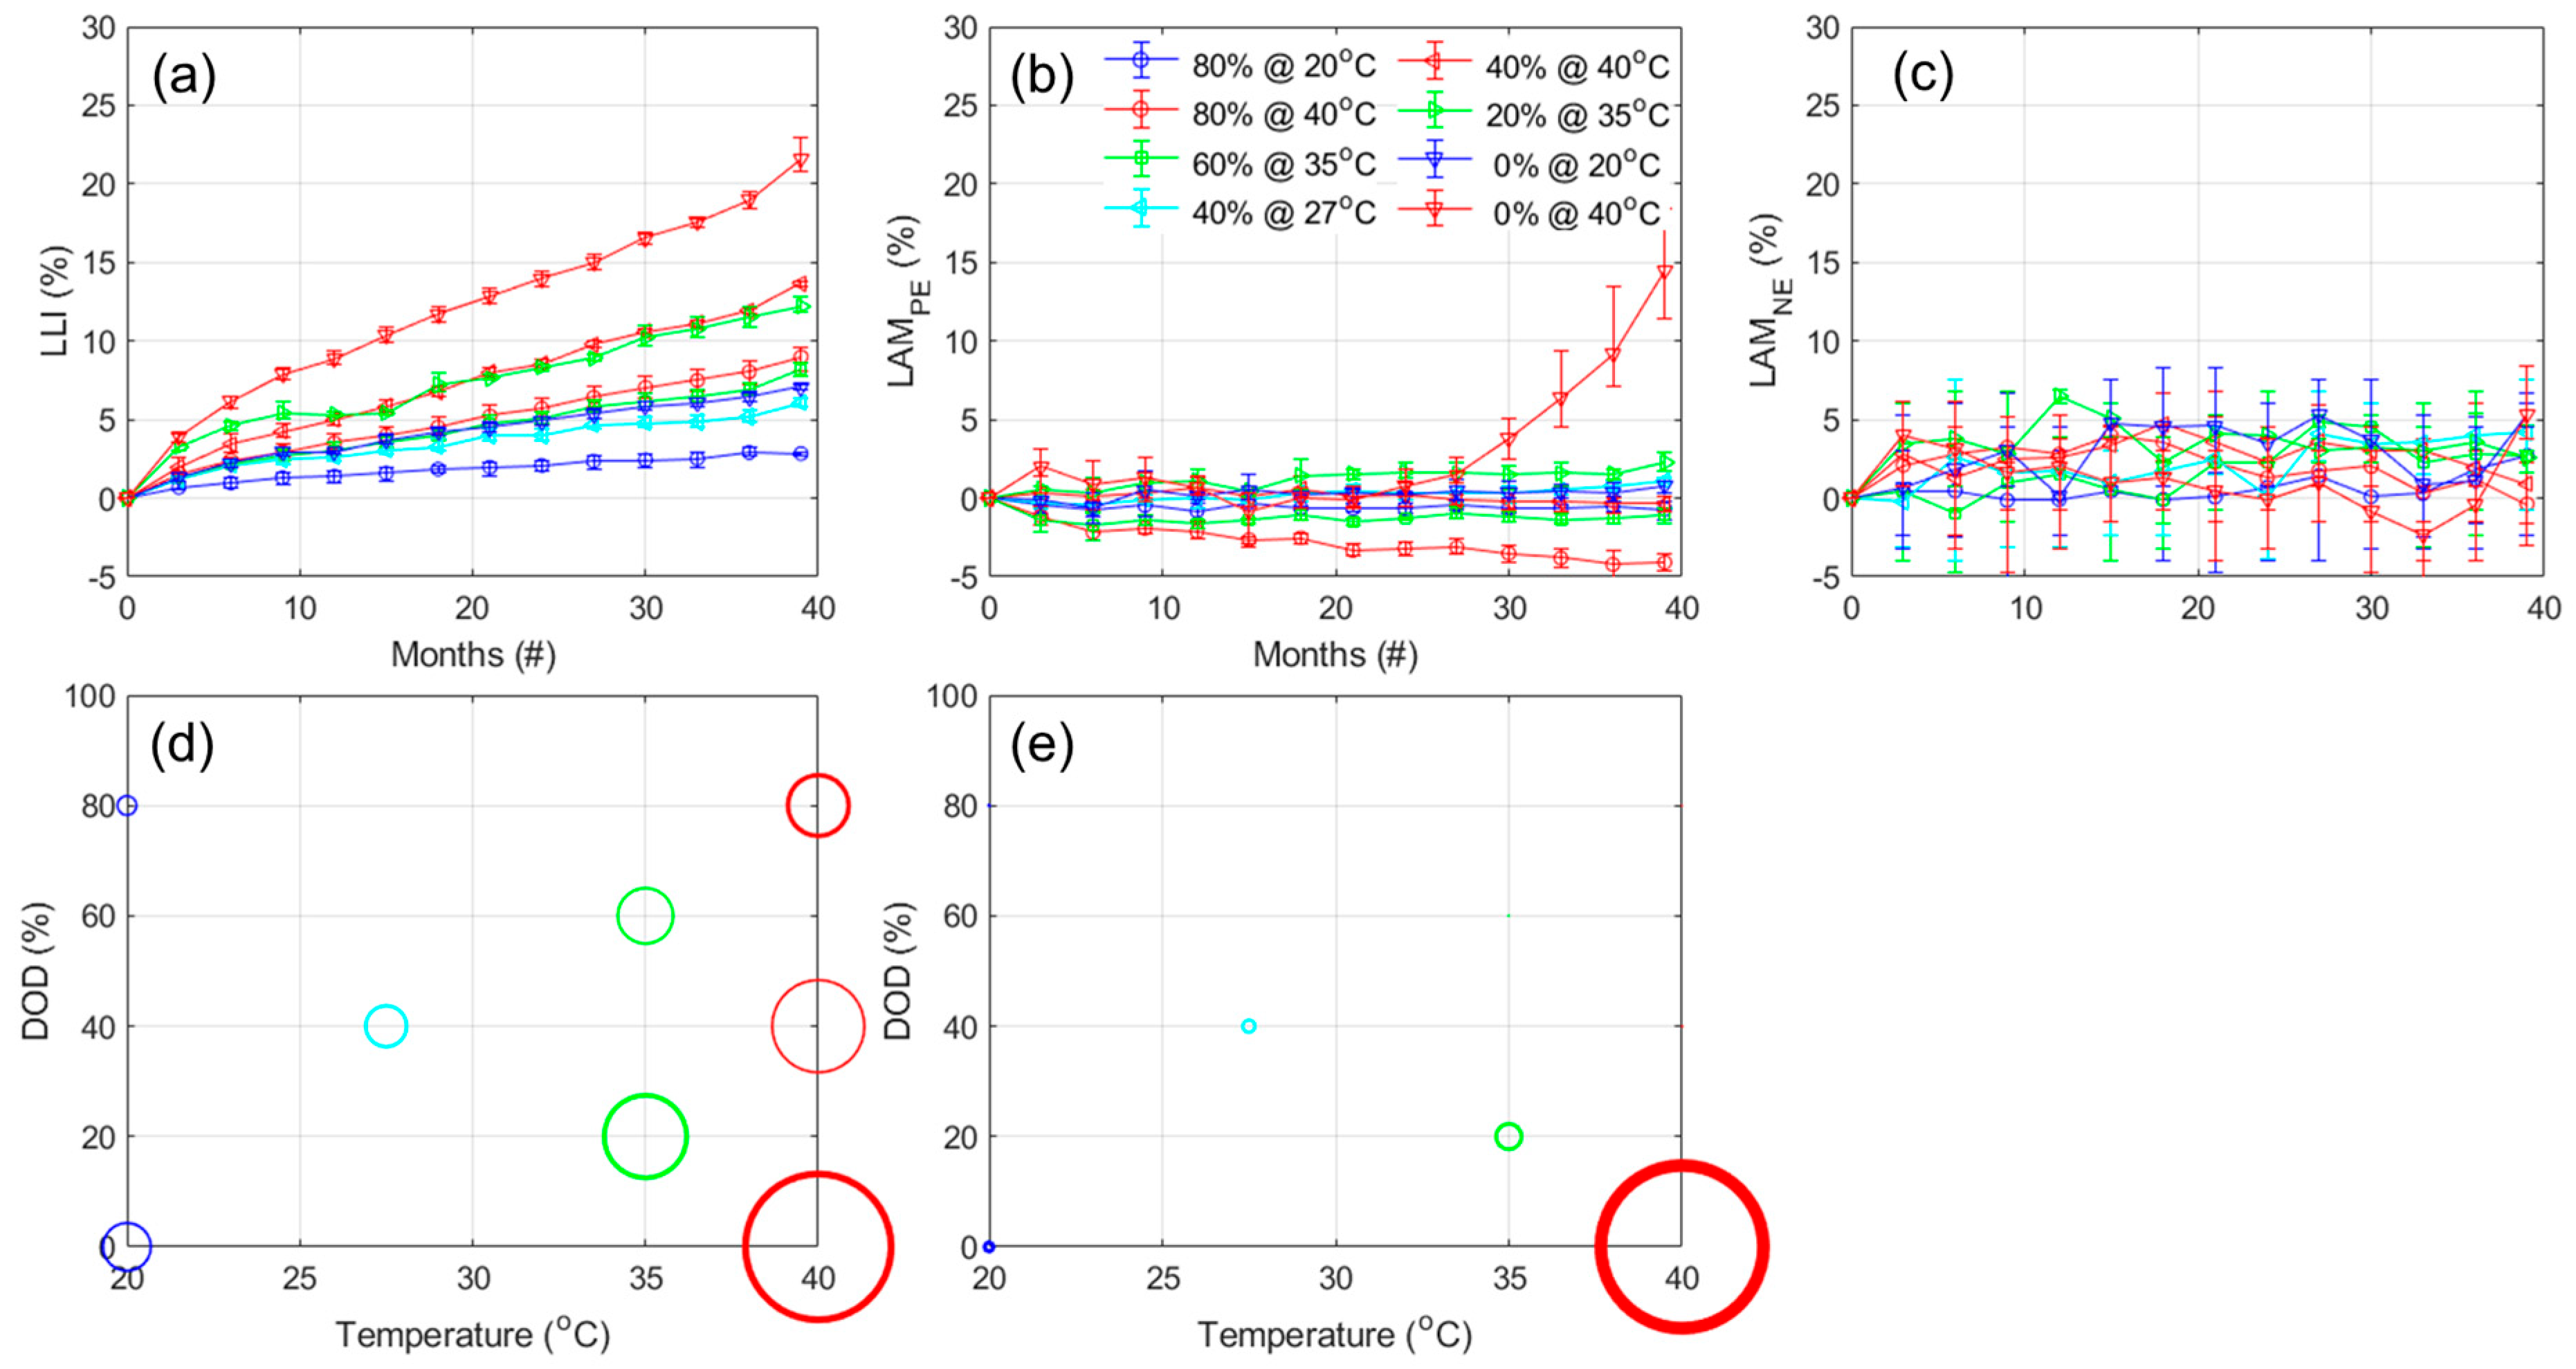
Figure 11 presents the results for the calendar aging experiment using the same representation for the NMC cells. For the LLI, similar to what was observed for the capacity loss, the cells calendar aged at higher temperatures experienced more degradation. The impact of temperature and DOD are close but of opposite sign (5.1 vs. −4.07, respectively). Looking into the LAM
PE, it appears limited for every experiment except the one where the cells were left fully charged at 40 °C, where the LAM
PE gradually increased to 15% in the last year of aging. The ANOVA analysis,
Table A8, showcases that the main impacts were the one of the DOD and the combined one (−4.60 and −4.05, respectively), with a much lower one for the temperature (1.45), which was not significant. For the LAM
NE, the results were again too noisy for automatic analysis. Looking on a cell-by-cell basis,
Figure A14b, there does not appear to be any LAM
NE for the calendar aging experiments. Moreover, no significant broadening of the peaks was observed whether in IC or DC,
Figure 7 and
Figure A14; therefore, there does not appear to be any significant kinetic limitations. This is confirmed by looking at the evolution of the RCVs,
Figure A13c,d, which remained rather stable with the exception of the cells aged at 40% fully charged. In that case, the RCV increased but it is likely because of the high LAM
PE where the PE might have become limiting for the C/6 discharge. This is an example where the limiting electrode at EOD is changing with the rate. As such, the capacity loss is solely from the LLI at C/25 but entirely from the LAM
PE at C/6.
For the LFP cells, for the same reasons as for the NMC cells, the LLI can also be directly inferred from capacity loss, FOI1. Since the NE remained limiting at EOD, the LAM
NE can be directly calculated from the change of area between the beginning of charge and the end peak B (FOI2) [
48]. For the PE, the LAM for LFP and the high-voltage layered oxide phase must be separated. Sadly, the LAM
LFP is not quantifiable because the voltage response is flat and because it is not limiting at BOD nor EOD. This was confirmed by verifying that the shape of peak C did not change, which implied that the discharges always stopped on the plateau and not in a region where the potential of LFP changed. The LAM
PEHV can be estimated for the changes in the area above 3.5 V where LFP cannot contribute any capacity (FOI2).
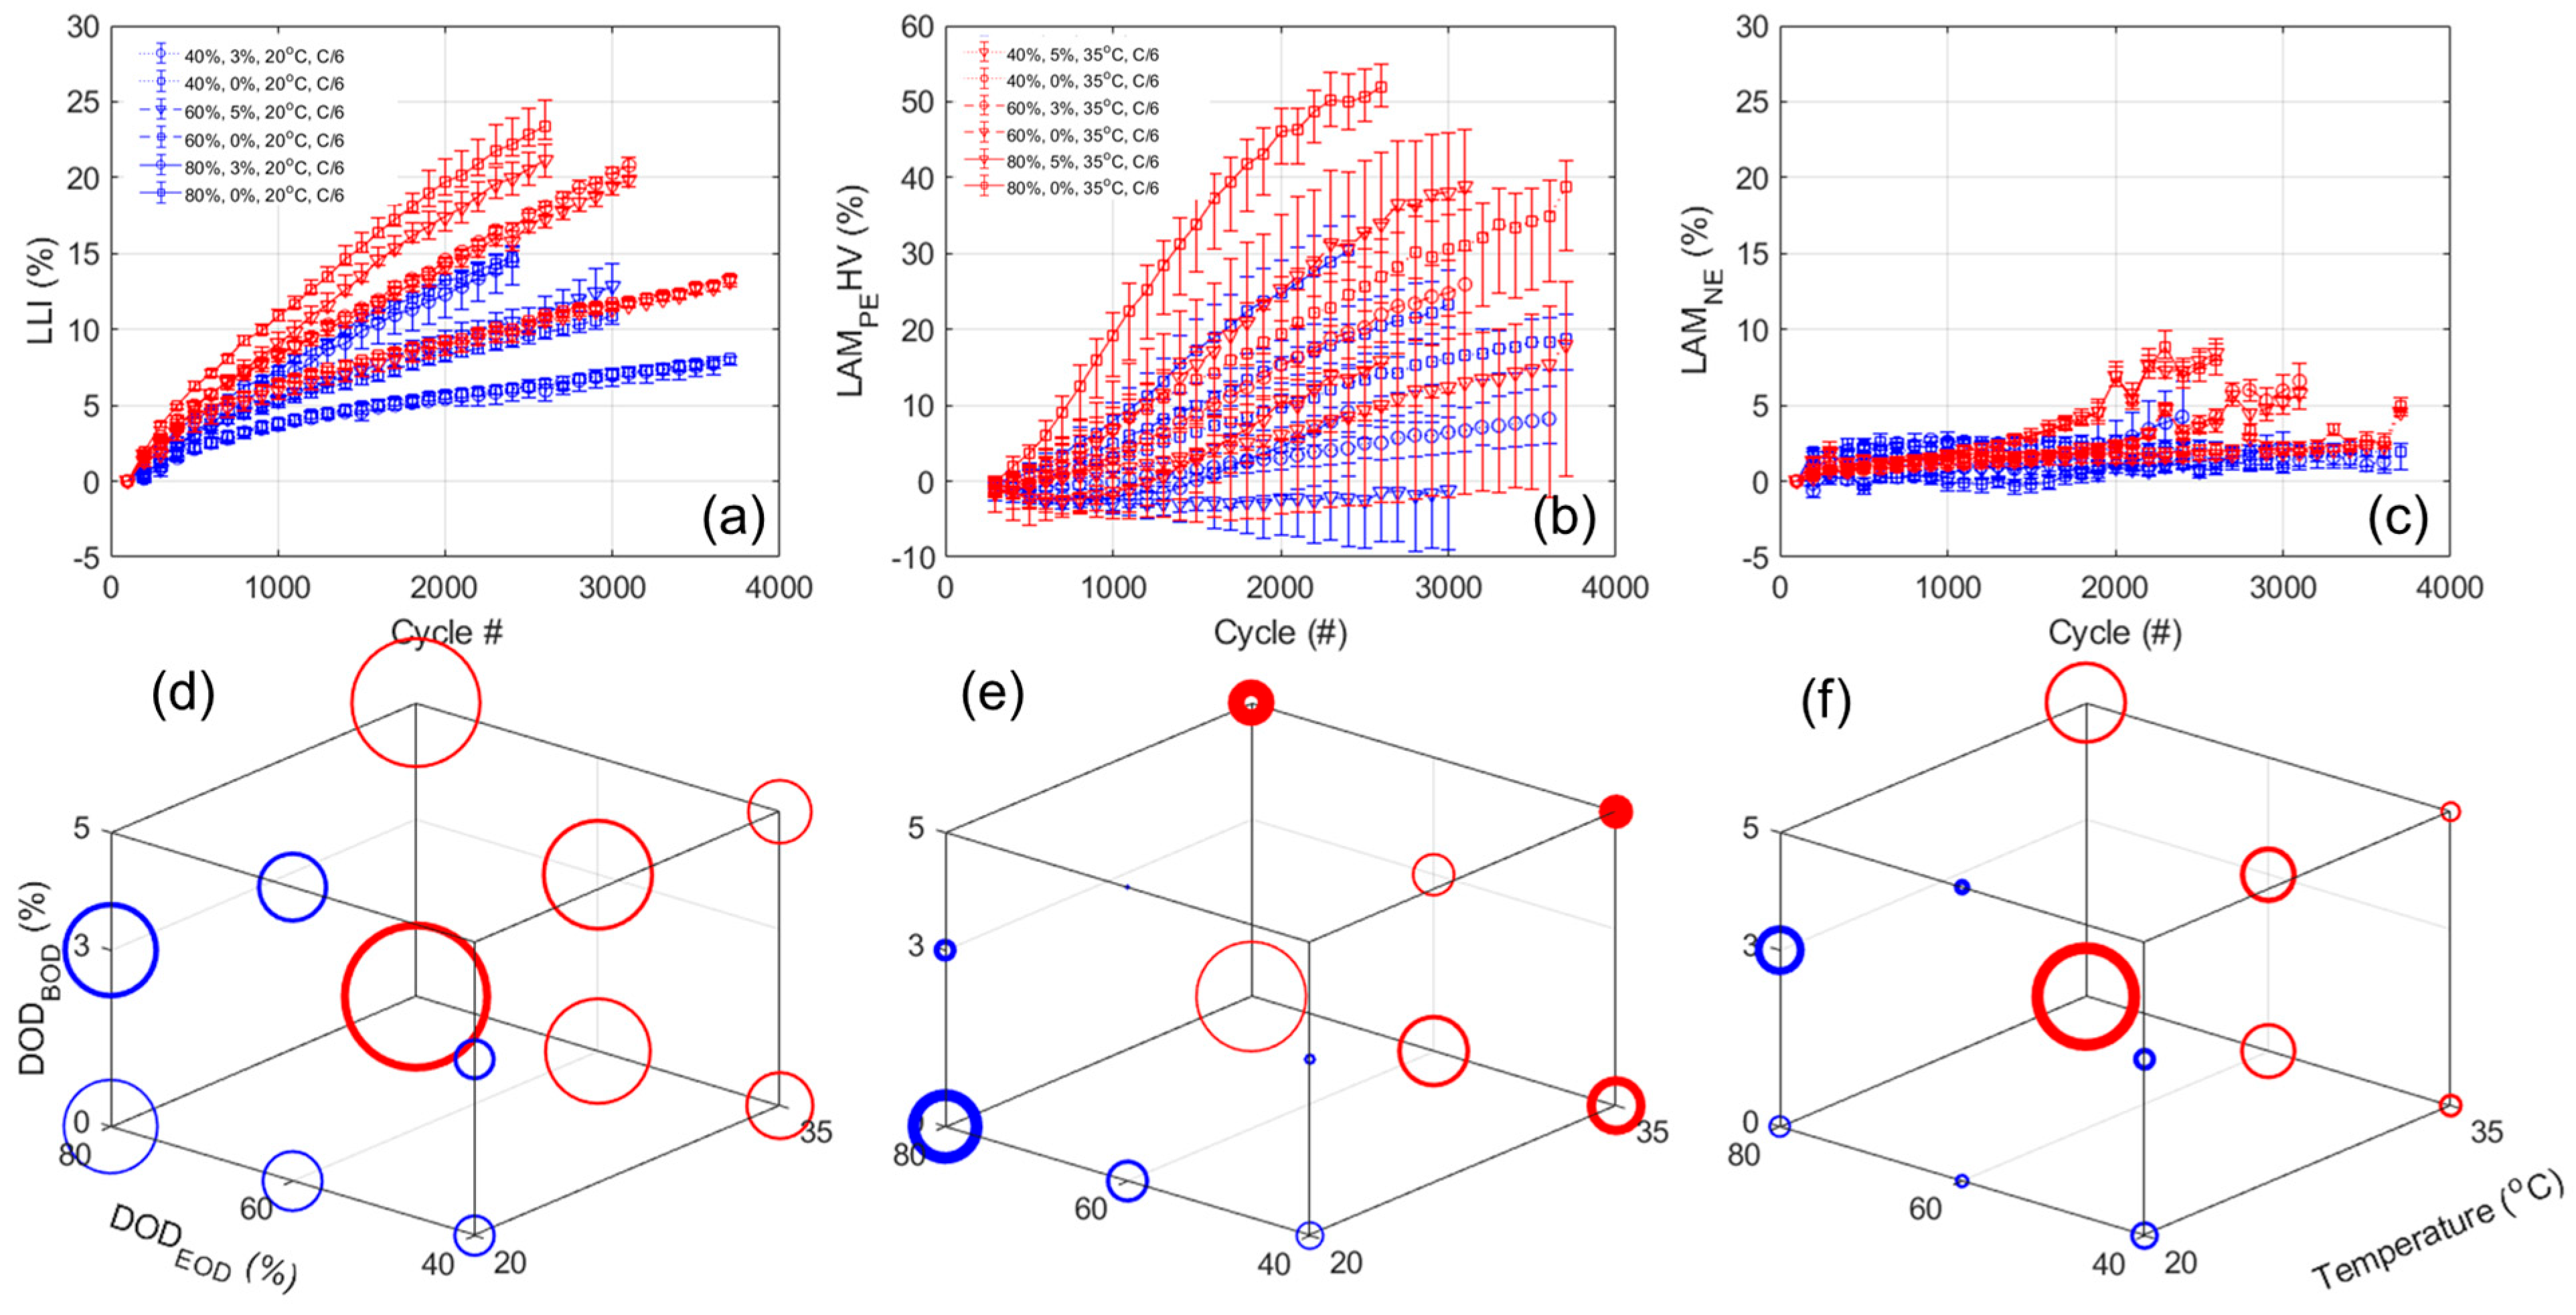
Figure 12a,b,c presents the evolution of the LLI, LAM
PEHV, and LAM
NE, respectively, versus cycle number.
Figure 12d–f presents their evolution in the 3D representation in the same order after 2300 cycles. The results for the ANOVA analysis are provided in
Table A7. Just as for the NMC cells, the LLI variations are similar to the one of the capacity losses with a bigger impact of DOD
EOD (4.75), followed by temperature (2.87) and DOD
BOD (−0.25). For the LAM
PEHV, significant losses were estimated, with up to 50% for 35 °C experiments with low DOD
BOD. The ANOVA analysis indicated a significant impact of the DOD
BOD (−11.16), close to twice as big as the impact of temperature (6.74) and DOD
BOD (5.64). Some significant combined effects were also identified, especially between the DODs (−5.43). Interestingly, some conditions did not seem to introduce any loss and even a gain of active material (e.g., up to 60% DOD from 5% at 20 °C). This is likely induced by the impact of the LLI. Indeed, with the LLI, the NE is pushed towards higher SOC, therefore its potential towards EOC will increase. As a result, the PE cutoff potential will also increase to match the cutoff voltage and more of the HV phase will be used. Looking into the LAM
NE, it appeared quite limited (<3%) for all 20 °C experiments but seemed to accelerate for the 35 °C one after 1000 cycles (up to 10% in the worst case). The ANOVA analysis indicated a similar impact for the temperature and DOD
EOD (1.5 and 1.80) and almost no impact of the DOD
BOD (−0.21), without any combined effects. Finally, no kinetic limitations were observed on the voltage response of the cells nor on the evolution of the RCVs.
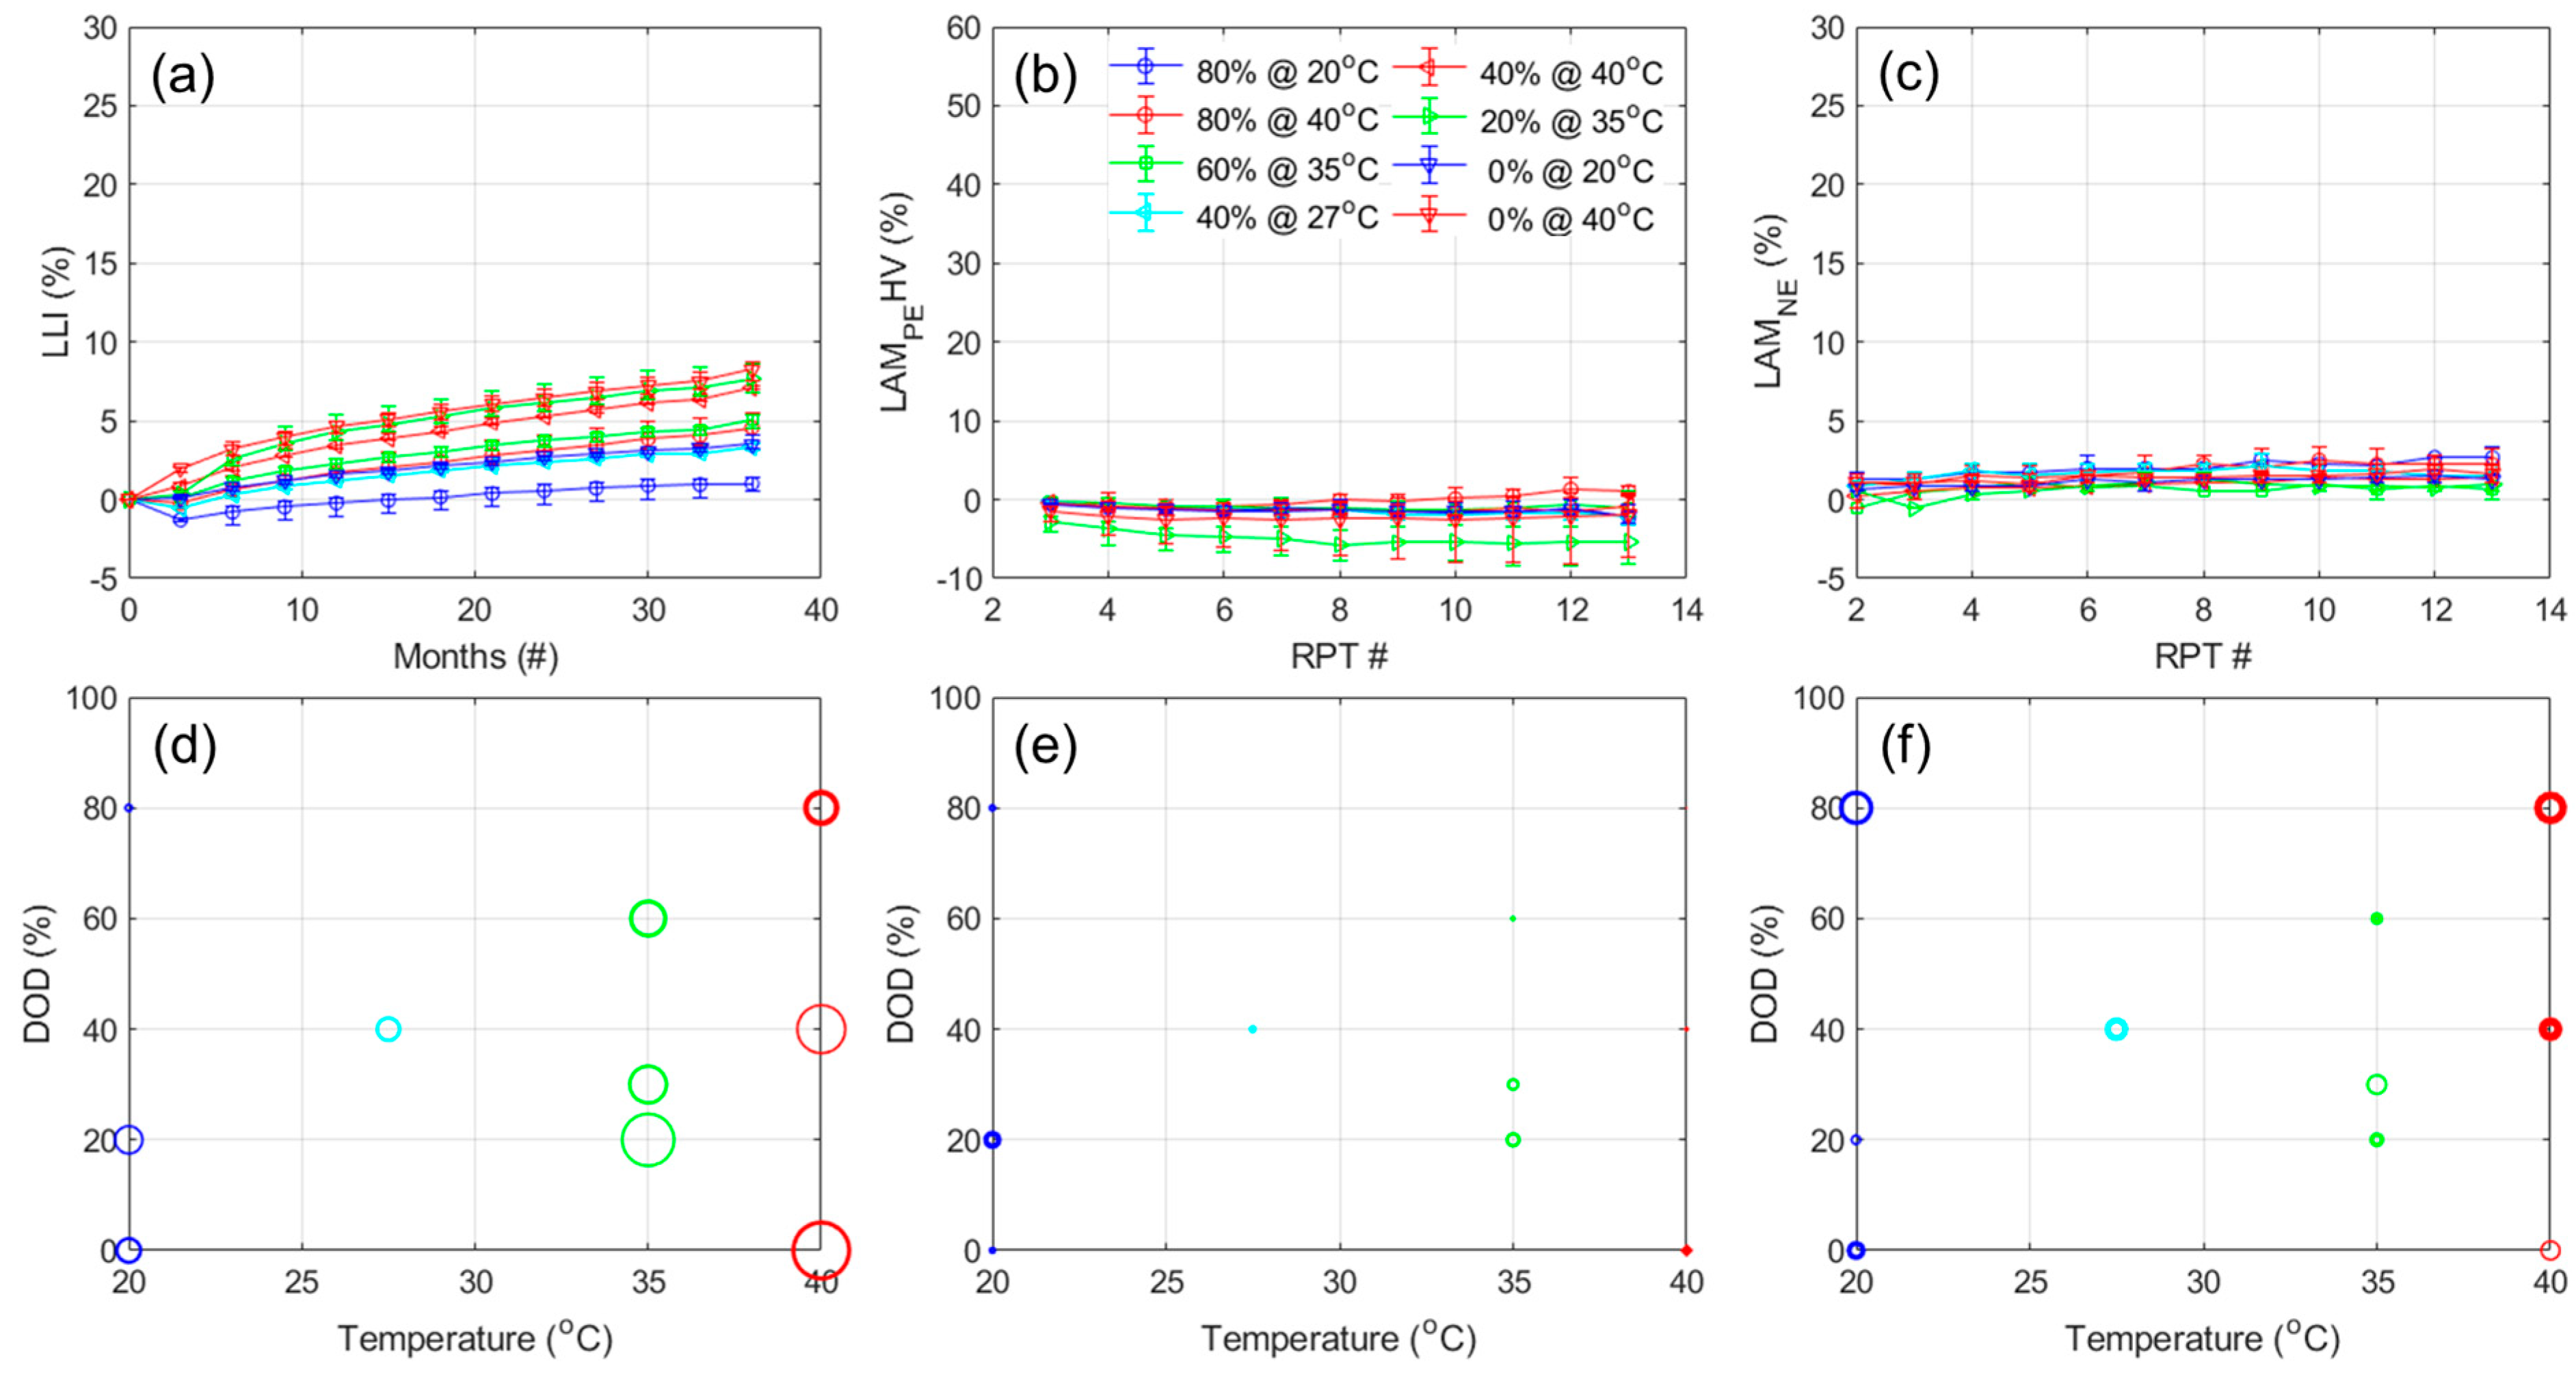
Figure 13 presents the results for the LFP calendar aging experiment. The results for the ANOVA analysis are provided in
Table A8. The LLI evolution matched the capacity loss with a maximum below 10% after three years of calendar aging, fully charged at 40 °C. The biggest impact was the one of temperature (2.33) over DOD (−1.67). The LAM
PEHV seemed to mostly decrease with aging, likely for the same reason mentioned above. No statistically sound model was found to cover the observed variations (
p-value > 0.36). The LAM
NE was really limited and stayed below 3% independently of the conditions. With all the values being close, no statistically significant model was found (
p-value of 0.14 minimum). Finally, similar to the cycle aging experiment and the calendar one for the NMC cells, no significant kinetic limitations were detected.


