Article

New Insight into the Phylogeny and Taxonomy of Cultivated and Related Species of Crataegus in China, Based on Complete Chloroplast Genome Sequencing

1
Beijing Academy of Forestry and Pomology Sciences, Beijing Academy of Agriculture and Forestry Sciences, Beijing 100093, China
2
National Resource Center for Chinese Materia Medica, China Academy of Chinese Medical Sciences, Beijing 100700, China
3
College of Horticulture, Shenyang Agricultural University, Shenyang 110866, China
*
Authors to whom correspondence should be addressed.
Guanglong Hu and Yiheng Wang contributed equally to this work.
Horticulturae 2021, 7(9), 301; https://doi.org/10.3390/horticulturae7090301
Submission received: 28 July 2021 / Revised: 1 September 2021 / Accepted: 7 September 2021 / Published: 9 September 2021
(This article belongs to the Section Genetics, Genomics, Breeding, and Biotechnology (G2B2))

Abstract

:
Hawthorns (Crataegus L.) are one of the most important processing and table fruits in China, due to their medicinal properties and health benefits. However, the interspecific relationships and evolution history of cultivated Crataegus in China remain unclear. Our previously published data showed C. bretschneideri may be derived from the hybridization of C. pinnatifida with C. maximowiczii, and that introgression occurs between C. hupehensis, C. pinnatifida, and C. pinnatifida var. major. In the present study, chloroplast sequences were used to further elucidate the phylogenetic relationships of cultivated Crataegus native to China. The chloroplast genomes of three cultivated species and one related species of Crataegus were sequenced for comparative and phylogenetic analyses. The four chloroplast genomes of Crataegus exhibited typical quadripartite structures and ranged from 159,607 bp (C. bretschneideri) to 159,875 bp (C. maximowiczii) in length. The plastomes of the four species contained 113 genes consisting of 79 protein-coding genes, 30 tRNA genes, and 4 rRNA genes. Six hypervariable regions (ndhC-trnV(UAC)-trnM(CAU), ndhA, atpH-atpI, ndhF, trnR(UCU)-atpA, and ndhF-rpl32), 196 repeats, and a total of 386 simple sequence repeats were detected as potential variability makers for species identification and population genetic studies. In the phylogenomic analyses, we also compared the entire chloroplast genomes of three published Crataegus species: C. hupehensis (MW201730.1), C. pinnatifida (MN102356.1), and C. marshallii (MK920293.1). Our phylogenetic analyses grouped the seven Crataegus taxa into two main clusters. One cluster included C. bretschneideri, C. maximowiczii, and C. marshallii, whereas the other included C. hupehensis, C. pinnatifida, and C. pinnatifida var. major. Taken together, our findings indicate that C. maximowiczii is the maternal origin of C. bretschneideri. This work provides further evidence of introgression between C. hupehensis, C. pinnatifida, and C. pinnatifida var. major, and suggests that C. pinnatifida var. major might have been artificially selected and domesticated from hybrid populations, rather than evolved from C. pinnatifida.

1. Introduction

The plants from genus Crataegus L. (hawthorn), a member of the Rosaceae family, are widely distributed in Eurasia and North America [1]. Hawthorns are one of the most widely consumed horticultural crops in China, either in fresh or processed form, due to their pleasant flavor, attractive color, and rich nutrition [2,3]. In addition, hawthorn is an important raw material for functional foods and has been used as herbal medicines in the Chinese Pharmacopeia [4,5]. Up to date, over 150 biologically active compounds, such as phenols, oligomeric procyanidins, and flavonoids, have been identified in hawthorn [6,7]. These bioactive compounds have been proved to be curative in the treatment and prevention of cardiovascular and cerebrovascular diseases by laboratory tests and clinical trials [8,9].
As one of the main centers of Crataegus origin and cultivation, China has a long history of cultivating and collecting hawthorns. Based upon cladistic analyses of morphological traits, 18 species and six varieties of Crataegus have been confirmed and identified by researchers [10,11], other researchers recognize 20 species of Chinese Crataegus and seven varieties [12]. Among these species, valuable cultivated varieties are mainly derived from C. pinnatifida, C. hupehensis, C. scabrifolia, and C. bretschneideri. Up to now, the primary cultivated species is C. pinnatifida, and its variation C. pinnatifida var. major, which are native to northern China and produce large-sized fruit [13]. Crataegusbretschneideri, originated from Changbaishan Massif of China, is mainly distributed in northeast and inner Mongolia area of China [10]. It is an important germplasm of Crataegus in China, with the characteristics of high yield, early-maturing and cold resistance.
C. bretschneideri is very analogous to C. pinnatifida in morphology, and the former species is considered to be a variant of the latter [14]. On the basis of inter-simple sequence repeat (SSR) markers and isoenzyme analysis, researchers suggest that C. bretschneideri is closely related to C. pinnatifida [15,16]. C. pinnatifida var. major has always been considered to be artificially selected and domesticated from C. pinnatifida [10]. Nevertheless, in our previous study, specific locus amplified fragment sequencing revealed that C. bretschneideri was derived from the hybridization of C. pinnatifida with C. maximowiczii, and that introgression might occur between C. pinnatifida, C. pinnatifida var. major, and C. hupehensis [17]. So far, a consensus is lacking regarding the origin and classification of C. bretschneideri and C. pinnatifida var. major. Moreover, genomic resources for Crataegus are currently lacking, which presents an obstacle for research into the taxonomy, genetics, identification, and conservation of Crataegus species.
The chloroplast is an important plastid that is involved in plant cell for nitrogen fixation; photosynthesis; and the biosynthesis of fatty acids, amino acids, starch, and pigment [18,19]. Chloroplasts have their own DNA [20], often referred as cpDNA. Compared to nuclear genomes, chloroplast genomes have compact size and many copies per cell, facilitating thorough sequencing [21]. The chloroplast genomes of angiosperms usually have a typical circular structure ranging from 115 to 116 kb in length and consist of a large single-copy (LSC) and a small single-copy (SSC) region, which are separated by two large inverted repeats (IR) [22,23]. The maternal inheritance characteristic, low nucleotide substitution rates, very low recombination, and haploidy of chloroplast genomes have made them popular tools for studying plant evolutionary relationships at almost all taxonomic levels [24,25,26,27]. Recent development in next-generation sequencing methods has made chloroplast genome sequencing faster andcheaper. Entire chloroplast genomes are increasingly being used for phylogenetic analyses, enhancing our understanding of complex evolutionary relationships at different level [28,29,30,31].
In the present study, based on our previously published report, the plastomes of three cultivated and one related species of Crataegus (C. bretschneideri, C. pinnatifida, C. pinnatifida var. major, and C. maximowiczii) were sequenced for comparative and phylogenetic analyses via next-generation Illumina genome analyzer platform. For the phylogenomic analyses, we gained the entire chloroplast genomes of three published Crataegus species from the GenBank database: C. hupehensis (MW 201730.1), C. pinnatifida (MN102356.1), and C. marshallii (MK920293.1). Our study aims were to analyze the whole chloroplast genomes of C. pinnatifida, C. bretschneideri, C. maximowiczii, and C. pinnatifida var. major, to reassess the previous morphology-based classification of C. bretschneideri, and to elucidate the phylogenetic relationships between C. pinnatifida, C. bretschneideri, C. hupehensis, C. pinnatifida var. major, and C. maximowiczii using chloroplast genome sequence data. Furthermore, we examined variations in repeat sequences and microsatellites among the four Crataegus chloroplast genomes and screened the sequences for divergence hotspot regions. Our results will provide vital information for species identification and in understanding the phylogenetic relationship and evolutionary classification within the Crataegus genus. This will assist in the protection and utilization of Crataegus germplasm resources.

2. Materials and Methods

2.1. Plant Material and DNA Extraction

Samples of leaf materialstender, healthy fresh leaves of C. bretschneideri, C. pinnatifida var. major, C. maximowiczii, and C. pinnatifida were collected from National Germplasm Repository for Crataegus, Shenyang, Liaoning Province, China.Biogeographic regions and sample collection sites of the four Crataegus species are shown in Table 1. A modified cetyltrimethylammonium bromide (CTAB) protocol was used to isolate DNA [32]. Subsequently, the concentration of DNA was checked by a NanoDrop spectrophotometer.

2.2. Chloroplast Genome Sequencing, Assembly, Annotation, and Visualization

The genomic DNAs was purified and end-repaired. The PCR products were used to build a 300 bp insert size library using Illumina Nextera XT. The complete chloroplast genomes of the four Crataegus species were sequenced using Illumina high-throughput sequencing platform (HiSeq 4000). After sequencing, the raw reads were assembled into whole chloroplast genomes in a multi-step approach employing a pipeline that involved a combination of both reference guided and de novo assembly approaches. First, paired-end sequence reads were trimmed to remove adaptors and low-quality sequences using Trimmomatic 0.39 [33] with the following parameters: LEADING = 20, TRAILING = 20, SLIDINGWINDOW = 4:15, MINLEN = 36, and AVGQUAL = 20. Second, contigs were assembled from the high quality paired-end reads by using SPAdes software version 3.6.1 [34] (Kmer = 95). Third, the relative order and orientation of the chloroplast genome contigs were determined by BLAST searches against the chloroplast genome of C. hupehensis (MW201730) [35]. Subsequently, the selected chloroplast-like contigs were assembled with Sequencher 4.10. (https://www.genecodes.com/, accessed on 2 June 2021). Then, the Crataegus chloroplast genomes were manually edited and annotated with the command-line Perl script Plann [36]. Comparison with C. hupehensis (MW201730)’s homologous genes determined intron positions, putative starts and stops, and initial annotation. Finally, a circular map of the chloroplast genome was illustrated using Genome Vx [37]. Default parameters were used for SPAdes, BLASTing, Sequencher 4.10, Plann, and Genome Vx.

2.3. Analysis of Microsatellites and Repeat Sequences

The MIcroSAtellite program (MISA) (http://pgrc.ipk-gatersleben.de/misa/misa.html, accessed on 15 June 2021) was applied to identified SSRs in the Crataegus chloroplast genomes. The repeat number thresholds were set as follows: Three repeat units for tetra-, penta-, and hexa-nucleotid; four repeat units for trinucleotide; five repeat units for dinucleotide; and 10 repeat units for mononucleotide SSR motifs, respectively. REPuter (https://bibiserv.cebitec.uni-bielefeld.de/reputer, accessed on 15 June 2021) software was used to find and analyze the size and the positions of repeats (forward, complement, palindromic, and reverse) within the Crataegus chloroplast genomes [38].

2.4. Variation Hotspots Detection and Sequence Divergence Analysis

The four Crataegus chloroplast genomes were aligned by MAFFT software version 7 [39] with default parameters and adjusted manually where necessary. Sliding window analysis was conducted in DnaSP software version 6.0 [40] to evaluate plastomic nucleotide variability. The window length was set to 600 bp, while the step size was set to 100 bp. MEGA 7.0 software [41] was used to determine the variable and parsimony-informative base sites in the LSC, SSC, and IR regions of the four Crataegus chloroplast genomes, as well as the whole chloroplast genomes.The p-distances among four Crataegus chloroplast genomes was calculated to assess divergence of Crataegus species with MEGA software.

2.5. Comparative Genome Analysis

mVISTA software [42] was used to compare the complete chloroplast genomes of the four Crataegus species. C. bretschneideri was regarded as the reference sequence. On the basis of annotations, the chloroplast genome borders between the IR, LSC and SSC, and IR regions of the four Crataegus species were also compared and illustrated.

2.6. Phylogenomic Analysis

The Bayesian inference (BI) and maximum likelihood (ML) methods wereemployed to plot phylogenetic trees with the complete chloroplast genomes. The entire chloroplast genomes sequences of seven species of Crataegus and another 25 plastomes of species of Maloideae were used in the phylogenetic analyses, with four plastomes of the sister group Rosoideae as an outgroup. The best-fitting substitution model GTR+F+I+G4 was employed using Modelfinder [43] on the basis of Bayesian information criterion. IQ-TREE software was used to perform ML calculations [44]. Bootstrap analysis was conducted with 1000 replicates. BI analysis was conducted by MrBayes software. Bayesian analysis was run for 10,000,000 generations with sampling trees every 1000 generations and the first 25% were removed as burn-in. The average standard deviation of the split frequencies was >0.01.

3. Results

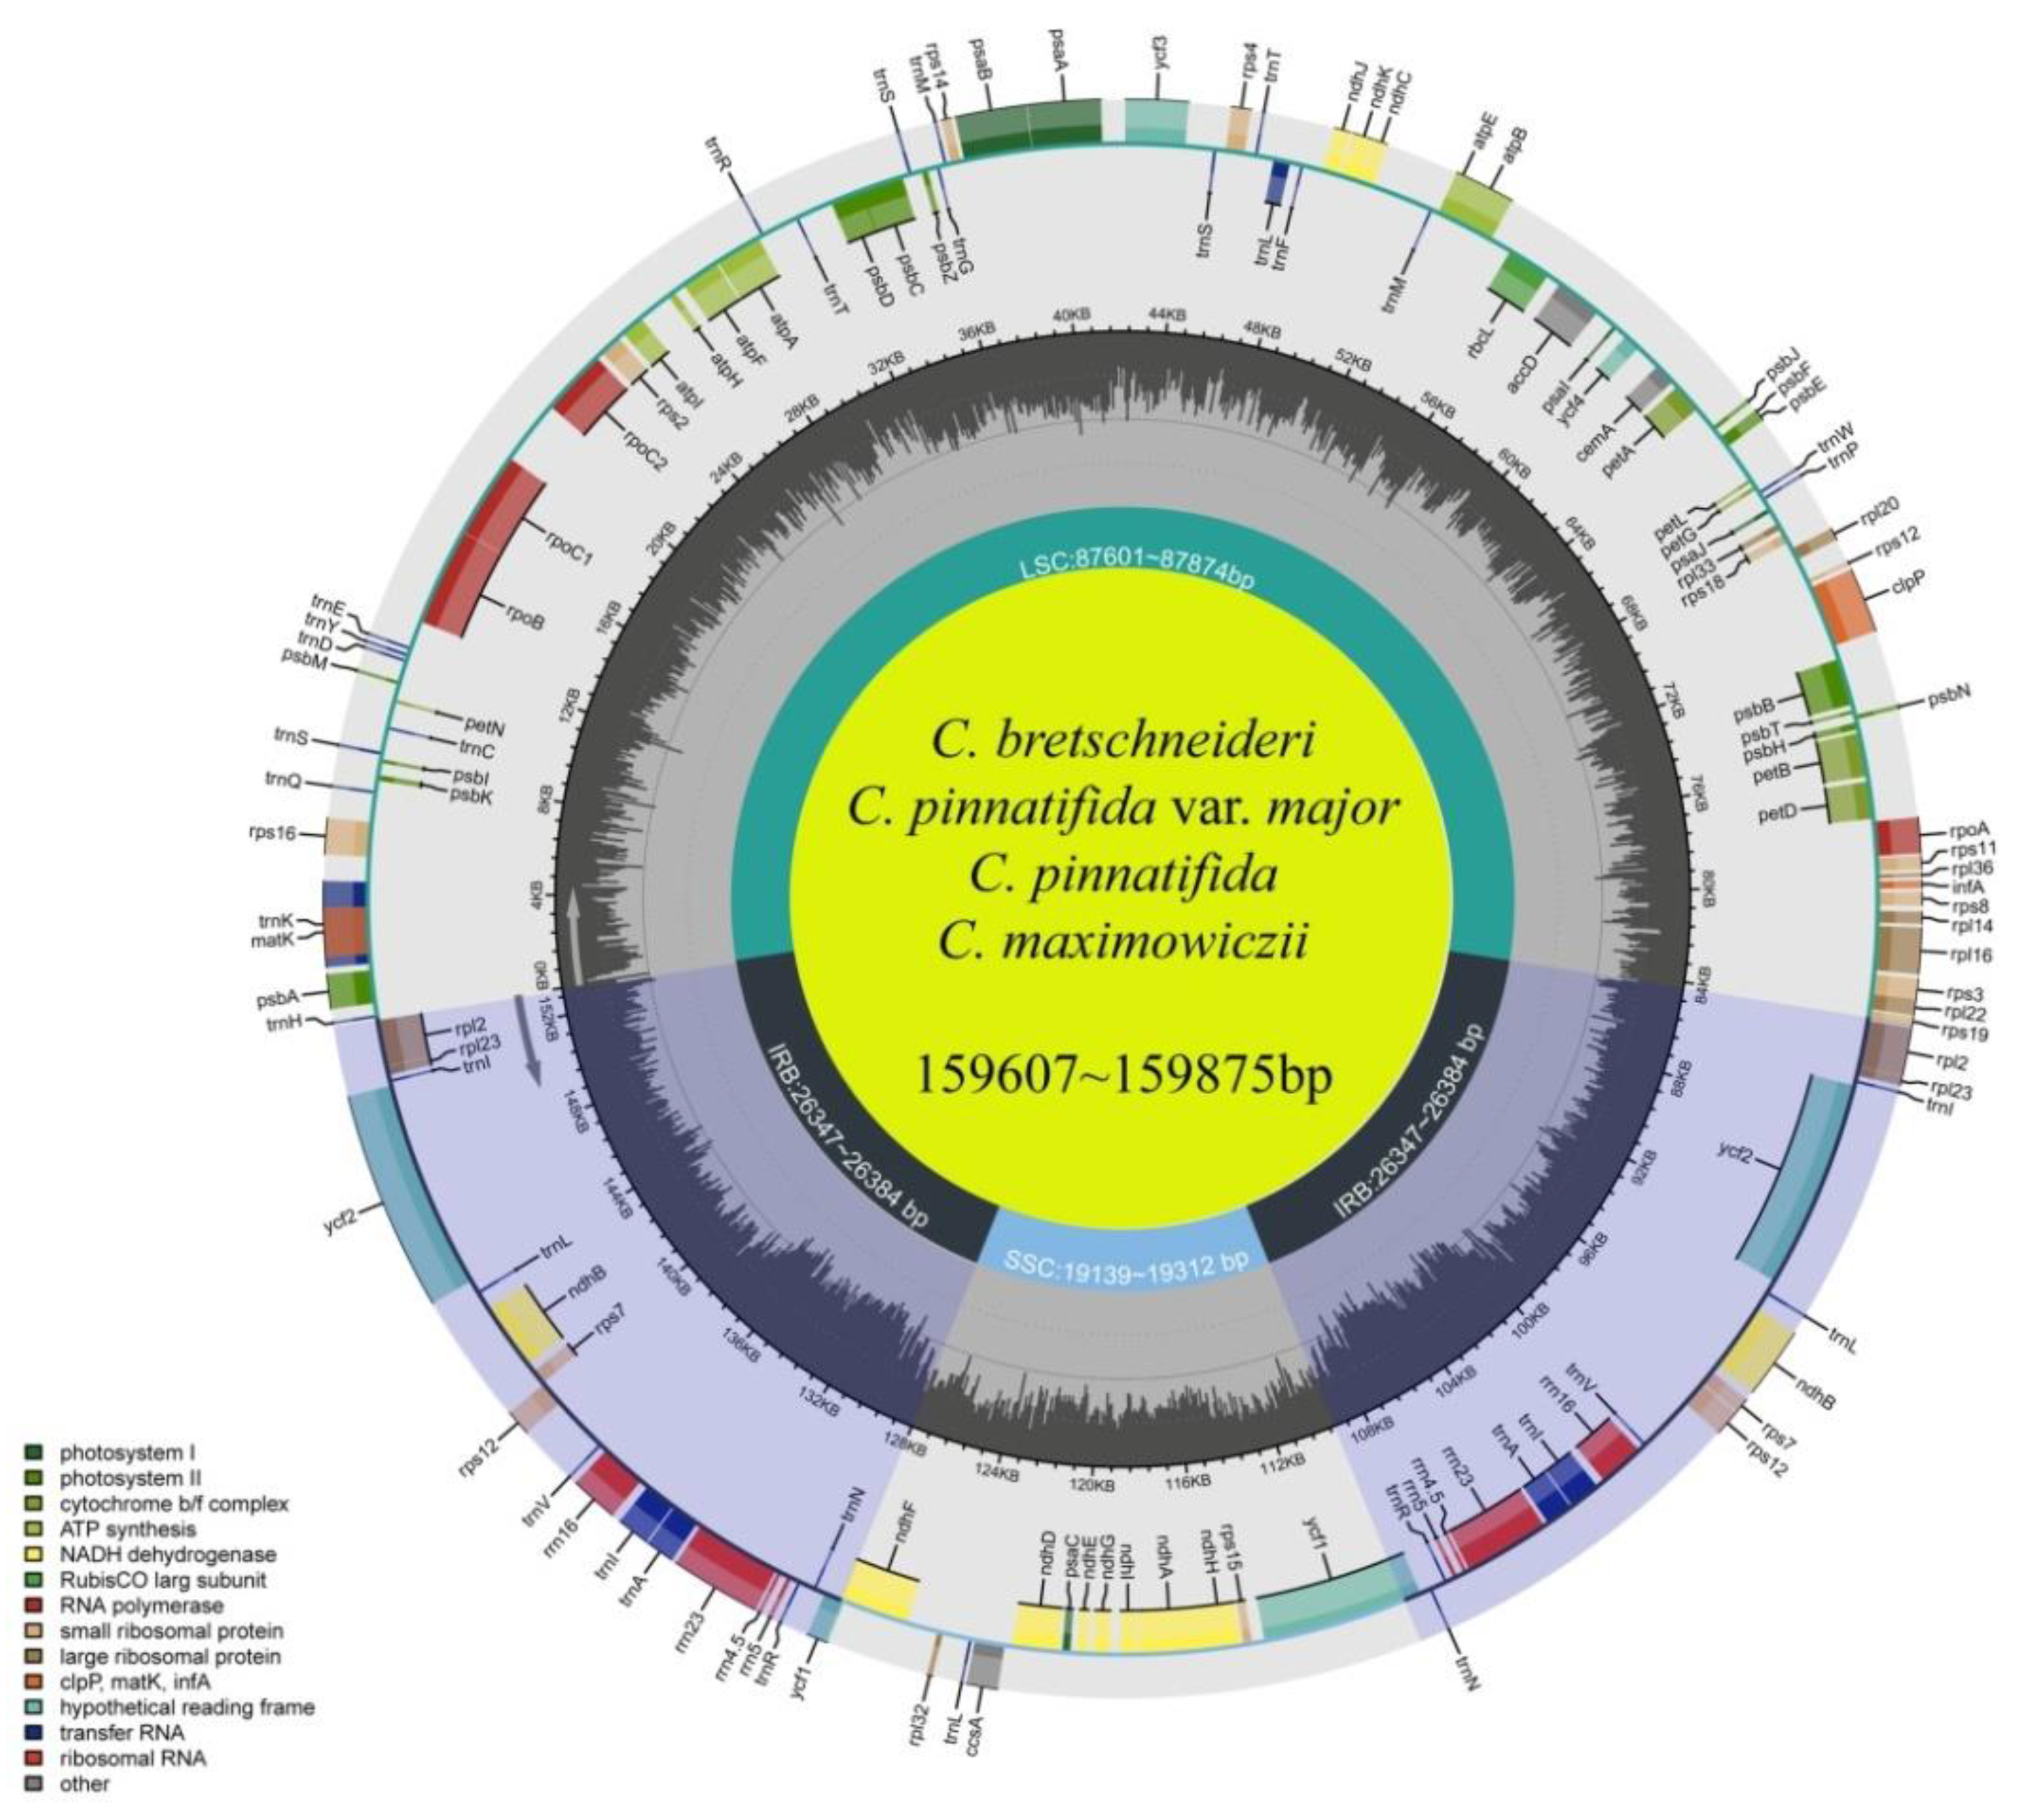
3.1. Genome Organization and Features

The complete chloroplast genome sequences of the four Crataegus species were similar in size, ranging from 159,607 bp for C. bretschneideri to 159,875 bp for C. maximowiczii (Figure 1; Table 2). All four chloroplast genomes contained a typical quadripartite structure and is composed of a pair of IRs (26,347–26,384 bp), which are separated by LSC (87,601–87,874 bp) and SSC (19,139–19,312 bp) regions. The fully annotated genome sequences have been submitted to the GenBank database (accession numbers, MW963339 for C. bretschneideri, MZ494512 for C. maximowiczii, MZ494514 for C. pinnatifida, and MZ494513 for C. pinnatifida var. major).
Results of the genome annotation revealed a total of 113 genes in the four chloroplast genomes of Crataegus, consisting of 79 coded proteins, fourribosomal RNA, and 30 tRNA genes (Figure 1; Table 3). The overall GC content of the four Crataegus plastomes is 36.6–36.7%, andthe GC contents of the LSC, SSC and IR regions are 34.3–34.4%, 30.3–30.6%, and 42.6–42.7%, respectively (Table 2), indicating highly similar GC contents among the four species. The GC contents of the Crataegus plastomes are analogous to those of other members of the Maloideae subfamily.
Among the pair of inverted repeats, four rRNA genes, seven tRNA genes, and eightprotein genes are presented in the IRb repeat in SSC region (Figure 1; Table 3). Fourteen genes have one single intron while twogenes have two introns (clpP and ycf3) (Figure 1; Table 3). The rps12 gene was found to be a trans-spliced gene. Its 5′-end exon is located in the LSC region and its 3′-end is duplicated in the IR region (Figure 2). The trnK-UUU gene has the longest intron, and ycf1 has the shortest intron.

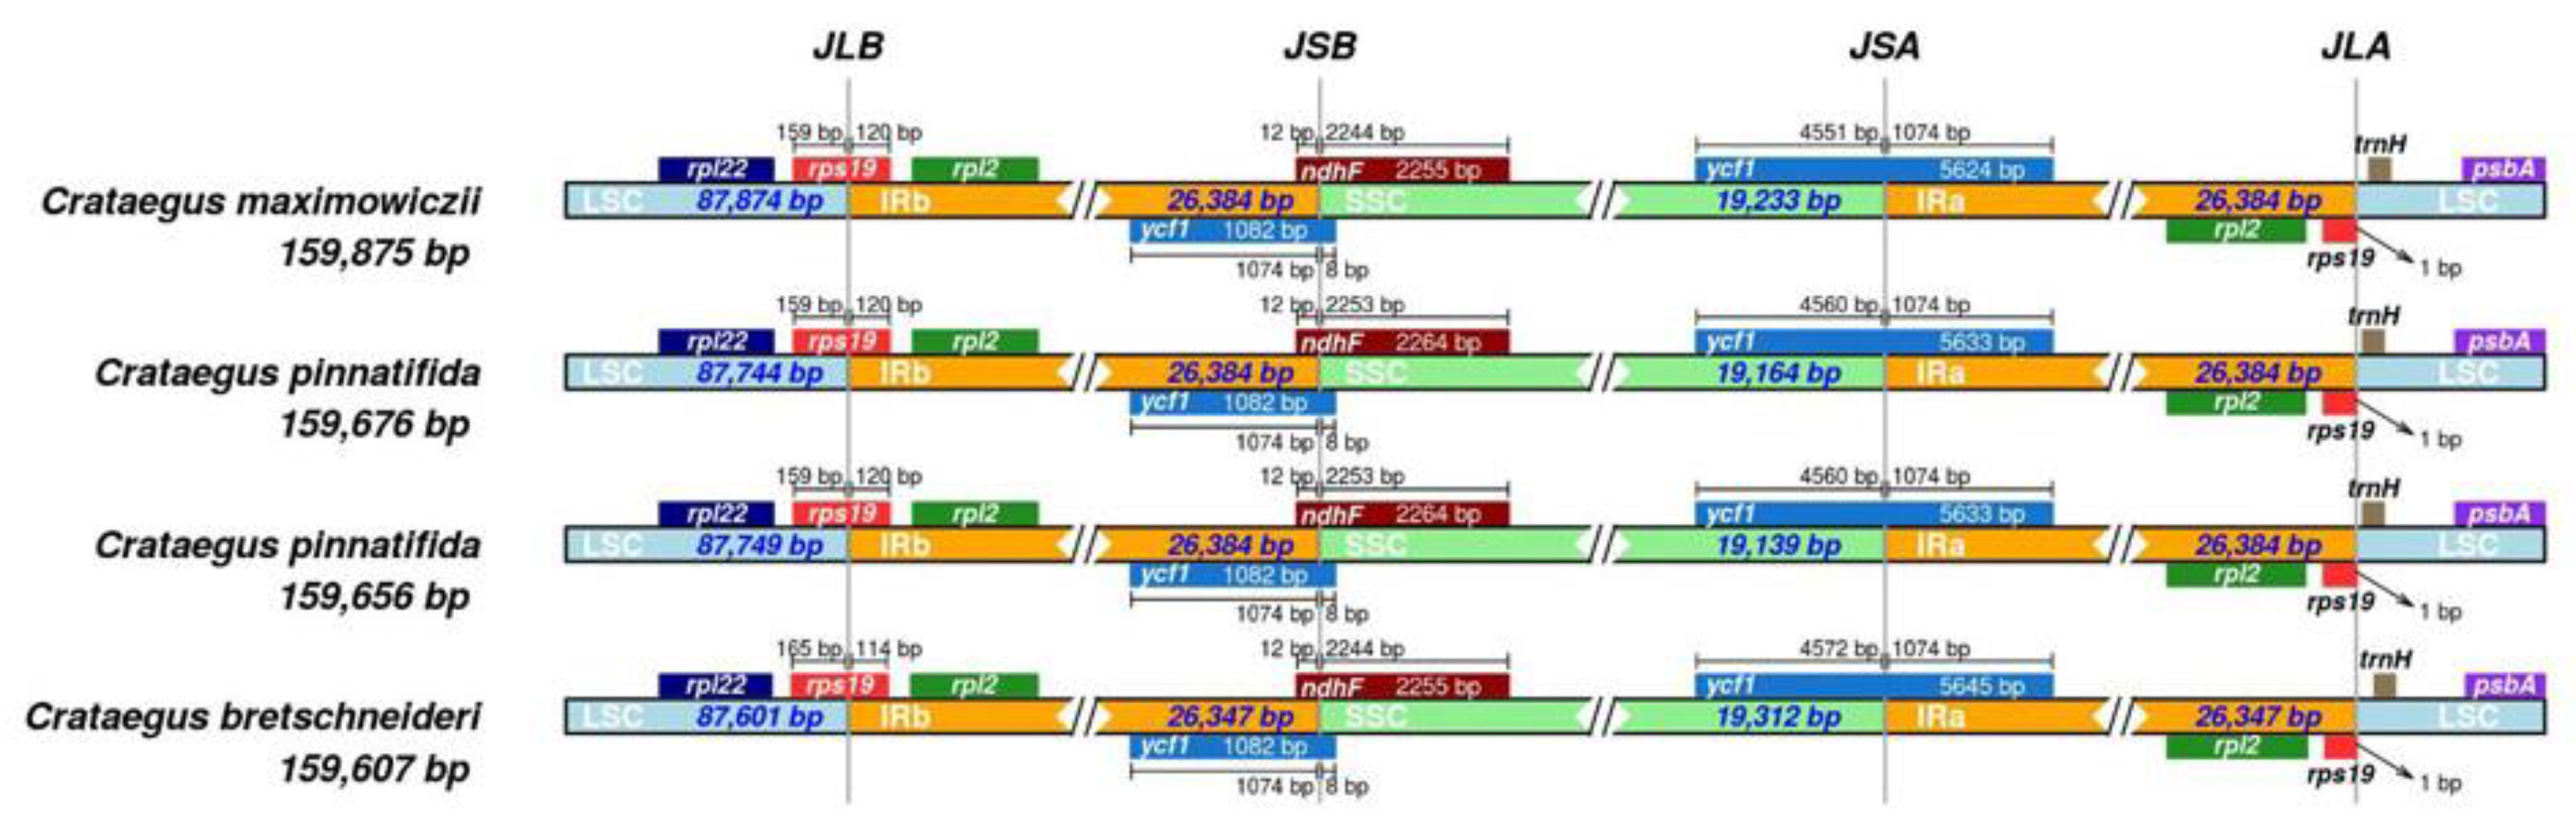
3.2. IR Expansion and Shrinkage

Expansion and shrinkage of the inverted repeats region is a crucial aspect of the plastomes, which is the significant reason for the different sizes of the plastomes and can be used for phylogenetic study in plants. Additionally, the expansion and shrinkage of IR boundaries are evolutionary events that result in variation of chloroplast genome size. Comparison details of the IR-LSC and IR-SSC borders of the four Crataegus plastomes are shown in Figure 2. The LSC-IRa boundary is indicated by the presence of the rps19 gene. In C. pinnatifida, C. maximowiczii, and C. pinnatifida var. major, 159 bp of the rps19 gene can be found in the LSC region. However, in C. bretschneideri, 165 bp of rps19 are located within the LSC region. The SSC-IRa boundary is characterized by two genes—ycf1 (fragmented) and ndhF—which exhibit overlapping coding regions (Figure 2). The overlap of these two genes is conserved (20 bp) in each of the four Crataegus chloroplast genomes (Figure 2). ndhF is situated in the SSC region and 2244–2253 bp in length. In the four Crataegus chloroplast genomes, the SSC-IRb junction contains the full-length ycf1 gene, whereas the SSC-IRb junction contains the rps19 (fragmented) and trnH genes (Figure 2).

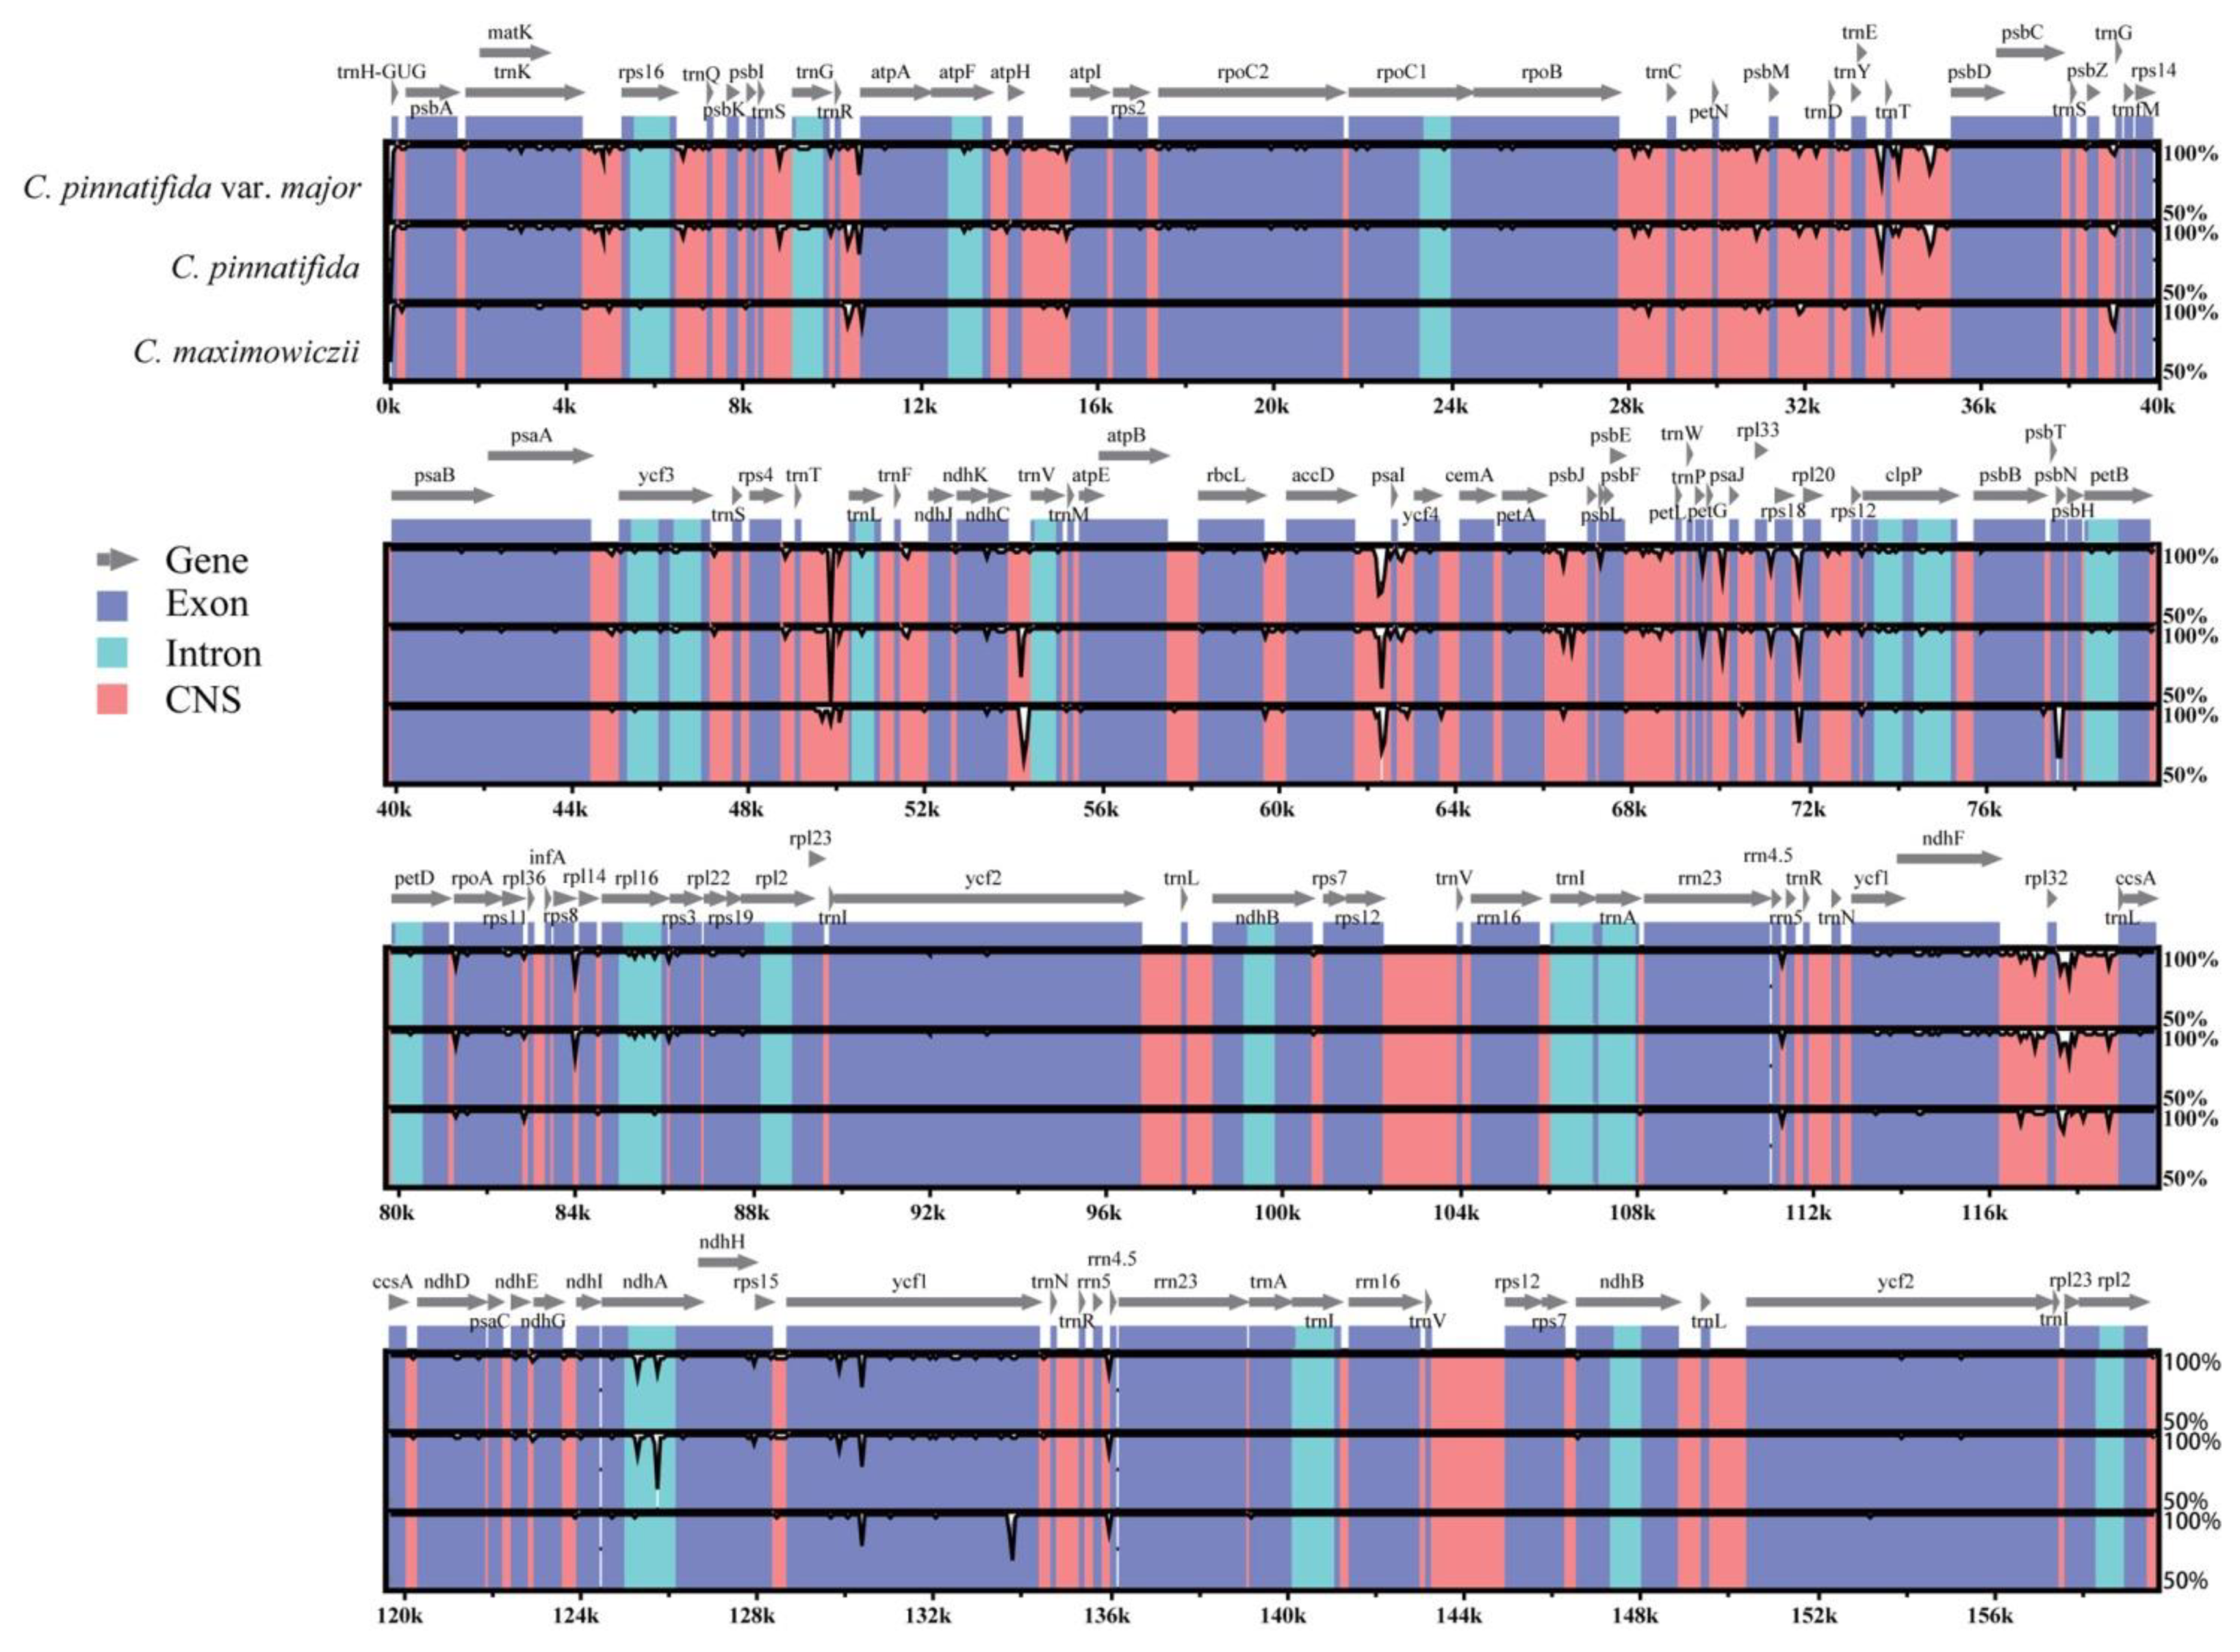
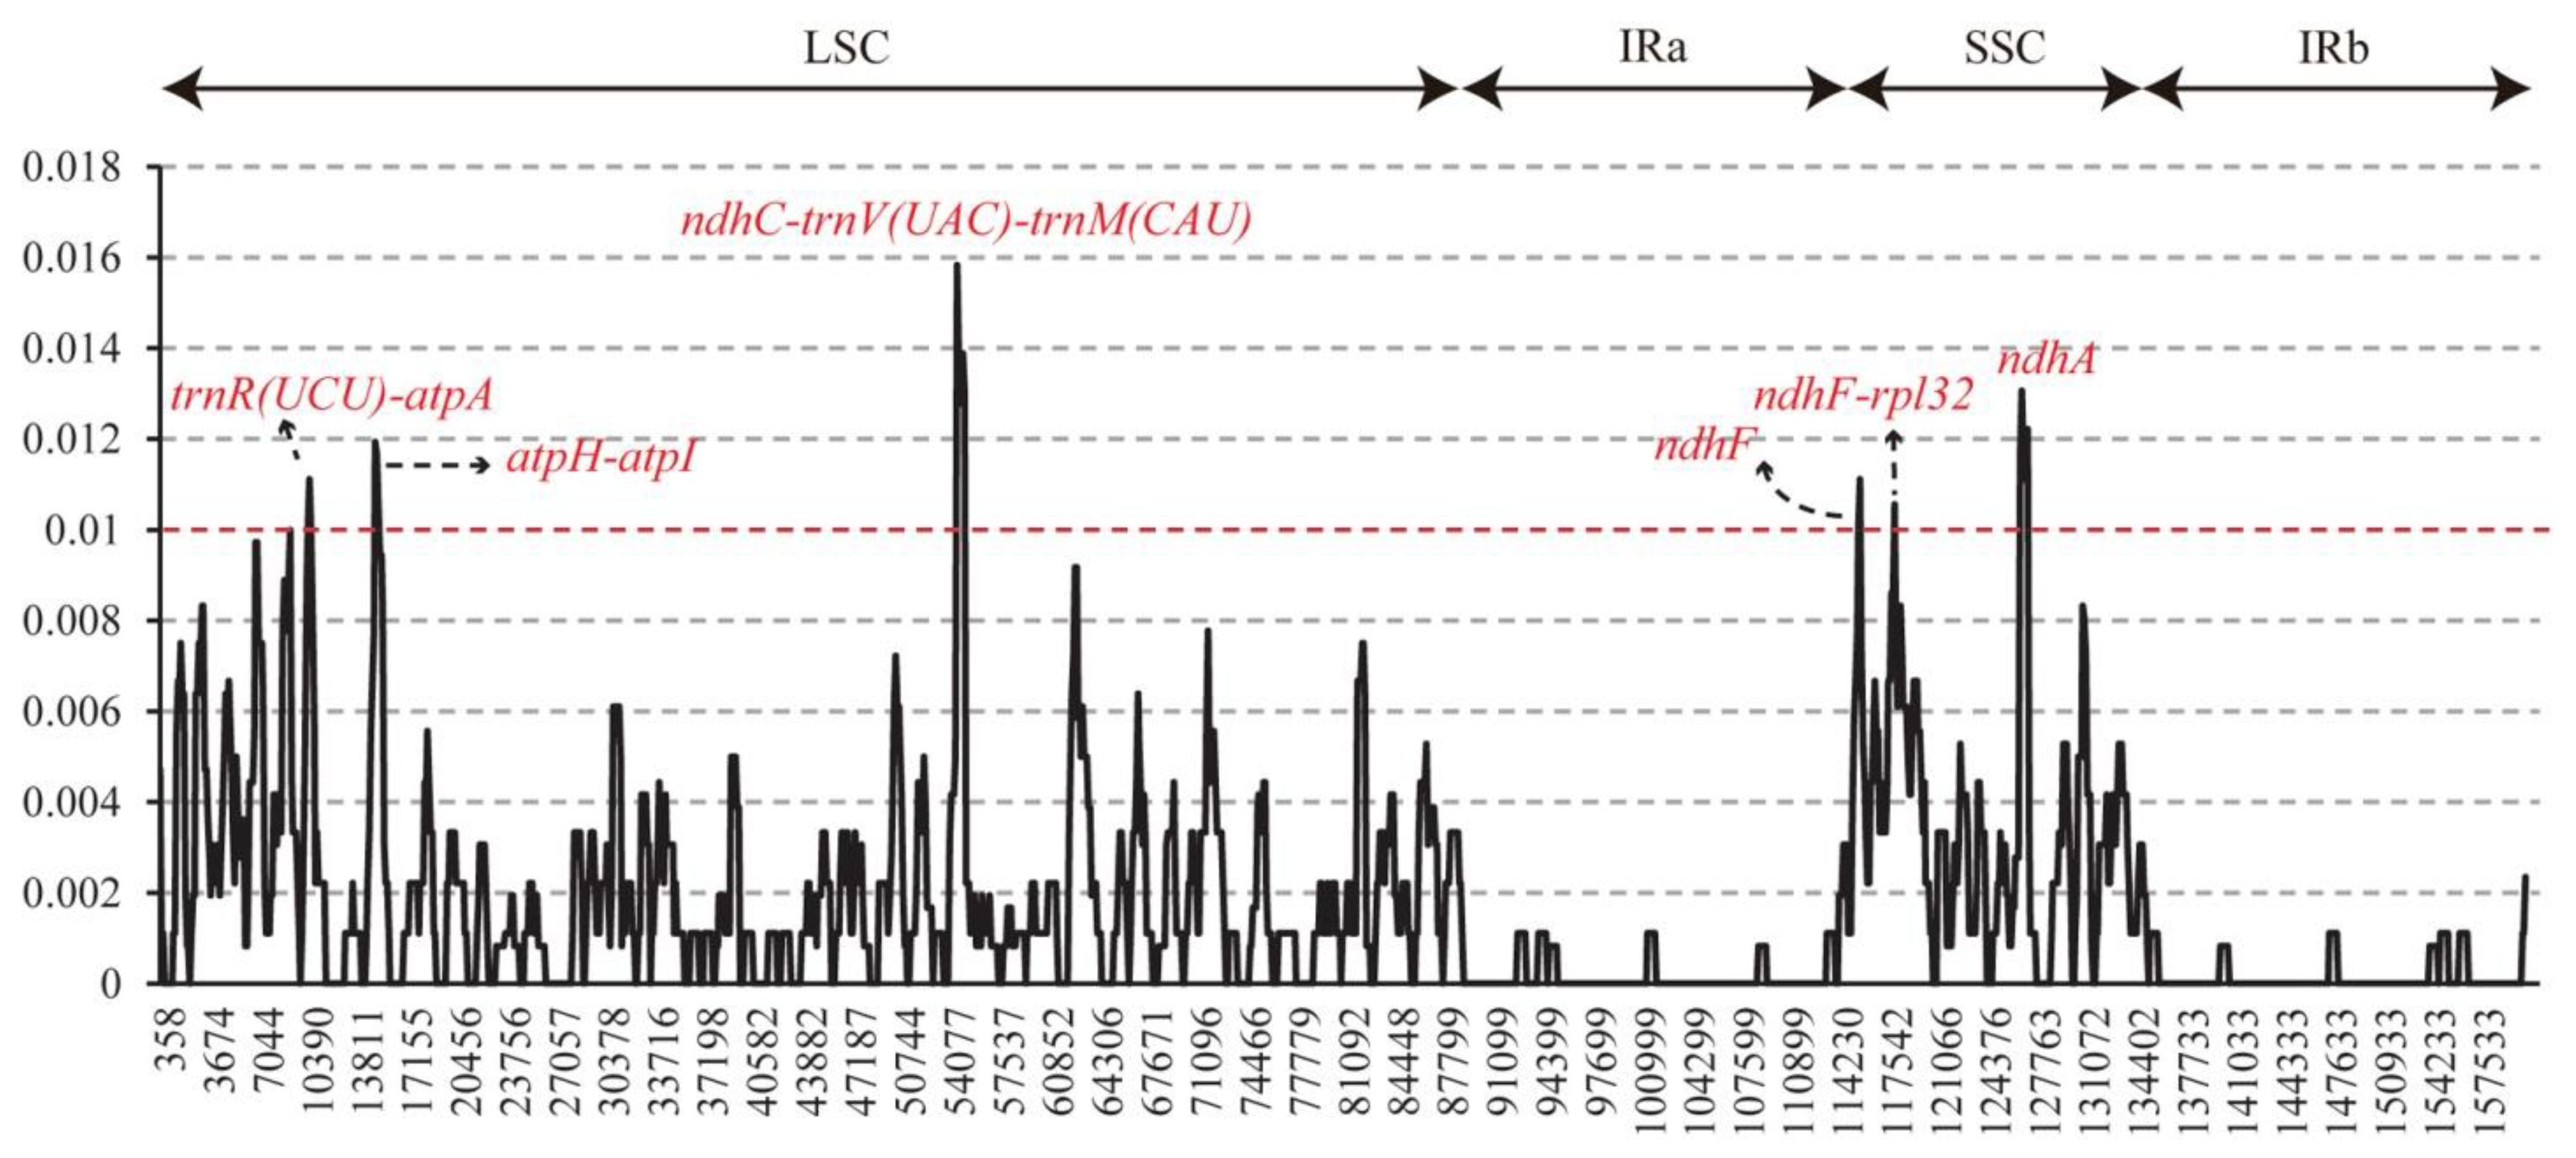
3.3. Divergence Analysis of Sequence and High Variation Region

Next, genome-wide comparative analyses of the four Crataegus chloroplast genomes were performed using mVISTA to evaluate the level of sequence divergence (Figure 3). The chloroplast genomes exhibit strong sequence similarity, indicating that the plastomes are highly conserved. Compared to the non-coding regions and single-copy, the coding regions and IR are more conserved, with low variation among Crataegus. Moreover, the coding regions of ndhA and ycf1 are more variable compared with those of other genes.
Additionally, single nucleotide substitutions (Figure 4) and nucleotide diversity were compared (Table 4). Four-hundred-and-forty-fivevariable sites (0.28%) and 331 parsimony-informative sites (0.21%) were detected in the four Crataegus plastomes. There were 228 and 87 parsimony-informative sites in the LSC and SSC regions, while only 16 parsimony-informative sites were detected in IR regions. The SSC region exhibited the highest nucleotide diversity (0.0036), followed by the LSC region (0.0022) and the IR region (0.0003). The average nucleotide diversity value was 0.0017.
Nucleotide diversity was examined using DNAsp, enabling the identification of high variation regions within the four Crataegus plastomes (Figure 5). The nucleotide diversity values per 600 bp ranged from 0 to 0.0158 among the four Crataegus species. The ndhC-trnV(UAC)-trnM(CAU) region had the highest Pi values (Pi = 0.0158), followed by the ndhA, atpH-atpI, ndhF, trnR(UCU)-atpA, and ndhF-rpl32 regions (Pi > 0.01). Among these divergence hotspots, ndhC-trnV(UAC)-trnM(CAU), trnR(UCU)-atpA, and atpH-atpI are at the LSC region, whereas ndhF, ndhA, and ndhF-rpl32 are at the SSC region. The variability was much higher in the six identified mutation hotspots than in the typical cp DNA molecular markers (trnH-psbA, matK, and rbcL).

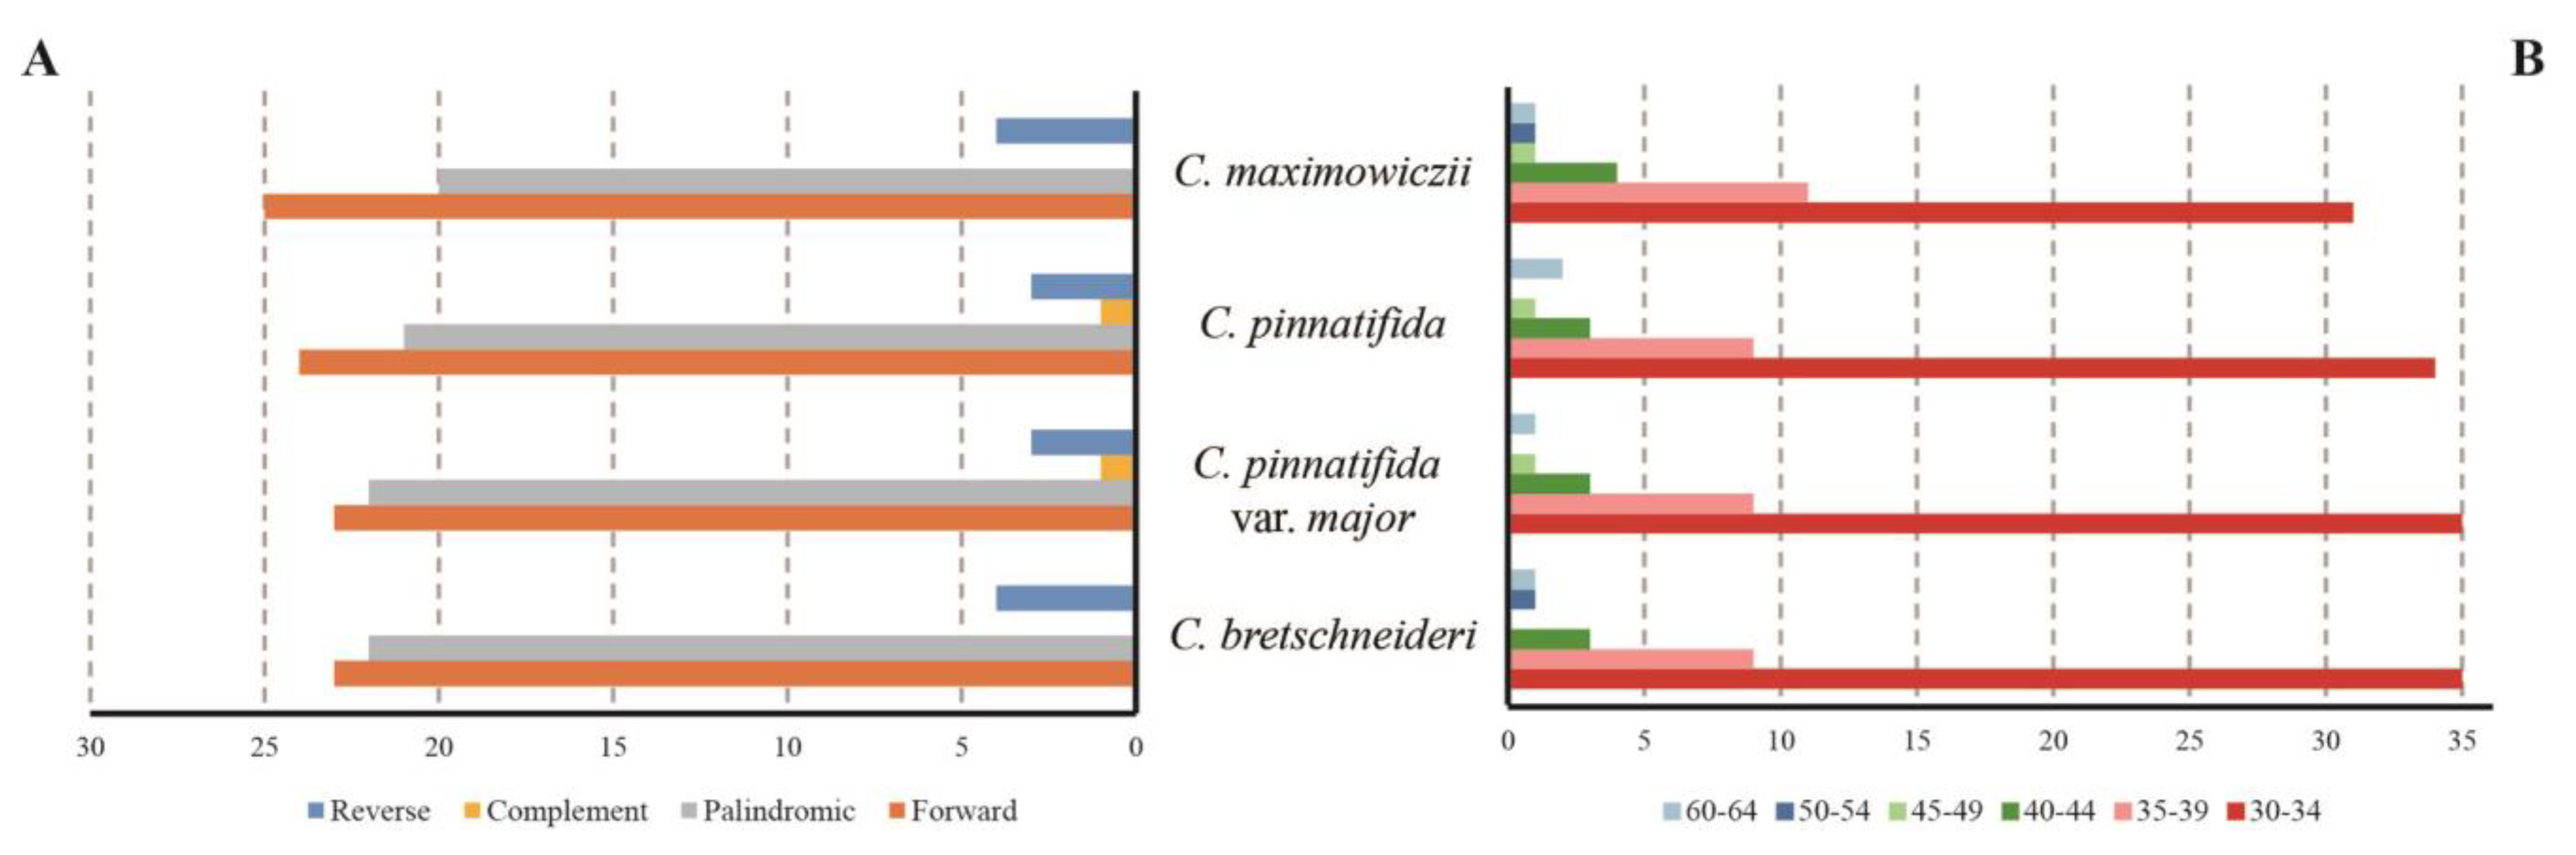
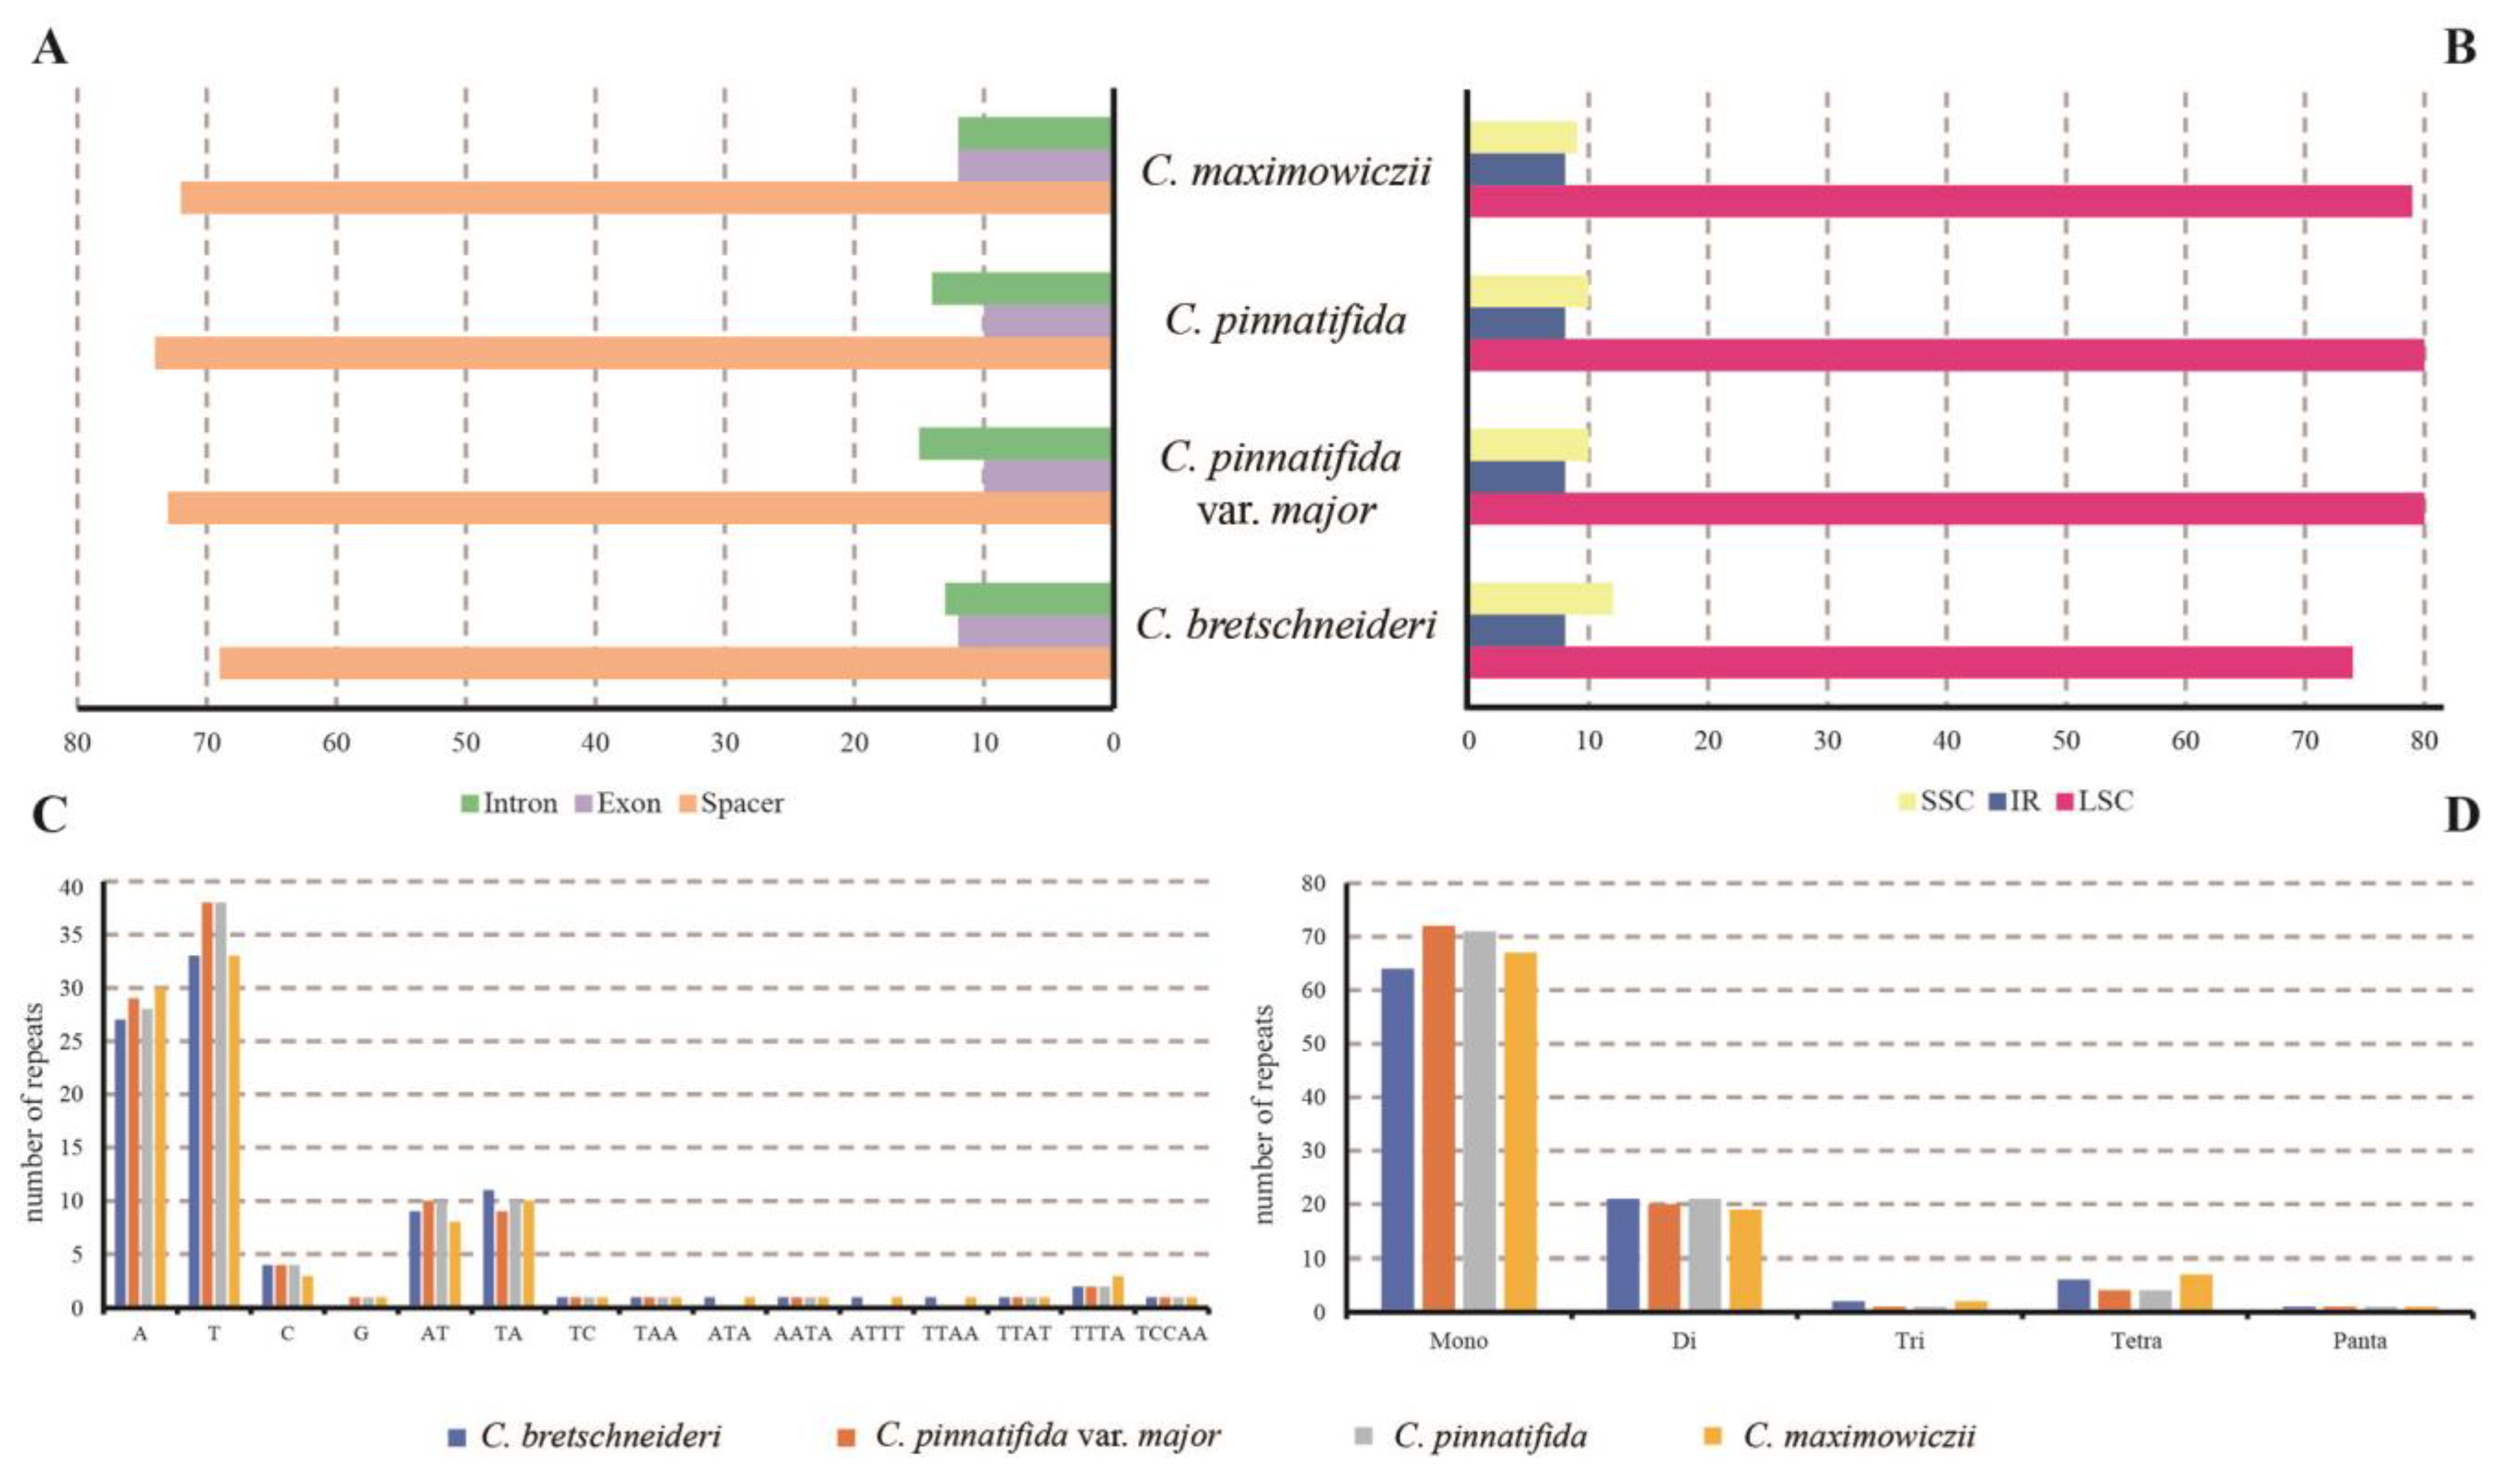
3.4. Repeat Structure and SSR Analysis

Next, repeat sequences were examined in the four Crataegus plastomes (Figure 6; Table S1). A total of 196 repeat sequences, containing forward, reverse, complement, and palindromic repeats, were observed among the four Crataegus plastomes. Among all the detected repeats, forward (48.5%) and palindromic repeats (43.4%) are relatively common, whereas reverse (7.1%) and complement repeats (1%) are comparatively rare (Figure 6; Table S1). One pair of complement repeats is only present in C. pinnatifida var. major and C. pinnatifida. The sizes of the repeats among the four plastomes vary from 30 to 63 bp. The majority of repeats (68.9%) are limited to 30–34 bp in size (Figure 6; Table S1).
We found 386 SSRs repeat motifs in the plastomes of the four Crataegus species using MISA software (Figure 7; Table S2). The number of SSRs detected ranged from 94 (C. bretschneideri) to 98 (C. pinnatifida var. major) (Figure 7; Table S2). Among these SSRs, most are located in the LSC regions (313 SSRs), followed by SSC regions (41 SSRs) and IR regions (32 SSRs). We also observed that a majority of the SSRs are situated in the spacers (288 SSRs), while 54 SSRs and 44 SSRs are situated in the introns and exons, respectively. The majority of SSRs are mononucleotide repeats, which account for the total number of SSRs at 70.98%, followed by dinucleotide repeats at 20.98 and tetranucleotide repeats at 54.4% (Figure 7D; Table S2). The A/T mononucleotide repeats are the most abundant SSRs in the four Crataegus species (Figure 7C; Table S2). The TA/AT dinucleotide repeats are the second most common SSRs, followed by mononucleotide C and tetranucleotide TTTA (Figure 7C; Table S2).

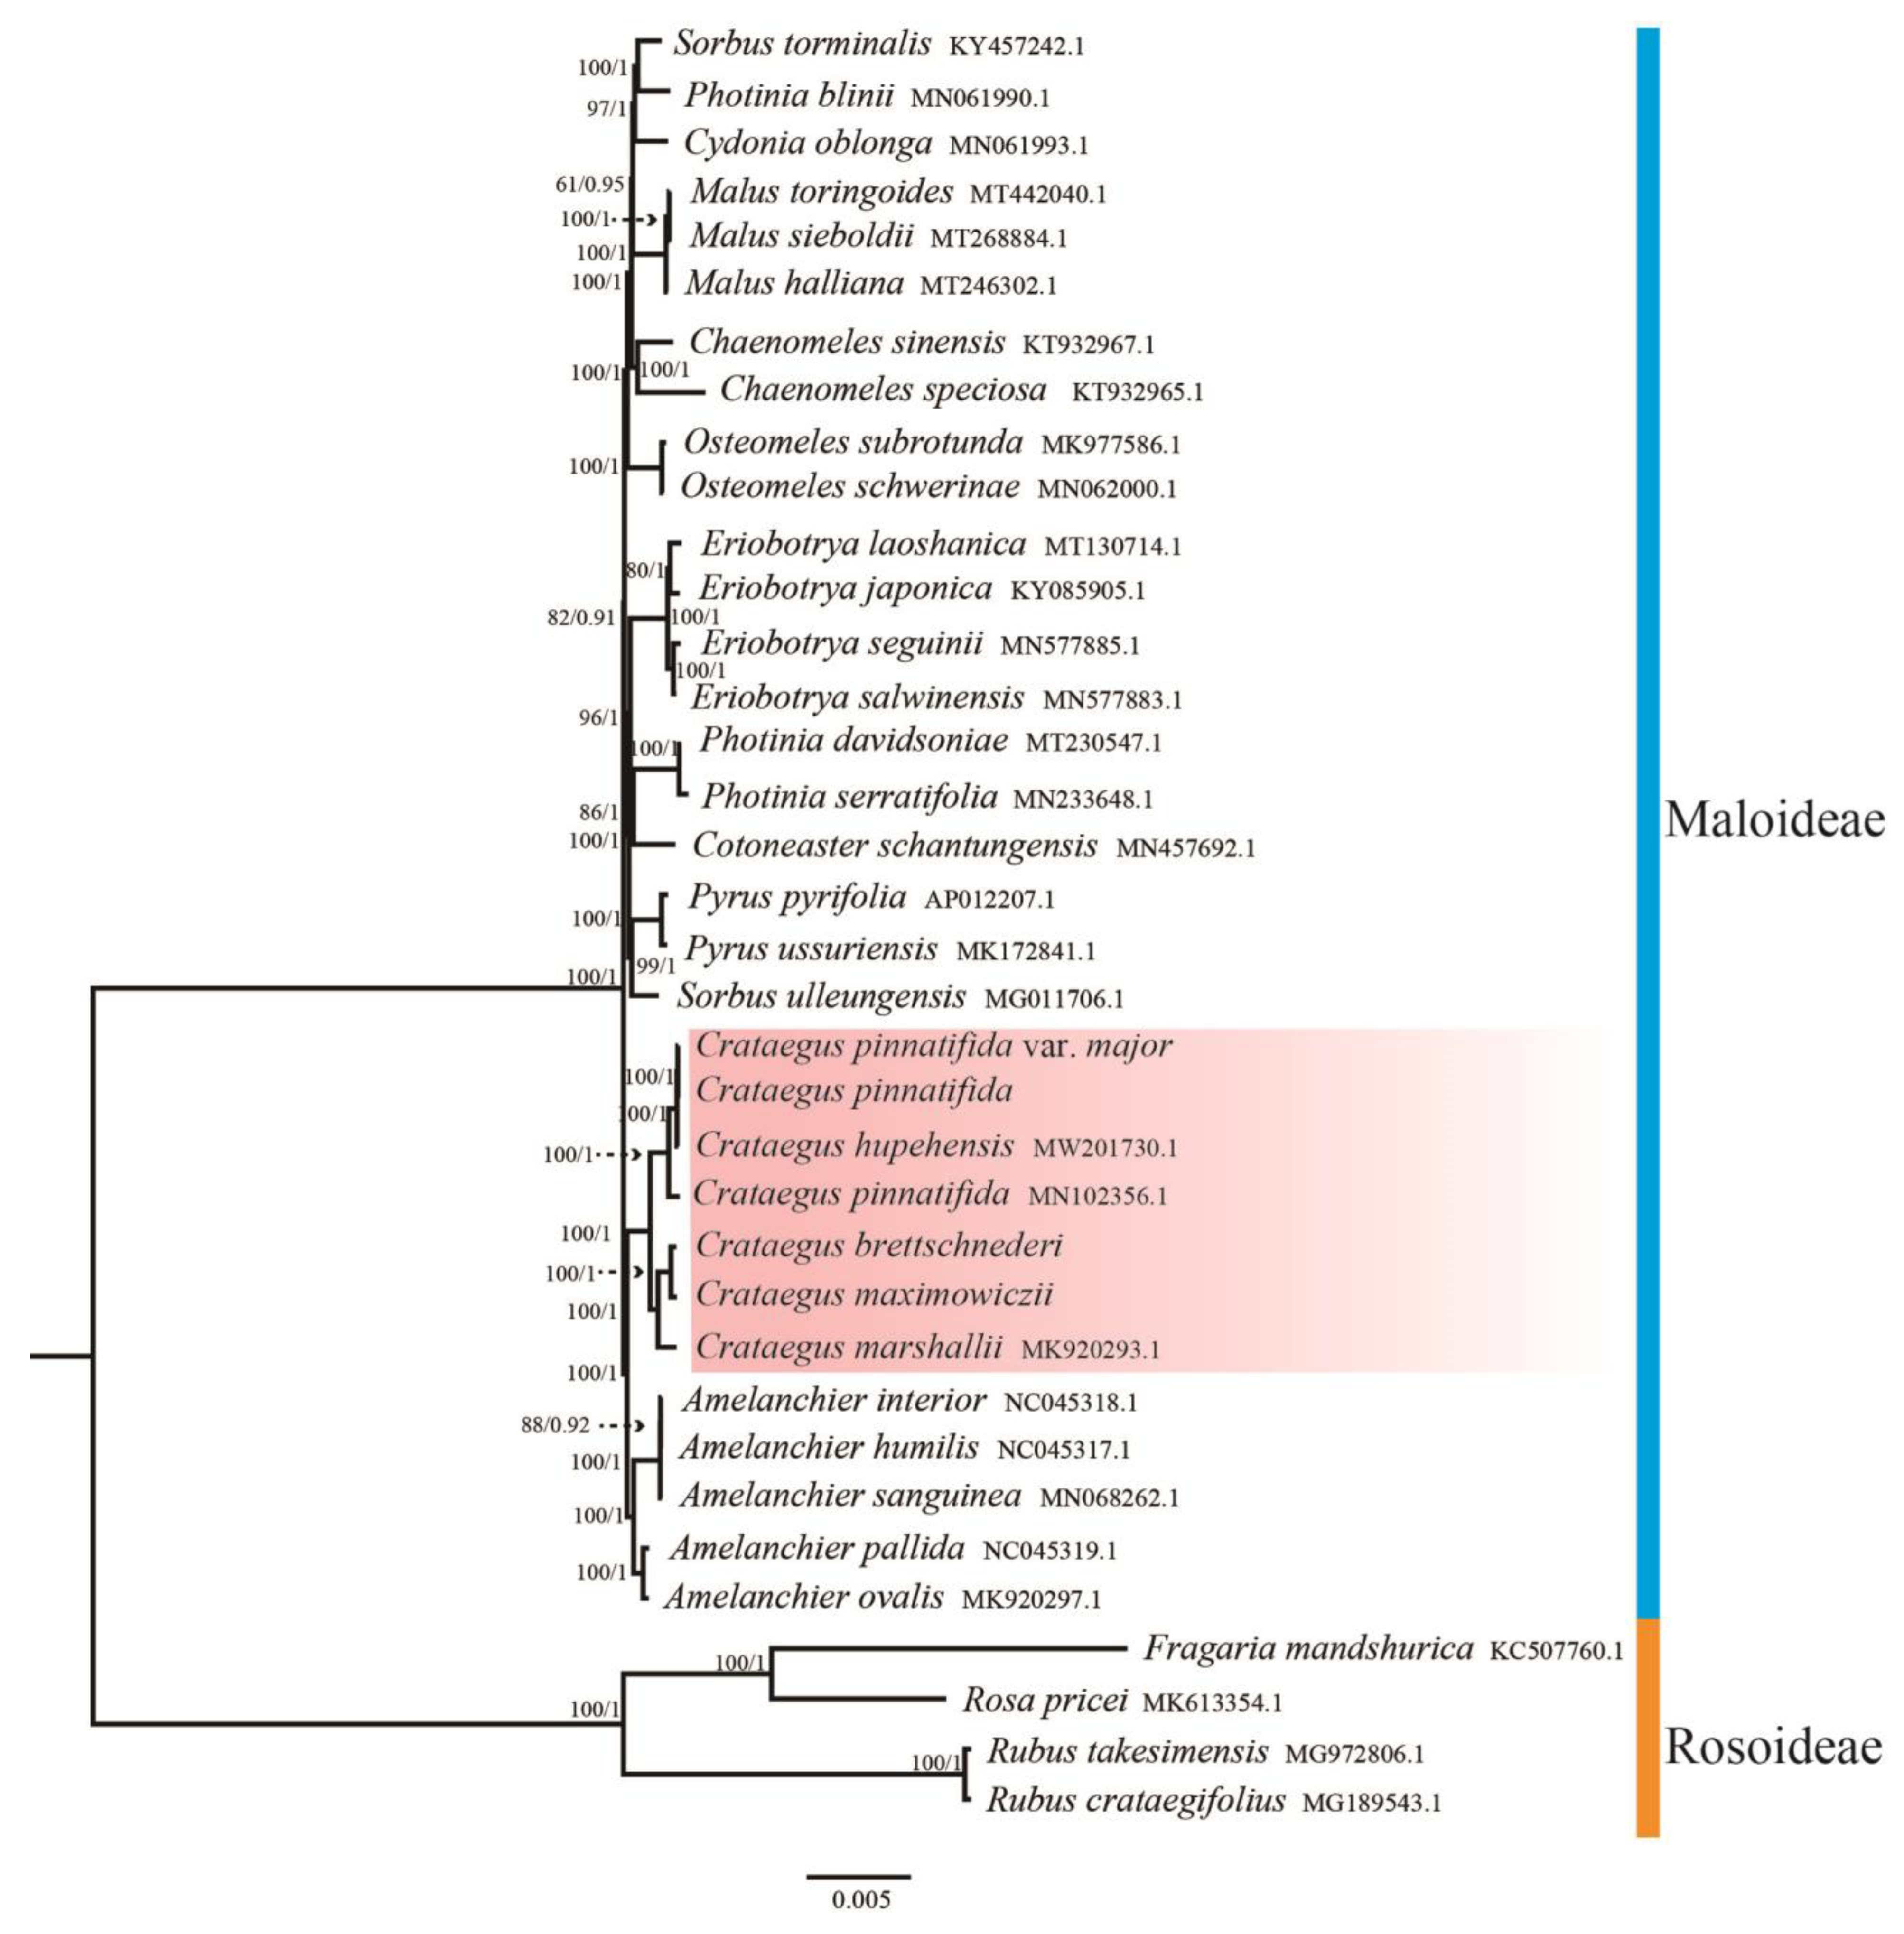
3.5. Phylogenetic Analysis

Phylogenetic analysis was conducted using 36 entire chloroplast genomes, including those from seven Crataegus species, 25 other Maloideae species, and four Rosoideae chloroplast genomes as the outgroup. The phylogenetic trees obtained from the ML and BI had similar topologies (Figure 8), showing two major branches. Maloideae genera (Amelanchier, Crataegus, Pyrus, Sorbus, Cotoneaster, Photinia, Eriobotrys, Osteomeles, Malus, and Cydonis) formed a monophyletic group. Within the Maloideae clade, Crataegus was placed as closely related to the genus Amelanchier. Crataegus species constituted a monophyletic group with 100% support.
Along the Crataegus branch, the seven Crataegus taxa were divided into two major clades (Figure 8). One clade included C. bretschneideri, C. maximowiczii, and C. marshallii; C. bretschneideri and C. maximowiczii clustered into a subclade, forming a sister subclade to C. marshallii. The other clade included C. hupehensis, C. pinnatifida, and C. pinnatifida var. major; C. pinnatifida (MZ494514) and C. pinnatifida var. major were grouped together, with C. hupehensis and C. pinnatifida (MN102356.1) as a sister group.

4. Discussion

4.1. Genome Features and Sequence Divergence among Crataegus Species

In present study, we sequenced the whole plastid genomes of four Crataegus species using Illumina HiSeq 4000 platform. The sizes of the four plastomesranged from 159,607 bp (C. bretschneideri) to 159,875 bp (C. maximowiczii). The chloroplast genomes of the four Crataegus speciesc contain 113 genes, consisting of 79 protein-coding genes, fourrRNA genes, and 30 tRNAgenes. The ycf15 and ycf68 genes were not annotated because these two genes were identified as pseudogenes comprising several internal stop codons [24]. In some species, ycf2, rpl23, and accD are missing from the chloroplast genome [22,45,46]; however, these genes are indeed present in Crataegus.Similar to most plants, the plastomes of the four Crataegus species are conserved, and no rearrangement events were found. The results of mVISTA and nucleotide diversity analyses revealed high levels of similarity among the plastomes, indicating that divergence of the four Crataegus plastomes is lower than that in other species [27,47,48]. Furthermore, lower sequence divergence in the IR region was detected compared to SSC and LSC regions, which has been previously reported [49,50]. One possible reason is that in the chloroplast genome, which has multiple copies per cell, gene conversion with a slight bias against new mutations would decrease the mutation load in the two IR regions much more efficiently than in the single-copy regions due to the duplicative characteristic of the IRs [51,52,53,54]. The expansion and shrinkage of the IR and single-copy junction regions is considered the leading mechanism driving variation in the size of angiosperm plastoms, thus playing a vital role in their evolution [27,55,56]. Although the overall genomic structure, such as gene order and gene number, is highly conserved, the chloroplast genome of C. bretschneideri exhibits significant differences at the IR/single-copy junction regions (Figure 2). We found that the contraction of IR regions caused the chloroplast genomes to decrease in size, as has been previously reported in other plants [57,58,59]. However, the size of the whole chloroplast genome does not always vary with expansion or contraction of IRs [31,60].

4.2. Repeat Structure and SSR Analysis of the Plastomes of Crataegus Species

REPuter software was used to determine repeat sequences in the four Crataegus chloroplast genomes with a copy size of 30 bp or longer and sequence identity >90% as criteria. A total of 196 repeats, comprising forward, complement, palindromic, and reverse repeats, were detected (Figure 6; Table S1). LSC and spacer regions harbored a majority of repeats; SSC and intronic regions contained a minority of repeats (Figure 6; Table S1). No rearrangements were identified in the four species examined, possibly due to a lack of large, complex repeating sequences (>100 bp). Repeat sequences, which play a key role in re-configuration of the genome, are useful for phylogenetic analysis [61,62]. Owing to improper recombination and slipped-strand mispairing of repeats sequences, genome rearrangement and sequence variation happen [26,56]. The occurrence of these repeats shows that these loci are crucial hotspots for genome reconfiguration [23,61]. Additionally, these repeats enable the development of molecular markers for phylogenetic and population genetics studies [63], with potential applications in Crataegus species.
SSRs, also known as microsatellites, have broad applications in population genetics and plant breeding programs [64,65]. The high polymorphism rates of SSRs are owing to slipped-strand mispairing on single DNA strands during DNA replication [66]. However, only a few chloroplast microsatellite loci have been identified in the genus Crataegus [67,68], which has hindered the identification, conservation, utilization, and breeding of Crataegus species in the context of population genetics and phylogeographic studies. A total of 386 SSRs were detected among the chloroplasts of the Crataegus species examined in this study (Figure 7; Table S2). Among the 386 SSRs, most loci are located within spacers (74.6%), followed by introns (14.0%) and exons (11.4%) (Figure 7A; Table S2), which is congruent with the results of similar researches of other plant taxa [24,69]. This may be due to the higher mutation rates in the spacer regions compared to the coding regions. Further analyses showed that a majority of the SSRs were located in the LSC region, whereas 8.3% and 10.6% were located in the IR and SSC regions (Figure 7B; Table S2), respectively. These results correspond to those of previous studies [43,70], in which SSRs were found to be unevenly presented in plastomes. Our results may facilitate the selection of valuable genetic markers for examining intra- and interspecific polymorphisms. Furthermore, most mononucleotide and dinucleotide repeats are composed of A and T (Figure 7C,D; Table S2), which may contribute to a bias in base composition, congruent with other plastomes [71]. This indicates that the Crataegus chloroplast genome contains polyA and polyT repeats with irregular G and C repeats, similar to various other species [25,57]. In general, the SSRs in the four Crataegus plastomes examined in this study exhibit high levels of variation and can serve as potential molecular markers for future population genetic studies of Crataegus species.

4.3. Potential Highly Variable Chloroplast Barcodes

Comparison analysis of the chloroplast genome sequences indicated several regions of sequence polymorphisms (Figure 3). In accord with recent research [23,24], most of the sequence variations are distributed in the LSC and SSC regions, whereas the IR regions exhibit comparatively less sequence variation. The lowersequence divergence of the IR region compared to the single-copy regions in Crataegus species and other plants may be due to copy correction between IR sequences during gene conversion [24,72].
Increasingly more studies have indicated that universal DNA markers have low sequence divergence and poor discriminatory power [37,73]. Previously, several chloroplast and nuclear DNA markers have been used for phylogenetic analysis of Crataegus and to resolve intraspecific and interspecific relationships [13,67,68]. Because Crataegus is widely distributed in Eurasia and North America [1], it is challenging to carry out DNA barcoding and taxonomic assessments for this genus. Therefore, the development of novel markers and broader taxonomic sampling is necessary to provide greater phylogenetic resolution at low taxonomic levels. Additionally, hawthornis one of the most important processing and table fruits in China [3]; the study of its taxonomy, genetics, conservation, and identification is hindered by a lack of genomic resources for Crataegus. Chloroplast genome sequences present an important clue for investigating genome evolution and produce valuable genetic resources for further studies in future.
Gene mutation and rearrangement in the chloroplast genome are not always present randomly throughout the genome sequence, often being focused in certain ‘hotspot’ regions instead [73]. Comparative analysis of chloroplast genome sequences isa feasible means for identifying hypervariable regions; these mutation hotspots canserve as specific molecular markers. In present study, six hypervariable regions—ndhC-trnV(UAC)-trnM(CAU), ndhA, atpH-atpI, ndhF, trnR(UCU)-atpA, and ndhF-rpl32—were identified.
The ndhC-trnV(UAC)-trnM(CAU) region is composed of two intergenic spaces (ndhC-trnV(UAC) and trnV(UAC)-trnM(CAU)) and an intron (trnV) with an average length of 1416 bp; this region is the most variableamong the four Crataegus plastomes (Figure 5). ndhC-trnV, trnV, and trnV-trnM were suggested by the authors of [28,60] to be high-variability markers that can be used for DNA barcoding and molecular phylogenetic studies. The trnR-atpA is part of the trnG-atpA intergenic marker, which is split into two intergenic regions: trnG-trnR and trnR-atpA. The trnG-atpA region suggested by the authors of [27] was found to be a high-variability marker in Corylus. The ndhF and ndhF-rpl32 regions have been extensively applied in phylogenetic analysis [31,56,74,75]. Two rarely reported highly variable regions, ndhA and atpH-atpI, are distributed in the four Crataegus chloroplast genomes and were detected in the present study.

4.4. Phylogenetic Relationships

As one of the original cultivation centers, China has a long history of cultivating and collecting hawthorns [15]. A total of 18 species and sixvarieties of Crataegus have been identified and confirmed in China [10], though valuable cultivated varieties aremainly derivedfrom four species: C. pinnatifida, C. scabrifolia, C. hupehensis, and C. bretschneideri. However, the interspecific relationships of cultivated Crataegus in China remain unclear. Our previous study revealed that C. bretschneideri might have arisen through hybridization between C. maximowiczii and C. pinnatifida, and that introgression happened between C. hupehensis, C. pinnatifida, and C. pinnatifida var. major [17]. In this study, the whole chloroplast genome sequences of C. bretschneideri, C. pinnatifida, C. maximowiczii, and C. pinnatifida var. major were used to further assess their phylogenetic relationships. We sequenced the plastomesof the four Crataegus species, thus reporting the first comprehensive analysis of Crataegus chloroplast genomes. For the phylogenomic analysis, we also examined three published Crataegus whole chloroplast genomes obtained from the GenBank database: those of C. hupehensis (MW201730.1), C. pinnatifida (MN102356.1), and C. marshallii (MK920293.1).
We then performedphylogenetic analysis of seven Chinese Crataegus species on the basis of their entire chloroplast genomes. The ML phylogenetic tree revealed the presence of two major clusters (Figure 8). One cluster included C. bretschneideri, C. marshallii, and C. maximowiczii, in which C. bretschneideri and C. maximowiczii clustered into a subclade and formed a sister relationship with the C. marshallii subclade. This suggests that C. bretschneideri is a distinct Crataegus species, rather than a variant of C. pinnatifida, which is in agreement with earlier studies [15,16]. However, the phylogenetic tree indicated C. bretschneideri is more closely related to C. maximowiczii than to C. pinnatifida, which differs from the findings reported in [16]. Our previous results indicated that C. bretschneideri might have arisen through hybridization between C. maximowiczii and C. pinnatifida [17]; given the maternal inheritance of chloroplasts, the present results suggest that C. maximowiczii is the maternal origin of C. bretschneideri. The other cluster included C. hupehensis, C. pinnatifida, and C. pinnatifida var. major; C. pinnatifida (MZ494514) and C. pinnatifida var. major were grouped together, with C. hupehensis and C. pinnatifida (MN102356.1) clustering as a sister group. The variation among the chloroplast sequences matched the differences in the geographical distribution of each species, suggest that repeated chloroplast DNA introgression led to this pattern [76]. Crataegus pinnatifida (MN102356.1) from the southwestern region of China and C. pinnatifida (MZ494514) from the northern region of China did not cluster together into a subclade, indicating that C. pinnatifida may hybridize with other species to accomplish chloroplast DNA introgression and interspecific transfer. In our previous study, specific locus amplified fragment sequencing showed thatintrogression occurredbetween C. pinnatifida, C. pinnatifida var. major, and C. hupehensis [17]. Chloroplast capture is an important process of plant evolution [76]. Due to hybridization and repeated backcross, the cytoplasm of one species may be replaced by the cytoplasm of the other species through gene flow infiltration. Therefore, the genetic components of one species not only have nuclear genome components inherited from parents, but also capture new chloroplast gene components. Increasingly more studies have proved the phenomenon of organelle DNA introgression [27,77]. The result presented here also supports our previous conclusion that introgression happened between C. hupehensis, C. pinnatifida, and C. pinnatifida var. major [17]. Based on the present study and our previously published data, we hypothesize that partial C. pinnatifida germplasms arose via the hybridization of C. hupehensis and C. pinnatifida, and that C. pinnatifida var. major might have been artificially selected and domesticated from hybrid populations.

5. Conclusions

In the present study, the complete chloroplast genomes of three cultivated species and one related Crataegus species were sequenced and assembled. We provided valuable genomic resources for Crataegus. Comparative analyses of the plastomes identified variable regions with potential application as species-specific DNA barcodes. The six hypervariable hotspots, 196 repeats, and 386 SSRs detected should facilitate phylogenetic analyses and the development of molecular markers. Our whole-chloroplast phylogenomic analysis provided valuable information that partially uncovered the phylogenetic relationships of cultivated Crataegus in China. Furthermore, our findings suggest that C. bretschneideri is a distinct Crataegus species, rather than a variant of C. pinnatifida. Combined with our previous study, the present work indicates that C. maximowiczii is the maternal origin of C. bretschneideri. Our data also suggest that introgression happened between C. hupehensis, C. pinnatifida, and C. pinnatifida var. major. Furthermore, we hypothesize that C. pinnatifida var. major might have been artificially selected and domesticated from hybrid populations, rather than evolved from C. pinnatifida. The genetic resources obtained in this study will facilitate future research into the population genetics, species identification and conservation of Crataegus.

Supplementary Materials

The following are available online at https://www.mdpi.com/article/10.3390/horticulturae7090301/s1, Table S1: The repeat sequences list of four Crataegus species, Table S2: The simple sequence repeats (SSRs) of four Crataegus species.

Author Contributions

Conceptualization, G.H., W.D. and N.D.; methodology, Y.W. (Yiheng Wang); software, Y.W. (Yiheng Wang); validation, S.Z., Y.W. (Yan Wang) and N.D.; formal analysis, G.H.; investigation, Y.W. (Yan Wang); resources, W.D.; data curation, N.D.; writing—original draft preparation, G.H. and N.D.; writing—review and editing, W.D.; visualization, N.D.; supervision, W.D. and N.D.; project administration, N.D.; funding acquisition, N.D. All authors have read and agreed to the published version of the manuscript.

Funding

This research was funded by Presidential Foundation of Beijing Academy of Agriculture and Forestry Sciences (grant number YZJJ202101) andthe Special Fund for the Construction of Scientific and Technological Innovation Capability (KJCX20200114).

Data Availability Statement

The annotated chloroplast genomes of C. bretschnederi, C. pinnatifida, C. pinnatifida var. major and C. maximowiczii have been deposited in the NCBI (https://www.ncbi.nlm.nih.gov, accessed on 1 July 2021) GenBank with the accession numbers MW963339, MZ494514, MZ494513 and MZ494512.

Acknowledgments

The authors thank Yang Wu and Bo Chen for their great help in original draft preparation.

Conflicts of Interest

The authors declare no conflict of interest.

References

  1. Christensen, K.I. Revision of Crataegus sect. Crataegus and nothosect. Crataeguineae (Rosaceae-Maloideae) in the Old World. Syst. Bot. Monogr. 1992, 35, 1–199. [Google Scholar] [CrossRef]
  2. Özcan, M.; Hacıseferoğulları, H.; Marakoğlu, T.; Arslan, D. Hawthorn (Crataegus spp.) fruit: Some physical and chemical properties. J. Food Eng. 2005, 69, 409–413. [Google Scholar] [CrossRef]
  3. Xu, J.Y.; Zhao, Y.H.; Zhang, X.; Zhang, L.J.; Dong, W.X. Transcriptome analysis and ultrastructure observation reveal that hawthorn fruit softening is due to cellulose/hemicellulose degradation. Front. Plant Sci. 2016, 7, 1524. [Google Scholar] [CrossRef] [PubMed] [Green Version]
  4. Liu, P.Z.; Yang, B.R.; Kallio, H. Characterization of phenolic compounds in Chinese hawthorn (Crataeguspinnatifida Bge. var. major) fruit by high performance liquid chromatography-electrospray ionization mass spectrometry. Food Chem. 2010, 121, 1188–1197. [Google Scholar] [CrossRef]
  5. Zheng, G.Q.; Deng, J.; Wen, L.R.; You, L.J.; Zhao, Z.G.; Zhou, L. Release of phenolic compounds and antioxidant capacity of Chinese hawthorn “Crataeguspinnatifida” during, in vitro, digestion. J. Funct. Foods 2018, 40, 76–85. [Google Scholar] [CrossRef]
  6. Wu, J.Q.; Peng, W.; Qin, R.X.; Zhou, H. Crataeguspinnatifida: Chemical constituents, pharmacology, and potential applications. Molecules 2014, 19, 1685–1712. [Google Scholar] [CrossRef] [PubMed]
  7. Dahmer, S.; Scott, E. Health effects of hawthorn (Complementary and Alternative Medicine). Am. Fam. Physician 2018, 81, 465–469. [Google Scholar]
  8. Jurikova, T.; Sochor, J.; Rop, O.; Mlcek, J.; Balla, S.; Szekeres, L.; Adam, V.; Kizek, R. Polyphenolic profile and biological activity of Chinese hawthorn (Crataegus pinnatifida BUNGE) fruits. Molecules 2012, 17, 14490–14509. [Google Scholar] [CrossRef] [Green Version]
  9. Edwards, J.E.; Brown, P.N.; Talent, N.; Dickinson, T.A.; Shipley, P.R. A review of the chemistry of the genus Crataegus. Phytochemistry 2012, 79, 5–26. [Google Scholar] [CrossRef]
  10. Zhao, H.; Feng, B. China Fruit-Plant Monograph of Hawthorn (Crataegus) Flora; Zhongguo Linye Press: Beiing, China, 1996. [Google Scholar]
  11. Xin, X.; Zhang, Y. Chinese Hawthorn Germplasm Resources and Utilization; China Agricultural Press: Beijing, China, 1997. [Google Scholar]
  12. Dong, W.; Li, Z. The Science and Practice of Chinese Fruit Tree: Hawthorn; Shanxi Science Press: Xi’an, China, 2015. [Google Scholar]
  13. Ma, S.L.Y.; Dong, W.X.; Lyu, T.; Lyu, Y.M. An RNA sequencing transcriptome analysis and development of EST-SSR markers in Chinese hawthorn through Illumina sequencing. Forests 2019, 10, 82. [Google Scholar] [CrossRef] [Green Version]
  14. Dai, H.Y. Molecular Identification and Enhancement of Germplasms in Hawthorn. Ph.D. Thesis, Shenyang Agricultural University, Shenyang, China, 2007. [Google Scholar]
  15. Guo, T.J.; Jiao, P.J. Hawthorn (Crataegus) resources in China. HortScience 1995, 30, 1132–1134. [Google Scholar] [CrossRef]
  16. Han, X.Y.; Ling, Y.H.; Wang, Y.J.; Li, F.; Guo, T.J.; Xue, Y.J. Analysis of the origin and classification of C. brettschnederi by ISSR Markers. J. Jilin Agric. Univ. 2009, 31, 164–167. [Google Scholar]
  17. Du, X.; Zhang, X.; Bu, X.D.; Zhang, T.C.; Lao, Y.C.; Dong, W.X. Molecular analysis of evolution and origins of cultivated hawthorn (Crataegus spp.) and related species in China. Front. Plant Sci. 2019, 10, 443. [Google Scholar] [CrossRef] [Green Version]
  18. Neuhaus, H.E.; Emes, M.J. Nonphotosynthetic metabolism in plastids. Annu. Rev. Plant Physiol. Plant Mol. Biol. 2000, 51, 111–140. [Google Scholar] [CrossRef] [PubMed]
  19. Liu, J.; Qi, Z.C.; Zhao, Y.P.; Fu, C.X.; Xiang, Q.Y. Complete cp DNA genome sequence of Smilaxchina and phylogenetic placement of Liliales- influences of gene partitions and taxon sampling. Mol. Phylogenet. Evol. 2012, 64, 545–562. [Google Scholar] [CrossRef]
  20. Allen, J.F. Why chloroplasts and mitochondria contain genomes. Comp. Funct. Genom. 2003, 4, 31–36. [Google Scholar] [CrossRef] [Green Version]
  21. McNeal, J.R.; Leebens-Mack, J.H.; Arumuganathan, K.; Kuehl, J.V.; Boore, J.L.; De Pamphilis, C.W. Using partial genomic fosmid libraries for sequencing complete organellar genomes. Biotechniques 2006, 41, 69–73. [Google Scholar] [CrossRef] [Green Version]
  22. Wicke, S.; Schneeweiss, G.M.; De Pamphilis, C.W.; Muller, K.F.; Quandt, D. The evolution of the plastid chromosome in land plants: Gene content, gene order, gene function. Plant Mol. Biol. 2011, 76, 273–297. [Google Scholar] [CrossRef] [Green Version]
  23. Zhang, Y.J.; Du, L.W.; Liu, A.; Chen, J.J.; Wu, L.; Hu, W.M.; Zhang, W.; Kim, K.; Lee, S.C.; Yang, T.J.; et al. The Complete Chloroplast Genome Sequences of Five Epimedium Species: Lights into Phylogenetic and Taxonomic Analyses. Front. Plant Sci. 2016, 7, 306. [Google Scholar] [CrossRef] [Green Version]
  24. Lu, R.S.; Li, P.; Qiu, Y.X. The Complete Chloroplast Genomes of Three Cardiocrinum (Liliaceae) Species: Comparative Genomic and Phylogenetic Analyses. Front. Plant Sci. 2017, 7, 2054. [Google Scholar] [CrossRef]
  25. Roy, N.S.; Jeong, U.; Na, M.; Choi, I.Y.; Cheong, E.J. Genomic analysis and a consensus chloroplast genome sequence of Prunus yedoensis for DNA marker development. Hortic. Environ. Biotechnol. 2020, 61, 859–867. [Google Scholar] [CrossRef]
  26. Huang, H.; Shi, C.; Liu, Y.; Mao, S.Y.; Gao, L.Z. Thirteen Camellia chloroplast tgenome sequences determined by high-throughput sequencing: Genome structure and phylogenetic relationships. BMC Evol. Biol. 2014, 14, 151. [Google Scholar] [CrossRef] [Green Version]
  27. Hu, G.L.; Cheng, L.L.; Huang, W.G.; Cao, Q.C.; Zhou, L.; Jia, W.S.; Lan, Y.P. Chloroplast genomes of seven species of Coryloideae (Betulaceae): Structures and comparative analysis. Genome 2020, 63, 337–348. [Google Scholar] [CrossRef] [PubMed]
  28. Raman, G.; Park, K.T.; Kim, J.; Park, S. Characteristics of the completed chloroplast genome sequence of Xanthium spinosum: Comparative analyses, identification of mutational hotspots and phylogenetic implications. BMC Genom. 2020, 21, 855. [Google Scholar] [CrossRef] [PubMed]
  29. Wang, J.; Li, Y.; Li, C.J.; Yan, C.X.; Zhao, X.B.; Yuan, C.L.; Sun, Q.X.; Shi, C.R.; Shan, S.H. Twelve complete chloroplast genomes of wild peanuts: Great genetic resources and a better understanding of Arachis phylogeny. BMC Plant Biol. 2019, 19, 504. [Google Scholar] [CrossRef] [PubMed]
  30. Saina, J.K.; Gichira, A.W.; Li, Z.Z.; Hu, W.G.; Wang, Q.F.; Liao, K. The complete chloroplast genome sequence of Dodonaeaviscosa: Comparative and phylogenetic analyses. Genetica 2018, 146, 101–113. [Google Scholar] [CrossRef] [PubMed]
  31. Xu, W.B.; Xia, B.S.; Li, X.W. The complete chloroplast genome sequences of five pinnate-leaved Primula species and phylogenetic Analyses. Sci. Rep. 2020, 10, 20782. [Google Scholar] [CrossRef] [PubMed]
  32. Li, J.L.; Wang, S.; Yu, J.; Wang, L.; Zhou, S.L. A modified CTAB protocol for plant DNA extraction. Chin. Bull. Bot. 2013, 48, 72–78. [Google Scholar]
  33. Bolger, A.M.; Lohse, M.; Usadel, B. Trimmomatic: A flexible trimmer for Illumina sequence data. Bioinformatics 2014, 30, 2114–2120. [Google Scholar] [CrossRef] [Green Version]
  34. Bankevich, A.; Nurk, S.; Antipov, D.; Gurevich, A.A.; Dvorkin, M.; Kulikov, A.S.; Lesin, V.M.; Nikolenko, S.I.; Pham, S.; Prjibelski, A.D.; et al. SPAdes: A new genome assembly algorithm and its applications to single-cell sequencing. J. Comput. Biol. 2012, 19, 455–477. [Google Scholar] [CrossRef] [Green Version]
  35. Brozynska, M.; Furtado, A.; Henry, R.J. Direct chloroplast sequencing: Comparison of sequencing platforms and analysis tools for whole chloroplast barcoding. PLoS ONE 2014, 9, e110387. [Google Scholar] [CrossRef] [Green Version]
  36. Huang, D.I.; Cronk, Q. Plann: A command-line application for annotating plastome sequences. Appl. Plant Sci. 2015, 3, 1500026. [Google Scholar] [CrossRef] [Green Version]
  37. Conant, G.C.; Wolfe, K.H. GenomeVx: Simple web-based creation of editable circular chromosome maps. Bioinformatics 2008, 24, 861–862. [Google Scholar] [CrossRef] [Green Version]
  38. Kurtz, S.; Choudhuri, J.V.; Ohlebusch, E.; Schleiermacher, C.; Stoye, J.; Giegerich, R. REPuter: The manifold applications of repeat analysis on a genomic scale. Nucleic Acids Res. 2001, 29, 4633–4642. [Google Scholar] [CrossRef] [Green Version]
  39. Katoh, K.; Standley, D.M. MAFFT multiple sequence alignment software version 7: Improvements in performance and usability. Mol. Biol. Evol. 2013, 30, 772–780. [Google Scholar] [CrossRef] [Green Version]
  40. Rozas, J.; Albert, F.M.; Juan Carlos, S.D.; Sara, G.R.; Pablo, L.; Ramos-Onsins, S.E.; Alejandro, S.G. DnaSP 6: DNA Sequence Polymorphism Analysis of Large Data Sets. Mol. Biol. Evol. 2017, 34, 3299–3302. [Google Scholar] [CrossRef] [PubMed]
  41. Kumar, S.; Stecher, G.; Tamura, K. MEGA7: Molecular Evolutionary Genetics Analysis Version 7.0 for Bigger Datasets. Mol. Biol. Evol. 2016, 33, 1870–1874. [Google Scholar] [CrossRef] [PubMed] [Green Version]
  42. Frazer, K.A.; Pachter, L.; Poliakov, A.; Rubin, E.M.; Dubchak, I. VISTA: Computational tools for comparative genomics. Nucleic Acids Res. 2004, 32, 273–279. [Google Scholar] [CrossRef]
  43. Kalyaanamoorthy, S.; Minh, B.Q.; Wong, T.K.F.; von Haeseler, A.; Jermiin, L.S. ModelFinder: Fast model selection for accurate phylogenetic estimates. Nat. Methods 2017, 14, 587–589. [Google Scholar] [CrossRef] [PubMed] [Green Version]
  44. Nguyen, L.T.; Schmidt, H.A.; von Haeseler, A.; Minh, B.Q. IQ-TREE: A Fast and Effective Stochastic Algorithm for Estimating Maximum-Likelihood Phylogenies. Mol. Biol. Evol. 2015, 32, 268–274. [Google Scholar] [CrossRef] [PubMed]
  45. Oliver, M.J.; Murdock, A.G.; Mishler, B.D.; Kuehl, J.V.; Boore, J.L.; Mandoli, D.F.; Everett, K.D.; Wolf, P.G.; Duffy, A.M.; Karol, K.G. Chloroplast genome sequence of the moss Tortularuralis: Gene content, polymorphism, and structural arrangement relative to other green plant chloroplast genomes. BMC Genom. 2010, 11, 143. [Google Scholar] [CrossRef] [Green Version]
  46. Jansen, R.K.; Cai, Z.; Raubeson, L.A.; Daniell, H.; Depamphilis, C.W.; Leebens-Mack, J.; Muller, K.F.; Guisinger-Bellian, M.; Haberle, R.C.; Hansen, A.K.; et al. Analysis of 81 genes from 64 plastid genomes resolves relationships in angiosperms and identifies genome-scale evolutionary patterns. Proc. Natl. Acad. Sci. USA 2007, 104, 19369–19374. [Google Scholar] [CrossRef] [PubMed] [Green Version]
  47. Li, W.Q.; Liu, Y.L.; Yang, Y.; Xie, X.M.; Lu, Y.Z.; Yang, Z.R.; Jin, X.B.; Dong, W.P.; Suo, Z.L. Interspecific chloroplast genome sequence diversity and genomic resources in Diospyros. BMC Plant Biol. 2018, 18, 210. [Google Scholar] [CrossRef] [PubMed]
  48. Xu, C.; Dong, W.P.; Li, W.Q.; Lu, Y.Z.; Xie, X.M.; Jin, X.B.; Shi, J.P.; He, K.H.; Suo, Z.L. Comparative analysis of six Lagerstroemia complete chloroplast genomes. Front. Plant Sci. 2017, 8, 15. [Google Scholar] [CrossRef] [Green Version]
  49. Song, Y.; Dong, W.P.; Liu, B.; Xu, C.; Yao, X.; Gao, J.; Corlett, R.T. Comparative analysis of complete chloroplast genome sequences of two tropical trees Machilusyunnanensis and Machilusbalansae in the family Lauraceae. Front. Plant Sci. 2015, 6, 662. [Google Scholar] [CrossRef] [PubMed] [Green Version]
  50. Wang, Y.H.; Wang, S.; Liu, Y.L.; Yuan, Q.J.; Sun, J.H.; Guo, L.P. Chloroplast genome variation and phylogenetic relationships of Atractylodes species. BMC Genom. 2021, 22, 103. [Google Scholar]
  51. Perry, A.S.; Wolfe, K.H. Nucleotide substitution rates in legume chloroplast DNA depend on the presence of the inverted repeat. J. Mol. Evol. 2002, 55, 501–508. [Google Scholar] [CrossRef]
  52. Zhu, A.D.; Guo, W.H.; Gupta, S.; Fan, W.S.; Mower, J.P. Evolutionary dynamics of the plastid inverted repeat: The effects of expansion, contraction, and loss on substitution rates. New Phytol. 2016, 209, 1747–1756. [Google Scholar] [CrossRef] [Green Version]
  53. Li, F.W.; Kuo, L.Y.; Pryer, K.M.; Rothfels, C.J. Genes translocated into the plastid inverted repeat show decelerated substitution rates and elevated GC content. Genome Biol. Evol. 2016, 8, 2452–2458. [Google Scholar] [CrossRef] [Green Version]
  54. Wu, C.S.; Chaw, S.M. Evolutionary stasis in cycad plastomes and the first case of plastome GC-biased gene conversion. Genome Biol. Evol. 2015, 7, 2000–2009. [Google Scholar] [CrossRef] [Green Version]
  55. Kim, K.J.; Lee, H.L. Complete chloroplast genome sequences from Korean ginseng (Panaxschinseng Nees) and comparative analysis of sequence evolution among17vascular plants. DNA Res. 2004, 11, 247–261. [Google Scholar]
  56. Asaf, S.; Waqas, M.; Khan, A.L.; Khan, M.A.; Kang, S.M.; Imran, Q.M.; Shahzad, R.; Bilal, S.; Yun, B.W.; Lee, I.J. The complete chloroplast genome of wild rice (Oryza minuta) and its comparison to related species. Front. Plant Sci. 2017, 8, 304. [Google Scholar] [CrossRef] [Green Version]
  57. Cho, K.S.; Park, T.H. Complete chloroplast genome sequence of Solanum nigrum and development of markers for the discrimination of S. nigrum. Horticult. Environ. Biotechnol. 2016, 57, 69–78. [Google Scholar] [CrossRef]
  58. Hu, Y.; Woeste, K.E.; Zhao, P. Completion of the chloroplast genomes of five chinesejuglans and their contribution to chloroplast phylogeny. Front. Plant Sci. 2016, 7, 1955. [Google Scholar]
  59. Asaf, S.; Khan, A.L.; Khan, A.; Khan, G.; Lee, I.J.; Al-Harrasi, A. Expanded inverted repeat region with large scale inversion in the first complete plastid genome sequence of Plantago ovata. Sci. Rep. 2020, 10, 3881. [Google Scholar] [CrossRef] [Green Version]
  60. Hong, S.Y.; Cheon, K.S.; Yoo, K.O.; Lee, H.O.; Cho, K.S.; Suh, J.T.; Kim, S.J.; Nam, J.H.; Sohn, H.B.; Kim, Y.H. Complete Chloroplast Genome Sequences and Comparative Analysis of Chenopodium quinoa and C. album. Front. Plant Sci. 2017, 8, 1696. [Google Scholar] [CrossRef]
  61. Nie, X.J.; Lv, S.Z.; Zhang, Y.X.; Du, X.H.; Wang, L.; Biradar, S.S.; Tan, X.F.; Wan, F.H.; Song, W.N. Complete chloroplast genome sequence of a major invasive species, crofton weed (Ageratinaadenophora). PLoS ONE 2012, 7, e36869. [Google Scholar] [CrossRef] [Green Version]
  62. Xie, D.F.; Yu, Y.; Deng, Y.Q.; Li, J.; Liu, H.Y.; Zhou, S.D.; He, X.J. Comparative analysis of the chloroplast genomes of the Chinese endemic genus Urophysa and their contribution to chloroplast phylogeny and adaptive evolution. Int. J. Mol. Sci. 2018, 19, 1847. [Google Scholar] [CrossRef] [PubMed] [Green Version]
  63. Xiong, Y.L.; Xiong, Y.; He, J.; Yu, Q.Q.; Zhao, J.M.; Lei, X.; Dong, Z.X.; Yang, J.; Peng, Y.; Zhang, X.Q.; et al. The Complete Chloroplast Genome of Two Important Annual Clover Species, Trifoliumalexandrinum and T. resupinatum: Genome Structure, Comparative Analyses and Phylogenetic Relationships with Relatives in Leguminosae. Plants 2020, 9, 478. [Google Scholar] [CrossRef] [Green Version]
  64. Tong, W.; Kim, T.S.; Park, Y.J. Rice chloroplast genome variation architecture and phylogenetic dissection in diverse Oryza species assessed by whole-genome resequencing. Rice 2016, 9, 57. [Google Scholar] [CrossRef] [PubMed] [Green Version]
  65. Perdereau, A.; Klaas, M.; Barth, S.; Hodkinson, T.R. Plastid genome sequencing reveals biogeographical structure and extensive population genetic variation in wild populations of Phalarisarundinacea L. in north-western Europe. Glob. Chang. Biol. Bioenergy 2017, 9, 46–56. [Google Scholar] [CrossRef] [Green Version]
  66. Borsch, T.; Quandt, D. Mutational dynamics and phylogenetic utility of noncoding chloroplast DNA. Plant Syst. Evol. 2009, 282, 169–199. [Google Scholar] [CrossRef]
  67. Piedra-Malagón, E.M.; Albarrán-Lara, A.L.; Rull, J.; Piero, D.; Sosa, V. Using multiple sources of characters to delimit species in the genus Crataegus (Rosaceae): The case of the Crataegusrosei complex. Syst. Biodivers. 2016, 14, 244–260. [Google Scholar] [CrossRef]
  68. Brown, J.A.; Beatty, G.E.; Finlay, C.; Montgomery, I.; Tosh, D.G.; Provan, J. Genetic analyses reveal high levels of seed and pollen flow in hawthorn (Crataegusmonogyna, Jacq.), a key component of hedgerows. Tree Genet. Genomes 2016, 12, 58. [Google Scholar] [CrossRef] [Green Version]
  69. Liu, H.J.; Ding, C.H.; He, J.; Cheng, J.; Pei, L.Y.; Xie, L. Complete chloroplast genomes of Archiclematis, Naravelia and Clematis (Ranunculaceae), and their phylogenetic implications. Phytotaxa 2018, 343, 214–226. [Google Scholar] [CrossRef]
  70. Pauwels, M.; Vekemans, X.; Gode, C.; Frerot, H.; Castric, V.; Saumitou-Laprade, P. Nuclear and chloroplast DNA phylogeography reveals vicariance among European populations of the model species for the study of metal tolerance, Arabidopsis halleri (Brassicaceae). New Phytol. 2012, 193, 916–928. [Google Scholar] [CrossRef]
  71. Li, X.W.; Gao, H.H.; Wang, Y.T.; Song, J.Y.; Henry, R.; Wu, H.Z.; Hu, Z.G. Complete chloroplast genome sequence of Magnolia grandiflora and comparative analysis with related species. Sci. China Life Sci. 2013, 56, 189–198. [Google Scholar] [CrossRef] [PubMed] [Green Version]
  72. Khakhlova, O.; Bock, R. Elimination of deleterious mutations in plastid genomes by gene conversion. Plant J. 2006, 46, 85–94. [Google Scholar] [CrossRef]
  73. Dong, W.P.; Liu, J.; Yu, J.; Wang, L.; Zhou, S.L. Highly variable chloroplast markers for evaluating plant phylogeny at low taxonomic levels and for DNA barcoding. PLoS ONE 2012, 7, e35071. [Google Scholar] [CrossRef] [PubMed]
  74. Yao, X.; Tan, Y.H.; Liu, Y.Y.; Song, Y.; Yang, J.B.; Corlett, R.T. Chloroplast genome structure in Ilex (Aquifoliaceae). Sci. Rep. 2016, 6, 28559. [Google Scholar] [CrossRef] [PubMed] [Green Version]
  75. Yang, Z.; Zhao, T.T.; Ma, Q.H.; Liang, L.S.; Wang, G.X. Comparative genomics and phylogenetic analysis revealed the chloroplast genome variation and interspecific relationships of Corylus (Betulaceae) species. Front. Plant Sci. 2018, 9, 927. [Google Scholar] [CrossRef] [PubMed]
  76. Fehrer, J.; Gemeinholzer, B.; Chrtek, J.; Bräutigam, S. Incongruent plastid and nuclear DNA phylogenies reval ancient intergeneric hybridization in Pilosellahawkweeda (Hieracium, Cichorieae, Asteraceae). Mol. Phylogenet. Evol. 2007, 42, 347–361. [Google Scholar] [CrossRef]
  77. Du, F.K.; Peng, X.L.; Liu, J.Q.; Lascoux, M.; Hu, F.S.; Petit, R.J. Direction and extent of organelle DNA introgression between two spruce species in the Qinghai-Tibetan Plateau. New Phytol. 2011, 192, 1024–1033. [Google Scholar] [CrossRef] [PubMed]
Figure 1. Gene map of four Crataegus (C. bretschneideri, C. pinnatifida var. major, C. pinnatifida, and C. maximowiczii) chloroplast genomes. Genes drawn outside circle are transcribed clockwise, while the genes inside the circle are transcribed counterclockwise. The colored bars represent genes of different functional groups. The darker gray color in the inner circle corresponds the GC content of the plastomes.
Horticulturae 07 00301 g001
Figure 2. Comparison of the LSC, IR, and SSC borders among the four Crataegus plastomes.
Horticulturae 07 00301 g002
Figure 3. Sequence alignment of the four Crataegus chloroplast genomes in the mVISTA program. C. bretschneideri was employed as a reference. The x-axis indicates coordinates in the chloroplast genome. The vertical axis represents sequence alignment similarity of 50–100%. Gray arrow indicates gene orientation. Purple indicates exons, blue indicates introns, and pink indicates conserved non-coding sequences (CNSs).
Horticulturae 07 00301 g003
Figure 4. The number of different base substitutions in the plastomes of Crataegus species.
Horticulturae 07 00301 g004
Figure 5. Sliding window analysis of the whole plastomes of four Crataegus species. x-axis shows the position of the midpoint of each window; y-axis shows value of nucleotide diversity in a sliding window analysis of window size 600 bp with step size 100 bp.
Horticulturae 07 00301 g005
Figure 6. Analysis of repeat sequences in the four Crataegus plastomes. (A) Numbers of different types of repeat sequences. (B) Length distribution of repeat sequences in their respective plastomes.
Horticulturae 07 00301 g006
Figure 7. Types and distribution of simple sequence repeats (SSRs) among the four Crataegus plastomes. (A) SSR distribution in various regions. (B) Frequency of SSRs in the LSC, IR, and SSCregions. (C) Number of detected SSR motifs in different classes of repeats. (D) Frequency of each SSR type.
Horticulturae 07 00301 g007
Figure 8. Phylogenetic tree of 36 Rosaceae species based on whole chloroplast genome sequences with maximum likelihood and Bayesian inference. Numbers near the nodes are values for bootstrap support.
Horticulturae 07 00301 g008
Table 1. Biogeographic regions and sample collection sites of four Crataegus species.
TaxonIdentification CodeBiogeographic RegionCollection Site
C. bretschneideriZF1HNortheast, ChinaShenyang
C. pinnatifidaCZSLHNortheast, ChinaShenyang
C. pinnatifida var. majorJD1HNorth, ChinaShenyang
C. maximowicziiMSZ1HNortheast, ChinaShenyang
Table 2. Elemental characteristics of four Crataegus chloroplast genomes.
CharacteristicsC. bretschneideriC. pinnatifidaC. pinnatifida var. MajorC. maximowiczii
Total size(bp)159,607159,656159,676159,875
LSC length (bp)87,60187,74987,74487,874
SSC length (bp)19,31219,13919,16419,233
IR length (bp)26,34726,38426,38426,384
Overall GC content(%)36.6%36.7%36.6%36.6%
GC in LSC (%)34.4%34.4%34.4%34.3%
GC in IR (%)42.7%42.6%42.6%42.6%
GC in SSC (%)30.3%30.6%30.5%30.4%
Total number of genes113113113113
Protein genes79797979
rRNA genes30303030
tRNA genes4444
Duplicated genes19191919
Accession numberMW963339MZ494514MZ494513MZ494512
Table 3. List of annotated genes encoded by the four Crataegus chloroplast genomes.
Gene CategoryGene GroupNames of Gene
PhotosyntheticSubunit of rubiscorbcL
Photosystem IpsaA, psaB, psaC, psaI, psaJ
Photosystem IIpsbA, psbB, psbC, psbD, psbE, psbF, psbH, psbI, psbJ, psbK, psbL, psbM, psbN, psbT, psbZ
Subunit of synthaseatpA, atpB, atpE, atpF *, atpH, atpI
CytochromecompelxpetA, petB *, petD *, petG, petL, petN
Subunits of NADPH dehydrogenasendhA *, ndhB *, ndhC, ndhD, ndhE, ndhF, ndhG, ndhH, ndhI, ndhJ, ndhK
Self-replicationTransfer RNAtrnA-UGC *, trnC-GCA, trnD-GUC, trnE-UUC, trnF-GAA, trnfM-CAU, trnG-UCC, trnG-GCC *, trnH-GUG, trnI-CAU, trnI-GAU *, trnK-UUU *, trnL-CAA, trnL-UAA *, trnL-UAG, trnfM-CAUI, trnM-CAU, trnN-GUU, trnP-UGG, trnQ-UUG, trnR-ACG, trnR-UCU, trnS-GCU, trnS-GGA, trnS-UGA, trnT-GGU, trnT-UGU, trnV-GAC, trnV-UAC *, trnW-CCA, trnY-GUA
Ribosomal RNArrn5, rrn4.5, rrn16, rrn23
Proteins of large ribosomal subunitrpl2 *, rpl14, rpl16 *, rpl20, rpl22, rpl23, rpl32, rpl33, rpl36
Proteins of small ribosomal subunitrps2, rps3, rps4, rps7, rps8, rps11, rps12 *, rps14, rps15, rps16, rps18, rps19,
RNA polymeraserpoA, rpoB, rpoC1, rpoC2
BiosynthesisMaturasematK
Carbon metabolismcemA
ProteaseclpP *
Fatty acid synthesisaccD
Cytochrome synthesis geneccsA
Translation initiation factorinfA
Unknown functionConserved open reading framesycf1, ycf2, ycf3 *, ycf4
* Indicates genes containing introns.
Table 4. Analysis of variablesites in the four Crataegus plastomes.
LengthVariable SitesParsimony-Informative SitesNucleotide Diversity
(bp)Number%Number%
LSC region88,7053160.35622280.2570.0022
IR26,383220.0834160.06060.0003
SSC region19,4351070.5506870.44760.0036
Total160,9064450.27663310.20570.0017
Publisher’s Note: MDPI stays neutral with regard to jurisdictional claims in published maps and institutional affiliations.

