Abstract
Effects of non-leguminous cover crops and their times of chopping on the yield and quality of no-till baby corn (Zea mays L.) were evaluated during two kharif seasons (May-August in 2014 and 2015) under subtropical climatic conditions of Punjab, India. The experiment was laid out in a split-plot design with four replications at Punjab Agricultural University’s Research Farm. Three cover crops (pearl millet (Pennisetum glaucum L.), fodder maize (Zea mays L.), and sorghum (Sorghum bicolor L.)) and the control (no cover crop) were in the main plots and chopping time treatments (25, 35, 45 days after planting (DAP)) in the subplots. During both kharif seasons, the yield (cob and fodder yield) and dry matter accumulation of baby corn following cover crop treatments, especially pearl millet, were significantly (p ≤ 0.05) higher than the control, and improved with increments in chopping time from 25 to 45 DAP. The effect of cover crops on baby corn quality (i.e., protein, starch, total soluble solids, crude fiber, total solid, and sugar content) did not differ among treatments, while increasing increments in chopping time had a significant effect on the protein and sugar content of baby corn. The use of cover crops and increment in chopping time helped in enhancing topsoil quality, especially available nitrogen; yet, the effect of cover crops and their times of chopping on topsoil organic carbon, phosphorus, and potassium did not differ among treatments. During both seasons, there was no significant interaction between cover crop and time of chopping among treatments with respect to baby corn yield and quality, as well as topsoil quality parameters.
1. Introduction
Maize (Zea mays L.), also called corn, is the third most important cereal crop in the world after rice and wheat as a source of calories and in terms of the value of production [1,2,3]. The importance of maize worldwide is driven by its multiple uses as human food, livestock feed, a variety of food and industrial products, and seed [4]. Maize is grown as a food crop (i.e., grain maize) in many tropical areas, particularly in Latin American, African, and Asian countries, including India. In 2014, India produced about 23.7 million tons of maize on 9.3 million ha [5]. The average maize yield in India was 2.56 t⋅ha−1 during 2015–2016, less than one-quarter of that obtained in the United States of America (USA), and less than half of that obtained in China and Brazil [6].
As a C4 plant, maize has a higher grain yield potential than other major cereal grains (i.e., wheat and rice) [7]. Maize can be directly consumed as food at different stages of crop development, from baby corn to mature grain. Baby corn is the young, fresh, and finger-like ears of fully-grown standard cultivars, which are harvested immediately after the silks emerge (i.e., within 2 or 3 days of silk emergence) and before pollination and fertilization [8,9]. In general, except for the length of time from the establishment to harvest, baby corn cultivation practices are similar to those of maize cultivation. Baby corn has increasingly gained popularity as a valued vegetable throughout the world. In India, baby corn has also emerged as a potential remunerative crop, especially among progressive farmers.
Maize, a heavy user of nutrients, requires more nitrogen (N) compared to other mineral nutrients. Shivay et al. [10] reported that increasing N application rate significantly increased leaf area index, dry matter accumulation, and net assimilation rate at different growth stages of maize. Cover crops (leguminous or non-leguminous cover crops) or green manures (particularly leguminous green manures) have the potential to fully or partially replace inorganic N fertilizer, particularly for high N-requiring cereal crops such as maize, and thereby promote the use of sustainable production practices. Leguminous cover crops are commonly used to provide N for use by subsequent crops [11,12]. Leguminous crops contribute N through symbiotic dinitrogen (N2) fixation, reduce N fertilizer needs for subsequent crop, and increase soil N retention [13,14]. While leguminous cover crops are used as N sources to supplement or replace inorganic N fertilizer, non-leguminous cover crops have the potential to enhance soil organic matter by increasing biomass production and by scavenging nutrients, especially N leftover from previous crops [15]. Non-leguminous cover crops have been also reported to reduce nitrate leaching losses [16,17]. The use of legume-grass mixtures could combine the benefits of both, including N fixation, biomass production, and N scavenging [18,19].
The selection of cover crops for a given region requires, among others, knowledge of their growth potentials [20,21]. The major climatic variables affecting cover crop selection include temperature and rainfall [22]. Non-leguminous cover crops have become more important in tropical and subtropical areas, such as Punjab in India where crop residues in conventional systems are not enough to compensate for the loss of soil organic matter due to high rates of mineralization [23]. Additionally, the limited availability of farmyard manures could be overcome by using non-leguminous cover crops, especially in subtropical areas of Punjab by sowing them before Kharif baby corn (i.e., monsoon crop). In Punjab, these non-leguminous cover crops often include pearl millet (Pennisetum glaucum L.), fodder maize, and sorghum (Sorghum bicolor L.).
Cover crops could jump-start no-till, resulting in yield increases [3]. Hoorman et al. [3] reported that maize yields dropped slightly for the first five to seven years after switching to no-till because continuous conventional tillage oxidized the soil organic matter and soil productivity declined with time. However, long-term (i.e., seven to nine years), no-till practices improved soil health by getting microbes and soil fauna back into balance, restored nutrients lost by conventional tillage and increased organic matter levels, resulting in higher maize yields than conventionally tilled fields [3]. Hoorman et al. [3] suggested that cover crops could be an important part of a continuous no-till system for maintaining short-term as well as increasing long-term maize yields. The effects of leguminous cover crops on improved maize yield and enhanced soil N under no-till conditions have been repeatedly stressed in the literature [24,25,26,27,28,29]. Despite non-leguminous cover crops having beneficial effects on crop production, there remains a paucity of information about their effects on no-till maize or baby corn production, especially under subtropical conditions of Punjab, India.
In Punjab, planting Kharif non-leguminous cover crops has been often recommended in the second fortnight of April [30]. The benefits of non-leguminous cover crops as fodder crops could be obtained by cutting 50-day old crops before planting subsequent maize or baby corn crop [30]. Non-leguminous cover crops can be chopped before their flowering stages, and subsequent maize or baby corn crop can be planted under no-till conditions. The effects of leguminous cover crops such as sunn hemp (Crotolaria juncea), cowpea (Vigna unguiculata), and dhaincha (Sesbania aculeata) and their times of chopping on maize growth and yield have been evaluated in very few studies. Salaria [31] reported that the combination of leguminous cover crops (sunn hemp, cowpea, and dhaincha) and their times of chopping increased average maize grain yield by 15.3% over the control under subtropical climatic conditions. A significant interaction between leguminous cover crops and increment in chopping time indicated that chopping of cover crops at 45 days after planting (DAP) increased average maize grain yield by 12.9% and 24.6% over chopping at 35 DAP and 25 DAP, respectively [31]. Moreover, the manner in which leguminous cover crops have been used, various N levels as well as time of chopping, have improved available soil nitrogen (N), phosphorus (P), potassium (K) and organic carbon at harvest during a kharif no-till maize growing season [31]. In contrast, very little is known about the effects of non-leguminous cover crops and their times of chopping on the yield and quality of baby corn grown under tropical or subtropical climatic conditions. Therefore, the objective of this study was to evaluate the effects of non-leguminous cover crops (pearl millet, fodder maize, and sorghum) and increments in chopping time (25 DAP, 35 DAP, and 45 DAP) on the yield and quality of no-till baby corn during kharif seasons under the subtropical climatic conditions of Punjab, India.
2. Materials and Methods
2.1. Experimental Site
The field experiment was conducted at the Research Farm of the Department of Agronomy, Punjab Agricultural University, Ludhiana, India (latitude 30°53′58.27″ N, longitude 75°47′50.26″ E, at an altitude of 247 m above mean sea level) during two summer or kharif seasons (i.e., May–August in 2014 and 2015). The soil of the experimental field was sandy loam (coarse-loamy, calcareous, mixed, hyperthermic Typic Ustochrept) containing 3.3·g·kg−1 organic carbon [32]. On average, within the 0–180 cm soil depths, soil pH, electrical conductivity (EC), soil water content at 30 kPa (i.e., soil water content at field capacity), and soil water content at 1500 kPa (i.e., soil water content at wilting point) were 8.0, 0.20·dS·cm−1, 13.23%, and 7.61%, respectively [32]. As reported by Kukal and Sidhu [32], the soil in the experimental field was generally low in content of KMnO4-extractable N (152·kg·ha−1), and medium in content of 0.5 N NaHCO3-extractable P (13.7·kg·ha−1) and available K (145·kg·ha−1).
2.2. Weather Conditions
The experimental site was located in a region characterized by a subtropical, semi-arid climate with three distinct seasons: hot and dry summer (April–June) when kharif crops are grown, hot and humid monsoon (July–September), and cold winter (November–January) when rabi crops are grown. Weather data obtained from the meteorological observatory at Punjab Agricultural University, which was approximately 500 m from the experimental site, included maximum and minimum air temperatures, relative humidity, rainfall, and soil evaporation during two kharif seasons (2014–2015) (Figure 1). The weekly average maximum air temperature varied between 38.8 °C and 46.4 °C in 2014 (6 May–26 August) and between 38.9 °C and 48.2 °C in 2015 (6 May–26 August). The weekly average minimum air temperature ranged between 20.7 °C and 29.3 °C and 24.1 °C and 27.9 °C during 2014 and 2015, respectively. The weekly average relative humidity ranged from 43.9% to 84.4% in 2014 and from 29.6% to 81.1% in 2015. The experimental site received considerably less rainfall (161 mm) during the kharif season in 2014 compared to the kharif season in 2015 (197 mm). The weekly average soil evaporation rates varied from 24 mm to 80 mm and from 23.3 mm to 84 mm during 2014 and 2015, respectively.
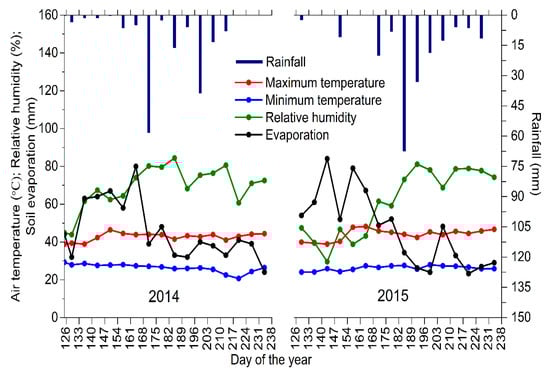
Figure 1.
Weekly average weather data observed at the experimental site during both kharif seasons (6 May–26 August in 2014 and 2015).
2.3. Experimental Design and Agronomic Practices
The experimental field was divided into forty plots each 11 m × 3 m in size. All plots were subjected to no-till practices during both kharif seasons (2014–2015). The experiment was laid out in a split-plot randomized complete block design with four replications, which were comprised of three cover crops (i.e., non-leguminous pearl millet, fodder maize, and sorghum) and the control (no cover crop) in the main plots and cover crop chopping time treatments (i.e., 25 DAP, 35 DAP, and 45 DAP) in the sub-plots. All cover crops (pearl millet, fodder maize, and sorghum) were manually sown using the dibbling method on 5 May, 15 May, and 25 May during the kharif season in 2014, while all cover crops were sown on 9 May, 19 May, and 29 May during the kharif season in 2015. No fertilizers were applied to cover crops. The cover crops were chopped on 19 June in 2014 and on 22 June in 2015, corresponding to 25 DAP, 35 DAP, and 45 DAP at the time of chopping. The 25-, 35-, and 45-day old cover crops were chopped in situ using a chopper-cum-spreader and left uniformly on the soil surface. The chopper-cum-spreader used in this study was a tractor mounted flail type chopper, which was designed and developed by the Central Institute of Agricultural Engineering (CIAE), Bhopal, India [33]. The chopper cut cover crops above the ground level and chopped them into small pieces (i.e., 5–10 cm in length). The blades of the chopper were covered to prevent the spread of chopped cover crops from one plot to another. Baby corn was then planted on 19 June in 2014 and 22 June in 2015.
Baby corn (variety G-5414, Syngenta, India) was sown at a rate of 40·kg·ha−1 by the dibbling method at a row × plant spacing of 30 cm × 20 cm recommended by Dhaliwal and Kular for baby corn [30]. The recommended doses of N, P and K were used at rate of 120·kg·N·ha−1 as urea, 50·kg·P·ha−1 as diammonium phosphate and 30·kg·K2O ha−1 as muriate of potash, respectively [30,34]. Half of the N and full doses of P and K were applied to baby corn as basal doses. The remaining dose of N was top-dressed at the knee-high stage of the baby corn. Prior to planting cover crops, pre-sowing flood irrigation was applied to all plots during both kharif seasons (2014–2015). Cover crops were sown when the soil water content was at field capacity in experimental plots. No post-sowing irrigation was applied to cover crops. As shown in Figure 1, a significant amount of rainfall during both seasons resulted in sufficient soil water content for cover crops. After chopping cover crops, all treatment plots had sufficient soil water content for the emergence of baby corn. A first irrigation was applied to baby corn at 8 DAP during both seasons. Additional irrigations were applied at two critical growth stages of water stress [35], i.e., at the knee-high stage and at the tassel emergence and silking stage, respectively.
2.4. Harvest of Baby Corn and Yield
To determine the dry matter accumulation, a plant sample of baby corn was collected at harvest from each treatment plot, sun-dried, and then oven-dried to a constant weight at 60 °C for 48–72 h. Generally, the dry matter accumulation provides an indicator of the growth and metabolic efficiency of the plant (i.e., an indicator of the crop yield) [31]. During both kharif seasons, baby corn cobs for each treatment plot was hand-harvested at two picking dates. The cobs were ready for first picking at 55 DAP when the silk length was about 2–4 cm. The second harvest was performed 5 days after the first harvest date. Baby corn can be marketed as green ears (with husk) and dehusked ears. All collected cobs, immediately after harvest, were dehusked by hand to remove their outer sheaths and weighed, and baby corn cob yield for each plot was recorded. After the completion of cob-picking, the crop was harvested, and green fodder (i.e., green stems and leaves of baby corn) yield for each plot was determined.
2.5. Quality Parameters of Baby Corn
The protein content (%) of baby corn cobs from individual treatments was estimated by multiplying its N content by the factor 6.25 [36]. The N content (%) was determined using the Kjeldahl distillation method [37]. The total soluble solids (TSS) (%) was determined with a hand-held digital refractometer (Erma, Tokyo, Japan) following the procedure described by Nelson and Sommers [38]. The total sugar content (%) of baby corn was estimated using the modified Nelson-Somogyi method [39,40]. The measurement of total solids content or dry matter content (% in relation to sample weight) of a baby corn cob was made by placing the sample (15 g) in a hot air oven at a temperature of 70 °C for 16–18 h until a constant mass was obtained. The dried sample was cooled down to room temperature in a desiccator, and the total solids content was determined as the remaining weight of the sample after drying.
The starch content (%) of a baby corn cob sample (i.e., about 5 g sample) was determined using the colorimetric method [41]. After the sugars present in the sample were extracted until a quantitative test with anthrone gave no green color, the sample was cooled and mixed with perchloric acid, solubilized, filtered, and diluted. The diluted solution was mixed with anthrone reagent and boiled until the reaction was completed. The solution was then allowed to cool, and its absorbance was measured at 630 nm in a spectrophotometer. The concentration of starch was calculated from a standard curve. A standard curve was prepared using 0.5, 1.0, and 1.5 mL of starch standard solution in a 100 mL volumetric flask. A 5 mL solution from each sample was used to develop the standard curve, i.e., a plot of absorbance versus concentration.
The crude fiber content (%) of baby corn cob was determined using the method described by Ranganna [41] and Horwitz [42]. About 2 g of baby corn cob sample was placed into the crucible, dissolved in 200 mL of sulfuric acid (H2SO4) solution, and boiled for 30 min in a digestion flask with the condenser. The hydrolyzed mixture was filtered, and the residue was rinsed with hot water to remove acid from the filtrate in the crucible. The residue from acid digestion was washed again in the flask with 200 mL of sodium hydroxide (NaOH) solution and boiled for 30 min. The hydrolyzed sample was again filtered, and the residue was rinsed with hot water to ensure that the crucible was free of alkalinity. The residue in the crucible was oven-dried at 105 °C until a constant mass was attained. The crucible containing dry residue was weighed and placed in a muffle furnace at 550 °C for 5 h. The crucible with ash was cooled to room temperature in a desiccator and weighed. The crude fiber content of baby corn cob sample was then calculated as:
2.6. Soil Analysis
Prior to planting cover crops in 2014, soil samples within the topsoil (0–20 cm soil depth) were collected from the experimental field to determine soil texture and soil chemical properties (Table 1). To determine soil chemical properties following cover crop treatments, soil samples (0–20 cm) were collected from all cover crop and control treatment plots immediately after harvesting baby corn in 2014 and 2015. The available soil nitrogen (N) was determined using the modified alkaline permanganate extraction method proposed by Subbaiah and Asija [43], the available soil phosphorus (P) using the sodium bicarbonate extraction method described by Olsen [44], and the available soil potassium (i.e., the ammonium acetate extractable K) using the method described by Merwin and Peech [45]. The chromic acid titration method [46] was used to determine the soil organic carbon.

Table 1.
Selected soil chemical properties of the experimental field determined prior to planting non-leguminous cover crops during kharif season (May–August) in 2014.
2.7. Statistical Analysis
The analysis of variance (ANOVA) was performed using the General Linear Model (GLM) procedure of SAS software version 9.4 (SAS Institute, Cary, NC, USA). The appropriate error term was used to evaluate each factor and interaction. The main plot factors (cover crops) and sub-plot factors (times of chopping) were considered as fixed variables, and the data in 2014 and 2015 was considered as random variables. Differences among treatment means were compared using Fisher’s protected least significance difference (LSD) test. Statistical significance was evaluated at p ≤ 0.05.
3. Results and Discussion
3.1. Cover Crop Effects on Dry Matter Accumulation and Cob Yield of Baby Corn
The dry matter content of baby corn following non-leguminous cover crop treatments (pearl millet, fodder maize, and sorghum) was determined at harvest. The combination of cover crops and different times of chopping (25 DAP, 35 DAP, and 45 DAP) resulted in a higher amount of dry matter accumulation of baby corn compared to the control (no cover crop treatment) in 2014 and 2015 (Table 2). Similar enhanced dry matter content following cover crops and their times of chopping under no-till maize production was also reported by Salaria [31]. However, Salaria [31] evaluated leguminous cover crops (e.g., sunnhemp, cowpea, and dhaincha) and different N levels for their effects on dry matter yield of maize grown under subtropical climatic conditions.
Table 2.
Effects of cover crops and their times of chopping (at different days after planting (DAP)) on the dry matter of baby corn, the cob yield of baby corn, and the green fodder yield of baby corn during both kharif seasons (May–August in 2014 and 2015).
On average, the dry matter of baby corn in 2014 and 2015 (4.34 t·ha−1 and 4.40 t·ha−1, respectively) was significantly (p ≤ 0.05) higher following pearl millet cover crop treatment than following sorghum cover crop and control treatments. However, the dry matter of baby corn following fodder maize cover crop was similar to that observed following pearl millet cover crop in both years. In a review study, Dar et al. [47] reported that the dry matter yield of baby corn grown in India varied from 6.0 to 8.0 t·ha−1 during rabi and late-rabi seasons and from 8.0 to 9.0 t·ha−1 during kharif and summer seasons. The higher dry matter yield of baby corn reported by different studies was mainly influenced by various agronomic practices including closer crop geometries (i.e., closer row spacing) and higher rates of N application [47]. Eltelib et al. [48] observed that the dry matter yield of maize ranged from 3.7 to 12.2 t·ha−1 based on the amount of fertilizer application especially different levels of N application.
The maximum cob yield of baby corn was observed following pearl millet cover crop treatment in both years (Table 2). The cob yield of baby corn (1.45 t·ha−1 and 1.50 t·ha−1 in 2014 and 2015, respectively) was significantly (p ≤ 0.05) higher following pearl millet than no cover crop (i.e., control) and sorghum cover crop. The cob yield of baby corn following fodder maize cover crop was statistically similar to the cob yield observed following pearl millet cover crop treatment in both years. On average, pearl millet cover crop treatment resulted in a relatively higher amount of green fodder yield of 20.52 t·ha−1 and 20.56 t·ha−1 in 2014 and 2015, respectively (Table 2). The green fodder yield of baby corn following sorghum was slightly lower than that of the control treatment in both years. However, the fodder yield of baby corn in both years was not significantly different between all cover crops and the control. Although information pertinent to the effect of non-leguminous and leguminous cover crops on cob and fodder yields of baby corn grown under subtropical climatic conditions is very limited, comparable results have been reported by several studies. For instance, as reported by Dar et al. [47], the yield of baby corn or sweet corn grown in India generally varied from 1.2 to 12.7 t·ha−1, while the fodder yield of baby corn (sum of green fodder yield and dry fodder yield) ranged from 4.12 to 27.0 t·ha−1. Baby corn intercropped with fodder legumes, such as maize, cowpea, clusterbean (Cyamopsis tetragonoloba L.), and pillipesara (Phaseolus trilobus L.), has been reported to produce 28.6 to 50.5 t·ha−1 green fodder and 5.1 to 8.8 t·ha−1 dry fodder yield of baby corn during rabi season [49]. The higher baby corn and fodder yield data reported in previous studies [47,49] were primarily attributed to high rates of N application, plant densities, and planting patterns.
In situ chopping of cover crops at 25 DAP, 35 DAP, and 45 DAP was likely to provide a large quantity of cover crop biomass, which could improve soil physical properties such as soil water retention and soil temperature. Cover crop residues could also provide additional nutrients for better growth responses of the subsequent crop [50]. Accordingly, compared to the control, the relatively higher dry matter accumulation of baby corn observed following all cover crop treatments was most likely due to the improved soil conditions. During both years, pearl millet cover crop was growing faster than sorghum and fodder maize. The relatively fast-growing deep root system of pearl millet [51,52] might scavenge more nutrients, resulting in more biomass production and dry matter accumulation of baby corn following this non-leguminous cover crop treatment (Table 2). The use of pearl millet as a cover crop to enhance biomass production and nutrients for subsequent crops has been reported in different studies (e.g., [53,54,55,56]). Schonbeck and Morse [53] reported that pearl millet cover crop could produce biomass from 7.0 to 12 t·ha−1. Pearl millet cover crop has been also reported to improve N use efficiency by a succeeding maize crop [54], provide 60–80% of the potassium nutrient needed for the subsequent crop [55], and improve soil organic matter and inhibit soil-borne diseases [56].
Overall, chopping of cover crops at 45 DAP showed a significant (p ≤ 0.05) effect on the dry matter accumulation of baby corn cob and green fodder yield of baby corn in both years (Table 2). The amount of dry matter accumulated in baby corn after chopping cover crops at 45 DAP (i.e., an average yield of 4.40 t·ha−1 and 4.43 t·ha−1 in 2014 and 2015, respectively) was significantly higher than the dry matter accumulation after chopping at 25 DAP and 35 DAP. Similarly, the average cob yield of baby corn observed after chopping cover crops at 45 DAP (i.e., 1.40 t·ha−1 and 1.41 t·ha−1 in 2014 and 2015, respectively) was significantly higher than those observed after chopping at 25 DAP and 35 DAP. The average green fodder yield of baby corn observed after chopping at 45 DAP (i.e., 20.31 t·ha−1 and t·ha−1 in 2014 and 2015, respectively) was slightly higher than those observed after chopping at 25 DAP and 35 DAP. However, the fodder yield of baby corn in both years was not significantly different among time of chopping treatments. Overall, the results suggested that chopping all non-leguminous cover crops, particularly pearl millet, at 45 DAP could enhance dry mass accumulation and cob and fodder yield of succeeding kharif baby corn under no-till practices. Another aspect to be noted in Table 2 is that during both kharif seasons, the interaction of cover crops and their times of chopping on the dry matter accumulation and cob and fodder yield were not significant among treatments.
3.2. Cover Crop Effects on Baby Corn Quality Parameters
3.2.1. Protein Content
The protein content of baby corn cob following non-leguminous cover crop treatments in 2014 and 2015 is presented in Table 3, suggesting that the average protein content of baby corn following cover crop treatments was slightly higher than that of no cover crop (i.e., control) treatment. On average, the higher amount of protein content of baby corn cob (12.15% and 12.26% in 2014 and 2015, respectively) was observed following pearl millet cover crop treatment. The reason might be attributed to the maximum amount of cover crop dry matter produced by pearl millet treatment that resulted in a higher amount of N available for use by subsequent baby corn, contributing to higher N uptake by baby corn. However, in both years, there was no statistically significant (p ≤ 0.05) difference in the protein content of baby corn cob between all cover crops and the control. To the best of our knowledge, very little is known about the effect of non-leguminous cover crops on the protein content of baby corn; however, similar results of the protein content in baby corn intercropped with leguminous crops were reported by several studies. For instance, Kumar and Venkateswarlu [49] reported that the protein content of baby corn intercropped with fodder legumes (e.g., maize, cowpea, clusterbean, and pillipesara) varied from 7.01% to 8.73% during rabi season. The protein content of baby corn was significantly influenced by plant densities and fertilization practices, especially high rates of inorganic N levels in different studies (e.g., [57,58]). Hooda and Kawatra [59] reported that the protein content of baby corn (17.9%) was similar or slightly higher than vegetables like cabbage, bitter gourd, eggplant, French beans, and spinach. Comparable results (i.e., protein content varied between 10.3% and 12.96%) were also reported for sweet corn and maize [60,61]. The protein content of forage maize has been reported to vary from 3.67% to 9.06% under different levels of N application [48].
Table 3.
Effects of cover crops and their times of chopping (at different days after planting (DAP)) on the protein content, the starch content, and the crude fiber content of baby corn cob during both kharif seasons (May–August in 2014 and 2015).
The average protein content of baby corn cob after chopping cover crops at 45 DAP was significantly (p ≤ 0.05) higher than the protein content obtained after chopping at 25 DAP (Table 3). The protein content of baby corn cob was not significantly different after chopping cover crops at 35 DAP and 45 DAP. On average, the maximum protein content (12.60% and 12.68% in 2014 and 2015, respectively) was observed after chopping cover crops at 45 DAP. As mentioned earlier, the higher protein content of baby corn could be explained by the higher dry matter of cover crops and resulting higher amount of N associated with increment in chopping time from 25 DAP to 45 DAP. There was no interaction of cover crops and their times of chopping on the protein content of baby corn cob among treatments (Table 3).
3.2.2. Starch Content
The starch content of baby corn cob, as shown in Table 3, was not significantly (p ≤ 0.05) different between all cover crops and the control in both years. On average, the maximum starch content (2.41% in both years) was observed following pearl millet cover crop treatment. There is a paucity of quantitative information on the starch content of baby corn following non-leguminous cover crop treatments. Nevertheless, evaluation of nutritional compositions of baby corn or sweet corn in several studies reported different starch content values for baby corn. For instance, Hooda and Kawatra [59] reported a starch content value of 15.6% for baby corn. Ugur and Maden [62] suggested that sweet corn would contain 10% to 11% starch. Generally, the average starch content of baby corn decreased with increment in chopping time from 25 DAP to 45 DAP. On average, the maximum starch content of baby corn (2.41% and 2.42% in 2014 and 2015, respectively) was observed after chopping cover crops at 25 DAP. As shown in Table 3, there was no interaction of cover crops and their times of chopping on the starch content of baby corn cob in both years.
3.2.3. Crude Fiber Content
The average crude fiber content of baby corn cob varied between 2.40% and 2.41% among cover crop and control treatments in both years (Table 3). The average crude fiber content was not significantly (p ≤ 0.05) different between all cover crops and the control. A slightly lower amount of crude fiber was observed following pearl millet cover crop and no cover crop (control) treatments compared to fodder maize and sorghum cover crop treatments. The lower crude fiber content of baby corn in this study might be explained by the higher protein content of baby corn (Table 3), which generally decreased the deposition of lignin and cellulose [62]. Nutritional evaluation of baby corn for crude fiber content has yielded contrasting results in different studies. For instance, similar results of lower crude fiber contents of baby corn (4.53–5.89%) were reported by several studies (e.g., [57,59,63]). Shobha et al. [64] evaluated the quality of eleven maize genotypes at baby corn and grain maturity stages and observed lower crude fiber contents ranging from 1.96% to 2.40% among maize genotypes. In contrast, Kumar and Venkateswarlu [49] reported higher crude fiber content of baby corn (i.e., 23.76–25.71%) intercropped with fodder legumes (e.g., maize, cowpea, clusterbean, and pillipesara). Eltelib et al. [48] also reported that the crude fiber content of maize varied between 21.13% and 22.1%. The higher crude fiber contents of baby corn or maize in their studies were significantly influenced by high rates of N application.
The crude fiber content of baby corn cob was not significantly (p ≤ 0.05) different after chopping cover crops at 25 DAP, 35 DAP, and 45 DAP in both years (Table 3). On average, the minimum amount of crude fiber content in baby corn cob (i.e., 2.10% in both years) was observed after chopping cover crops at 45 DAP. There was no statistically significant interaction between cover crops and their times of chopping among treatments with respect to the crude fiber content of baby corn cob.
3.2.4. Total Soluble Solids and Total Solid Content
There was no statistically significant (p ≤ 0.05) difference in the total soluble solids (TSS) content of baby corn cob between all cover crops and the control in both years (Table 4). On average, the maximum amount of TSS (8.88 °Brix and 8.89 °Brix in 2014 and 2015, respectively) was observed following pearl millet cover crop treatment. Information about the effect of non-leguminous cover crops on the TSS content of baby corn is still limited; however, similar TSS values were reported by several studies that evaluated nutritional composition of baby corn. For instance, Joshi and Chilwal [58] reported that the TSS of baby corn varied from 8.1 to 9.5 °Brix. However, Khan et al. [65] found relatively higher TSS values in sweet corn cob ranging from 14.31 to 16.56 °Brix, which were attributed to agronomic practices associated with transplanting dates and higher N levels. Ugur and Maden [62] reported that average TSS values in sweet corn varied from 8.52 to 20.64 °Brix with the progression of the cultivation period among different sweet corn varieties. In contrast, Shobha et al. [64] observed relatively lower TSS content values of maize at the baby corn stage, ranging from 5.06 to 5.86 °Brix among different maize genotypes.
Table 4.
Effects of cover crops and their times of chopping (at different days after planting (DAP)) on the total soluble solids (TSS), the total solid content, and the sugar content of baby corn cob during both kharif seasons (May–August in 2014 and 2015).
The TSS content of baby corn cob was not significantly (p ≤ 0.05) different among the time of chopping treatments, i.e., after chopping cover crops at 25 DAP, 35 DAP, and 45 DAP in both years. The average amount of TSS was increased with increment in chopping time from 25 DAP to 45 DAP. For example, in 2014, the highest amount of TSS (8.90 Brix) was observed after chopping cover crops at 45 DAP, followed by chopping at 35 DAP (8.77 Brix), and the TSS was the lowest after chopping cover crops at 25 DAP (Table 4). There was no statistically significant interaction between cover crops and their times of chopping among treatments with respect to the TSS of baby corn cob.
As shown in Table 4, there was no statistically significant (p ≤ 0.05) difference in the total solid content (i.e., dry matter content) of baby corn cob between all cover crops and the control in both years. To the best of our knowledge, there is almost no information on total solids content or dry matter content of baby corn cob following leguminous or non-leguminous cover crops. On average, the maximum total solids content of baby corn cob (15.16% and 14.97% in 2014 and 2015, respectively) was observed following pearl millet treatment, followed by no cover crop (control) treatment (15.04% and 14.95% in 2014 and 2015, respectively). The total solids content of baby corn cob was not significantly different among the time of chopping treatments, i.e., after chopping cover crops at 25 DAP, 35 DAP, and 45 DAP. The total solids content of baby corn observed after chopping cover crops at each time was statistically similar, with the highest amount after chopping cover crops at 45 DAP in both years. There was no interaction of cover crops and their times of chopping on the total solids content of baby corn among treatments (Table 4).
3.2.5. Sugar Content
Similar to the starch content of baby corn, there was no statistically significant (p ≤ 0.05) difference in the sugar content of baby corn cob between all cover crops and the control in both years (Table 4). On average, the maximum sugar content of baby corn cob (7.1% and 7.3% in 2014 and 2015, respectively) was observed following pearl millet treatment. Like other baby corn quality parameters discussed earlier, evaluation of nutritional composition of baby corn or sweet corn in several studies reported different total sugar content values for baby corn. Shobha et al. [64] evaluated the total sugar content among different maize genotypes at the baby corn stage and reported that the total sugar content ranged from 0.40% to 0.89%. The total sugar content of baby corn has been also reported to vary from 0.002% to 2.3% (e.g., [57,61]). Prajwal Kumar et al. [63] reported relatively lower total sugar content of baby corn, ranging from 0.021% to 0.025%. In contrast, Rosli and Anis [66] reported that baby corn contained a significantly higher total sugar content of 10.7–21.48%.
In both years, the average sugar content of baby corn cob increased with increment in chopping time from 25 DAP to 45 DAP (Table 4). Notably, on average, the sugar content of baby corn after chopping cover crops at 45 DAP was significantly (p ≤ 0.05) higher than the sugar content observed after chopping cover crops at 25 DAP and 35 DAP. There was no interaction of cover crop treatments and their times of chopping on the sugar content of baby corn among treatments (Table 4).
3.3. Cover Crop Effects on Soil Quality Parameters
3.3.1. Soil Organic Carbon
The amount of soil organic carbon content in different treatment plots in the topsoil (0–20 cm), presented in Table 5, was determined after the harvest of baby corn in both years. All cover crop treatments resulted in slightly higher average soil organic carbon content (i.e., ranging from 0.32% to 0.35% during 2014–2015) compared to the control (i.e., ranging from 0.31% to 0.32% during 2014–2015) (Table 5). Sharma et al. [67] suggested that although cover crops were highly decomposable, increased soil organic matter following cover crops was only confined to the topsoil (0–20 cm). However, in this study, there was no statistically significant (p ≤ 0.05) difference in soil organic carbon content between all cover crops and the control in both years. Among only cover crop treatments, the soil organic carbon content was slightly higher following pearl millet and sorghum treatments than that observed following fodder maize treatment. The enhanced organic carbon content in the topsoil (0–20 cm) following non-leguminous cover crops (i.e., pearl millet, fodder maize, and sorghum) was most likely due to increased biomass or dry matter accumulation produced by these cover crop treatments under no-till practices [15,68,69]. It is worth noting that the soil organic carbon content is a good indicator of soil quality [38,70].
Table 5.
Effects of cover crops and their times of chopping (at different days after planting (DAP)) on the organic carbon content in soil at harvest during both kharif seasons (May–August in 2014 and 2015).
Generally, improved soil organic carbon following various cover crop treatments have been reported in numerous studies (e.g., [13,50,67,71,72]). Sainju et al. [68] reported that a non-leguminous cover crop (rye) was better than legumes (hairy vetch and crimson clover) in increasing soil organic carbon. Several studies observed that the use of both leguminous and non-leguminous cover crops and conservation tillage practices increased soil organic carbon content under maize production systems (e.g., [69,73]). On average, the soil organic carbon after chopping cover crops at 45 DAP was significantly (p ≤ 0.05) higher than the soil organic carbon observed after chopping cover crops at 25 DAP and 35 DAP in both years (Table 5). In both years, there was no statistically significant interaction between cover crops and their times of chopping among treatments with respect to the soil organic carbon.
3.3.2. Available Soil Nitrogen
The amount of available soil nitrogen (N) in different treatment plots in the topsoil (0–20 cm), which was determined after the harvest of baby corn in both years, is presented in Table 5. The use of pearl millet, fodder maize, and sorghum cover crops improved available topsoil N content at harvest in 2014 and 2015 (Table 6) compared to N values observed at the beginning of this study (Table 1).
Table 6.
Effects of cover crops and their times of chopping (at different days after planting (DAP)) on the available nitrogen (N) content, the phosphorus (P) content, and the potassium (K) content in soil at harvest during both kharif seasons (May–August in 2014 and 2015).
On average, all cover crop treatments generally resulted in significantly (p ≤ 0.05) higher available soil N as compared to the control (Table 6). Sharma et al. [67] also reported that most of the changes in soil chemical properties (e.g., soil N) following cover crops appeared to be confined in the topsoil (0–20 cm). Among cover crop treatments, the amount of available soil N following pearl millet (196.7 kg·ha−1 and 196.4 t·ha−1 in 2014 and 2015, respectively) was significantly higher than the available soil N observed following fodder maize and sorghum cover crops.
The enhanced soil N content following various cover crops have been observed in numerous studies (e.g., [67,68,72]). Substantial changes in soil total N content were primarily due to long-term use of cover crops, which increased total soil N through additions of fixed N or prevention of N losses (e.g., [67,74]). The evaluation of the effects of leguminous and non-leguminous cover crops on soil N has yielded contrasting results in different studies for different crops. For instance, Kuo et al. [20] observed that leguminous cover crops, particularly hairy vetch, were more effective than non-leguminous cover crops (i.e., rye and annual ryegrass) in increasing soil inorganic N levels. In contrast, Sainju et al. [68] suggested that a non-leguminous cover crop (rye) was much more effective than legumes (hairy vetch and crimson clover) in increasing N availability in the soil.
Compared to legumes, the use of non-leguminous cover crops has been reported to reduce the loss of nitrate through leaching [16,17,75,76,77]. McCracken et al. [16] observed that a non-leguminous cover crop (rye) was much more effective than a leguminous cover crop (hairy vetch) in reducing nitrate leaching. A direct evaluation of the efficacy of non-leguminous cover crops in scavenging N was not examined in this study; however, the non-leguminous cover crop has been recognized for its potential as a scavenger of soil N [15,78]. Moreover, all non-leguminous cover crops, particularly pearl millet, were more likely to reduce nitrate leaching. Overall, as shown in Table 6, the contribution from non-leguminous cover crops to N availability in the topsoil (0–20 cm) suggested that inorganic fertilizer nutrients could be reduced in kharif no-till baby corn production.
In both years, the average amount of available soil N was increased with an increase in the time of chopping of cover crops from 25 DAP to 45 DAP (Table 6). On average, the available soil N after chopping cover crops at 45 DAP was significantly (p ≤ 0.05) higher than the soil N observed after chopping cover crops at 25 DAP. However, the available soil N was not significantly different among increment in chopping time treatments 35 DAP and 45 DAP in both the years. There was no interaction of cover crops and their times of chopping on the available soil N among treatments.
3.3.3. Available Soil Phosphorus
The amount of available soil phosphorus (P) at different treatment plots in the topsoil (0–20 cm), which was determined after the harvest of baby corn in both years, is presented in Table 6. There was no statistically significant (p ≤ 0.05) difference in the average available soil P between all cover crops and the control in 2014 and 2015. The average available soil P among all cover crop and control treatments ranged from 21.2 to 23.2 kg⋅ha−1 during 2014–2015. The use of cover crop treatments did not markedly increase available topsoil P content at harvest (Table 6) compared to p values observed at the beginning of this study (Table 1). Several studies showed that soil P content could be conserved or maintained and/or enhanced (primarily in the topsoil) by various cover crop species [67,79]. Cover crops could also accumulate P near the soil surface due to the deposition of crop residue [67]. However, cover crops have been shown to have relatively little effect on soil P availability, even though cover crops increased crop dry matter accumulation and recycled a large amount of P to the soil surface [80]. Cover crops could improve P uptake of succeeding crops by converting unavailable native P and residual fertilizer P to chemical forms that are more available to succeeding crops, resulting in lower soil P concentrations [67].
In both years, the average amount of available soil P was increased with an increase in the time of chopping of cover crops from 25 DAP to 45 DAP (Table 6). On average, the available soil P after chopping cover crops at 45 DAP (23.9 kg·ha−1 in both years) was significantly (p ≤ 0.05) higher than the soil P observed after chopping cover crops at 25 and 35 DAP. As shown in Table 6, there was no statistically significant interaction between cover crops and their times of chopping among treatments with respect to the available soil P.
3.3.4. Available Soil Potassium
As shown in Table 6, the amount of available soil potassium (K) in the topsoil (0–20 cm), which was determined after the harvest of baby corn in both years, was not significantly (p ≤ 0.05) different between all cover crops and the control. The average available soil K among all cover crop and control treatments ranged from 158.1 to 163.9 kg·ha−1 during 2014–2015. The amount of available soil K following pearl millet treatment was higher than the available soil K observed following sorghum and fodder maize cover crops, and no cover crop (i.e., control), particularly in 2015 kharif season when the amount of available soil K following pearl millet cover crop was significantly higher than following sorghum, fodder maize, and control treatments. In both years, the average amount of available soil K was increased with increment in chopping time from 25 DAP to 45 DAP. On average, the available soil K after chopping cover crops at 45 DAP (164.0 kg·ha−1 and 165.4 kg·ha−1 in 2014 and 2015, respectively) was significantly higher than after chopping cover crops at 25 DAP and 35 DAP. Similar to the available soil N and P content, there was no interaction of cover crops and their times of chopping on the available soil K among treatments in both years. The use of cover crops treatments did not markedly increase topsoil K content at harvest (Table 6) compared to K values observed at the beginning of this study (Table 1). The enhanced soil K content following various cover crops have been observed in several studies (e.g., [81,82]). Studies also suggested that cover crops could accumulate K at the soil surface due to deposition of crop residue and lack of surface-applied fertilizers [81,82]. However, the succeeding crop in its growing season could take up soil K at a much higher rate than the addition of K by cover crops, resulting in lower soil K concentrations [82].
4. Conclusions
Effects of three non-leguminous cover crops (pearl millet, fodder maize, and sorghum) and their times of chopping on the yield and quality of no-till baby corn were evaluated during two kharif seasons (during 2014–2015) under subtropical climatic conditions of Punjab, India. During both kharif seasons, the yield (cob and green fodder yield) and dry matter accumulation of baby corn following cover crop treatments were significantly higher than the control (no cover crop) and improved with increment in chopping time from 25 DAP to 45 DAP. Among cover crop treatments, the yield (cob and green fodder yield) and dry matter accumulation of baby corn following pearl millet cover crop were significantly higher compared to fodder maize and sorghum cover crop and control treatments. Chopping of cover crops at 45 DAP showed significantly higher yield and dry matter accumulation of baby corn over chopping at 25 DAP and 35 DAP. The effect of cover crops on baby corn quality parameters (i.e., protein, starch, crude fiber, total soluble solids (TSS), total solid, and sugar content) was not significant among treatments during both kharif seasons, while increment in chopping time (from 25 DAP to 45 DAP) had a significant effect on the protein and sugar content of baby corn cob. The use of cover crops and increment in chopping time generally helped in enhancing topsoil quality at harvest, especially available soil N. However, the effect of cover crops and their times of chopping on other topsoil quality parameters (i.e., organic carbon content, and available soil P and K) did not differ among treatments. During both kharif seasons, there was no significant interaction between cover crops and their times of chopping among treatments with respect to baby corn yield and quality as well as topsoil quality parameters. Based on the results during two kharif seasons, it is suggested that non-leguminous cover crops and their times of chopping evaluated in this study could be used for sustainable maize crop production system to improve baby corn growth and yield, baby corn quality, and topsoil quality. However, long-term evaluation of these non-leguminous cover crops and increment in chopping time on kharif baby corn yield and quality, as well as soil quality under subtropical climatic conditions, is needed.
Author Contributions
A.S. and J.S.K. conceived and designed the experiments. Funding acquisition and project administration were performed by J.S.K., A.S., and J.S.K. performed the experiments and collected the data. A.S., J.S.K., and S.K.D. analyzed the data. S.S. and P.S. provided technical assistance when the data was analyzed. S.K.D. and A.S. wrote the manuscript. All authors have read and agreed to the published version of the manuscript.
Funding
This research received no external funding.
Acknowledgments
We are grateful to the Department of Agronomy, Punjab Agricultural University (PAU), Ludhiana for providing field and laboratory facilities for the experiment. We gratefully acknowledge the funding support from the “Farm Fresh Foods” (Ladhowal, Punjab) to carry out this research during 2014–2015. We are also thankful to graduate students and technical staff of the Department of Agronomy, PAU, for their assistance during the field experiment. The constructive comments from three anonymous reviewers have improved this manuscript and are greatly appreciated.
Conflicts of Interest
The authors declare no conflict of interest.
References
- Dowswell, C.R.; Paliwal, R.L.; Cantrell, R.P. Maize in the Third World; Routledge (Taylor & Francis): New York, NY, USA, 1996. [Google Scholar]
- Verheye, W. Growth, and production of maize: Traditional low-input cultivation. In Land Use, Land Cover and Soil Sciences; Verheye, W.H., Ed.; UNESCO-EOLSS Publishers: Oxford, UK, 2010; pp. 1–23. [Google Scholar]
- Hoorman, J.J.; Islam, R.; Sundermeier, A.; Reeder, R. Using cover crops to convert to no-till. Crop. Soils 2009, 42, 9–13. [Google Scholar]
- Naik, G. Closing the yield gap: Maize in India. In Technology, Adaptation, and Exports: How Some Developing Countries Got It Right; Chandra, V., Ed.; The World Bank: Washington, DC, USA, 2006; pp. 275–300. [Google Scholar]
- FAO. FAOSTAT. Available online: http://www.fao.org/faostat/en/#data/QC (accessed on 2 August 2017).
- Federation of Indian Chambers of Commerce and Industry (FICCI). Maize Vision 2022: A Knowledge Report; PricewaterhouseCoopers (PwC) Private Limited: Mumbai, India, 2018; Available online: http://ficci.in/spdocument/22966/India-Maize-Summit.pdf (accessed on 12 February 2020).
- Zhong, H.; Sticklen, M.B. Genetic engineering of corn: Sustainability of shoot tip meristem in genetic transformation. In Transgenic Crops I; Bajaj, Y.P.S., Ed.; Springer: Berlin, Germany, 2000; pp. 37–59. [Google Scholar]
- Hallauer, A.R. Specialty Corns, 2nd ed.; CRC Press: Boca Raton, FL, USA, 2001. [Google Scholar]
- Almeida, I.P.d.C.; Negreiros, M.Z.d.; Barbosa, Z. Baby corn, green ear, and grain yield of corn cultivars. Hortic. Bras. 2005, 23, 960–964. [Google Scholar] [CrossRef][Green Version]
- Shivay, Y.; Singh, R.; Pal, M.; Pal, M. Productivity and economics of maize as influenced by intercropping with legumes and nitrogen levels. Ann. Agric. Res. 2001, 22, 576–582. [Google Scholar]
- Smith, M.S.; Frye, W.W.; Varco, J.J. Legume winter cover crops. In Advances in Soil Science; Stewart, B.A., Ed.; Springer: New York, NY, USA, 1987; pp. 95–139. [Google Scholar]
- Fageria, N.K.; Baligar, V.C.; Bailey, B.A. Role of cover crops in improving soil and row crop productivity. Commun. Soil Sci. Plant Anal. 2005, 36, 2733–2757. [Google Scholar] [CrossRef]
- Drinkwater, L.E.; Wagoner, P.; Sarrantonio, M. Legume-based cropping systems have reduced carbon and nitrogen losses. Nature 1998, 396, 262–265. [Google Scholar] [CrossRef]
- Yadvinder, S.; Bijay, S.; Ladha, J.K.; Khind, C.S.; Gupta, R.K.; Meelu, O.P.; Pasuquin, E. Long-term effects of organic inputs on yield and soil fertility in the rice-wheat rotation. Soil Sci. Soc. Am. J. 2004, 68, 845–853. [Google Scholar]
- Clark, A. Managing Cover Crops Profitably, 3rd ed.; Handbook Series Book 9; Sustainable Agriculture Research and Education (SARE): College Park, MD, USA, 2007. [Google Scholar]
- McCracken, D.V.; Smith, M.S.; Grove, J.H.; Blevins, R.L.; MacKown, C.T. Nitrate leaching as influenced by cover cropping and nitrogen source. Soil Sci. Soc. Am. J. 1994, 58, 1476–1483. [Google Scholar] [CrossRef]
- Meisinger, J.; Hargrove, W.; Mikkelsen, R.; Williams, J.; Benson, V. Effects of cover crops on groundwater quality. In Cover Crops for Clean Water; Hargrove, W., Ed.; Soil and Water Conservation Society: Ankeny, IA, USA, 1991; pp. 793–799. [Google Scholar]
- Ranells, N.N.; Wagger, M.G. Nitrogen release from grass and legume cover crop monocultures and bicultures. Agron. J. 1996, 88, 777–882. [Google Scholar] [CrossRef]
- Dabney, S.M.; Delgado, J.A.; Meisinger, J.J.; Schomberg, H.H.; Liebig, M.A.; Kaspar, T.; Mitchell, J.; Reeves, W. Using cover crops and cropping systems for nitrogen management. In Advances in Nitrogen Management for Water Quality; Delgado, J.A., Follett, R.F., Eds.; Soil and Water Conservation Society: Ankeny, IA, USA, 2010; pp. 230–281. [Google Scholar]
- Kuo, S.; Sainju, U.; Jellum, E. Winter cover cropping influence on nitrogen in the soil. Soil Sci. Soc. Am. J. 1997, 61, 1392–1399. [Google Scholar] [CrossRef]
- Sharma, P.; Singh, A.; Kahlon, C.S.; Brar, A.S.; Grover, K.K.; Dia, M.; Steiner, R.L. The role of cover crops towards sustainable soil health and agriculture—A review paper. Am. J. Plant Sci. 2018, 9, 1935–1951. [Google Scholar] [CrossRef]
- Dabney, S.; Delgado, J.; Reeves, D. Using winter cover crops to improve soil and water quality. Commun. Soil Sci. Plant Anal. 2001, 32, 1221–1250. [Google Scholar] [CrossRef]
- Florentín, M.A.; Peñalva, M.; Calegari, A.; Derpsch, R.; McDonald, M. Green Manure/Cover Crops and Crop Rotation in Conservation Agriculture on Small Farms; Integrated Crop Management Vol.12-2010; Food and Agriculture Organization (FAO) of the United Nations: Rome, Italy, 2011. [Google Scholar]
- Mitchell, W.; Tell, M. Winter-annual cover crops for no-tillage corn production. Agron. J. 1977, 69, 569–573. [Google Scholar] [CrossRef]
- Ebelhar, S.; Frye, W.; Blevins, R. Nitrogen from legume cover crops for no-tillage corn. Agron. J. 1984, 76, 51–55. [Google Scholar] [CrossRef]
- Decker, A.M.; Clark, A.J.; Meisinger, J.J.; Mulford, F.R.; McIntosh, M.S. Legume cover crop contributions to no-tillage corn production. Agron. J. 1994, 86, 126–135. [Google Scholar] [CrossRef]
- Dou, Z.; Fox, R.; Toth, J. Tillage effect on seasonal nitrogen availability in corn supplied with legume green manures. Plant Soil 1994, 162, 203–210. [Google Scholar] [CrossRef]
- Cline, G.R.; Silvernail, A.F. Effects of cover crops, nitrogen, and tillage on sweet corn. HortTechnology 2002, 12, 118–125. [Google Scholar] [CrossRef]
- Muthukumar, V.; Velayudham, K.; Thavaprakaash, N. Growth and yield of baby corn (Zea mays l.) as influenced by plant growth regulators and different time of nitrogen application. Res. J. Agric. Biol. Sci. 2005, 1, 303–307. [Google Scholar]
- Dhaliwal, H.S.; Kular, J.S. Package of Practices for the Crops of Punjab: Kharif 2014; Punjab Agricultural University: Ludhiana, India, 2014; Volume 31. [Google Scholar]
- Salaria, A. Productivity of No-till Maize (Zea mays L.) as Influenced by Leguminous Cover Crops and Nitrogen Levels. Ph.D. Thesis, Punjab Agricultural University, Ludhiana, India, 2016. [Google Scholar]
- Kukal, S.; Sidhu, A. Percolation losses of water in relation to pre-puddling tillage and puddling intensity in a puddled sandy loam rice (Oryza sativa L.) field. Soil Till. Res. 2004, 78, 1–8. [Google Scholar] [CrossRef]
- Central Institute of Agricultural Engineering (CIAE). Tractor Mounted Fodder Harvester: A Suceess Story; All India Coorninated Research Project on Farm Implements and Machinery; Extension Bulletin No. CIAE/FIM/2004/45; Central Institute of Agricultural Engineering: Bhopal, India, 2004. [Google Scholar]
- Singh, M.; Singh, R.; Singh, S.; Yadav, M.; Singh, V. Integrated nutrient management for higher yield, quality, and profitability of baby corn (Zea mays). Indian J. Agron. 2010, 55, 100. [Google Scholar]
- Mahajan, G.; Sharda, R.; Kumar, A.; Singh, K. Effect of plastic mulch on economizing irrigation water and weed control in baby corn sown by different methods. Afr. J. Agric. Res. 2007, 2, 19–26. [Google Scholar]
- Jones, D.B. Factors for Converting Percentages of Nitrogen in Foods and Feeds into Percentages of Proteins; Circular No. 183; United States Department Of Agriculture: Washington, DC, USA, 1941.
- Howitz, E. Official Methods of Analysis of AOAC International; AOAC (Association of Official Agricultural Chemists) International: Rockville, MD, USA, 2000. [Google Scholar]
- Nelson, D.W.; Sommers, L.E. Total carbon, organic carbon, and organic matter. In Methods of Soil Analysis, Part 3 Chemical Methods; Sparks, D.L., Page, A.L., Helmke, P.A., Loeppert, R.H., Soltanpour, P.N., Tabatabai, M.A., Johnston, C.T., Sumner, M.E., Eds.; Soil Science Society of America and American Society of Agronomy: Madison, WI, USA, 1996; pp. 961–1010. [Google Scholar]
- Asana, R.; Saini, G. Rapid method for determination of reducing and total sugar. J. Biochem. 1962, 22, 23–25. [Google Scholar]
- Somogyi, M. A new reagent for the determination of sugars. J. Biolog. Chem. 1945, 160, 61–68. [Google Scholar]
- Ranganna, S. Handbook of Analysis and Quality Control for Fruit and Vegetable Products, 2nd ed.; Tata McGraw-Hill: New Delhi, India, 1986. [Google Scholar]
- Horwitz, W.; Chichilo, P.; Reynolds, H. Official Methods of Analysis of the AOAC; AOAC (Association of Official Agricultural Chemits) International: Rockville, MD, USA, 1970. [Google Scholar]
- Subbaiah, B.V.; Asija, G.L. A rapid procedure for estimation of available nitrogen in soil. Curr. Sci. 1956, 25, 259–260. [Google Scholar]
- Olsen, S.R. Estimation of Available Phosphorus in Soils by Extraction with Sodium Bicarbonate; United States Department of Agriculture: Washington, DC, USA, 1954.
- Merwin, H.D.; Peech, M. Exchangeability of soil potassium in the sand, silt, and clay fractions as influenced by the nature of the complementary exchangeable cation. Soil Sci. Soc. Am. J. 1951, 15, 125–128. [Google Scholar] [CrossRef]
- Walkley, A.; Black, I.A. An examination of the degtjareff method for determining soil organic matter, and a proposed modification of the chromic acid titration method. Soil Sci. 1934, 37, 29–38. [Google Scholar] [CrossRef]
- Dar, E.A.; Yousuf, A.; Bhat, M.A.; Poonia, T. Growth, yield and quality of baby corn (Zea mays L.) and its fodder as influenced by crop geometry and nitrogen application—A review. Bioscan. Int. Quart. J. Life Sci. 2017, 12, 463–469. [Google Scholar]
- Eltelib, H.A.; Hamad, M.A.; Ali, E.E. The effect of nitrogen and phosphorus fertilization on growth, yield, and quality of forage maize (Zea mays L.). J. Agron. 2006, 5, 515–518. [Google Scholar]
- Kumar, T.K.; Venkateswarlu, B. Baby corn (Zea mays L.) performance as vegetable-cum-fodder in intercropping with legume fodders under different planting patterns. Range Manag. Agroforest. 2013, 34, 137–141. [Google Scholar]
- Reddy, P.P. Cover/green manure crops. In Sustainable Intensification of Crop Production; Springer Nature: Singapore, 2016; pp. 55–67. [Google Scholar]
- Hannaway, D.B.; Larson, C. Forage Fact Sheet: Pearl Millet (Pennisetum americanum); Oregon State University: Corvallis, OR, USA, 2004. [Google Scholar]
- Payne, W.A. Optimizing crop use in sparse stands of pearl millet. Agron. J. 2000, 92, 808–814. [Google Scholar] [CrossRef]
- Schonbeck, M.; Morse, R. Cover Crops for All Seasons: Expanding the Cover Crop Toolbox for Organic Vegetable Producers. Virginia Association for Biological Farming Information Sheet Number 3-06. May 2006. Available online: https://www.sare.org/content/download/69536/985534/Cover_crops_for_all_seasons.pdf?inlinedownload=1 (accessed on 10 January 2020).
- Rosolem, C.A.; Pace, L.; Crusciol, C.A. Nitrogen management in maize cover crop rotations. Plant Soil 2004, 264, 261–271. [Google Scholar] [CrossRef]
- Rosolem, C.A.; Calonego, J.C.; Foloni, J.S. Potassium leaching from millet straw as affected by rainfall and potassium rates. Commun. Soil Sci. Plant Anal. 2005, 36, 1063–1074. [Google Scholar] [CrossRef]
- Wang, G.S.; Noite, K. Summer Cover Crop Use in Arizona Vegetable Production Systems. Arizona Cooperative Extension AZ1519. July 2010. Available online: https://extension.arizona.edu/sites/extension.arizona.edu/files/pubs/az1519.pdf (accessed on 10 January 2020).
- Ramachandrappa, B.K.; Nanjappa, H.V.; Shivakumar, H.K. Yield and quality of baby corn (Zea mays L.) as influenced by spacing and fertilization levels. Acta Agron. Hung. 2004, 52, 237–243. [Google Scholar] [CrossRef]
- Joshi, G.; Chilwal, A. Determination of quality of baby corn (Zea mays L.) under the effect of integrated nutrient management. Int. J. Chem. Stud. 2018, 6, 3244–3247. [Google Scholar]
- Hooda, S.; Kawatra, A. Nutritional evaluation of baby corn (Zea mays). Nutr. Food Sci. 2013, 43, 68–73. [Google Scholar] [CrossRef]
- Rahman, N.A.; Rosli, W.I.W. Nutritional compositions and antioxidative capacity of the silk obtained from immature and mature corn. J. King Saud Univ. Sci. 2014, 26, 119–127. [Google Scholar] [CrossRef]
- Budak, F.; Aydemir, S.K. Grain yield and nutritional values of sweet corn (Zea mays var. saccharata) in produced with good agricultural implementation. Nutr. Food Sci. Int. J. 2018, 7, 555710. [Google Scholar]
- Ugur, A.; Maden, H.A. Sowing and planting period on yield and ear quality of sweet corn. Cienc. Agrotechnol. 2015, 39, 112–116. [Google Scholar]
- Prajwal Kumar, G.K.; Lalitha, B.S.; Shamshad Begum, S.; Somashekar, K.S. Effect of food nutrition on nutritional quality of baby corn (Zea mays L.) and dehydrated baby corn enriched products. Int. J. Pure App. Biosci. 2018, 6, 107–113. [Google Scholar] [CrossRef]
- Shobha, D.; Sreeramasetty, T.A.; Puttarama, N.; Gowda, K.P. Evaluation of maize genotypes for physical and chemical composition at silky and hard stage. Karnataka J. Agric. Sci. 2010, 23, 311–314. [Google Scholar]
- Khan, A.A.; Hussain, A.; Ganai, M.A.; Sofi, N.R.; Hussain, S.T. Yield, nutrient uptake and quality of sweet corn as influenced by transplanting dates and nitrogen levels. J. Pharmacog. Phytochem. 2018, 7, 3567–3571. [Google Scholar]
- Rosli, W.I.W.; Anis, J.C. The potential of Zea mays ears and it extracts as an alternative food nutritive ingredients. APCBEE Procedia 2012, 2, 141–147. [Google Scholar] [CrossRef]
- Sharma, V.; Irmak, S.; Padhi, J. Effects of cover crops on soil quality: Part I. soil chemical properties—Organic carbon, total nitrogen, pH, electrical conductivity, organic matter content, nitrate-nitrogen, and phosphorous. J. Soil Water Conserv. Soc. 2018, 73, 637–651. [Google Scholar] [CrossRef]
- Sainju, U.M.; Singh, B.P.; Whitehead, W.F. Long-term effects of tillage, cover crops, and nitrogen fertilization on organic carbon and nitrogen concentrations in sandy loam soils in Georgia, USA. Soil Till. Res. 2002, 63, 167–179. [Google Scholar] [CrossRef]
- Mazzoncini, M.; Sapkota, T.B.; Bàrberi, P.; Antichi, D.; Risaliti, R. Long-term effect of tillage, nitrogen fertilization and cover crops on soil organic carbon and total nitrogen content. Soil Till. Res. 2011, 114, 165–174. [Google Scholar] [CrossRef]
- Bauer, A.; Black, A. Quantification of the effect of soil organic matter content on soil productivity. Soil Sci. Soc. Am. J. 1994, 58, 185–193. [Google Scholar] [CrossRef]
- Wyland, L.J.; Jackson, L.E.; Schulbach, K.F. Soil plant nitrogen dynamics following incorporation of a mature rye cover crop in a lettuce production system. J. Agric. Sci. 1995, 124, 17–25. [Google Scholar] [CrossRef]
- Kuo, S.; Sainju, U.; Jellum, E. Winter cover crop effects on soil organic carbon and carbohydrate in soil. Soil Sci. Soc. Am. J. 1997, 61, 145–152. [Google Scholar] [CrossRef]
- Olson, K.R.; Ebelhar, S.A.; Lang, J.M. Cover crop effects on crop yields and soil organic carbon content. Soil Sci. 2010, 175, 89–98. [Google Scholar] [CrossRef]
- Kaspar, T.C.; Singer, J.W. The use of cover crops to manage soil. In Soil Management: Building a Stable Base for Agriculture; Hartfield, J.L., Sauer, T.J., Eds.; American Society of Agronomy and Soil Science Society of America: Madison, WI, USA, 2011; pp. 321–337. [Google Scholar]
- Kaspar, T.C.; Jaynes, D.B.; Parkin, T.B.; Moorman, T.B. Rye cover crop and gamagrass strip effects on NO3 concentration and load in tile drainage. J. Environ. Qual. 2007, 36, 1503–1511. [Google Scholar] [CrossRef]
- Tonitto, C.; David, M.; Drinkwater, L. Replacing bare fallows with cover crops in fertilizer-intensive cropping systems: A meta-analysis of crop yield and n dynamics. Agric. Ecosyst. Environ. 2006, 112, 58–72. [Google Scholar] [CrossRef]
- Strock, J.S.; Porter, P.M.; Russelle, M.P. Cover cropping to reduce nitrate loss through subsurface drainage in the Northern U.S. corn belt. J. Environ. Qual. 2004, 33, 1010–1016. [Google Scholar] [CrossRef] [PubMed]
- Wagger, M.G.; Mengel, D.B. The role of nonleguminous cover crops in the efficient use of water nitrogen. In Cropping Strategies for Efficient Use of Water and Nitrogen; Hargrove, W.L., Ed.; ASA-CSSA-SSSA (American Society of Agronomy-Crop Science Society of America-Soil Science Society of America): Madison, WI, USA, 1988; pp. 115–127. [Google Scholar]
- Janegitz, M.C.; Martins, A.R.H.; Rosolem, C.A. Cover crops and soil phosphorus availability. Commun. Soil Sci. Plant Anal. 2017, 48, 1240–1246. [Google Scholar] [CrossRef]
- Teles, A.P.B.; Rodrigues, M.; Herrera, W.F.B.; Soltangheisi, A.; Sartor, L.R.; Withers, P.J.A.; Pavinato, P.S. Do cover crops change the lability of phosphorus in a clayey subtropical soil under phosphate fertilizers? Soil Use Manag. 2017, 33, 34–44. [Google Scholar] [CrossRef]
- Eckert, D.J. Chemical attributes of soils subjected to no-till cropping with rye cover crops. Soil Sci. Soc. Am. J. 1991, 55, 405–409. [Google Scholar] [CrossRef]
- Sharma, V.; Irmak, S.; Padhi, J. Effects of cover crops on soil quality: Part II. soil exchangeable bases (potassium, magnesium, sodium, and calcium), cation exchange capacity, and soil micronutrients (zinc, manganese, iron, copper, and boron). J. Soil Water Conserv. Soc. 2018, 73, 652–668. [Google Scholar] [CrossRef]
© 2020 by the authors. Licensee MDPI, Basel, Switzerland. This article is an open access article distributed under the terms and conditions of the Creative Commons Attribution (CC BY) license (http://creativecommons.org/licenses/by/4.0/).