Abstract
The coloration of vegetative organs in grapevine (Vitis vinifera L.) is an important phenotypic trait associated with environmental responsiveness and stress adaptation; however, its genetic regulatory mechanisms remain poorly understood. To systematically elucidate the genetic basis of vegetative coloration, a genome-wide association study (GWAS) was performed using 151 grapevine accessions, integrating high-depth whole-genome resequencing data with phenotypic evaluations of eight coloration traits across two consecutive years (2023–2024). Using a mixed linear model (MLM), 13 stable and significant SNP loci were identified on chromosomes 3, 5, 6, 13, 14, 15, 16, and 18, explaining 13.28–19.35% of the phenotypic variation. Within ±15 kb of these loci, 16 candidate genes were identified. qRT-PCR analysis of key candidates revealed that VIT_06s0004g03620 (mitogen-activated protein kinase), VIT_16s0039g01900 (MYB-like domain-containing protein), and VIT_14s0083g01050 (MADS-box protein 2) showed significant positive correlations between expression levels and coloration intensity, with distinct expression patterns among accessions exhibiting different coloration grades. These genes are likely involved in the regulation of anthocyanin accumulation. Collectively, this study elucidates the genomic architecture underlying vegetative organ coloration in grapevine and provides valuable candidate genes and SNP markers for functional validation and molecular-assisted breeding.
1. Introduction
Anthocyanins are water-soluble flavonoid pigments widely distributed in plants. In addition to conferring red, purple, and blue coloration to organs such as flowers, fruits, and leaves—thereby enhancing reproductive success—anthocyanins play important roles in photoprotection, antioxidative defense, and responses to abiotic stress [1,2]. In grapevine (Vitis vinifera L.), anthocyanin accumulation is a key determinant of berry coloration and wine quality, and the regulatory network controlling anthocyanin biosynthesis in grape berries has been extensively characterized, including the identification of major regulatory genes such as the R2R3-MYB transcription factors MYBA1 and MYBA2 [3,4].
In contrast to fruit tissues, anthocyanins in grapevine vegetative organs—including leaves, young shoots, and canes—remain much less studied. Increasing evidence suggests that anthocyanin accumulation in these organs contributes to multiple physiological functions, such as protection against oxidative damage, enhancement of stress tolerance, and pathogen defense [5,6,7,8]. Vegetative organ coloration represents an important adaptive trait shaped during grapevine evolution and domestication. For example, pigmentation in young shoots and juvenile leaves has been linked to protection from excessive light and ultraviolet radiation [9,10,11], while cane pigmentation may be associated with tolerance to low-temperature stress [12,13]. Moreover, leaf coloration is widely used in viticulture as a practical indicator of plant physiological status and varietal identification. Despite its ecological, physiological, and agronomic significance, the genetic basis underlying the coloration of grapevine vegetative organs remains poorly researched.
To date, research on vegetative organ coloration in grapevine has largely focused on phenotypic description and physiological correlation analyses [14], with limited insight into its genetic architecture. Traditional quantitative trait locus (QTL) mapping approaches depend on segregating populations and are constrained by long breeding cycles and limited resolution [15]. Genome-wide association studies (GWAS), which exploit historical recombination events in natural populations, provide a powerful alternative for dissecting complex quantitative traits with higher mapping resolution [16,17]. Since its introduction into plant genetics [18], GWAS has been successfully applied to identify loci controlling a wide range of traits in major crops [19,20,21,22,23]. In grapevine, GWAS has contributed to the genetic dissection of traits such as leaf morphology [24], berry weight, and fruit firmness [25]. Genome-wide association studies have also been widely and successfully applied to elucidate the genetic basis of numerous other grape traits, including berry cracking and seed-related traits, berry shape, and fruit weight, quality, and flavor. However, most previous studies have primarily focused on fruit-related characteristics, whereas systematic investigations into the genetic regulatory mechanisms underlying vegetative organ coloration—a trait of considerable physiological and ecological importance—remain limited.
Given the importance of vegetative organ coloration for environmental adaptation and ornamental value, elucidating its genetic basis is of both theoretical and practical significance. In this study, we performed a genome-wide association study to systematically investigate the genetic architecture of coloration traits in grapevine vegetative organs. Eight coloration-related traits were evaluated across 151 grapevine accessions over two consecutive years, and high-density genome-wide SNP markers were used for association mapping. The objectives of this study were to (i) characterize phenotypic and genetic variation in vegetative organ coloration; (ii) identify stable SNP loci and candidate genes associated with these traits; and (iii) preliminarily assess the involvement of key candidate genes through expression analysis. We propose that vegetative organ coloration in grapevine may be controlled by stable, heritable loci detectable via GWAS, and that its regulatory mechanisms are likely associated with transcription factors involved in the anthocyanin biosynthesis pathway or upstream signaling components. Pursuing this line of inquiry will help validate the proposed genetic regulatory pathways, provide a foundational framework for understanding the molecular mechanisms underlying vegetative organ coloration in grapevine, and establish a basis for future functional studies and molecular marker-assisted breeding aimed at improving stress tolerance and ornamental traits.
2. Materials and Methods
2.1. Plant Materials
A total of 151 grapevine (Vitis vinifera L.) genotypes were selected as experimental materials. All plant materials were collected from a grapevine germplasm repository located in Ningbo City, Zhejiang Province, China (N 30.26434°, E 121.40831°). Sampling was conducted in June of both 2023 and 2024. To ensure consistency and comparability of phenotypic data, plants with uniform growth status and free from pests, diseases, or mechanical damage were selected from each genotype. Tissues from young shoots, juvenile leaves, mature leaves, and one-year-old canes were systematically collected. Details of the accessions are provided in Supplementary Table S1. The repository is situated in a subtropical monsoon climate zone, with an annual average temperature of 18.5 °C, an annual precipitation of 1119.3 mm, and an annual sunshine duration of 1879.2 h. The soil at the experimental site is classified as brown earth, with a pH of 8.58 (slightly alkaline), an organic matter content of 5.44 g/kg, and a bulk density of 2.56 g/cm3.
To analyze the tissue-specific expression patterns of candidate genes, we used the ‘Yinhong’ grapevine cultivar as material and collected six tissue types: tendrils (young growing tips), stem segments (young internodes), leaves (fully expanded), seeds (mature stage), pericarp (skin only), and pulp (without seeds and skin). Juvenile and mature leaves were distinguished based on leaf position, expansion status, and morphological characteristics. Juvenile leaves were defined as the first to second fully expanded leaves from the shoot apex, characterized by a lamina length < 5 cm and a soft texture. Mature leaves were collected from the 5th to 8th nodes below the shoot apex, exhibiting full expansion and a leathery texture. Based on the color intensity of young shoots and juvenile leaves, six representative cultivars were selected from the population and classified into three color-gradient groups: light-colored (V. labrusca × V. vinifera ‘Zaocuixiangti’, V. vinifera ‘Conglinmeigui’), medium-colored (V. vinifera ‘Shaoxingyihao’, V. labrusca × V. vinifera ‘Tiangongmoyu’), and dark-colored (V. vinifera × V. labrusca ‘Miguang’, V. labrusca × V. vinifera ‘Jumeigui’) (Figure 1). Juvenile leaves from these cultivars were collected to analyze the differential expression of candidate genes across the color gradients.
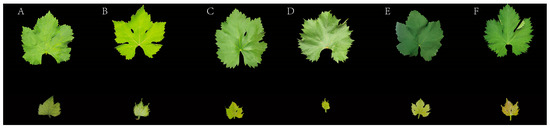
Figure 1.
Leaf color characteristics of grapevine germplasm resources: (A) ‘Zaocuixiangti’, (B) ‘Conglinmeigui’, (C) ‘Shaoxingyihao’, (D) ‘Tiangongmoyu’, (E) ‘Miguang’, and (F) ‘Jumeigui’. Upper row: mature leaves; lower row: young leaves.
2.2. Identification of Color Traits in Grape Nutritional Organs
With reference to the description and grading criteria for coloration traits in grape vegetative organs outlined in the Guidelines for the Conduct of Tests for Distinctness, Uniformity, and Stability (DUS) of New Varieties of Plants—Grapevine (NY/T 2563-2014), the detailed investigation items and scoring criteria for each trait are presented in Table 1. For each genotype, three biological replicates (i.e., three individual plants) were evaluated, with all measurements taken from the corresponding organs of each plant following the criteria described in Table 1.

Table 1.
Assessment criteria and scoring system for eight coloration traits in grape vegetative organs.
2.3. Genome-Wide Association Study
In previous work, whole-genome resequencing of the 151 accessions was completed. The raw sequencing data have been deposited in the National Genomics Data Center (https://ngdc.cncb.ac.cn/) [25], from which a total of 58,926,380 high-quality single-nucleotide polymorphism (SNP) markers were initially identified. To ensure the reliability of the GWAS, stringent quality control was applied to the raw SNP dataset: first, sites with a minor allele frequency (MAF) < 0.05 were removed to avoid interference from low-frequency variants; second, unreliable sites marked as “filtered” were excluded. After these filtering steps, 5,848,986 high-quality SNPs were retained. Further removal of SNPs with unknown chromosomal positions yielded a final set of 5,620,388 SNPs for subsequent association analysis.
Based on high-quality SNP markers and corresponding phenotypic data from 151 grapevine genotypes, GWAS were performed using the GAPIT R package (version 3.2) to identify genetic loci associated with coloration traits in vegetative organs. Two models—the mixed linear model (MLM) and the general linear model (GLM)—were employed for association analysis. The MLM model effectively controlled for population structure by incorporating a kinship matrix, thereby reducing false-positive associations and enabling a more accurate assessment of the association strength between each SNP locus and the target traits. The GLM model, characterized by high computational efficiency and ease of implementation, was used for preliminary screening of association signals in large-scale genomic data [26].
To determine statistical significance thresholds, both the stringent threshold based on Bonferroni correction and an empirical threshold were calculated. The Bonferroni-corrected thresholds were computed using the formulas −log10(0.05/N) and −log10(0.01/N), where N represents the total number of SNPs used in the association analysis (5,620,388). The corresponding calculated values were 7.43 (significant) and 8.13 (highly significant), respectively. Given that the Bonferroni correction is overly stringent, this study also referred to common practice in previous research and set an empirical significance threshold at −log10(p) > 5. All SNP loci above this empirical threshold line were considered candidate loci significantly associated with the traits. This thresholding strategy effectively controls false-positive discoveries while balancing the practical need to explore potential association signals in the study.
The GWAS results were visualized using the CMplot package in R (version 3.2). Manhattan plots were generated to graphically present the genome-wide associations between SNPs and the traits: the horizontal axis represents the physical positions of SNPs across the 19 chromosomes, and the vertical axis displays the negative logarithm of the association p-value [−log10(p)]. The Manhattan plot effectively facilitates the identification of peak regions of association signals that exceed the significance threshold.
2.4. Screening and Functional Annotation of Candidate Genes
To more effectively control false positives, we screened the GWAS results from 2023 and 2024 using both MLM and GLM models and ultimately selected stable SNP loci that reached significance in both consecutive years. Using the physical positions of these SNPs as centers, we extended 15 kb upstream and downstream to define candidate genomic regions [25]. All annotated genes within these regions were extracted as preliminary candidate genes based on the annotation information of the grape reference genome (http://ftp.ensemblgenomes.org/pub/plants/release-54/fasta/vitis_vinifera/ (accessed on 25 July 2025).
To further elucidate the biological functions of the candidate genes, a systematic bioinformatics analysis was performed. Based on the UniProt database (https://www.uniprot.org/), functional annotations were assigned to the proteins encoded by the candidate genes. Additionally, KEGG pathway enrichment analysis was conducted using the TBtools-II software (version 2.326)to identify metabolic pathways significantly enriched with the candidate genes, thus systematically revealing their potential roles within the anthocyanin biosynthesis and regulatory network.
2.5. RNA Extraction and Reverse Transcription
Total RNA from vegetative tissues (young leaves) of different grape genotypes was extracted using a polysaccharide and polyphenol plant RNA Quick Extraction Kit (HuiLing, Zhenjiang, Jiangsu, China). cDNA was synthesized by reverse transcription using a 2× NovoScript® Plus 1st Strand cDNA Synthesis SuperMix Kit (Novoprotein, Suzhou, China).
2.6. qRT-PCR
Gene-specific primers were designed and synthesized using Primer 5 (Supplementary Table S2). The Actin gene was used as an internal control. qRT–PCR was performed using 2× NovoStart® SYBR qPCR SuperMix Plus (Novoprotein, Suzhou, China), and the 2−ΔΔCt method was used to calculate the relative expression levels of the genes. Three independent biological replicates and three technical repetitions were performed for each of the qRT–PCR experiments.
2.7. Statistical Analysis
The results are presented as mean ± standard error (SE). Statistical differences and correlation analyses for all parameters were performed using one-way analysis of variance (ANOVA) followed by the least significant difference (LSD) test, implemented with IBM SPSS Statistics 26.0 (IBM Corp., Armonk, NY, USA).
3. Results
3.1. Variation and Correlation Analysis of Coloration Traits in Vegetative Organs Within a Grapevine Population
Statistical analysis was conducted on eight traits across 151 grapevine cultivars, as presented in Table 2. The standard deviation (SD) of SJXS was 1.83 in 2023 and 2.41 in 2024. The SD of JJBS remained relatively low in both years (0.61 and 0.32), indicating high stability of this trait. The coefficient of variation (CV)—the ratio of the standard deviation to the mean—eliminates scale effects and allows comparison of variation across different traits. SJXS exhibited the highest CV (73.21% and 68.42%), indicating substantial fluctuation likely influenced by genetic factors. In contrast, ZTS showed the lowest CV (approximately 34%), reflecting the relative stability of this trait. The broad-sense heritability (H2) values for all eight traits were close to 1, suggesting that phenotypic variation in these traits is primarily controlled by genetic factors (Supplementary Table S8).
Table 2.
Descriptive statistics of coloration-related traits in vegetative organs from 151 grapevine genotypes in 2023 and 2024.
Figure 2 presents the Pearson correlation coefficients among multiple variables for 2023 and 2024. The results show that the highest correlation was observed between 2024ZTS and 2023ZTS, with a coefficient of 0.92, indicating a strong positive relationship between these two variables. No significant correlations were detected among most traits; for example, the correlation coefficient between 2024ZTS and 2024SJXS was only −0.13, suggesting that different traits may be regulated by distinct genetic networks. These findings reveal significant heterogeneity among the variables, which may have important implications for subsequent analyses and model construction. Furthermore, the same traits exhibited significant positive correlations across years. This high degree of interannual repeatability clearly indicates that phenotypic variation is primarily controlled by stable genetic factors, with minimal influence from annual environmental fluctuations.
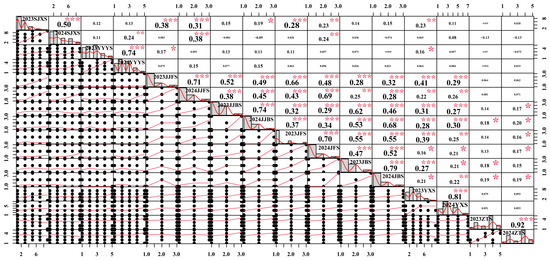
Figure 2.
Pearson correlation analysis of coloration-related traits in grape shoots and leaves in 2023 and 2024. SJXS, shoot tip pubescence anthocyanin intensity; YYYS, adaxial color of young leaves; JJFS/JJBS, ventral/dorsal color of young internode; JFS/JBS, ventral/dorsal color of young node; YXS, mature leaf main vein anthocyanin intensity; ZTS, cane surface color. Significance levels: * p < 0.05, ** p < 0.01, *** p < 0.001.
3.2. Genome-Wide Association Study
To determine the optimal association model in this study, quantile–quantile (QQ) plots were used to comparatively analyze the mixed linear model (MLM) and the general linear model (GLM). The results (Figure 3 and Figure S1) indicated that the MLM model better aligned with the expected threshold (−log10(p) ≥ 5). In the MLM, the observed values showed a significant deviation from the expected distribution of −log10(p), providing clear evidence for significant marker–trait associations for most traits. Based on the MLM model, GWAS were performed on eight coloration-related traits in grape vegetative organs. Figure 3 presents the association results for each trait in 2023 and 2024. The analysis revealed that five traits—JBS, JFS, JJBS, YXS, and ZTS—were stably associated with the same SNP loci across both consecutive years. In contrast, the three traits JJFS, SJXS, and YYYS did not show stable associations with the same SNPs between the two years.
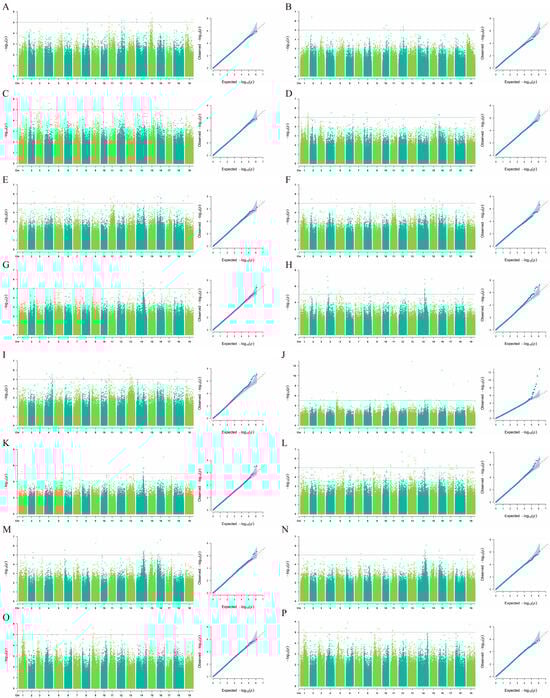
Figure 3.
GWAS for color-related traits in grape vegetative organs based on the MLM model: (A,B) SJXS (shoot tip pubescence anthocyanin intensity) in 2023 and 2024; (C,D) YYYS (adaxial color of young leaves) in 2023 and 2024; (E,F) JJFS (ventral color of young internode) in 2023 and 2024; (G,H) JJBS (dorsal color of young internode) in 2023 and 2024; (I,J) JFS (ventral color of young node) in 2023 and 2024; (K,L) JBS (dorsal color of young node) in 2023 and 2024; (M,N) YXS (mature leaf main vein anthocyanin intensity) in 2023 and 2024; (O,P) ZTS (cane surface color) in 2023 and 2024. For each pair, the left panel presents a Manhattan plot based on the GLM model, and the right panel displays a quantile–quantile (QQ) plot of observed versus expected p-values. In the Manhattan plots, the x-axis represents the physical position along the grape chromosomes, and the y-axis shows the negative base-10 logarithm of the p-value [−log10(p)]. The significance threshold is set at −log10(p) ≥ 5.
A total of 13 stable SNP loci surpassing the significance threshold (−log10(p) ≥ 5) were consistently identified across both years (Table 3), with their trait associations distributed as follows: JBS was associated with 1 SNP, JFS with 2, JJBS with 3, YXS with 5, and ZTS with 2. These consistent year-to-year SNPs were regarded as key regions for subsequent candidate gene mining, and their genetic effects were systematically evaluated. Analysis of phenotypic variation explained (PVE) revealed that individual SNPs contributed between 13.28% and 19.35% to trait variation, indicating a limited contribution per locus. However, collectively, these 13 stably associated loci constitute a significant component of the genetic basis of coloration in grape vegetative organs, suggesting that this trait is controlled by multiple genes and exhibits typical quantitative characteristics.
Table 3.
Information on co-located significant SNP loci identified from GWAS for grape leaf and shoot coloration in 2023 and 2024.
Notably, JJBS and YXS exhibited a distinct clustered SNP distribution on chromosome 14. These stable and prominent association peaks suggest that this chromosomal region may harbor a coordinated genetic mechanism regulating coloration traits in vegetative organs.
3.3. Distribution of SNP Loci Controlling Color Traits in Vegetative Organs Across Chromosomes
As shown in Figure 4, thirteen single-nucleotide polymorphism (SNP) loci demonstrated significant associations with vegetative organ coloration traits across both years of observation. These SNPs were distributed across chromosomes 3, 5, 6, 13, 14, 15, 16, and 18. Chromosome 14 harbored the highest number of SNP loci and was found to regulate SNPs associated with three coloration traits—JBS, JJBS, and YXS.
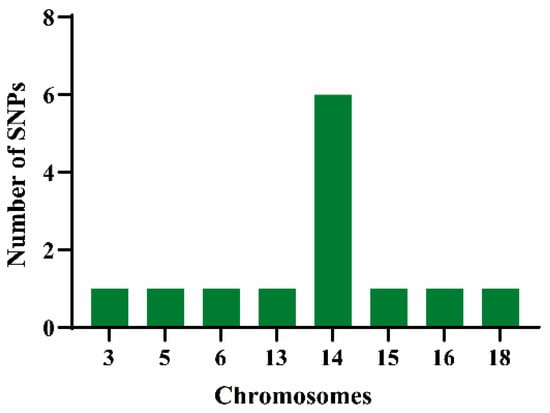
Figure 4.
Distribution on chromosomes of SNP loci significantly associated with pigmentation traits in vegetative organs. The x-axis indicates chromosomal positions; the y-axis represents the number of SNP loci.
3.4. Candidate-Gene Selection and Functional Annotation
Based on the 13 SNP loci that remained stably significant across both consecutive years of observation, 39 genes were initially screened in this study (Supplementary Table S3). Using the physical positions of these SNPs as centers, we extended 15 kb upstream and downstream along the genome to define candidate gene regions. Functional annotation of genes within these regions was performed, and after excluding protein-coding genes with uncharacterized functions, a total of 16 candidate genes were obtained (Supplementary Table S4). Functional annotation and KEGG pathway enrichment analysis (Figure 5, Supplementary Table S5) revealed that these genes were significantly enriched in biological pathways such as “transcriptional regulation” and “fatty acid biosynthesis.” Integrating the functional annotations and pathway enrichment results, we further selected five functionally highly relevant genes for in-depth analysis: VIT_14s0006g02210 (DNA ligase), VIT_14s0083g01050 (MADS-box protein 2), VIT_16s0039g01900 (Myb-like domain-containing protein), VIT_06s0004g03620 (mitogen-activated protein kinase), and VIT_06s0004g03640 (enoyl-[acyl-carrier-protein] reductase). Their genomic locations are as follows: Chr14: 19,488,977–19,528,349; Chr14: 23,363,261–23,379,498; Chr16: 1,825,309–1,828,526; Chr6: 4,580,727–4,584,943; Chr6: 4,593,344–4,599,671. Furthermore, these genes were also significantly identified in the general linear model (GLM) analysis (−log10(p) ≥ 5), further confirming the reliability of the results (Supplementary Table S4).
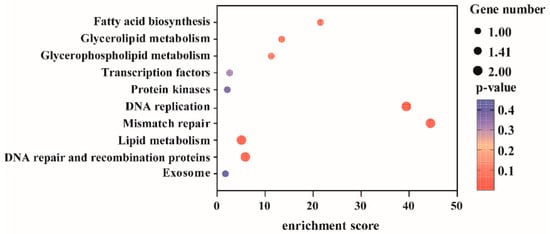
Figure 5.
KEGG pathway enrichment analysis of candidate genes associated with pigmentation in grapevine vegetative organs.
3.5. qRT-PCR Analysis
To validate the functions of the candidate genes identified through GWAS, we analyzed the expression patterns of five candidate genes across different tissue types and among grape cultivars representing varying color gradients using quantitative real-time PCR (qRT-PCR). The results (Figure 6, Supplementary Tables S6 and S7) revealed the following: Regarding tissue-specific expression, VIT_14s0083g01050, VIT_16s0039g01900, and VIT_06s0004g03620 exhibited the highest expression levels in leaves; VIT_14s0006g02210 showed relatively high expression in stem segments; and VIT_06s0004g03640 was most prominently expressed in seeds. In terms of varietal expression, VIT_14s0006g02210, VIT_14s0083g01050, VIT_16s0039g01900, and VIT_06s0004g03620 displayed a consistent upward trend in expression levels across cultivars with increasingly intense coloration. In contrast, the expression of VIT_06s0004g03640 fluctuated considerably among cultivars of different colors and did not show a regular pattern associated with the color gradient. Furthermore, although the expression of VIT_14s0006g02210 increased with darker coloration, its tissue expression profile indicated predominant expression in stem segments and seeds, with relatively low expression in leaves, leading to its exclusion from the primary candidate gene list.
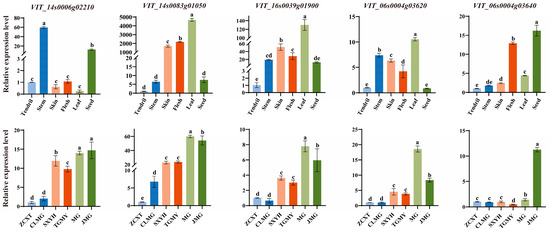
Figure 6.
Candidate gene expression levels in different tissues (tendril, stem, skin, flesh, leaf, and seed) of the ‘Yinhong’ grapevine cultivar and in different genotypes (ZCXT, CLMG, SXYH, TGMY, MG, and JMG). The genotypes correspond to ‘Zaocuixiangti’ (ZCXT), ‘Conglinmeigui’ (CLMG), ‘Shaoxingyihao’ (SXYH), ‘Tiangongmoyu’ (TGMY), ‘Miguang’ (MG), and ‘Jumeigui’ (JMG). Bars with different letters indicate statistically significant differences (p < 0.05).
In summary, this study ultimately identified three candidate genes (VIT_14s0083g01050, VIT_16s0039g01900, and VIT_06s0004g03620) whose expression levels consistently and progressively increased with deeper coloration in grape vegetative organs. VIT_14s0006g02210 and VIT_06s0004g03640 were not included as final candidates: the former, despite its correlation with color intensity across cultivars, showed low expression in the target tissue (leaves); the latter was specifically highly expressed in seeds, and its expression level showed no significant association with color variation.
4. Discussion
Previous GWAS in grapevine have successfully identified loci associated with a range of fruit-related traits, including berry cracking, seed characteristics, berry shape, and fruit quality [27,28,29,30]. However, most of these studies have primarily focused on fruit-related characteristics, whereas systematic investigations into the genetic regulatory mechanisms underlying vegetative organ coloration remain limited. In grapevine germplasm evaluation and stress-resistance breeding, vegetative organ coloration not only influences plant appearance but is also closely associated with physiological processes such as photosynthetic performance and responses to abiotic stress. As a typical polygenic trait, the extent of natural phenotypic variation within a population is critical for effective genetic dissection. In this study, comprehensive identification and quantitative assessment of eight vegetative organ coloration traits across 151 grapevine germplasm accessions revealed continuous phenotypic distributions for all traits, consistent with classical quantitative genetic characteristics. These results provide a robust phenotypic foundation for subsequent GWAS analysis.
Using 5.62 million high-quality SNP markers, a mixed linear model (MLM)-based GWAS identified 13 SNP loci that were stably and significantly associated with vegetative organ coloration across two consecutive years. These loci explained 13.28–19.35% of the phenotypic variation, indicating moderate-to-large genetic effects. Notably, 6 significant SNPs were clustered on chromosome 14, forming a prominent association hotspot. This region partially overlaps with a previously reported quantitative trait locus (QTL) for grape berry coloration (chr14: 20–25 Mb) but is independent of the well-characterized MYBA1/MYBA2 gene cluster on chromosome 2, which determines berry skin color in Vitis vinifera [31,32,33]. Comparative genomic studies further suggest that the genetic control of coloration varies across grape species. For example, in muscadine grape (Vitis rotundifolia), the berry color locus corresponds to a gene located on chromosome 4 of V. vinifera [34], which has been subsequently identified as VrGST4 [35,36]. This regulatory mechanism differs substantially from that of European grapes, highlighting interspecific divergence in color regulation. Similarly, in apple, although MdMYB1 on chromosome 9 has been repeatedly identified as the major determinant of red skin color [37,38,39], GWAS have revealed additional significant loci on chromosomes 1, 13, 16, and 17 [40,41]. Collectively, these findings demonstrate that coloration-related traits are often governed by complex, multi-locus genetic architectures and that key regulatory genes may differ among species or even among distinct organs within the same species.
Among the candidate genes identified in this study, VIT_16s0039g01900 encodes an R2R3-MYB transcription factor, a family widely recognized as central regulators of flavonoid and anthocyanin biosynthesis in plants [42,43]. Given the strong correlation between its expression pattern and anthocyanin accumulation [44,45,46], this gene is hypothesized to participate in the regulation of anthocyanin biosynthesis in grape vegetative organs. In grapevine, R2R3-MYB transcription factors exhibit functional diversification within the phenylpropanoid pathway. For instance, VvMYB5a and VvMYB5b coordinately regulate multiple branch pathways, including anthocyanin, flavonoid, and lignin biosynthesis [47,48], whereas VvMYBPA1 and VvMYBPA2 specifically control proanthocyanidin synthesis without affecting anthocyanin accumulation [49,50]. This functional specialization suggests that R2R3-MYB family members display substrate specificity and tissue-dependent regulatory roles. In the present study, VIT_16s0039g01900 expression was strongly associated with shoot tip coloration. Consistent with this observation, R2R3-MYB transcription factors such as AtMYB75, MdMYB90, and PdMYB113 have been shown to play dominant roles in regulating pigmentation in the leaves and fruits of Arabidopsis, apple, and poplar, respectively [42,51,52]. This raises the possibility that VIT_16s0039g01900 plays a role in vegetative organ coloration in grapevine—a hypothesis that warrants further investigation.
Another key candidate gene, VIT_14s0083g01050, encodes an AGAMOUS-like MADS-box protein (MADS2, also known as VvMADS2 or VvSEP1) belonging to the SEPALLATA (SEP) subfamily. Previous studies have demonstrated that MADS-box genes play crucial roles in grape flower and berry development through stage- and tissue-specific expression patterns [53]. As an SEP family member, VvMADS2 may influence coloration by participating in the formation of MADS-box tetrameric complexes or by interacting with the MYB–bHLH–WD40 (MBW) transcriptional complex to regulate the expression of anthocyanin biosynthetic genes. In Arabidopsis, the E-class MADS-box protein SEP3 functions as a central “hub” capable of forming tetrameric complexes that coordinate petal development and pigment deposition [54]. Similar regulatory roles of SEP subfamily genes in coloration have been reported in other fruit crops, including tomato (SlCMB1) [55], strawberry (FaMADS9) [56], and apple (MdMADS1) [57], where they modulate fruit ripening and pigmentation through ethylene signaling or direct activation of anthocyanin biosynthesis. Furthermore, the cucumber AGL6 ortholog CsAGL6, belonging to the AGL6/SEP clade, regulates petal green coloration by modulating CAL and SEP4 expression [58], underscoring the conserved role of this subfamily in plant color regulation. Although studies of VvMADS2 in grapevine have primarily focused on floral and fruit development, members of the SEP gene family are known to participate in pigmentation across diverse plant organs in other species. Based on this conserved functional context, it is plausible that VIT_14s0083g01050—a SEP-like gene identified in this study—may also contribute to the regulation of vegetative organ coloration in grapevine. However, direct functional evidence is required to confirm this hypothesis.
Anthocyanins, as terminal products of the phenylpropanoid pathway [59], are key pigments determining plant organ coloration and are also valued for their health-promoting properties [60]. Their biosynthesis is primarily controlled by the MYB–bHLH–WD40 transcriptional complex [61,62], the activity of which is further fine-tuned by upstream signaling pathways [63]. Among these, the mitogen-activated protein kinase (MAPK) cascade functions as a conserved signaling hub that integrates endogenous and environmental cues, including sucrose availability [64], pathogen infection [65], light [63], and temperature, to modulate anthocyanin accumulation. Although MAPK-mediated regulation of anthocyanin biosynthesis is widely conserved, its functional outcomes are species-dependent. In Arabidopsis and apple, MAPKs act as positive regulators; for example, Arabidopsis MPK4 enhances light-induced anthocyanin accumulation by phosphorylating and stabilizing MYB75/PAP1 [63], and apple MdMPK4 similarly promotes anthocyanin biosynthesis through interaction with MdMYB1 [66]. In contrast, MAPK homologs in eggplant and strawberry function as negative regulators: eggplant SmMPK4.1 represses SmMYB75 transcriptional activity [67], while strawberry FvMAPK3 promotes the degradation of FvMYB10 under low-temperature conditions [68]. Although the findings of these studies are not entirely consistent, they collectively reveal a conserved regulatory mechanism in which MAPKs directly modulate anthocyanin biosynthesis by phosphorylating key MYB transcription factors. Based on this conserved framework, it is reasonable to hypothesize that the grapevine MAPK gene VIT_06s0004g03620 may also contribute to vegetative organ coloration through a similar signaling pathway—a hypothesis that, of course, requires further experimental validation.
Limitations of This Study
This GWAS-based study provides initial insights into the genetic basis of vegetative organ coloration in grapevine, yet several limitations must be considered. First, while qRT-PCR offers preliminary expression support for the candidate genes, biochemical quantification of anthocyanin content was not performed. Correlating gene expression with pigment concentration would significantly strengthen the link between transcription and phenotype. Second, the candidate genes identified here are statistically and transcriptionally associated with the trait, but they lack functional validation. Experiments such as transient expression, VIGS, or genome editing are essential to confirm causality and are a clear next step beyond this association-based study. Therefore, we present these genes as strongly supported candidates, not as functionally confirmed regulators. Acknowledging these limitations reframes our findings not as definitive, but as a robust foundation for future research integrating metabolomics and functional characterization.
5. Conclusions
Using GWAS, this study identified 13 SNP loci stably associated with grapevine vegetative organ coloration across two years, with 6 clustered on chromosome 14, and expression analysis revealed three candidate genes—VIT_14s0083g01050 (MADS box protein 2), VIT_16s0039g01900 (Myb-like domain-containing protein), and VIT_06s0004g03620 (mitogen activated protein kinase)—whose transcript levels strongly correlated with coloration intensity and showed highest expression in leaves, supporting our hypothesis that vegetative organ coloration is controlled by stable, heritable loci and involves MYB transcription factors and MAPK signaling components; notably, VIT_16s0039g01900 (R2R3-MYB) and VIT_06s0004g03620 (MAPK) align with this proposed regulatory framework, although these genes represent candidates based on association and expression data and require experimental validation. Overall, this study provides a foundation for understanding the genetic regulation of vegetative organ coloration in grapevine and offers valuable markers and candidate genes for future functional studies and breeding efforts.
Supplementary Materials
The following supporting information can be downloaded at: https://www.mdpi.com/article/10.3390/horticulturae12030359/s1.
Author Contributions
L.H. and Z.Y.: methodology, writing—original draft preparation. Y.X.: data curation, methodology. C.F. and L.W.: resources, investigation. Z.C.: visualization, writing—review and editing. C.Y.: validation, methodology. Y.W.: conceptualization, project administration. All authors have read and agreed to the published version of the manuscript.
Funding
This work was supported by the Public Welfare Research Program Key Project of Ningbo (2024S016), Key Research and Development Program of Zhejiang Province (2021C02053), Zhejiang Provincial Top Discipline of Biological Engineering (Level A) Open Fund (KF2024001), Zhejiang Provincial Top Discipline of Biological Engineering (Level A) Self-set Subject (ZS2023016), and Zhejiang Provincial Top Discipline of Biological Engineering (Level A) (CX2025010).
Data Availability Statement
The data presented in this study are openly available in Genome Sequence Archive database at https://ngdc.cncb.ac.cn/, reference number PRJCA026367.
Acknowledgments
We thank BGI (Wuhan, China) for technical support in whole-genome sequencing.
Conflicts of Interest
The authors declare no conflicts of interest.
Abbreviations
The following abbreviations are used in this manuscript:
| SNP | Single-nucleotide polymorphism |
| GWAS | Genome-wide association study |
| PVE | Phenotypic variation explained |
| MAF | Minor allele frequency |
| QQ Plot | Quantile–quantile plot |
| MAPK | Mitogen-activated protein kinase |
References
- Santos-Buelga, C.; Mateus, N.; De Freitas, V. Anthocyanins. Plant pigments and beyond. J. Agric. Food Chem. 2014, 62, 6879–6884. [Google Scholar] [CrossRef]
- Celli, G.B.; Tan, C.; Selig, M.J. Anthocyanidins and anthocyanins. In Encyclopedia of Food Chemistry; Elsevier: Amsterdam, The Netherlands, 2019; pp. 218–223. [Google Scholar] [CrossRef]
- Oglesby, L.; Ananga, A.; Obuya, J.; Ochieng, J.; Cebert, E.; Tsolova, V. Anthocyanin accumulation in muscadine berry skins is influenced by the expression of the MYB transcription factors, MybA1, and MYBCS1. Antioxidants 2016, 5, 35. [Google Scholar] [CrossRef]
- Zhu, Z.; Li, G.; Liu, L.; Zhang, Q.; Han, Z.; Chen, X.; Li, B. A r2r3-MYB transcription factor, VvMYBC2l2, functions as a transcriptional repressor of anthocyanin biosynthesis in grapevine (Vitis vinifera L.). Molecules 2019, 24, 92. [Google Scholar] [CrossRef] [PubMed]
- Zheng, X.T.; Yu, Z.C.; Tang, J.W.; Cai, M.L.; Chen, Y.L.; Yang, C.W.; Chow, W.S.; Peng, C.L. The major photoprotective role of anthocyanins in leaves of arabidopsis thaliana under long-term high light treatment: Antioxidant or light attenuator? Photosynth. Res. 2020, 149, 25–40. [Google Scholar] [CrossRef]
- Zhang, Q.; Su, L.J.; Chen, J.W.; Zeng, X.Q.; Sun, B.Y.; Peng, C.L. The antioxidative role of anthocyanins in Arabidopsis under high-irradiance. Biol. Plant. 2012, 56, 97–104. [Google Scholar] [CrossRef]
- Zhang, K.; Yu, H.; Shi, K.; Zhou, Y.; Yu, J.; Xia, X. Photoprotective roles of anthocyanins in Begonia semperflorens. Plant Sci. 2010, 179, 202–208. [Google Scholar] [CrossRef]
- Wang, L.; Hu, Y.; Zhang, H.; Xu, N.; Zhang, X.; Sun, G. Photoprotective mechanisms of leaf anthocyanins: Research progress. J. Appl. Ecol. 2012, 23, 835–841. [Google Scholar] [CrossRef]
- Zhang, T.; Chow, W.S.; Liu, X.; Zhang, P.; Liu, N.; Peng, C. A magic red coat on the surface of young leaves: Anthocyanins distributed in trichome layer protect Castanopsis fissa leaves from photoinhibition. Tree Physiol. 2016, 36, 1296–1306. [Google Scholar] [CrossRef] [PubMed]
- Li, W.; Tan, L.; Zou, Y.; Tan, X.; Huang, J.; Chen, W.; Tang, Q. The effects of ultraviolet a/b treatments on anthocyanin accumulation and gene expression in dark-purple tea cultivar ‘ziyan’ (Camellia sinensis). Molecules 2020, 25, 354. [Google Scholar] [CrossRef]
- Li, F.; Tahir, M.M.; Yang, C.; Weng, Z.; Zhu, W.; Zhang, Y.; Zhou, K.; Deng, Q.; Qian, M.; Wu, H. Postharvest UV-a treatment promotes mango fruit pigmentation and ripening in a dose-dependent manner. Postharvest Biol. Technol. 2025, 230, 113836. [Google Scholar] [CrossRef]
- Chen, W.; Tang, D.; Tan, X.; Tan, L.; Tang, Q. Metabolomic and transcriptomic insights into anthocyanin biosynthesis in ‘ziyan’ tea plants under varied photoperiod and temperature conditions. Agronomy 2024, 14, 56. [Google Scholar] [CrossRef]
- Han, Q.; Kusumoto, N.; Kanetani, S.; Suyama, Y.; Tsujii, Y.; Kabeya, D.; Tsumura, Y.; Uchiyama, K. Photoprotective pigment plasticity and cold acclimation strategies in Cryptomeria japonica across two common gardens. For. Res. 2025, 5, e015. [Google Scholar] [CrossRef]
- Yue, X.; Zhao, Y.; Ma, X.; Jiao, X.; Fang, Y.; Zhang, Z.; Ju, Y. Effects of leaf removal on the accumulation of anthocyanins and the expression of anthocyanin biosynthetic genes in cabernet sauvignon (Vitis vinifera L.) Grapes. J. Sci. Food. Agric. 2021, 101, 3214–3224. [Google Scholar] [CrossRef]
- Lander, E.S.; Botstein, D. Mapping mendelian factors underlying quantitative traits using RFLP linkage maps. Genetics 1989, 121, 185–199. [Google Scholar] [CrossRef]
- Breseghello, F.; Sorrells, M.E. Association analysis as a strategy for improvement of quantitative traits in plants. Crop Sci. 2006, 46, 1323–1330. [Google Scholar] [CrossRef]
- Chen, H.; Semagn, K.; Iqbal, M.; Moakhar, N.P.; Haile, T.; Diaye, A.N.; Yang, R.; Hucl, P.; Pozniak, C.; Spaner, D. Genome-wide association mapping of genomic regions associated with phenotypic traits in canadian western spring wheat. Mol. Breed. 2017, 37, 141. [Google Scholar] [CrossRef]
- Thornsberry, J.M.; Goodman, M.M.; Doebley, J.; Kresovich, S.; Nielsen, D.; Iv, E.S.B. Dwarf8 polymorphisms associate with variation in flowering time. Nat. Genet. 2001, 28, 286–289. [Google Scholar] [CrossRef]
- Kayikci, H.C.; Aydin, S.; Adak, A.; Dogan, A.; Sapkota, M.; Feng, Q.; Topcu, Y. Association mapping of tomato fruit quality for weight, firmness, brix, and color using GWAS. BMC Plant Biol. 2025, 26, 41. [Google Scholar] [CrossRef] [PubMed]
- Carmen, G.; Ana, C.; Soler, G.A.; Phil, M.; Jose, F.J. GWAS of pod morphological and color characters in common bean. BMC Plant Biol. 2021, 21, 184. [Google Scholar] [CrossRef] [PubMed]
- Yang, X.; Xia, X.; Zeng, Y.; Nong, B.; Zhang, Z.; Wu, Y.; Xiong, F.; Zhang, Y.; Liang, H.; Deng, G.; et al. Identification of candidate genes for gelatinization temperature, gel consistency and pericarp color by GWAS in rice based on SLAF-sequencing. PLoS ONE 2018, 13, e0196690. [Google Scholar] [CrossRef]
- Bo, K.; Wei, S.; Wang, W.; Miao, H.; Dong, S.; Zhang, S.; Gu, X. QTL mapping and genome-wide association study reveal two novel loci associated with green flesh color in cucumber. BMC Plant Biol. 2019, 19, 243. [Google Scholar] [CrossRef] [PubMed]
- Wang, J.; Xian, X.; Xu, X.; Qu, C.; Lu, K.; Li, J.; Liu, L. Genome-wide association mapping of seed coat color in Brassica napus. J. Agric. Food. Chem. 2017, 65, 5229–5237. [Google Scholar] [CrossRef]
- Zhang, C.; Yadav, V.; Cui, L. Mining of candidate genes associated with leaf shape traits in grapes. Int. J. Mol. Sci. 2024, 25, 12101. [Google Scholar] [CrossRef]
- Hu, L.; Xu, T.; Cai, Y.; Qin, Y.; Zheng, Q.; Chen, T.; Gong, L.; Yang, J.; Zhao, Y.; Chen, J.; et al. Identifying candidate genes for grape (Vitis vinifera L.) Fruit firmness through genome-wide association studies. J. Agric. Food. Chem. 2025, 73, 8413–8425. [Google Scholar] [CrossRef]
- Gao, J.; Zhou, X.; Hao, Z.; Jiang, L.; Yang, R. Genome-wide barebones regression scan for mixed-model association analysis. Theor. Appl. Genet. 2019, 133, 51–58. [Google Scholar] [CrossRef] [PubMed]
- Zhang, C.; Wu, J.-Y.; Cui, L.-W.; Fang, J.-G. Mining of candidate genes for grape berry cracking using a genome-wide association study. J. Integr. Agric. 2022, 21, 2291–2304. [Google Scholar] [CrossRef]
- Zhang, C.; Yang, Y.; Zhang, S.; Yadav, V.; Zhong, H.; Zhang, F.; Zhou, X.; Wu, X.; Cao, X.; Cui, L. Mining candidate genes for grape seed traits based on a genome-wide association study. Hortic. Plant J. 2025, 11, 1847–1864. [Google Scholar] [CrossRef]
- Zhang, C.; Cui, L.; Fang, J. Genome-wide association study of the candidate genes for grape berry shape-related traits. BMC Plant Biol. 2022, 22, 42. [Google Scholar] [CrossRef]
- Guo, D.; Zhao, H.; Li, Q.; Zhang, G.; Jiang, J.; Liu, C.; Yu, Y. Genome-wide association study of berry-related traits in grape [Vitis vinifera L.] Based on genotyping-by-sequencing markers. Hortic. Res. 2019, 6, 11. [Google Scholar] [CrossRef]
- Matus, J.T.; Cavallini, E.; Loyola, R.; Hoell, J.; Finezzo, L.; Dal Santo, S.; Vialet, S.; Commisso, M.; Roman, F.; Schubert, A.; et al. A group of grapevine MYBA transcription factors located in chromosome 14 control anthocyanin synthesis in vegetative organs with different specificities compared with the berry color locus. Plant. J. 2017, 91, 220–236. [Google Scholar] [CrossRef]
- Li, H.; Yang, Y.; Zhang, W.; Zheng, H.; Xu, X.; Li, H.; Sun, C.; Hu, H.; Zhao, W.; Ma, R.; et al. Promoter replication of grape MYB transcription factor is associated with a new red flesh phenotype. Plant Cell Rep. 2024, 43, 136. [Google Scholar] [CrossRef]
- Sun, L.; Li, S.; Jiang, J.; Tang, X.; Fan, X.; Zhang, Y.; Liu, J.; Liu, C. New quantitative trait locus (QTLs) and candidate genes associated with the grape berry color trait identified based on a high-density genetic map. BMC Plant Biol. 2020, 20, 302. [Google Scholar] [CrossRef] [PubMed]
- Lewter, J.; Worthington, M.L.; Clark, J.R.; Varanasi, A.V.; Nelson, L.; Owens, C.L.; Conner, P.; Gunawan, G. High-density linkage maps and loci for berry color and flower sex in muscadine grape (Vitis rotundifolia). Theor. Appl. Genet. 2019, 132, 1571–1585. [Google Scholar] [CrossRef]
- Cochetel, N.; Minio, A.; Massonnet, M.; Vondras, A.M.; Figueroa-Balderas, R.; Cantu, D. Diploid chromosome-scale assembly of the Muscadinia rotundifolia genome supports chromosome fusion and disease resistance gene expansion during Vitis and Muscadinia divergence. G3-Genes Genomes Genet. 2021, 11, jkab033. [Google Scholar] [CrossRef]
- Varanasi, A.; Worthington, M.; Nelson, L.; Brown, A.; Chizk, T.M.; Threlfall, R.; Howard, L.; Conner, P.; Figueroa-Balderas, R.; Massonnet, M.; et al. Glutathione s-transferase: A candidate gene for berry color in muscadine grapes (Vitis rotundifolia). G3-Genes Genomes Genet. 2022, 12, jkac060. [Google Scholar] [CrossRef] [PubMed]
- Migicovsky, Z.; Gardner, K.M.; Money, D.; Sawler, J.; Bloom, J.S.; Moffett, P.; Chao, C.T.; Schwaninger, H.; Fazio, G.; Zhong, G.; et al. Genome to phenome mapping in apple using historical data. Plant Genome 2016, 9. [Google Scholar] [CrossRef]
- Moriya, S.; Kunihisa, M.; Okada, K.; Shimizu, T.; Honda, C.; Yamamoto, T.; Muranty, H.; Denancé, C.; Katayose, Y.; Iwata, H.; et al. Allelic composition of MdMYB1 drives red skin color intensity in apple (Malus × domestica Borkh.) And its application to breeding. Euphytica 2017, 213, 78. [Google Scholar] [CrossRef]
- Kumar, S.; Chagne, D.; Bink, M.C.A.M.; Volz, R.K.; Whitworth, C.; Carlisle, C. Genomic selection for fruit quality traits in apple (Malus × domestica Borkh.). PLoS ONE 2012, 7, e36674. [Google Scholar] [CrossRef]
- Mcclure, K.A.; Gardner, K.M.; Douglas, G.M.; Song, J.; Forney, C.F.; Delong, J.; Fan, L.; Du, L.; Toivonen, P.M.A.; Somers, D.J.; et al. A genome-wide association study of apple quality and scab resistance. Plant Genome 2018, 11, 170075. [Google Scholar] [CrossRef]
- Minamikawa, M.F.; Kunihisa, M.; Noshita, K.; Moriya, S.; Abe, K.; Hayashi, T.; Katayose, Y.; Matsumoto, T.; Nishitani, C.; Terakami, S.; et al. Tracing founder haplotypes of japanese apple varieties: Application in genomic prediction and genome-wide association study. Hortic. Res. 2021, 8, 49. [Google Scholar] [CrossRef] [PubMed]
- Shin, D.H.; Cho, M.; Choi, M.G.; Das, P.K.; Lee, S.; Choi, S.; Park, Y. Identification of genes that may regulate the expression of the transcription factor production of anthocyanin pigment 1 (PAP1)/MYB75 involved in Arabidopsis anthocyanin biosynthesis. Plant Cell Rep. 2015, 34, 805–815. [Google Scholar] [CrossRef] [PubMed]
- Lee, S.; Kim, S.; Kim, Y.; Lee, J.; Kim, T. Transcription factors BZR1 and PAP1 cooperate to promote anthocyanin biosynthesis in Arabidopsis shoots. Plant Cell 2024, 36, 3654–3673. [Google Scholar] [CrossRef]
- He, L.; Lai, G.; Lin, J.; Guo, A.; Yang, F.; Pan, R.; Che, J.; Lai, C. VdCHS2 overexpression enhances anthocyanin biosynthesis, modulates the composition ratio, and increases antioxidant activity in Vitis davidii cells. Antioxidants 2024, 13, 1472. [Google Scholar] [CrossRef]
- Luan, Y.; Tao, J.; Zhao, D. Synergistic actions of 3 MYB transcription factors underpin blotch formation in tree peony. Plant Physiol. 2024, 196, 1869–1886. [Google Scholar] [CrossRef]
- Zhu, J.; Wang, Y.; Wang, Q.; Li, B.; Wang, X.; Zhou, X.; Zhang, H.; Xu, W.; Li, S.; Wang, L. The combination of DNA methylation and positive regulation of anthocyanin biosynthesis by MYB and bhlh transcription factors contributes to the petal blotch formation in xibei tree peony. Hortic. Res. 2023, 10, uhad100. [Google Scholar] [CrossRef]
- Deluc, L.; Barrieu, F.; Marchive, C.; Lauvergeat, V.; Decendit, A.; Richard, T.; Carde, J.P.; Merillon, J.M.; Hamdi, S. Characterization of a grapevine r2r3-myb transcription factor that regulates the phenylpropanoid pathway. Plant Physiol. Plant Physiol. 2006, 140, 499–511. [Google Scholar] [CrossRef] [PubMed]
- Deluc, L.; Bogs, J.; Walker, A.R.; Ferrier, T.; Décendit, A.; Mérillon, J.; Robinson, S.; Barrieu, F. The transcription factor VvMYB5b contributes to the regulation of anthocyanin and proanthocyanidin biosynthesis in developing grape berries12[w]. Plant Physiol. 2008, 147, 2041–2053. [Google Scholar] [CrossRef] [PubMed]
- Bogs, J.; Jaffe, F.W.; Takos, A.M.; Walker, A.R.; Robinson, S.P. The grapevine transcription factor VvMYBPA1 regulates proanthocyanidin synthesis during fruit development. Plant Physiol. 2007, 143, 1347–1361. [Google Scholar] [CrossRef]
- Terrier, N.; Torregrosa, L.; Ageorges, A.; Vialet, S.; Verries, C.; Cheynier, V.; Romieu, C. Ectopic expression of VvMybPA2 promotes proanthocyanidin biosynthesis in grapevine and suggests additional targets in the pathway1[w][OA]. Plant Physiol. 2008, 149, 1028–1041. [Google Scholar] [CrossRef]
- Sun, C.; Wang, C.; Zhang, W.; Liu, S.; Wang, W.; Yu, X.; Song, T.; Yu, M.; Yu, W.; Qu, S. The r2r3-type MYB transcription factor MdMYB90-like is responsible for the enhanced skin color of an apple bud sport mutant. Hortic. Res. 2021, 8, 156. [Google Scholar] [CrossRef]
- Li, W.; Che, J.; Ren, J.; Wang, A.; Chen, J. A key r2r3-MYB transcription factor activates anthocyanin biosynthesis and leads to leaf reddening in poplar mutants. Plant Cell Environ. 2024, 48, 2067–2082. [Google Scholar] [CrossRef]
- Boss, P.K.; Sensi, E.; Hua, C.; Davies, C.; Thomas, M.R. Cloning and characterisation of grapevine (Vitis vinifera L.) MADS-box genes expressed during inflorescence and berry development. Plant Sci. 2002, 162, 887–895. [Google Scholar] [CrossRef]
- Immink, R.G.; Tonaco, I.A.; de Folter, S.; Shchennikova, A.; van Dijk, A.D.; Busscher-Lange, J.; Borst, J.W.; Angenent, G.C. SEPALLATA3: The ‘glue’ for MADS box transcription factor complex formation. Genome Biol. 2009, 10, R24. [Google Scholar] [CrossRef]
- Zhang, J.; Hu, Z.; Yao, Q.; Guo, X.; Nguyen, V.; Li, F.; Chen, G. A tomato MADS-box protein, SlCMB1, regulates ethylene biosynthesis and carotenoid accumulation during fruit ripening. Sci. Rep. 2018, 8, 3413. [Google Scholar] [CrossRef]
- Seymour, G.B.; Ryder, C.D.; Cevik, V.; Hammond, J.P.; Popovich, A.; King, G.J.; Vrebalov, J.; Giovannoni, J.J.; Manning, K. A SEPALLATA gene is involved in the development and ripening of strawberry (Fragaria × ananassa Duch.) Fruit, a non-climacteric tissue*. J. Exp. Bot. 2011, 62, 1179–1188. [Google Scholar] [CrossRef]
- Zhang, L.; Tao, H.; Zhang, J.; An, Y.; Wang, L. 5-aminolevulinic acid activates the MdWRKY71-MdMADS1 module to enhance anthocyanin biosynthesis in apple. Mol. Hortic. 2025, 5, 10. [Google Scholar] [CrossRef]
- Qin, L.; Liu, Z.; Li, S.; Cai, G.; Wang, J.; Yang, X.; Sun, J. Functional analysis of CsAGL6 in flower development and pigmentation in cucumber (Cucumis sativus L.). J. Integr. Agric. 2026. [Google Scholar] [CrossRef]
- Koes, R.; Verweij, W.; Quattrocchio, F. Flavonoids: A colorful model for the regulation and evolution of biochemical pathways. Trends Plant Sci. 2005, 10, 236–242. [Google Scholar] [CrossRef] [PubMed]
- Rio, D.D.; Borges, G.; Crozier, A. Berry flavonoids and phenolics: Bioavailability and evidence of protective effects. Br. J. Nutr. 2010, 104, S67–S90. [Google Scholar] [CrossRef] [PubMed]
- Ramsay, N.A.; Glover, B.J. MYB-bHLH-WD40 protein complex and the evolution of cellular diversity. Trends Plant Sci. 2005, 10, 63–70. [Google Scholar] [CrossRef] [PubMed]
- Gonzalez, A.; Zhao, M.; Leavitt, J.M.; Lloyd, A.M. Regulation of the anthocyanin biosynthetic pathway by the TTG1/bHLH/myb transcriptional complex in Arabidopsis seedlings. Plant J. 2007, 53, 814–827. [Google Scholar] [CrossRef]
- Li, S.; Wang, W.; Gao, J.; Yin, K.; Wang, R.; Wang, C.; Petersen, M.; Mundy, J.; Qiu, J. MYB75 phosphorylation by MPK4 is required for light-induced anthocyanin accumulation in Arabidopsis. Plant Cell 2016, 28, 2866–2883. [Google Scholar] [CrossRef] [PubMed]
- Meng, L.; Li, Y.; Liu, M.; Jiang, J. The Arabidopsis ANGUSTIFOLIA3-YODA gene cascade induces anthocyanin accumulation by regulating sucrose levels. Front. Plant Sci. 2016, 7, 1728. [Google Scholar] [CrossRef] [PubMed]
- Xu, J.; Meng, J.; Meng, X.; Zhao, Y.; Liu, J.; Sun, T.; Liu, Y.; Wang, Q.; Zhang, S. Pathogen-responsive MPK3 and MPK6 reprogram the biosynthesis of indole glucosinolates and their derivatives in Arabidopsis immunity. Plant Cell 2016, 28, 1144–1162. [Google Scholar] [CrossRef]
- Yang, T.; Ma, H.; Li, Y.; Zhang, Y.; Zhang, J.; Wu, T.; Song, T.; Yao, Y.; Tian, J. Apple MPK4 mediates phosphorylation of MYB1 to enhance light-induced anthocyanin accumulation. Plant J. 2021, 106, 1728–1745. [Google Scholar] [CrossRef]
- Liao, J.; Dong, Y.; Hua, Z.; Hao, J.; Zhao, N.; Li, S.; Chen, H. Identification of eggplant SmMPK gene family and functional verification of SmMPK4.1. Horticulturae 2024, 10, 239. [Google Scholar] [CrossRef]
- Mao, W.; Han, Y.; Chen, Y.; Sun, M.; Feng, Q.; Li, L.; Liu, L.; Zhang, K.; Wei, L.; Han, Z.; et al. Low temperature inhibits anthocyanin accumulation in strawberry fruit by activating FvMAPK3-induced phosphorylation of FvMYB10 and degradation of chalcone synthase 1. Plant Cell 2022, 34, 1226–1249. [Google Scholar] [CrossRef] [PubMed]


Disclaimer/Publisher’s Note: The statements, opinions and data contained in all publications are solely those of the individual author(s) and contributor(s) and not of MDPI and/or the editor(s). MDPI and/or the editor(s) disclaim responsibility for any injury to people or property resulting from any ideas, methods, instructions or products referred to in the content. |
© 2026 by the authors. Licensee MDPI, Basel, Switzerland. This article is an open access article distributed under the terms and conditions of the Creative Commons Attribution (CC BY) license.