Abstract
Paeonia lactiflora is an important traditional Chinese medicine. Its core bioactive component, albiflorin, exhibits significant pharmacological activity, but its biosynthetic pathway remains unclear, severely limiting the targeted regulation and sustainable utilization of this compound. In this study, integrated transcriptomic and metabolomic analyses revealed that tissue specificity is a key factor driving metabolite accumulation. Weighted Gene Co-expression Network Analysis (WGCNA) identified a gene module significantly positively correlated with albiflorin content. From this module, key candidate genes were screened, including MYB and bHLH transcription factor genes as well as CYP450. The expression patterns of these candidate genes were subsequently validated by qRT-PCR, confirming a strong correlation between the transcriptomic and experimental data. These findings not only clarify the molecular basis for the tissue-specific accumulation of albiflorin and provide critical targets for elucidating its complete biosynthetic pathway but also lay a solid foundation for molecular breeding and quality improvement of Paeonia lactiflora.
1. Introduction
Plants of the genus Paeonia possess high ornamental and medicinal value and belong to the family Paeoniaceae [1,2]. The root of Paeonia lactiflora, processed into the traditional Chinese medicine Baishao, has a long history of clinical application with significant efficacy [1,3,4,5]. Modern phytochemical studies have shown that Paeonia species are rich in various active compounds, including monoterpene glycosides, phenolics, tannins, triterpenoids, and polysaccharides [6,7,8]. Among these, monoterpene glycoside compounds (MPGs) are regarded as characteristic components and quality control markers for this genus due to their unique chemical structures and notable pharmacological activities [9,10]. The MPGs in Paeonia possess a distinctive carbon skeleton found exclusively in this genus [1,11]. Their basic framework is monoterpenoid, which combines with glucosyl and various acyl groups to form a series of structurally diverse derivatives [12,13]. Among these monoterpene glycosides, albiflorin has emerged as a key bioactive component with notable neuroprotective and antidepressant activities, yet its biosynthetic pathway remains largely unresolved, limiting targeted metabolic engineering efforts [13].
Albiflorin represents a monoterpene glycoside of distinct pharmacological and biosynthetic interest. It shows marked efficacy in neuropsychiatric and neurodegenerative disorders, such as depression, Alzheimer’s disease and neuropathic pain, through mechanisms that include modulating monoamine neurotransmitters, suppressing neuroinflammation, enhancing neuroplasticity, reducing amyloid β-protein accumulation, and activating key signaling pathways [13,14]. Although both albiflorin and the more widely studied paeoniflorin share anti-inflammatory and neuroprotective properties [15,16,17], these distinctive pharmacological properties collectively define albiflorin as a compound with a specialized therapeutic niche. Its broad yet specific bioactivity makes the elucidation of its biosynthetic pathway a critical research priority. However, the biosynthetic pathway of albiflorin, particularly the key late-stage oxidative modifications and regulatory mechanisms, remains poorly understood, hindering practical applications such as targeted enhancement of albiflorin content through synthetic biology or molecular breeding.
In recent years, the rapid development of high-throughput sequencing technologies has provided powerful tools for elucidating plant secondary metabolic pathways [18]. Integrated transcriptomic and metabolomic analysis has emerged as an effective strategy for systematically mining functional genes involved in plant secondary metabolite biosynthesis and unraveling their regulatory networks, and has been widely applied not only in model plants such as rice but also in diverse medicinal plant species [19,20,21]. Therefore, to systematically analyze the biosynthesis and regulatory mechanisms of albiflorin, this study selected three representative cultivated varieties of Paeonia lactiflora and performed integrated transcriptomic and widely targeted metabolomic analyses on their main medicinal part (root) and a control tissue (flower). We employed RNA-seq to profile global gene expression and utilized UPLC-MS/MS-based widely targeted metabolomics to quantify secondary metabolites. The two datasets were then integrated through correlation analysis and weighted gene co-expression network analysis (WGCNA) to identify candidate genes strongly associated with albiflorin accumulation. Key findings were further validated by qRT-PCR. This combined approach allows for a comprehensive exploration of the tissue-specific regulatory mechanisms underlying albiflorin biosynthesis. This study aims to clarify the tissue-specific accumulation patterns of albiflorin and identify key candidate genes involved in its synthesis, thereby providing an omics foundation for ultimately elucidating its complete biosynthetic pathway and improving the quality of Paeonia lactiflora.
2. Materials and Methods
2.1. Plant Materials
Plant materials were obtained from three three-year-old medicinal varieties of Paeonia lactiflora YanZhiDianYue (Y), DaHongPao (D), and WuLongTanHai (W). All plants were sampled in April during the flowering stage. Flowers and roots were collected as experimental materials, resulting in six groups: Y-Flower, D-Flower, W-Flower, Y-Root, D-Root, and W-Root. The distinct morphology of the flowers and roots from these three cultivars is shown in Figure 1. Each group consisted of three biological replicates, totaling 18 samples for transcriptome sequencing and widely targeted metabolome analysis.
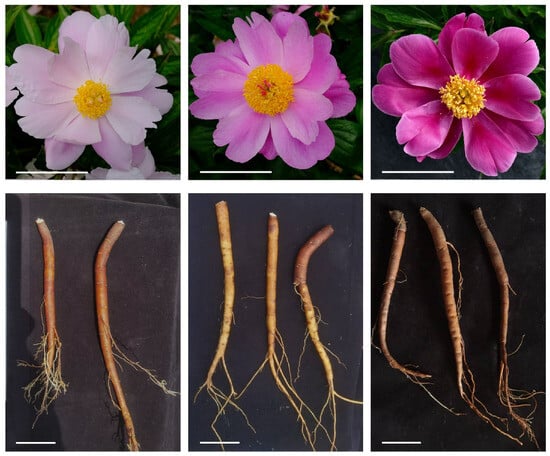
Figure 1.
Morphology of the tissues flower and root from three Paeonia lactiflora cultivars. The upper panel displays flowers, and the lower panel displays the corresponding roots used for the preparation of the traditional medicine Baishao. From left to right, the cultivars are YanZhiDianYue (Y), DaHongPao (D), and WuLongTanHai (W). Scale bars = 5 cm.
2.2. Methods
2.2.1. Widely Targeted Metabolome Analysis
Metabolomic analysis was performed on flowers and roots of the three varieties (Y, D, W). Metabolite extraction and analysis were conducted by Metware Biotechnology Co., Ltd (Wuhan, China). The data acquisition system primarily included Ultra Performance Liquid Chromatography (UPLC) (ExionLC™ AD, Shanghai, China) and Tandem Mass Spectrometry (MS/MS) (ExionLC™ AD, Shanghai, China). Metabolite identification was based on the MWDB (Metware Database) using secondary spectral information, followed by quantification using Multiple Reaction Monitoring (MRM) mode on a triple quadrupole mass spectrometer (ExionLC™ AD, Shanghai, China).
2.2.2. Transcriptome Sequencing Analysis
Transcriptome sequencing was performed by Metware Biotechnology Co., Ltd (Wuhan, China). Total RNA was extracted from samples, and mRNA with polyA tails was enriched using Oligo (dT) magnetic beads. The RNA was then fragmented, and first-strand cDNA was synthesized using the fragmented RNA as a template, followed by second-strand cDNA synthesis. Double-stranded cDNA was purified using DNA purification beads. The purified cDNA underwent end repair, A-tailing, and adapter ligation. Fragments of appropriate size were selected using DNA purification beads, and the final cDNA library was obtained by PCR enrichment and sequenced on an Illumina platform. After filtering raw sequencing data, high-quality reads were obtained. Trinity was used for de novo assembly to obtain transcript sequences, and Corset was used for redundancy reduction to generate Unigene sequences. High-quality reads were then mapped to the deduplicated transcripts to calculate gene expression levels and identify differentially expressed genes (DEGs) across sample groups.
2.2.3. RNA Extraction and qRT-PCR
To validate the transcriptomic data, quantitative real-time PCR (qRT-PCR) was performed on the same RNA samples used for sequencing. cDNA was produced from total RNA using a reverse transcription system with EasyQuick RT MasterMix (Cwbio, Jiangsu, China). Quantitative real-time PCR was performed with UltraSYBR One Step RT-qPCR Kit (Cwbio, Jiangsu, China) and relative gene expression levels were calculated using the 2−ΔΔCt method. The PlACTIN1 was used as an internal reference to normalize the gene expression data [22]. Three biological and two technical repeats were performed in the experiments. The qRT-PCR primer pairs for gene amplification are shown in Table S1.
3. Results
3.1. Analysis of Major Bioactive Components in Paeonia lactiflora
To analyze the main bioactive components in Paeonia lactiflora, metabolome data from all samples were examined, identifying a wide spectrum of secondary metabolites encompassing flavonoids, terpenoids, phenolic acids, and others (Figure 2A). Principal Component Analysis (PCA) was first performed for dimensionality reduction (Figure 2B). The first two principal components explained 67.74% and 9.26% of the total variance, respectively, indicating that these components effectively captured the variation in the original data. The two-dimensional space formed by PC1 and PC2 clearly distinguished all experimental groups, suggesting significant metabolic differences among groups. Moreover, flower and root samples from different varieties were spatially separated in the PCA plot, clustering on opposite sides of the axes. This indicates substantial metabolic differences between flower and root tissues, while metabolic profiles of the same tissue across different varieties were relatively conserved, suggesting that these three varieties may share conserved metabolic regulatory mechanisms.
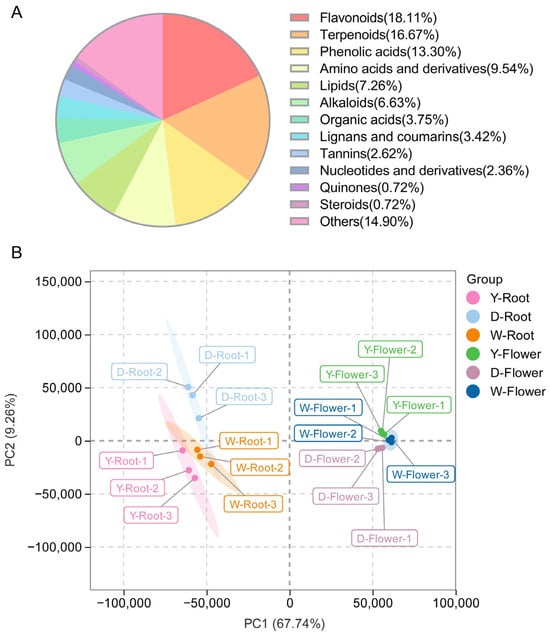
Figure 2.
Preliminary analysis of metabolomics data. (A) Classification pie chart of metabolites detected. (B) PCA score plots were generated for all samples.
Based on PCA results, tissue specificity appeared to be the main driver of metabolome variation in Paeonia lactiflora. Therefore, metabolome data were divided into three comparison groups: Y-Flower vs. Y-Root, D-Flower vs. D-Root, and W-Flower vs. W-Root for differential metabolite analysis. Significant differential metabolites were screened using Student’s t-test (p-value ≤ 0.05), combined with Variable Importance in Projection (VIP) ≥1, which indicates metabolites with high discriminatory power between groups in the PLS-DA model, to identify metabolites contributing to group separation. A Fold Change ≥2 or ≤0.5 was set to ensure biologically meaningful abundance changes. In the corresponding volcano plots (Figure 3A–C), metabolites significantly accumulated in roots are shown in green, those significantly accumulated in flowers in red, and non-significant metabolites in grey. The Y-Flower vs. Y-Root comparison identified 1286 significant differential metabolites, with 660 upregulated and 626 downregulated (Figure 3A). The D-Flower vs. D-Root comparison identified 1260 differential metabolites with 666 upregulated, 594 downregulated (Figure 3B). The W-Flower vs. W-Root comparison identified 1358 differential metabolites, including 671 upregulated, 687 downregulated (Figure 3C). Among these comparison groups, 728 differential metabolites were common (Figure 3D). These differential metabolites belonged to various secondary metabolite classes, including flavonoids, terpenoids, lipids, and alkaloids, suggesting tissue-specific metabolic regulatory patterns in Paeonia lactiflora.
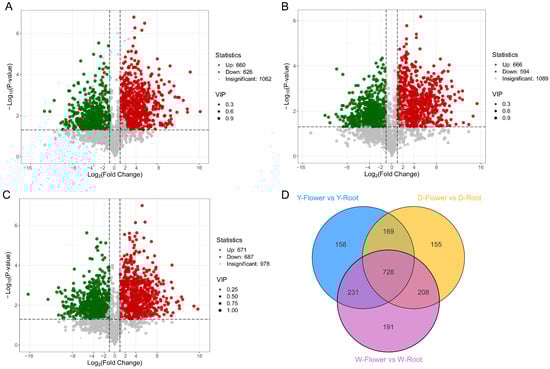
Figure 3.
Differentially accumulated metabolites (DAMs) analysis between flowers and roots of three Paeonia lactiflora varieties. Volcano plots displaying DAMs from three comparative groups: (A) Y-Flower vs. Y-Root, (B) D-Flower vs. D-Root, and (C) W-Flower vs. W-Root. Metabolites with |log2FC| ≥ 1 and VIP ≥ 1 are highlighted. (D) Venn diagram illustrates the overlap of differential metabolites across the three comparisons.
Differential metabolites were subjected to K-means clustering, dividing them into seven subsets (Figure 4). The root is the main medicinal part of Paeonia lactiflora [23]. The line plots indicate that subsets 1, 3, 4, and 6 contain metabolites with higher abundance in roots than in flowers. However, only subclass 1 contained metabolites consistently higher in roots across all three varieties.
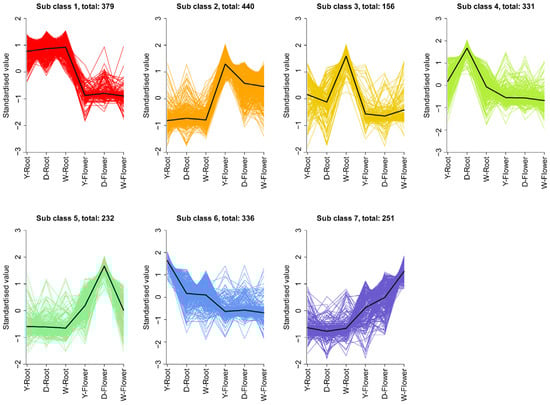
Figure 4.
K-means analysis of DAMs. All DAMs were grouped into 7 clusters. Each line represents the standardized expression trend of metabolites within a cluster across sample groups.
Monoterpene glycosides are one of the major chemical constituents of Paeonia [24]. Screening the differential metabolites for monoterpene glycosides identified 26 such compounds, most of which showed higher abundance in roots than in flowers (Table 1). Monoterpene glycosides in K-means subclass 1 included albiflorin, Paeonilactone C, 6′-O-Galloylpaeoniflorin, etc.

Table 1.
Differentially metabolized monoterpene glycosides.
3.2. Transcriptome Analysis of Paeonia lactiflora
PCA was performed on transcriptome data from flowers and roots of the three varieties. The results showed that PC1 and PC2 explained 58.02% and 13.65% of the total variance, respectively. Biological replicates within the same group clustered together, while different groups were clearly separated, indicating good data quality and transcriptional differences among groups (Figure S1). Similar to the metabolome data (Figure 2), flowers and roots were widely separated, while the same tissue from different varieties were closer, suggesting significant transcriptional differences between flower and root tissues in Paeonia lactiflora.
Transcriptome data were also divided into three comparison groups: Y-Flower vs. Y-Root, D-Flower vs. D-Root, and W-Flower vs. W-Root. Differentially Expressed Genes (DEGs) were screened using Student’s t-test (p-value ≤ 0.05) and a Fold Change (FC) ≥2 or ≤0.5 (Figure S2A–C). Across the three comparison groups, 37,158 DEGs were identified. This large number of DEGs underscores a profound transcriptomic reprogramming between floral and root tissues, reflecting their highly divergent physiological roles and metabolic demands. Among these, 10,762 DEGs were common to all three comparison groups (Figure S2D), suggesting a core set of regulatory and metabolic genes consistently involved in fundamental tissue-specific functions across different cultivars. GO functional analysis of these DEGs revealed significant enrichment in molecular functions, cellular components, and biological processes (Figure S3).
To analyze the biological pathways involved, KEGG pathway enrichment analysis (p-value ≤ 0.05) was performed, showing the top 20 pathways with the smallest p-values (Figure 5). Results indicated enrichment in pathways such as “Plant hormone signal transduction”, “Biosynthesis of secondary metabolites”, “Flavonoid biosynthesis”, and “Terpenoid backbone biosynthesis” in the flower vs. root comparisons of YanZhiDianYue (Figure 5A), DaHongPao (Figure 5B), and WuLongTanHai (Figure 5C). Notably, the significant enrichment of the “Terpenoid backbone biosynthesis” pathway is crucial, as it supplies the universal precursors for the synthesis of monoterpene glycosides, including the target compound albiflorin. This finding provides a metabolic flux basis for the potentially enhanced albiflorin biosynthetic capacity observed in root tissues.
Figure 5.
KEGG pathway enrichment analysis of DEGs. The top 20 enriched KEGG pathways (p ≤ 0.05) are shown for tissue comparisons in YanZhiDianYue (A), DaHongPao (B), and WuLongTanHai (C).
3.3. Screening for Transcriptional Regulators and Key Genes in Albiflorin Biosynthesis in Paeonia lactiflora
To further explore key genes involved in albiflorin biosynthesis, Weighted Gene Co-expression Network Analysis (WGCNA) was performed using transcriptome data from different varieties. A hierarchical clustering tree of the gene expression profiles was constructed, and all genes were clustered into 16 distinct modules (Figure 6A). By calculating the correlation between module eigengenes and the content of seven key metabolites in Paeonia lactiflora, a module-metabolite correlation heatmap was generated (Figure 6B). The results showed that genes in the turquoise module exhibited significant positive correlations with the metabolites catechin, galloylpaeoniflorin, albiflorin, and benzoylpaeoniflorin. The expression pattern of module genes also indicated a strong association with root tissue, with high expression in roots and low expression in flowers (Figure 6C). Therefore, we propose that the genes within the turquoise module are highly involved in the biosynthesis of these secondary metabolites, and subsequent candidate gene identification was primarily focused on this module.
Figure 6.
WGCNA of transcriptome data. (A) Hierarchical clustering dendrogram of genes grouped into 16 color-coded modules. (B) Module–metabolite correlation heatmap. The turquoise module shows a significant positive correlation with key monoterpene glycosides, including albiflorin. (C) Expression pattern of the turquoise module eigengene across samples.
Based on the established and conserved roles of MYB and bHLH transcription factors as master regulators of plant specialized metabolism, which often function as cooperative complexes to control the tissue-specific and inducible expression of terpenoid pathway genes [25,26], MYB and bHLH transcription factors within the turquoise module were screened. Nineteen MYB transcription factor genes were identified, among which Cluster-7982.1, Cluster-31665.0, and Cluster-25297.0 were three transcription factor genes with high expression in roots, annotated by SwissProt as MYB59, MYB44, and MYB3, respectively. One bHLH transcription factor, Cluster-41724.0, was also screened and annotated as MYC2 by SwissProt. The transcription data for these transcription factor genes are presented in Table S2.
Cytochrome P450 (CYP450) enzymes are widely present in plants and participate in the biosynthesis of secondary metabolites, such as terpenoids, sterols, and alkaloids, by catalyzing oxidation reactions that modify substrate structures [27,28]. Therefore, we sought to identify CYP450s potentially involved in the modification of albiflorin. A total of 394 CYP450s were annotated from the transcriptome data, with 50 located in the turquoise module. To further identify CYP450 enzymes potentially involved in albiflorin biosynthesis, the 50 CYP450 transcripts were aligned with S. miltiorrhiza CYP450 transcripts using ClustalW, and a phylogenetic tree was constructed using the Maximum Likelihood method (Figure 7). S. miltiorrhiza is a medicinal herb with high clinical value, like Paeonia lactiflora, its root is the main medicinal part. Tanshinones are terpenoids with significant medicinal value. Recent studies on S. miltiorrhiza CYP450s have shown that multiple SmCYP76 subfamily P450 enzymes are involved in tanshinone biosynthesis, including CYP76AK1, CYP76AK2, CYP76AK3, CYP76AH1, and CYP76AH3. In the phylogenetic tree, the Paeonia lactiflora genes closest to the SmCYP76 subfamily were Cluster-57979.0 and Cluster-15627.3 (Table S2).
Figure 7.
Phylogenetic analysis of CYP450 transcripts from Paeonia lactiflora and Salvia miltiorrhiza. A maximum likelihood tree was constructed using ClustalW-aligned CYP450 sequences from P. lactiflora and S. miltiorrhiza. Highlighted in red are S. miltiorrhiza CYP76 subfamily members known to be involved in terpenoid biosynthesis.
To verify the reliability of our transcriptome data, we performed qRT-PCR on six key candidate genes screened from the WGCNA module. The results showed that except one candidate CYP450 gene Cluster-57979.0, the expression trends of five genes Cluster-41724.0, Cluster-7982.1, Cluster-31665.0, Cluster-25297.0, and Cluster-15627.3 were highly consistent between qRT-PCR and RNA-seq analyses (Figure 8), confirming the general robustness of our transcriptomic findings.
Figure 8.
Experimental validation of candidate gene expression by qRT-PCR. Comparison of expression fold changes for six candidate genes between RNA-seq and qRT-PCR analyses. The qRT-PCR data are presented as mean ± SD of three biological replicates, showing the linear RNA-seq fold change.
4. Discussion
While numerous studies have documented the therapeutic functions of monoterpene glycosides from Paeonia, research into their biosynthetic pathways remains limited. Even within this scarce biosynthetic literature, the focus has been predominantly on paeoniflorin [12,15], leaving its structural analog albiflorin, despite its unique and significant efficacy in treating neuropsychiatric and neurodegenerative disorders [13], largely unexamined at the mechanistic level and the biosynthetic pathway. Current research on albiflorin has primarily focused on its pharmacological effects, while its biosynthetic pathway remains to be elucidated. This gap not only limits our systemic understanding of Paeonia metabolite diversification but also constrains targeted strategies to enhance albiflorin production for medicinal applications. Our study directly addresses this omission by integrating transcriptomic and metabolomic data of flower and root tissues from three Paeonia lactiflora varieties to systematically elucidate the tissue-specific accumulation of secondary metabolites in the medicinal root tissue, with a focus on the biosynthetic regulatory mechanisms of the key bioactive component albiflorin. Also, potential key regulatory transcription factors and P450 enzyme genes were screened.
Metabolomic analysis indicated that tissue specificity is the core factor driving metabolic variation. Twenty-six monoterpene glycosides were significantly enriched in Paeonia roots. Among these, albiflorin showed consistently high expression in the roots of all three varieties, with the highest content in WuLongTanHai. To decipher its regulatory and biosynthetic mechanisms, WGCNA analysis identified shown in turquoise module with a highly significant positive correlation with albiflorin content. Genes in this module exhibited tissue-specific high expression in roots. Based on the conserved regulation of terpenoid biosynthesis, we screened three highly expressed MYB transcription factors and one bHLH transcription factor (Cluster-41724.0, annotated as MYC2) from this module. MYC2 is a core component of the jasmonate signaling pathway. It is hypothesized that the formation of a MYC2-MYB complex, involving MYC2 and root-specific MYB transcription factors, coordinately initiates the albiflorin biosynthetic pathway.
The MYB transcription factor family is one of the largest in plants and plays a crucial role in regulating secondary metabolism [25,29,30]. In plants, bHLH and MYB transcription factors often form protein complexes to co-regulate secondary metabolic pathways, including the tissue-specific biosynthesis of flavonoids and terpenoids [25,26]. The functions of bHLH and MYB transcription factors in regulating terpenoid biosynthesis are relatively conserved across various plants. Jasmonic acid is one of the most critical hormonal signals initiating plant secondary metabolism [31,32,33]. Studies have shown that members of the IIIe subgroup of the bHLH family, including MYC2, MYC3, MYC4, and MYC5, are core components of the jasmonic acid signaling pathway [34]. Under jasmonate signaling, JAZ repressor proteins are degraded, releasing MYC2-type bHLH transcription factors to activate the expression of numerous secondary metabolism-related genes [35,36]. In Salvia miltiorrhiza, the SmMYC2-SmMYB36 complex can bind to and activate the promoter of SmGGPPS1, thereby promoting tanshinone biosynthesis [37]. In Curcuma wenyujin, the bHLH transcription factor CwbHLH27 is involved in jasmonate-regulated sesquiterpenoid biosynthesis [38]. Therefore, it is hypothesized that in Paeonia, bHLH and MYB transcription factors may similarly co-regulate the biosynthesis of the key bioactive component albiflorin.
Furthermore, cytochrome P450 enzymes (CYP450s) are crucial for catalyzing the late-stage modifications of terpenoid skeletons. Phylogenetic analysis with S. miltiorrhiza CYP450s revealed that Cluster-57979.0 and Cluster-15627.3 are most closely related to the SmCYP76 subfamily known to participate in terpenoid biosynthesis (Figure 7), making them strong candidate genes for the late-stage modification of albiflorin.
The high correlation between qRT-PCR and RNA-seq data for most candidate genes strongly supports the accuracy of our differential expression analysis and the subsequent screening strategy. The single inconsistency observed for the P450 gene Cluster-57979.0. This discrepancy could stem from several technical or biological factors, such as the low transcript abundance of this gene, which may affect the accuracy and statistical power of both detection platforms. Despite this outlier, the coherent validation of the core transcription factors MYC2 and MYBs and the key P450 gene Cluster-15627.3 significantly reinforces our proposed regulatory network.
5. Conclusions
Based on our integrative analyses and experimental findings, we propose a putative model (Figure 9). Transcription factor genes including MYC2, MYB3, MYB44, and MYB59 are highly expressed in the roots of Paeonia lactiflora, where they promote terpenoid biosynthesis. Concurrently, cytochrome P450 (CYP450) enzymes that accumulate in the roots facilitate the synthesis of albiflorin. In contrast, the expression patterns of these key regulators and the resulting metabolic output are reversed in flower. This lays a solid foundation for fully elucidating its biosynthetic pathway and improving medicinal quality through molecular breeding. Future work will focus on functionally validating the candidate genes and elucidating the molecular mechanisms by which key transcription factors regulate this pathway. The ultimate goal is to apply these findings to molecular breeding of Paeonia varieties, providing theoretical basis and genetic resources for enhancing the quality of Paeonia lactiflora medicinal materials.
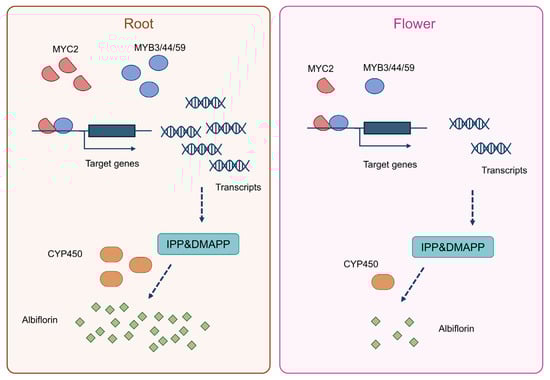
Figure 9.
A proposed model for the tissue-specific biosynthesis of albiflorin in Paeonia lactiflora.
Supplementary Materials
The following supporting information can be downloaded at: https://www.mdpi.com/article/10.3390/horticulturae12020188/s1, Figure S1: Principal component analysis (PCA) of transcriptome data from flowers and roots of three Paeonia lactiflora varieties; Figure S2: Differential gene expression analysis between flowers and roots; Figure S3: GO enrichment analysis of differentially expressed genes; Table S1: Sequences of primers used in qRT-PCR validation of candidate genes; Table S2: Infomation of candidate genes.
Author Contributions
Conceptualization, G.H., Y.Z. (Yanping Zhao) and C.P.; methodology, C.P., Y.Z. (Yuan Zhou) and G.Z.; validation, C.P. and Y.Z. (Yuan Zhou); formal analysis, C.P., X.H. and C.G.; investigation, C.P. and Y.Z. (Yuan Zhou); resources, J.Z., C.S. and G.H.; data curation, C.P. and L.L.; writing—original draft preparation, C.P.; writing—review and editing, Y.Z. (Yanping Zhao), L.L., G.H., J.Z., Y.Z. (Yuan Zhou), X.H., C.G., C.S., G.Z., Y.H., X.Z., M.L. and J.P.; visualization, C.P., L.L. and Y.Z. (Yanping Zhao); supervision, G.H.; project administration, G.H., J.Z., M.L., C.S., Y.H., X.Z. and J.P.; funding acquisition, G.H. and J.Z. All authors have read and agreed to the published version of the manuscript.
Funding
This research was funded by Science and Technology Program Project for Agricultural and Social Development of Fenghua District, Ningbo City, grant number 202502121; the National Natural Science Foundation of China, grant number 32470267.
Data Availability Statement
The original contributions presented in this study are included in the article/Supplementary Material. Further inquiries can be directed to the corresponding authors.
Conflicts of Interest
The authors declare no conflict of interest.
References
- Li, P.; Shen, J.; Wang, Z.; Liu, S.; Liu, Q.; Li, Y.; He, C.; Xiao, P. Genus Paeonia: A Comprehensive Review on Traditional Uses, Phytochemistry, Pharmacological Activities, Clinical Application, and Toxicology. J. Ethnopharmacol. 2021, 269, 113708. [Google Scholar] [CrossRef] [PubMed]
- Zhou, S.; Xu, C.; Liu, J.; Yu, Y.; Wu, P.; Cheng, T.; Hong, D. Out of the Pan-Himalaya: Evolutionary History of the Paeoniaceae Revealed by Phylogenomics. J. Syst. Evol. 2021, 59, 1170–1182. [Google Scholar] [CrossRef]
- Ma, W.; Ren, H.; Meng, X.; Liu, S.; Du, K.; Fang, S.; Chang, Y. A Review of the Ethnopharmacology, Phytochemistry, Pharmacology, Pharmacokinetics and Quality Control of Paeonia lactiflora Pall. J. Ethnopharmacol. 2024, 335, 118616. [Google Scholar] [CrossRef] [PubMed]
- He, D.-Y.; Dai, S.-M. Anti-Inflammatory and Immunomodulatory Effects of Paeonia lactiflora Pall., a Traditional Chinese Herbal Medicine. Front. Pharmacol. 2011, 2, 10. [Google Scholar] [CrossRef]
- Tan, Y.-Q.; Chen, H.-W.; Li, J.; Wu, Q.-J. Efficacy, Chemical Constituents, and Pharmacological Actions of Radix Paeoniae Rubra and Radix Paeoniae Alba. Front. Pharmacol. 2020, 11, 1054. [Google Scholar] [CrossRef]
- Xu, S.; Cao, H.; Yang, R.; Xu, R.; Zhu, X.; Ma, W.; Liu, X.; Yan, X.; Fu, P. Genus Paeonia Monoterpene Glycosides: A Systematic Review on Their Pharmacological Activities and Molecular Mechanisms. Phytomedicine 2024, 127, 155483. [Google Scholar] [CrossRef]
- Parker, S.; May, B.; Zhang, C.; Zhang, A.L.; Lu, C.; Xue, C.C. A Pharmacological Review of Bioactive Constituents of Paeonia lactiflora Pallas and Paeonia veitchii Lynch: Review of P. lactiflora Pallas and P. veitchii Lynch. Phytother. Res. 2016, 30, 1445–1473. [Google Scholar] [CrossRef]
- Jiang, H.; Li, J.; Wang, L.; Wang, S.; Nie, X.; Chen, Y.; Fu, Q.; Jiang, M.; Fu, C.; He, Y. Total Glucosides of Paeony: A Review of Its Phytochemistry, Role in Autoimmune Diseases, and Mechanisms of Action. J. Ethnopharmacol. 2020, 258, 112913. [Google Scholar] [CrossRef] [PubMed]
- Kaneda, M.; Iitaka, Y.; Shibata, S. Chemical Studies on the Oriental Plant Drugs—XXXIII. Tetrahedron 1972, 28, 4309–4317. [Google Scholar] [CrossRef]
- Zhang, L.; Wei, W. Anti-Inflammatory and Immunoregulatory Effects of Paeoniflorin and Total Glucosides of Paeony. Pharmacol. Ther. 2020, 207, 107452. [Google Scholar] [CrossRef]
- Stolyarenko, A.S.; Grishkovets, V.I.; Chirva, V.Y. A Monoterpene Glycoside of Crimean Species of Paeonia. Chem. Nat. Compd. 1999, 35, 217–218. [Google Scholar] [CrossRef]
- Yuan, Y.; Yu, J.; Jiang, C.; Li, M.; Lin, S.; Wang, X.; Huang, L. Functional Diversity of Genes for the Biosynthesis of Paeoniflorin and Its Derivatives in Paeonia. Int. J. Mol. Sci. 2013, 14, 18502–18519. [Google Scholar] [CrossRef] [PubMed]
- Sun, S.; Hamezah, H.S.; Jin, C.; Han, R.; Tong, X. Albiflorin on Neuropsychiatric and Neurodegenerative Disorders: A Systematic Review. CNS Neurosci. Ther. 2025, 31, e70535. [Google Scholar] [CrossRef]
- Wang, Y.-L.; Wang, J.-X.; Hu, X.-X.; Chen, L.; Qiu, Z.-K.; Zhao, N.; Yu, Z.-D.; Sun, S.-Z.; Xu, Y.-Y.; Guo, Y.; et al. Antidepressant-like Effects of Albiflorin Extracted from Radix Paeoniae Alba. J. Ethnopharmacol. 2016, 179, 9–15. [Google Scholar] [CrossRef]
- Zhou, Y.-X.; Gong, X.-H.; Zhang, H.; Peng, C. A Review on the Pharmacokinetics of Paeoniflorin and Its Anti-Inflammatory and Immunomodulatory Effects. Biomed. Pharmacother. 2020, 130, 110505. [Google Scholar] [CrossRef]
- Liu, P.; Chen, J.; Ma, S.; Zhang, J.; Zhou, J. Albiflorin Attenuates Mood Disorders Under Neuropathic Pain State by Suppressing the Hippocampal NLRP3 Inflammasome Activation During Chronic Constriction Injury. Int. J. Neuropsychopharmacol. 2021, 24, 64–76. [Google Scholar] [CrossRef]
- Lu, Y.; Yin, L.; Yang, W.; Wu, Z.; Niu, J. Antioxidant Effects of Paeoniflorin and Relevant Molecular Mechanisms as Related to a Variety of Diseases: A Review. Biomed. Pharmacother. 2024, 176, 116772. [Google Scholar] [CrossRef]
- Fan, B.-L.; Chen, L.-H.; Chen, L.-L.; Guo, H. Integrative Multi-Omics Approaches for Identifying and Characterizing Biological Elements in Crop Traits: Current Progress and Future Prospects. Int. J. Mol. Sci. 2025, 26, 1466. [Google Scholar] [CrossRef]
- Devi, A.; Masand, M.; Sharma, B.; Majeed, A.; Sharma, R.K. Integrated Transcriptome and Metabolome Analysis Decrypting Molecular Insights of Specialized Metabolism in Valeriana jatamansi Jones. Ind. Crops Prod. 2024, 214, 118504. [Google Scholar] [CrossRef]
- Wang, Z.-H.; Liu, X.; Cui, Y.; Wang, Y.-H.; Lv, Z.-L.; Cheng, L.; Liu, B.; Liu, H.; Liu, X.-Y.; Deyholos, M.K.; et al. Genomic, Transcriptomic, and Metabolomic Analyses Provide Insights into the Evolution and Development of a Medicinal Plant Saposhnikovia divaricata (Apiaceae). Hortic. Res. 2024, 11, uhae105. [Google Scholar] [CrossRef] [PubMed]
- Hu, J.; Li, L.; Zhao, Y.; Zhang, X.; Wang, H.; Wang, J.; Sun, P.; Jiang, L.; Wang, J.; Chen, L.; et al. OsSTK-Mediated Sakuranetin Biosynthesis and Carbon Flux Orchestrate Growth and Defence in Rice. Plant Biotechnol. J. 2025, pbi.70358. [Google Scholar] [CrossRef]
- Xu, H.; Li, M.; Ma, D.; Gao, J.; Tao, J.; Meng, J. Identification of Key Genes for Triacylglycerol Biosynthesis and Storage in Herbaceous Peony (Paeonia lactifolra Pall.) Seeds Based on Full-Length Transcriptome. BMC Genomics 2024, 25, 601. [Google Scholar] [CrossRef] [PubMed]
- Zhao, D.-D.; Jiang, L.-L.; Li, H.-Y.; Yan, P.-F.; Zhang, Y.-L. Chemical Components and Pharmacological Activities of Terpene Natural Products from the Genus Paeonia. Molecules 2016, 21, 1362. [Google Scholar] [CrossRef]
- Feng, Y.; Jiang, S.; Yu, H.; Long, X. Monoterpenoid Glycosides from Paeonia lactiflora Pall. And Their Chemotaxonomic Significance. Biochem. Syst. Ecol. 2022, 105, 104540. [Google Scholar] [CrossRef]
- Bhatt, P.A.; Gurav, T.P.; Kondhare, K.R.; Giri, A.P. MYB Proteins: Versatile Regulators of Plant Development, Stress Responses, and Secondary Metabolite Biosynthetic Pathways. Int. J. Biol. Macromol. 2025, 288, 138588. [Google Scholar] [CrossRef] [PubMed]
- Bulanov, A.N.; Andreeva, E.A.; Tsvetkova, N.V.; Zykin, P.A. Regulation of Flavonoid Biosynthesis by the MYB-bHLH-WDR (MBW) Complex in Plants and Its Specific Features in Cereals. Int. J. Mol. Sci. 2025, 26, 734. [Google Scholar] [CrossRef]
- Bolwell, G.P.; Bozak, K.; Zimmerlin, A. Plant Cytochrome P450. Phytochemistry 1994, 37, 1491–1506. [Google Scholar] [CrossRef] [PubMed]
- Distéfano, A.M.; Setzes, N.; Cascallares, M.; Fiol, D.F.; Zabaleta, E.; Pagnussat, G.C. Roles of Cytochromes P450 in Plant Reproductive Development. Int. J. Dev. Biol. 2021, 65, 187–194. [Google Scholar] [CrossRef]
- Chen, L.; Cheng, Y.; Hong, G. Molecular Insights into the Regulation of Flavonoid Biosynthesis in Fruits. Hortic. Res. 2025, uhaf306. [Google Scholar] [CrossRef]
- Cao, Y.; Li, K.; Li, Y.; Zhao, X.; Wang, L. MYB Transcription Factors as Regulators of Secondary Metabolism in Plants. Biology 2020, 9, 61. [Google Scholar] [CrossRef]
- Kumar, A.; Partap, M.; Warghat, A.R. Jasmonic Acid: A Versatile Phytohormone Regulating Growth, Physiology, and Biochemical Responses. J. Plant Growth Regul. 2025, 44, 131–154. [Google Scholar] [CrossRef]
- Luo, C.; Qiu, J.; Zhang, Y.; Li, M.; Liu, P. jasmonates Coordinate Secondary with Primary Metabolism. Metabolites 2023, 13, 1008. [Google Scholar] [CrossRef]
- Li, L.; Zhang, X.; Li, D.; Su, H.; He, Y.; Xu, Z.; Zhao, Y.; Hong, Y.; Li, Q.; Xu, P.; et al. CsPHRs-CsJAZ3 Incorporates Phosphate Signaling and Jasmonate Pathway to Regulate Catechin Biosynthesis in Camellia sinensis. Hortic. Res. 2024, 11, uhae178. [Google Scholar] [CrossRef] [PubMed]
- Heim, M.A. The Basic Helix-Loop-Helix Transcription Factor Family in Plants: A Genome-Wide Study of Protein Structure and Functional Diversity. Mol. Biol. Evol. 2003, 20, 735–747. [Google Scholar] [CrossRef]
- Chini, A.; Fonseca, S.; Fernández, G.; Adie, B.; Chico, J.M.; Lorenzo, O.; García-Casado, G.; López-Vidriero, I.; Lozano, F.M.; Ponce, M.R.; et al. The JAZ Family of Repressors Is the Missing Link in Jasmonate Signalling. Nature 2007, 448, 666–671. [Google Scholar] [CrossRef] [PubMed]
- Fernández-Calvo, P.; Chini, A.; Fernández-Barbero, G.; Chico, J.-M.; Gimenez-Ibanez, S.; Geerinck, J.; Eeckhout, D.; Schweizer, F.; Godoy, M.; Franco-Zorrilla, J.M.; et al. The Arabidopsis bHLH Transcription Factors MYC3 and MYC4 Are Targets of JAZ Repressors and Act Additively with MYC2 in the Activation of Jasmonate Responses. Plant Cell 2011, 23, 701–715. [Google Scholar] [CrossRef] [PubMed]
- Cao, R.; Lv, B.; Shao, S.; Zhao, Y.; Yang, M.; Zuo, A.; Wei, J.; Dong, J.; Ma, P. The SmMYC2–SmMYB36 Complex Is Involved in Methyl Jasmonate-mediated Tanshinones Biosynthesis in Salvia miltiorrhiza. Plant J. 2024, 119, 746–761. [Google Scholar] [CrossRef]
- Wu, S.; Lan, K.; Wang, Q.; Su, Y.; Li, D.; Ma, J.; Hu, T.; Yin, X.; Wei, Q. Comprehensive Characterization of the bHLH Transcription Factor Family in Curcuma Wenyujin and Functional Elucidation of CwbHLH27 in Jasmonate-Regulated Sesquiterpenoid Biosynthesis. Plant Physiol. Biochem. 2025, 220, 109527. [Google Scholar] [CrossRef]


Disclaimer/Publisher’s Note: The statements, opinions and data contained in all publications are solely those of the individual author(s) and contributor(s) and not of MDPI and/or the editor(s). MDPI and/or the editor(s) disclaim responsibility for any injury to people or property resulting from any ideas, methods, instructions or products referred to in the content. |
© 2026 by the authors. Licensee MDPI, Basel, Switzerland. This article is an open access article distributed under the terms and conditions of the Creative Commons Attribution (CC BY) license.