Abstract
Melicope pteleifolia (Rutaceae) is a shrub or tree with high medicinal value. Although the physical features of M. pteleifolia are evident, the mitochondrial (mt) genome has yet to be investigated, and its evolutionary relationship within Rutaceae is unclear. The organelle genomes of M. pteleifolia were constructed using Nanopore and Illumina sequencing data. The circular mt genome is 780,107 base pairs (bp) long, with a GC content of 44.85%. It has 66 genes, consisting of 33 protein-coding genes (PCGs), 30 tRNA genes, and 3 rRNA genes. The length of the chloroplast (cp) genome was 158,987 bp, containing 88 PCGs, 37 tRNAs, and 8 rRNAs. The mtDNA and cpDNA contained 507 and 353 repetitive sequences, respectively. RNA editing sites were abundant in M. pteleifolia organelle genomes, including 323 sites in mtDNA and 260 sites in cpDNA. Phylogenetic research using the cp and mt genomes of M. pteleifolia and nine additional species of the Rutaceae family precisely delineates its evolutionary and taxonomic position. Ka/Ks and nucleotide diversity indicated that the majority of the PCGs in the mitochondrial genome had experienced negative selection. These findings provided comprehensive information on the M. pteleifolia mitogenome for studying phylogenetic relationships in Rutaceae, with chloroplast-derived sequences providing critical evidence for inter-organellar genome evolution.
1. Introduction
The genus Melicope (Rutaceae) has roughly 150 species, mostly found in Oceania and tropical regions of Asia. Melicope pteleifolia often thrives in mountainous, hilly, or flat terrains. It is highly esteemed for its anti-inflammatory and analgesic characteristics, which render it a widely used treatment for ailments such as fever, rheumatism, and other inflammatory diseases [1]. Commonly, the leaves and stems of M. pteleifolia are utilized in decoctions and treatments to alleviate pain and inhibit swelling [2]. Recent studies have confirmed the presence of flavonoids, alkaloids, and phenolic compounds in the plant, which enhance its antioxidant characteristics [3]. These chemicals exhibit high efficacy in the mechanism of free radical scavenging, thus safeguarding cells from oxidative harm and mitigating the susceptibility to chronic ailments, including cancer and cardiovascular disorders [4]. Moreover, M. pteleifolia has shown antibacterial properties, as evidenced by extracts that have shown effectiveness against various bacterial and fungal contaminants [5]. Furthermore, the hepatoprotective properties of M. pteleifolia have been investigated, with research results suggesting its capacity to shield liver cells from harm caused by toxins and oxidative stress [6]. The medicinal value of the plant is compounded by its comparatively low toxicity, therefore ensuring its safety for usage in both traditional and possibly contemporary therapeutic applications [1]. Given the valuable therapeutic properties of M. pteleifolia, it is important to comprehend the genetic structure of its characteristics for possible medical applications.
According to morphological features, M. pteleifolia is a shrub or tree that stands between 1 and 14 m tall. It is seldom scandent, dioecious, or monoclinous. Each young branchlet is 2.5–4 mm in width at the third internode. The foliage is typically three-foliolate and sometimes one-foliolate, with a petiole of 1.5–14 cm with a glabrous to pubescent appearance. Leaflet blades are typically ovate-elliptic, elliptic, or elliptic-obovate, with terminal domains ranging from 6 to 22 × 2 to 8 cm. The blades often exhibit a glabrous or puberulent appearance, particularly on the abaxial, apex acuminate, or midvein sides. Flowering occurs between April and June, while fruits occur between July and October [7]. While the physical features of M. pteleifolia are evident, the species belonging to the Rutaceae Family exhibit comparable morphological characteristics, therefore complicating the process of differentiation and comprehending their evolutionary relationships.
Plants have three distinct genomes: the nuclear genome, the chloroplast genome (cpDNA), and the mitochondrial genome (mtDNA), with cpDNA and mtDNA classified as organelle genomes. In contrast to the nuclear genome, the genomes of plant organelles show a high degree of conservation, undergo rapid evolution, and are characterized by maternal inheritance. These traits render them exceptional instruments for tracking origins, comprehending phylogeny, and exploring molecular ecology [8,9]. As of 3 September 2024, the nuclear genomes of merely 26 species within the Rutaceae family have been documented. This includes 18 genera of Citrus, 2 genera of Zanthoxylum, and 1 genus each from Aegle, Atalantia, Citropsis, Claosena, Luvunga, and Murraya (https://www.plabipd.de/plant_genomes_pa.ep, accessed on 20 December 2024). The NCBI database contains more than 30 complete cpDNAs from plants in the Rutaceae family, while only 10 mtDNAs have been published to date. Though the complete cp genome of M. pteleifolia has been published [10,11], the complete mtDNA of M. pteleifolia has yet to be reported.
This study involved the assembly and annotation of the complete chloroplast and the first mitochondrial genomes of M. pteleifolia. We hypothesize that (1) the mitogenome of M. pteleifolia exhibits unique structural features distinguishing it from related Rutaceae species, and (2) inter-organellar gene transfers between chloroplast and mitochondrial genomes have contributed to its evolutionary adaptation. We analyzed gene count, codon usage, RNA editing sites, repeat sequences, genome rearrangements, and gene transfers between cp and mt genomes. The nucleotide diversity and Ka/Ks analyses of plant mitochondrial genomes enhances our comprehension of mitochondrial DNA variation and evolutionary processes within the Rutaceae family. This study delivers significant genetic insights into the M. pteleifolia mitogenome, presenting essential resources for the cultivation and application of this medicinal species. Furthermore, it establishes a foundation for additional investigations into classification, population genetics, and the evolutionary aspects of M. pteleifolia.
2. Materials and Methods
2.1. Plant Materials and DNA Extraction
The fresh leaves of three-year-old M. pteleifolia were collected from the national Eugenic sasanqua base of Forestry Science Research Institute (108°36′ E, 22°92′ N), Guangxi, Nanning, China. The plant was cultivated under standardized management practices. Total DNA was extracted using an universal plant DNA extraction kit (Genepioneer Biotech, Nanjing, China) [12]. The purity, concentration, and integrity of the DNA were assessed using a NanoDrop spectrophotometer (Thermo Fisher Scientific, Wilmington, DE, United States) and agarose gel electrophoresis. The total genomic DNA was sequenced directly without organelle-specific enrichment, with the subsequent bioinformatic separation of mitochondrial and chloroplast genomes based on their characteristic read depth distributions (mitochondrial 10–100×, chloroplast 100–1000×) and conserved mitochondrial gene features.
2.2. Genomic Sequencing
For Illumina sequencing, 200 ng of total DNA in a 50 μL volume was fragmented by ultrasonication. The fragmented DNA underwent purification, end-repair, the insertion of A-tails to the 3′ ends, and the ligation of sequencing adapters. Paired-end 150 bp reads (PE150) were produced with an average insert size of 350 bp. Thereafter, agarose gel electrophoresis was used to isolate fragments of the requisite size, followed by PCR amplification to create the sequencing library. The assembled library underwent quality assessment, and those libraries that met the quality standards were sequenced using the Illumina NovaSeq 6000 platform (Illumina, San Diego, CA, USA). The raw data underwent processing with fastp software (version 0.23.4, https://github.com/OpenGene/fastp, accessed on 15 November 2024) under the parameters -c -q 20 -u 10 -n 5 -l 150, which included trimming sequencing adapters and primer sequences, alongside filtering out reads with an average quality score of below Q5 and those containing more than five Ns, thereby yielding clean data.
For Nanopore sequencing, 2 μg of total DNA was subjected to random fragmentation. The substantial DNA fragments were further concentrated and purified using magnetic beads, followed by gel extraction for recovery. The fragmented DNA was then exposed to damage repair. Following purification, end-repair and A-tailing were executed on both termini of the DNA fragments. The ligation reaction was conducted with adapters from the SQK-LSK109 ligation kit (Oxford Nanopore Technologies, Cambridge, UK). The libraries were prepared using 0.4× bead-based purification that partially removed fragments below 2 kb, with no additional size selection steps applied, yielding an average read length of 7162 bp. After the library was created, a designated concentration and volume of the DNA library were introduced into a flow cell, which was then placed into the PromethION sequencer (Oxford Nanopore Technologies, Cambridge, UK) for real-time single-molecule sequencing. The third-generation sequencing data were processed using Filtlong software (v0.2.1, https://link.zhihu.com/?target=https%3A//github.com/rrwick/Filtlong, accessed on 17 November 2024) with parameters: min_length 1000, min_mean_q 7.
2.3. Genomic Assembly
The raw third-generation sequencing data were aligned to reference gene sequences (https://github.com/xul962464/plant_mt_ref_gene, accessed on 17 November 2024) with the third-generation alignment program minimap2 (v2.1) [13]. The acquired third-generation data were rectified using the third-generation assembly program Canu (v1.9) [14]. The second-generation data were aligned to the corrected sequences using bowtie2 (v2.3.5.1). Subsequently, Unicycler (v0.4.8) was used using default settings to combine the aligned second-generation data and the rectified third-generation data. The assembly outcomes were viewed and manually refined using Bandage (v0.8.1). The refined third-generation sequencing data were subsequently aligned to the contigs acquired in the second phase of the Unicycler using minimap2, facilitating the manual identification of branching orientations and yielding the final assembly outcomes.
The chloroplast genome was analyzed by aligning second-generation data to a self-constructed chloroplast genome database utilizing bowtie2 v2.2.4 (http://bowtie-bio.sourceforge.net/bowtie2/index.shtml, accessed on 19 November 2024) in very-sensitive-local mode. The aligned sequencing reads were designated as the chloroplast genome sequencing data (cpDNA sequences) for the project samples. GetOrganelle v1.7.7.1 (https://github.com/Kinggerm/GetOrganelle, accessed on 19 November 2024) was employed to assemble the chloroplast genome.
2.4. Genome Annotation
Protein-coding genes and rRNA were annotated by BLAST alignment with published plant mitochondrial sequences serving as references, further refined by hand corrections informed by closely related species. tRNA genes were annotated using tRNAscan-SE [15]. Open reading frames exceeding 300 base pairs were annotated by aligning them with the non-redundant (nr) database. Following the evaluation and manual rectification of the acquired results, the definitive annotations were generated.
Two annotation methodologies were utilized to enhance the precision of the chloroplast genome. The initial method employed Prodigal v2.6.3 (https://www.github.com/hyattpd/Prodigal, accessed on 21 November 2024) for annotating chloroplast coding sequences (CDS), HMMER v3.1b2 (http://www.hmmer.org/, accessed on 21 November 2024) for rRNA prediction, and ARAGORN v1.2.38 (http://www.ansikte.se/ARAGORN/, accessed on 21 November 2024) for tRNA prediction. The subsequent method involved extracting gene sequences from closely related species available in NCBI and conducting BLAST v2.6 (https://blast.ncbi.nlm.nih.gov/Blast.cgi, accessed on 21 November 2024) alignments with the assembled sequences to generate a secondary set of annotations. Discrepancies between the two annotation outcomes were manually scrutinized, erroneous and redundant annotations were eliminated, and exon boundaries were refined to yield the final annotation. The organelle genome map was generated using OGDRAW (https://chlorobox.mpimp-golm.mpg.de/OGDraw.html, accessed on 23 November 2024).
2.5. Analyses of RNA Editing Site, RSCU, and Homologous Sequence
RNA editing sites of organelle genomes were predicted using PmtREP (http://cloud.genepioneer.com:9929/#/tool/alltool/detail/336, accessed on 28 November 2024). Mega software (v7.0) [16] was used to perform a codon preference analysis on the protein-coding genes of the organelle genomes and to compute RSCU values. A homologous sequence analysis of the organelle genomes was performed using BLAST, using an E-value cutoff of 1 × 10⁻⁵ and default settings. The results were present using Circos v0.69-5.
2.6. Repeat Analysis
Repeats were detected using vmatch v2.3.0 software (http://www.vmatch.de/, accessed on 2 December 2024) in conjunction with a bespoke Perl script. The parameters were established as follows: Minimum length = 30 bp, Hamming distance = 3. A MISA v1.0 (MIcroSAtellite identification tool, https://webblast.ipk-gatersleben.de/misa/, accessed on 2 December 2024) was used for the SSR analysis with the specified parameters: 1–8 (mononucleotide repeats happening eight or more times), 2–5 (dinucleotide repeats occurring five or more times), 3–3 (trinucleotide repeats occurring three or more times), 4–3, 5–3, and 6–3. Tandem repetitions were detected using the TRF program (trf409.linux64) with the following parameters: 2 7 7 80 10 50 2000 -f -d -m. Dispersed repetitions were detected using BLASTn (v2.10.1) with the parameters -word_size 7, evalue 1 × 10⁻⁵, thereby eliminating redundant repeats. The detected repetitions were viewed with Circos v0.69-5.
2.7. Pi and Ka/Ks
Homologous gene sequences from M. pteleifolia and nine closely related species were globally aligned using the MAFFT program in auto mode. The Pi value for each gene was determined utilizing DnaSP5 (http://www.ub.edu/dnasp/, accessed on 5 December 2024). The Ka/Ks values of genes were computed using KaKs_Calculator v2.0 (https://sourceforge.net/projects/kakscalculator2/, accessed on 5 December 2024).
2.8. Phylogenetic Analysis
For comprehensive whole-genome phylogenetic analysis, circular sequences were aligned to a uniform starting point. Multiple sequence alignments across species were conducted using MAFFT v7.427 in automatic mode. The aligned data were further reduced via trimAl v1.4.rev15. A maximum likelihood (ML) phylogenetic tree was generated using RAxML v8.2.10 (https://cme.h-its.org/exelixis/software.html, accessed on 8 December 2024), employing the GTRGAMMA model. A quick bootstrap analysis was performed with 1000 bootstrap replicates. The results were presented with ITOL software (v6).
3. Results
3.1. Organelle Genome Assembly and Annotation
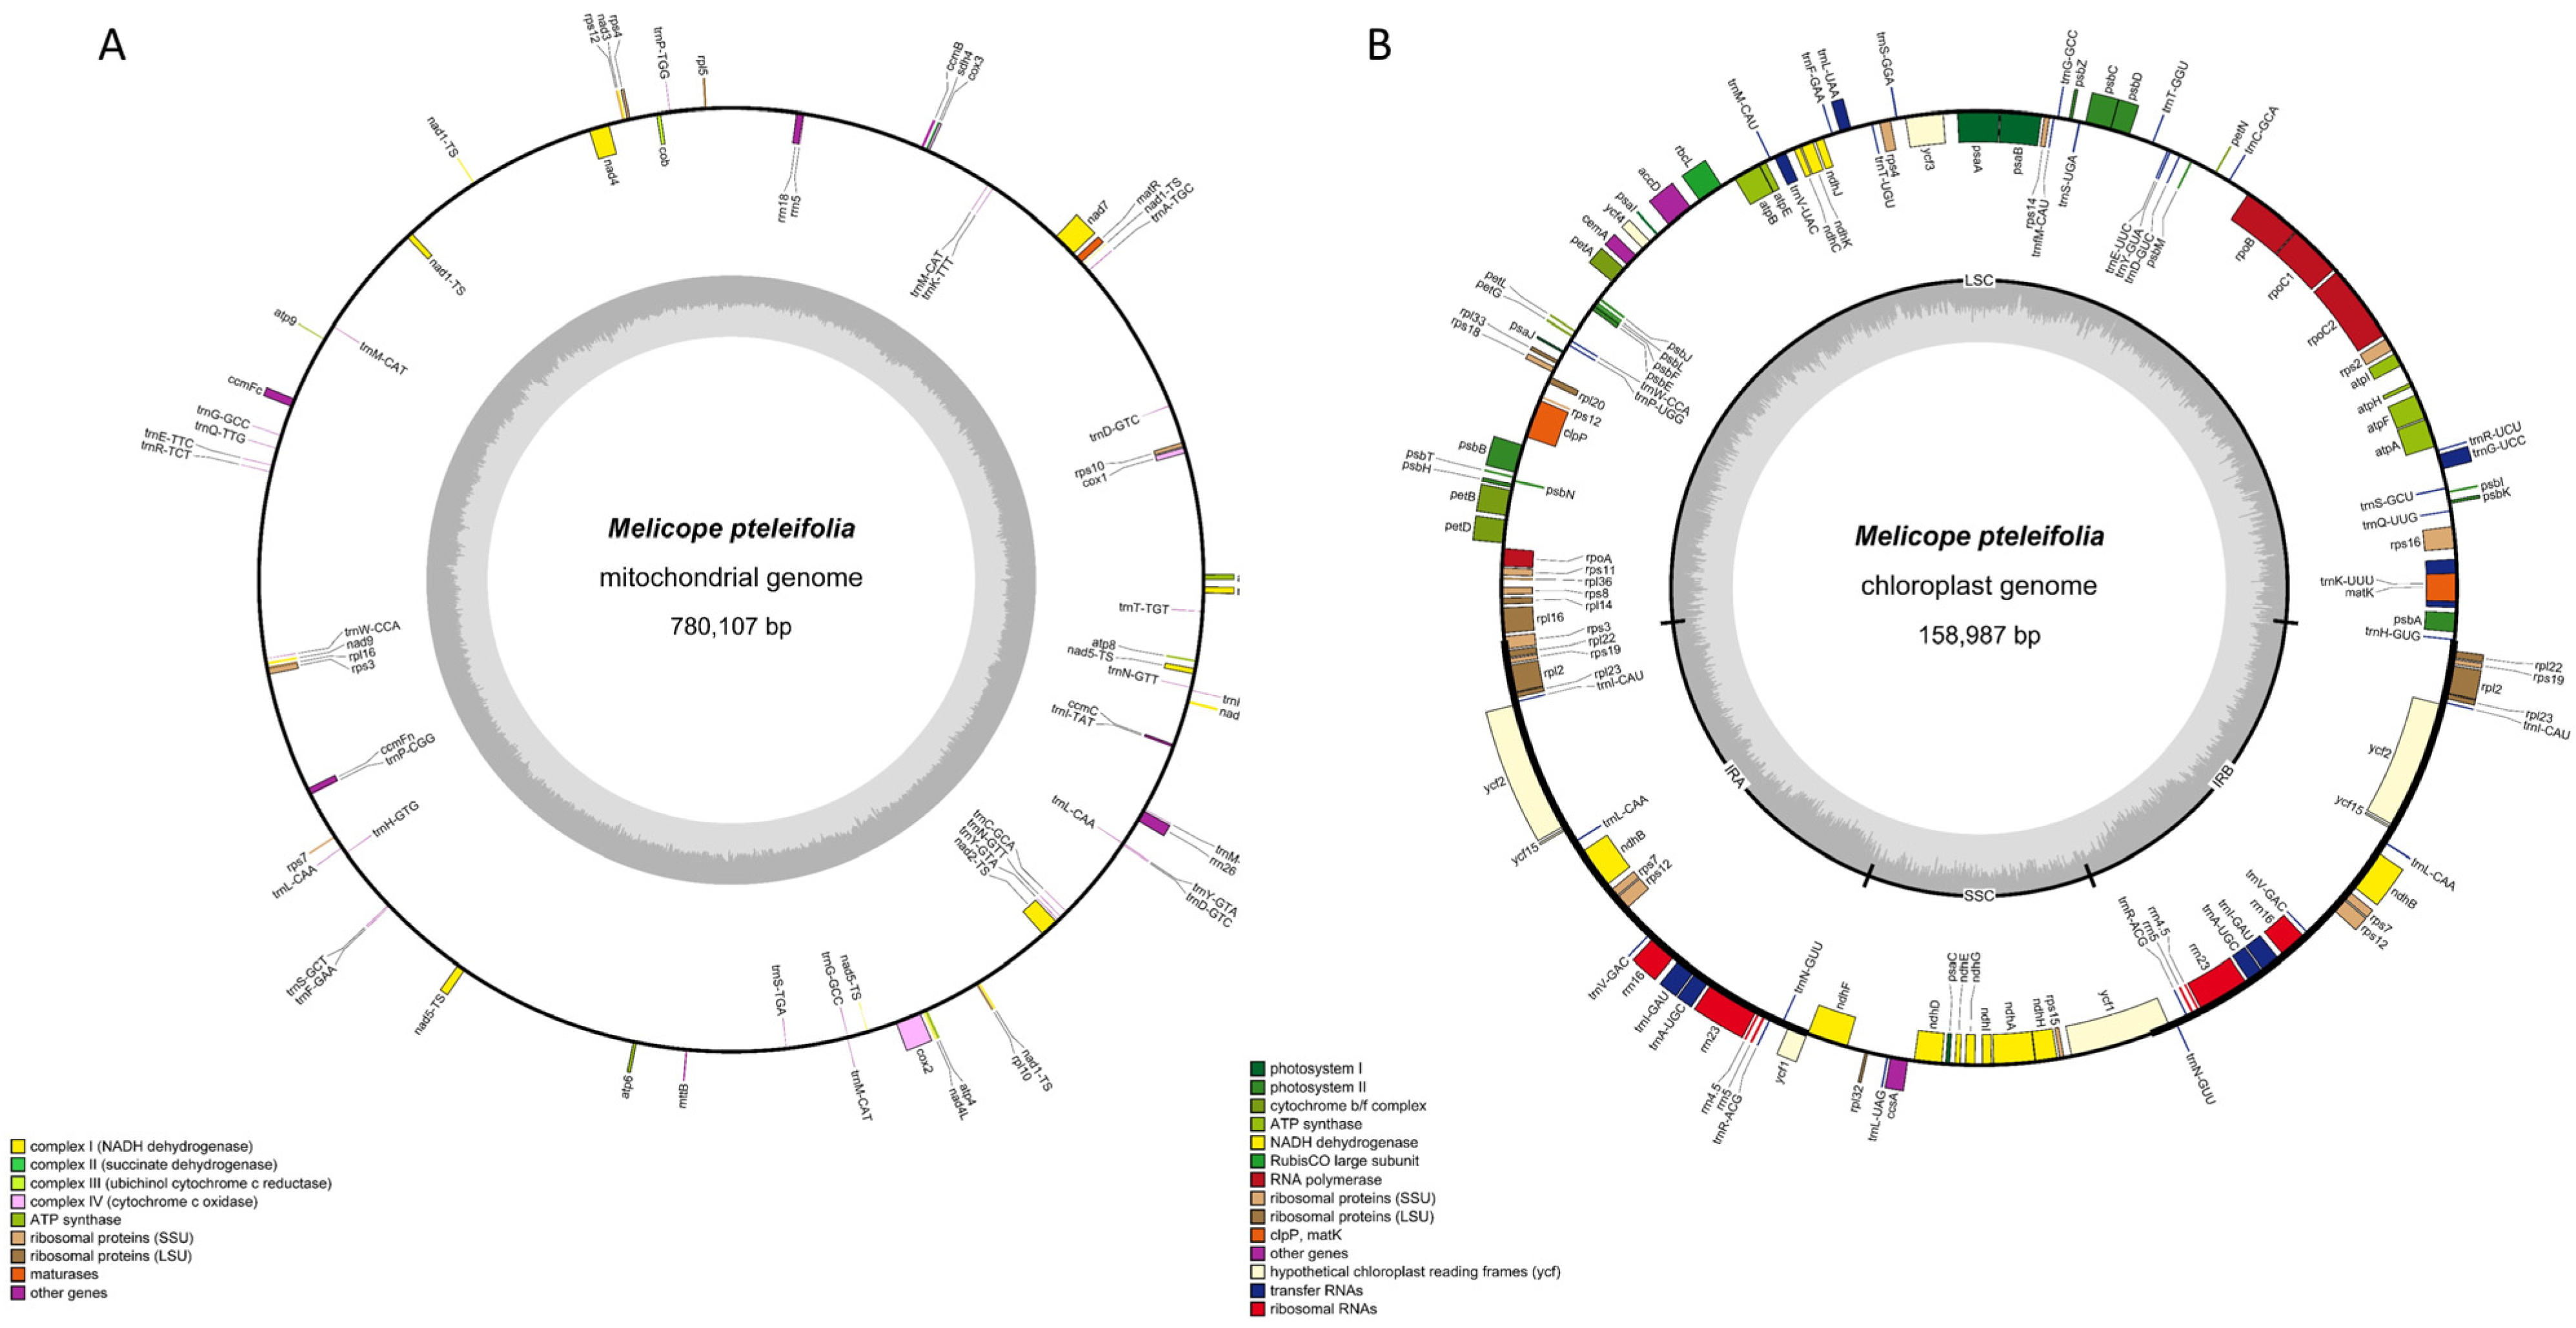
Illumina sequencing generated 75,855,457 raw reads, with 75,581,756 clean reads retained after quality filtering. Nanopore sequencing produced 2,894,999 raw reads, with 2,730,477 long reads passing quality thresholds. Using both Nanopore and Illumina sequencing data, we assembled the cpDNA and mtDNA of M. pteleifolia without a reference. The mitogenome of M. pteleifolia (PQ221923) formed a circular molecule of 780,107 bp (Figure 1A). The nucleotide composition was as follows: A, 27.62%; T, 27.53%; C, 22.39%; G, 22.45%. This resulted in a total GC content of 44.85%. The mitochondrial genome contained 33 protein-coding genes (PCGs), 30 tRNAs, and 3 rRNA genes, which included one pseudogene (rps14) (Table S1).

Figure 1.
The circular maps of the organelle genomes of M. pteleifolia. (A), the circular map of the mitogenome. (B), the circular map of the cp genome. The genomic features transcribed clockwise and counter-clockwise are drawn on the inside and outside of the circle, respectively. The genes are color-coded based on their functional groups. The GC content is represented on the inner circle by the dark gray plot.
The cp genome (PQ221922) was 158,987 bp, featuring a typical quadripartite structure with a large single-copy (LSC) region of 85,098 bp, a small single-copy (SSC) region of 18,609 bp, and two inverted repeats (IRs) of 27,640 bp (Figure 1B). The GC contents of the IR, LSC, and SSC regions were 42.79%, 36.63%, and 32.81%, respectively. The genome of chloroplast contained 134 unigenes, comprising 88 PCGs, 37 tRNAs, and 8 rRNA genes, including one pseudogene (ycf1) (Table S2).
The mtDNA and cpDNA coding sequences measured 36,998 bp and 91,503 bp, representing 4.74% and 57.55% of their respective genomes. Non-coding regions constituted 95.26% of mtDNA and 42.45% of cpDNA (Table S2). In M. pteleifolia organellar genomes, 30 genes had introns: 23 genes with one intron; nad4, clpP, and ycf3 with two; and nad1, nad2, nad5, and nad7 with four.
3.2. Organelle Genome Repeat Sequences
Repeat sequences are essential for preserving the complex structure of the genome, facilitating evolution, generating variants, and modulating gene expression [17,18]. Thus, the tandem repeats, dispersed repeats, and simple sequence repeats (SSRs) within the organelle genomes of M. pteleifolia were analyzed (Figure 2A,B). In the mt genome, a total of 61 tandem repeats were identified, with lengths ranging from 8 to 59 bp and a similarity over 80% for each unit (except two 78%). A total of 38 tandem repeats were identified in the cp genome, with lengths varying from 10 to 25 bp and a similarity percentage above 88% (except two 72%) (Figure 2C and Table S3).
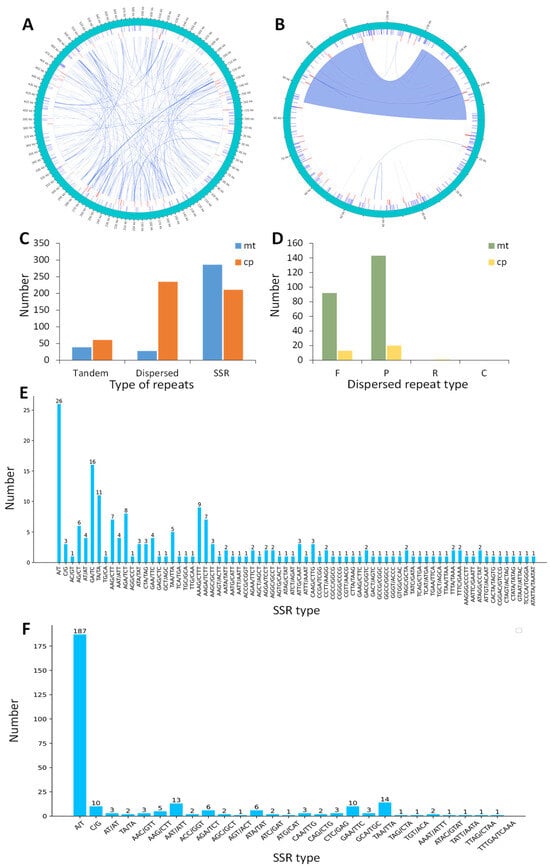
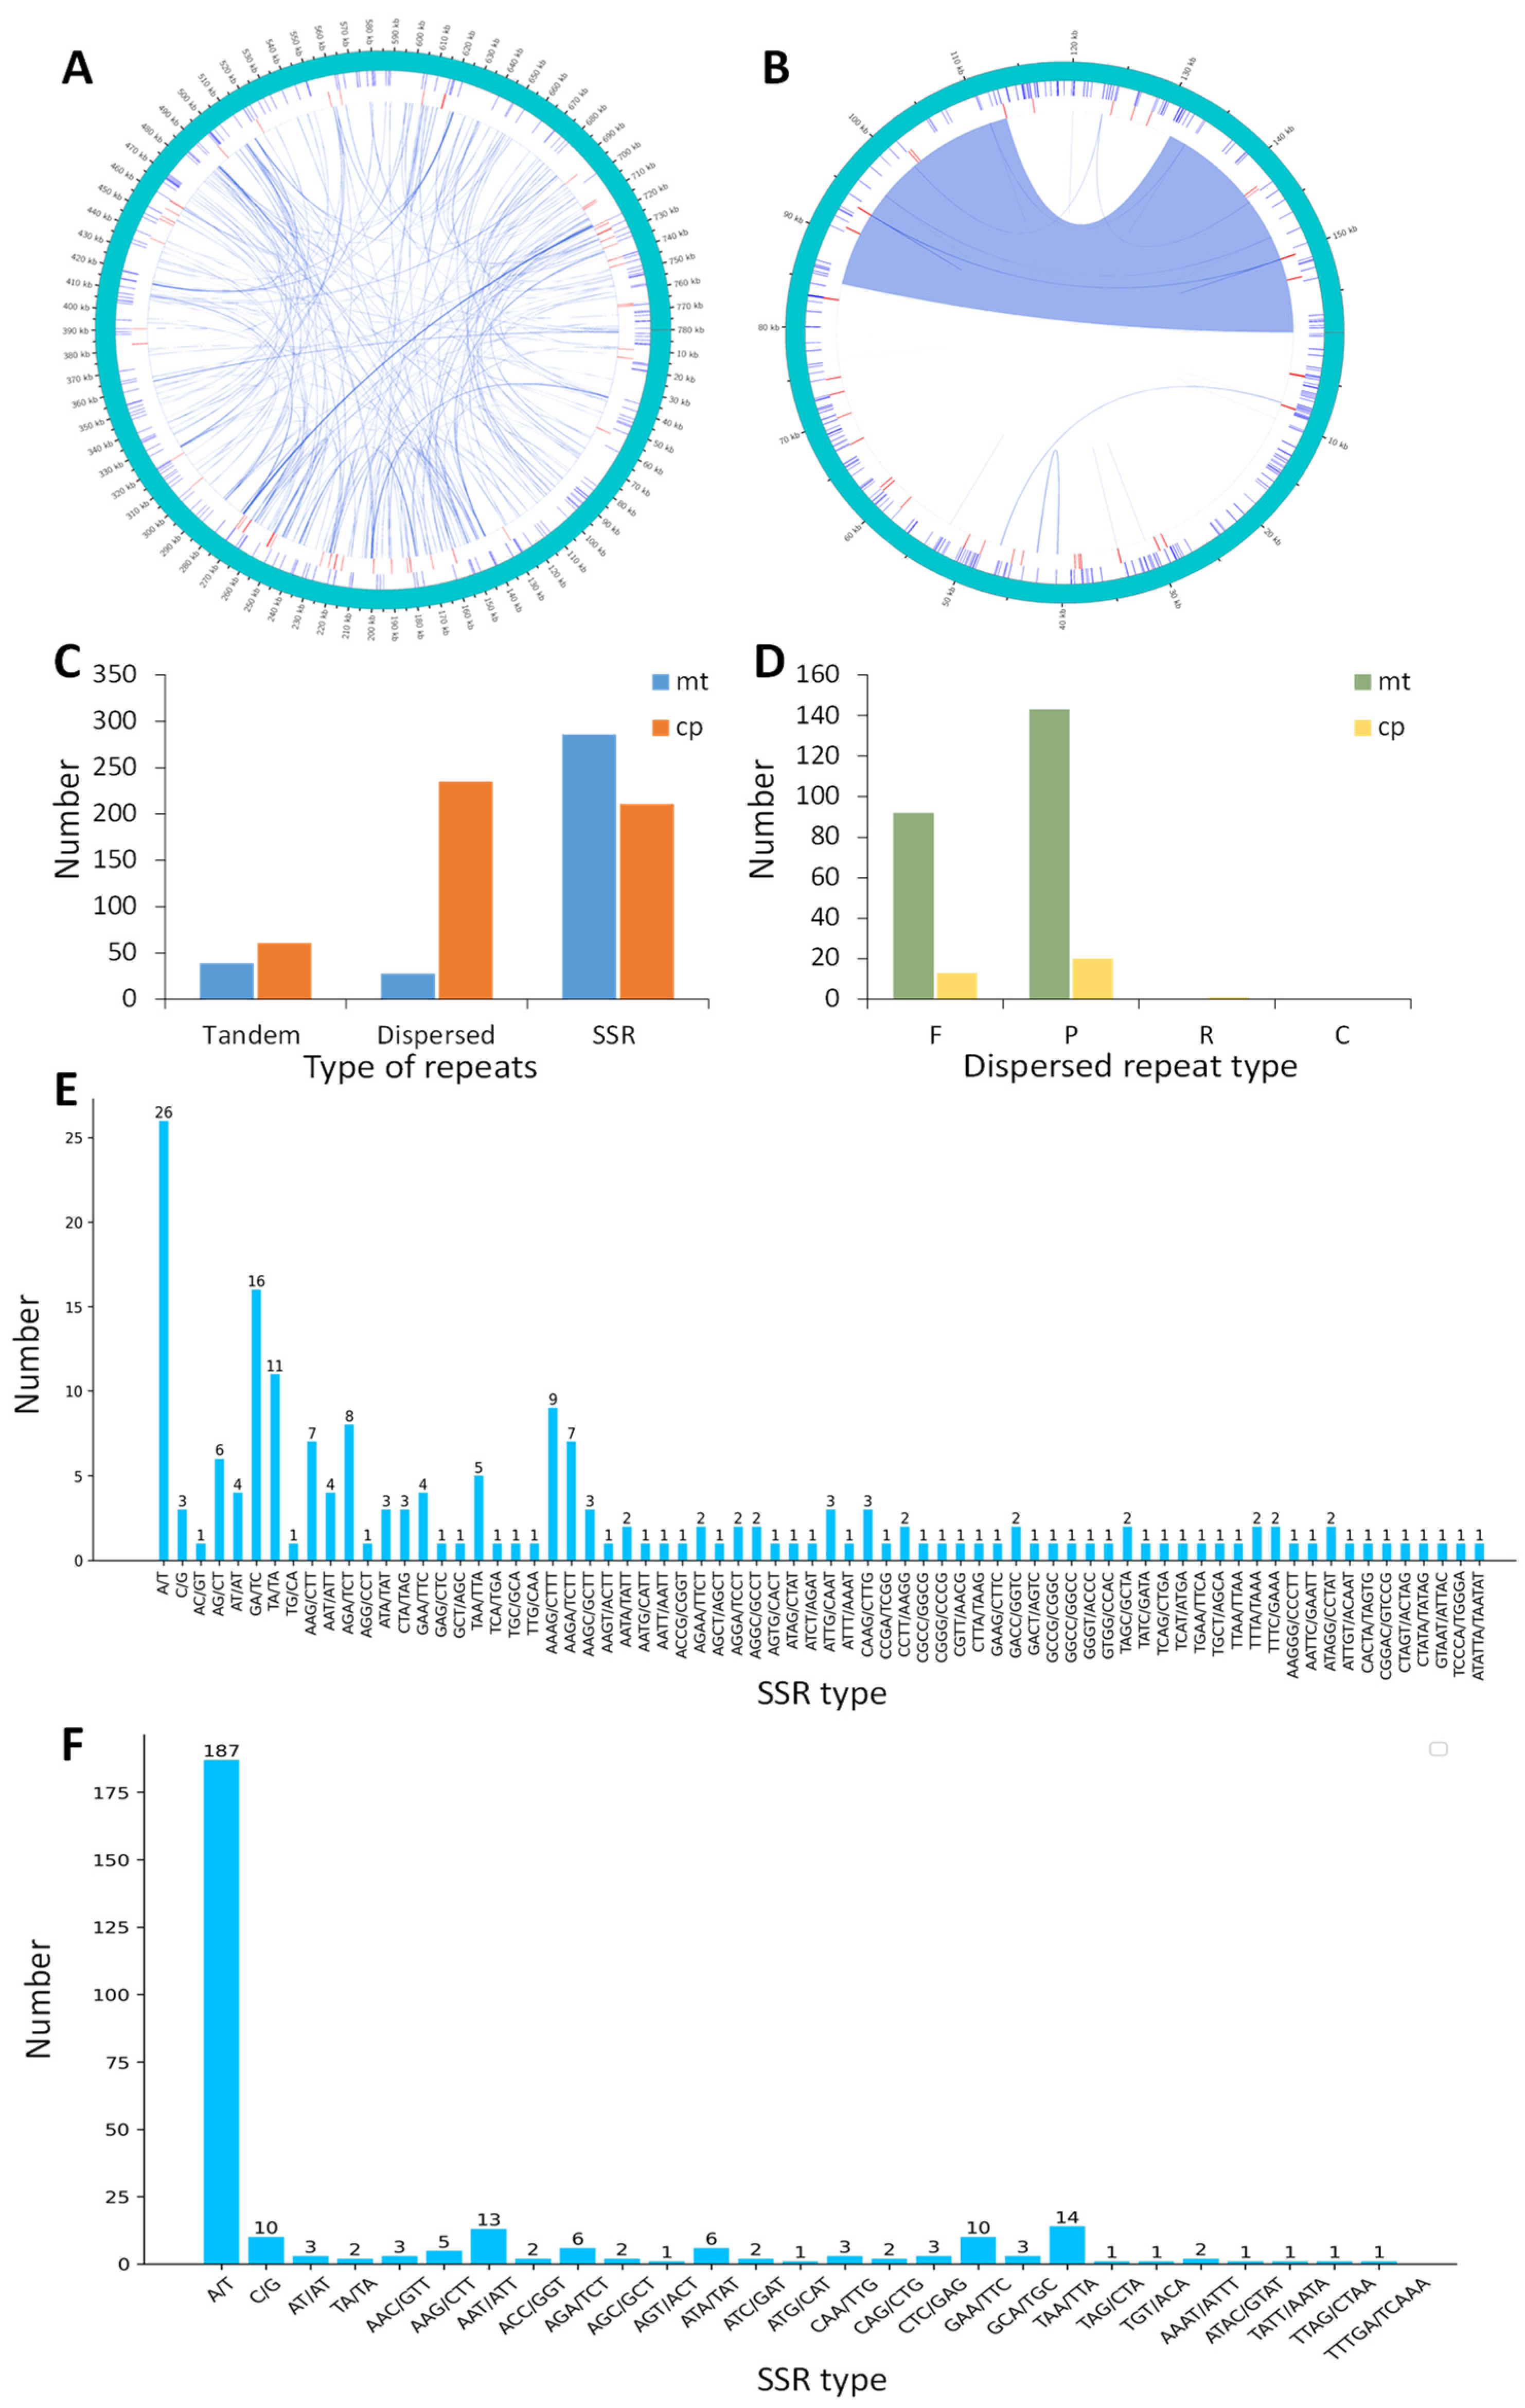
Figure 2.
The repetitive sequence of the organelle genome in M. pteleifolia. The short lines in the outer, middle, and inner circles represent the positions of SSRs, tandem repeats, and dispersed repeats in the mt genome (A) and cp genome (B), respectively. (C), the types and quantities of repetitive sequence. (D), the types and quantities of dispersed repeats. (E), the types and quantities of SSRs in the mt genome. (F), the types and quantities of SSRs in the cp genome.
The cpDNA contained 34 dispersed repeats, which included 13 forward, 20 palindromic, and 1 reverse repeats. For mtDNA, there were 235 dispersed repeats, including 92 forward and 143 palindromic repeats. Notably, cpDNA was devoid of complementary repeats, while mtDNA lacked both complementary and reverse repeats (Figure 2D, Table S4). The dispersed repeats in mtDNA and cpDNA varied in length from 30 to 1067 bp and from 30 to 27,640, respectively. The total lengths of the dispersed repeat sequences in mtDNA and cpDNA were 29,018 and 21,431 bp, respectively, representing 3.72% and 13.48% of the respective genomes.
SSRs consist of short DNA fragments made up of repeating sequence units. In this study, we detected 211 and 286 SSRs in mtDNA and cpDNA, respectively (Figure 2E,F). The monomeric and dimeric forms of SSRs constituted just 42.65% of mtDNA, while they accounted for 68.89% of cpDNA (Table S5). Among the monomer SSRs, A/T repeats constituted 94.12% and 94.92% of mtDNA and cpDNA, respectively. In the case of dimeric forms, CG/GC combinations were absent from both mtDNA and cpDNA. In mtDNA, eleven pentameric SSRs and one hexameric SSR were identified, while only one pentameric SSR was detected in cpDNA. Such abundant repeated sequences offered valuable information on identifying molecular markers to study the genetic diversity of M. pteleifolia.
3.3. Gene Codon Preference
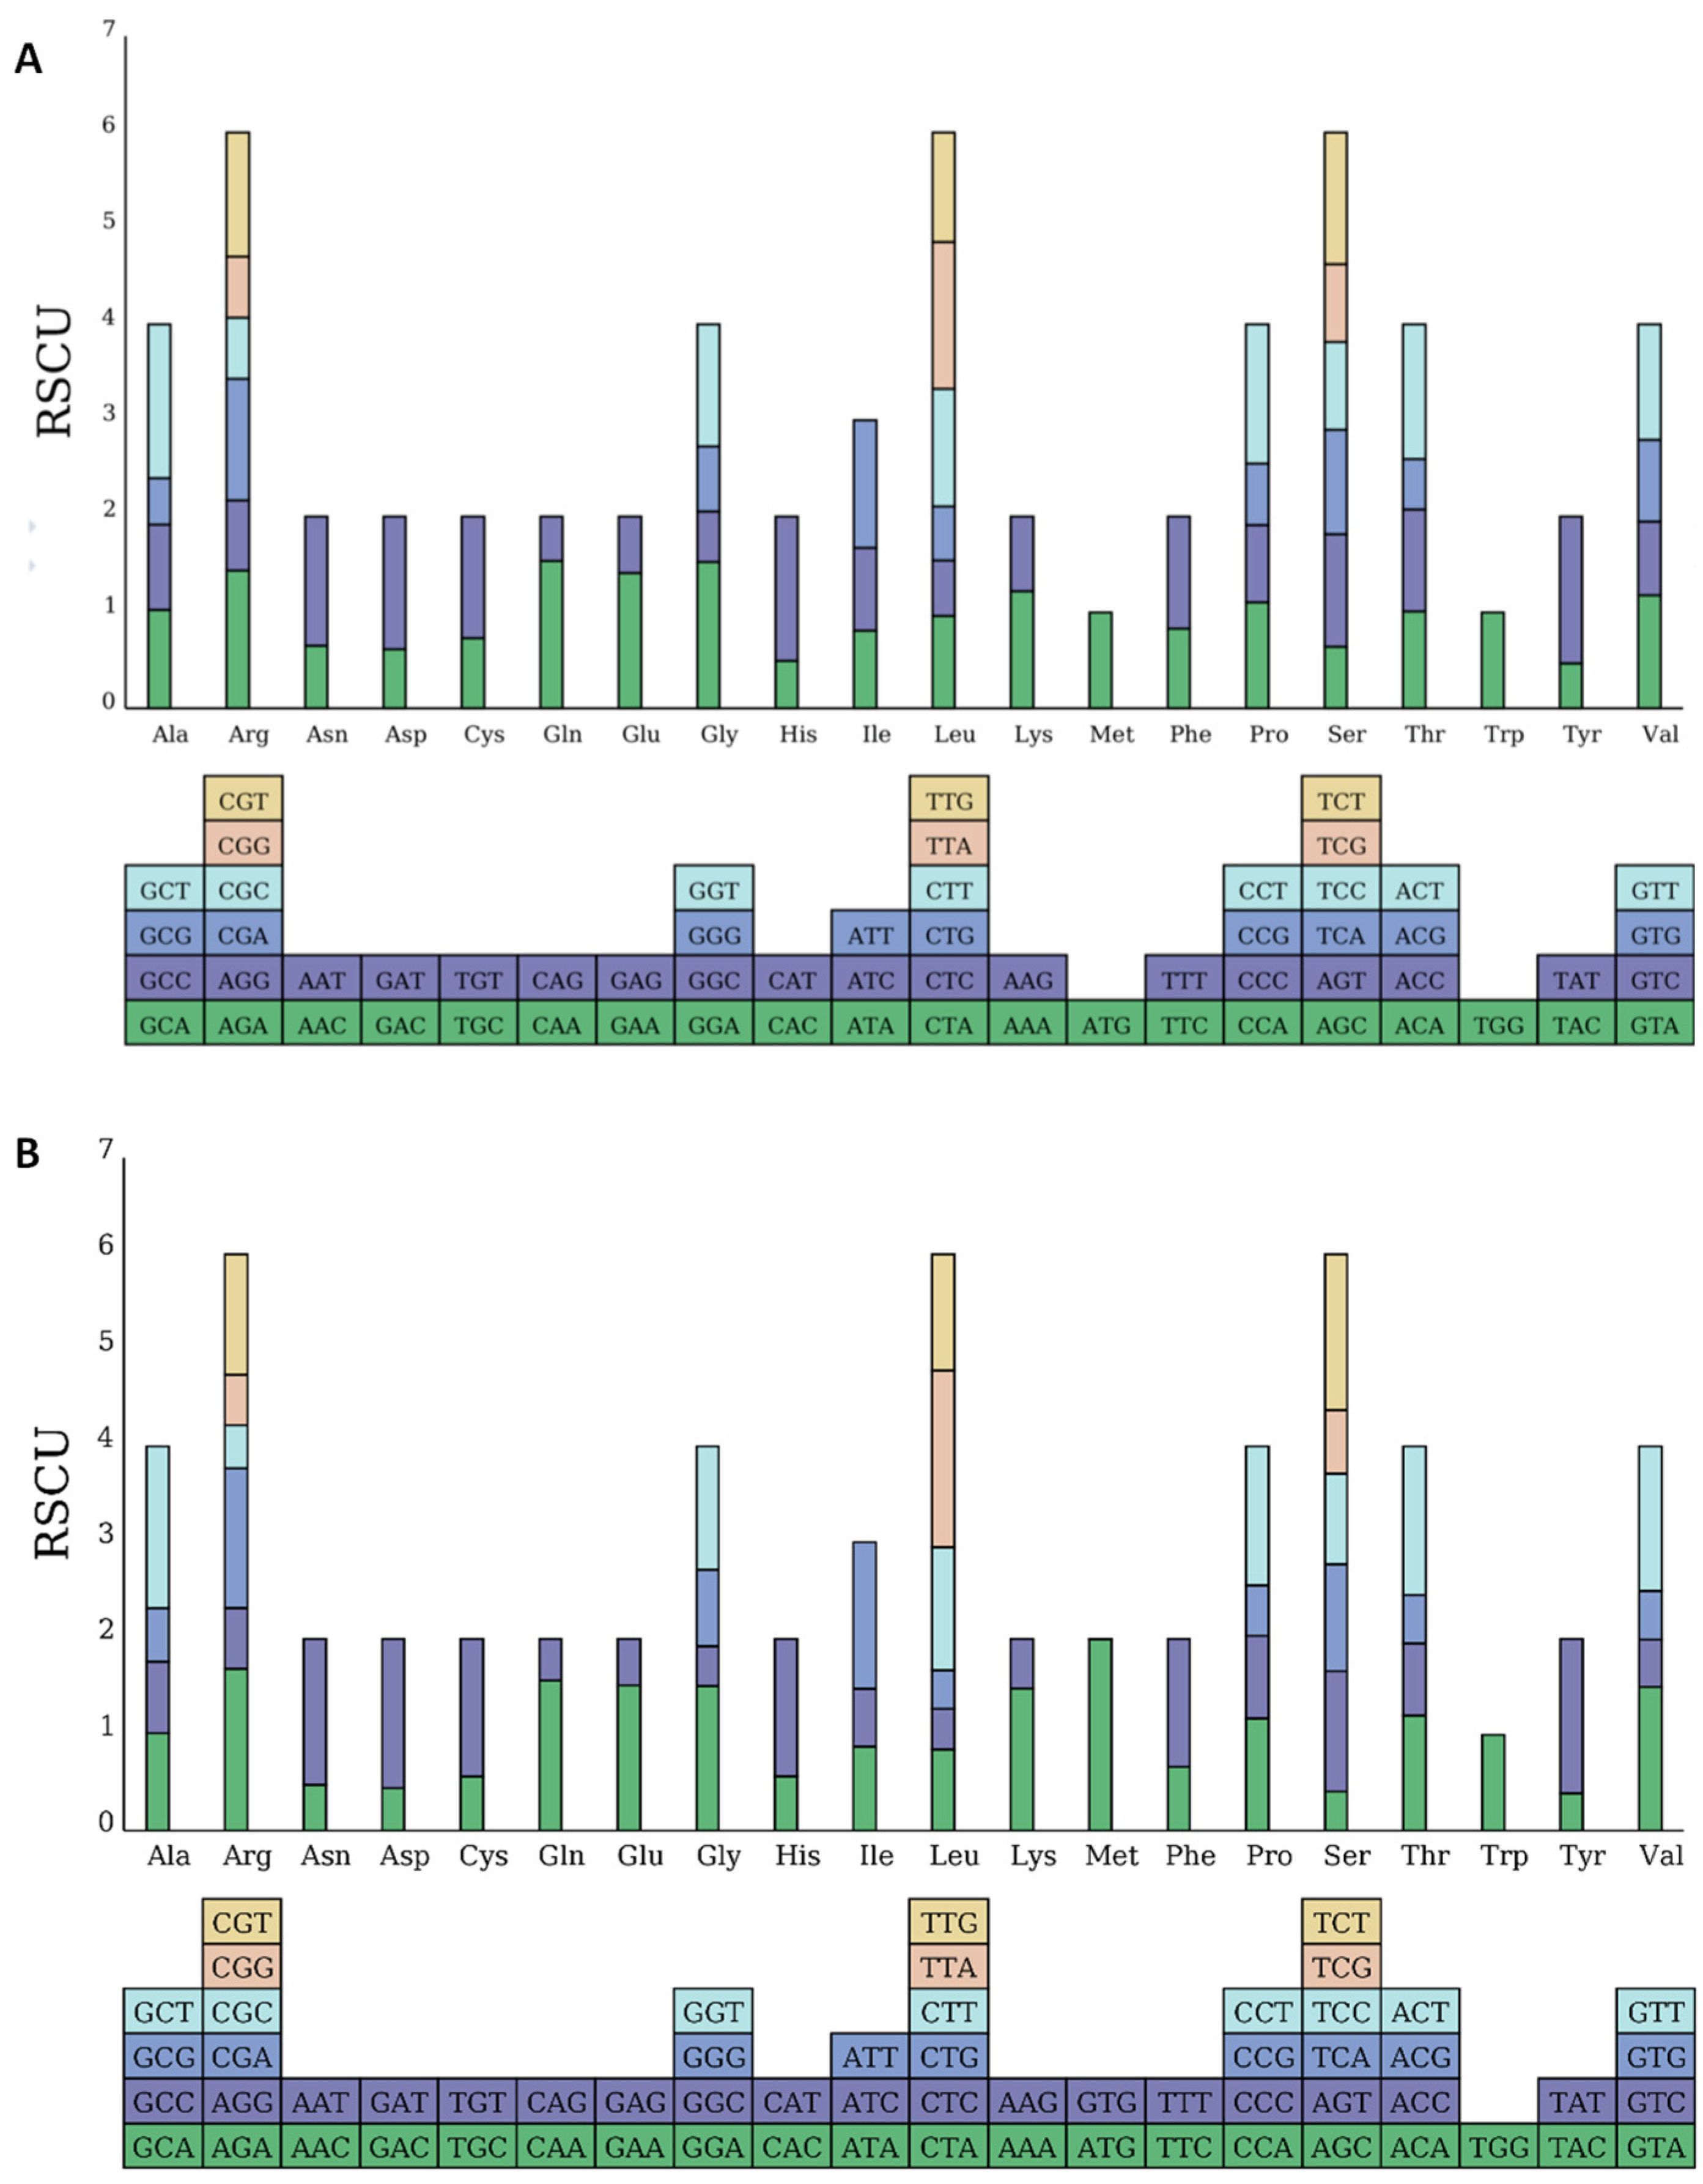
Codon preference describes how different organisms exhibit variations in the frequency of degenerate codon usage during translation. This results in a number of frequently used codons that have evolved, which plays a vital role in gene expression [19]. Codon preference is depicted using relative synonymous codon usage (RSCU) values. Codons with an RSCU value over one indicate a preference in usage [20], with mtDNA containing 32 codons and cpDNA containing 31 codons that are more frequently used, suggesting the organelle genes of M. pteleifolia favor these specific codons (Figure 3). Among the high-frequency codons, A or U dominated the third codon position, constituting 93.75% and 93.54% of mt and cp genomes, respectively. By contrast, low-frequency codons mostly featured G or C in the third position, which accounted for 93.75% and 91.18% of mitochondrial and chloroplast codons, respectively. This characteristic is commonly observed in a codon bias within the organelle genomes of terrestrial plants [21]. In M. pteleifolia, the synonymous codons most frequently utilized in mtDNA and cpDNA were GCU (Ala: RSCU = 1.60) and AUG (Met: RSCU = 1.99). Conversely, the least commonly used synonymous codons were UAG (Ter: RSCU = 0.45) and GUG (Met: RSCU = 0.01), while UGG (Trp) exhibited an RSCU of one (Table S6). The predominant codons for mitochondrial and cp genomes were UUU and AUU, with respective counts of 396 and 962.
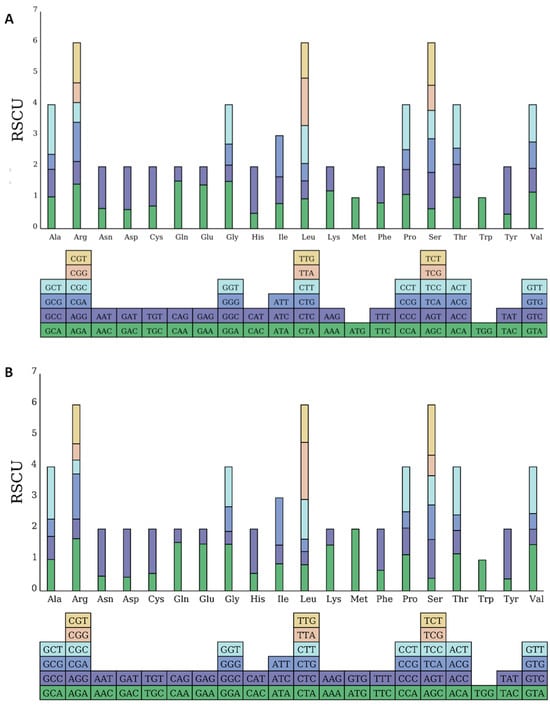
Figure 3.
Relative synonymous codon usage (RSCU) of the organelle genome in M. pteleifolia. (A), the RSCU analysis of mtDNA. (B), the RSCU analysis of cpDNA.
3.4. Gene Codon Preference
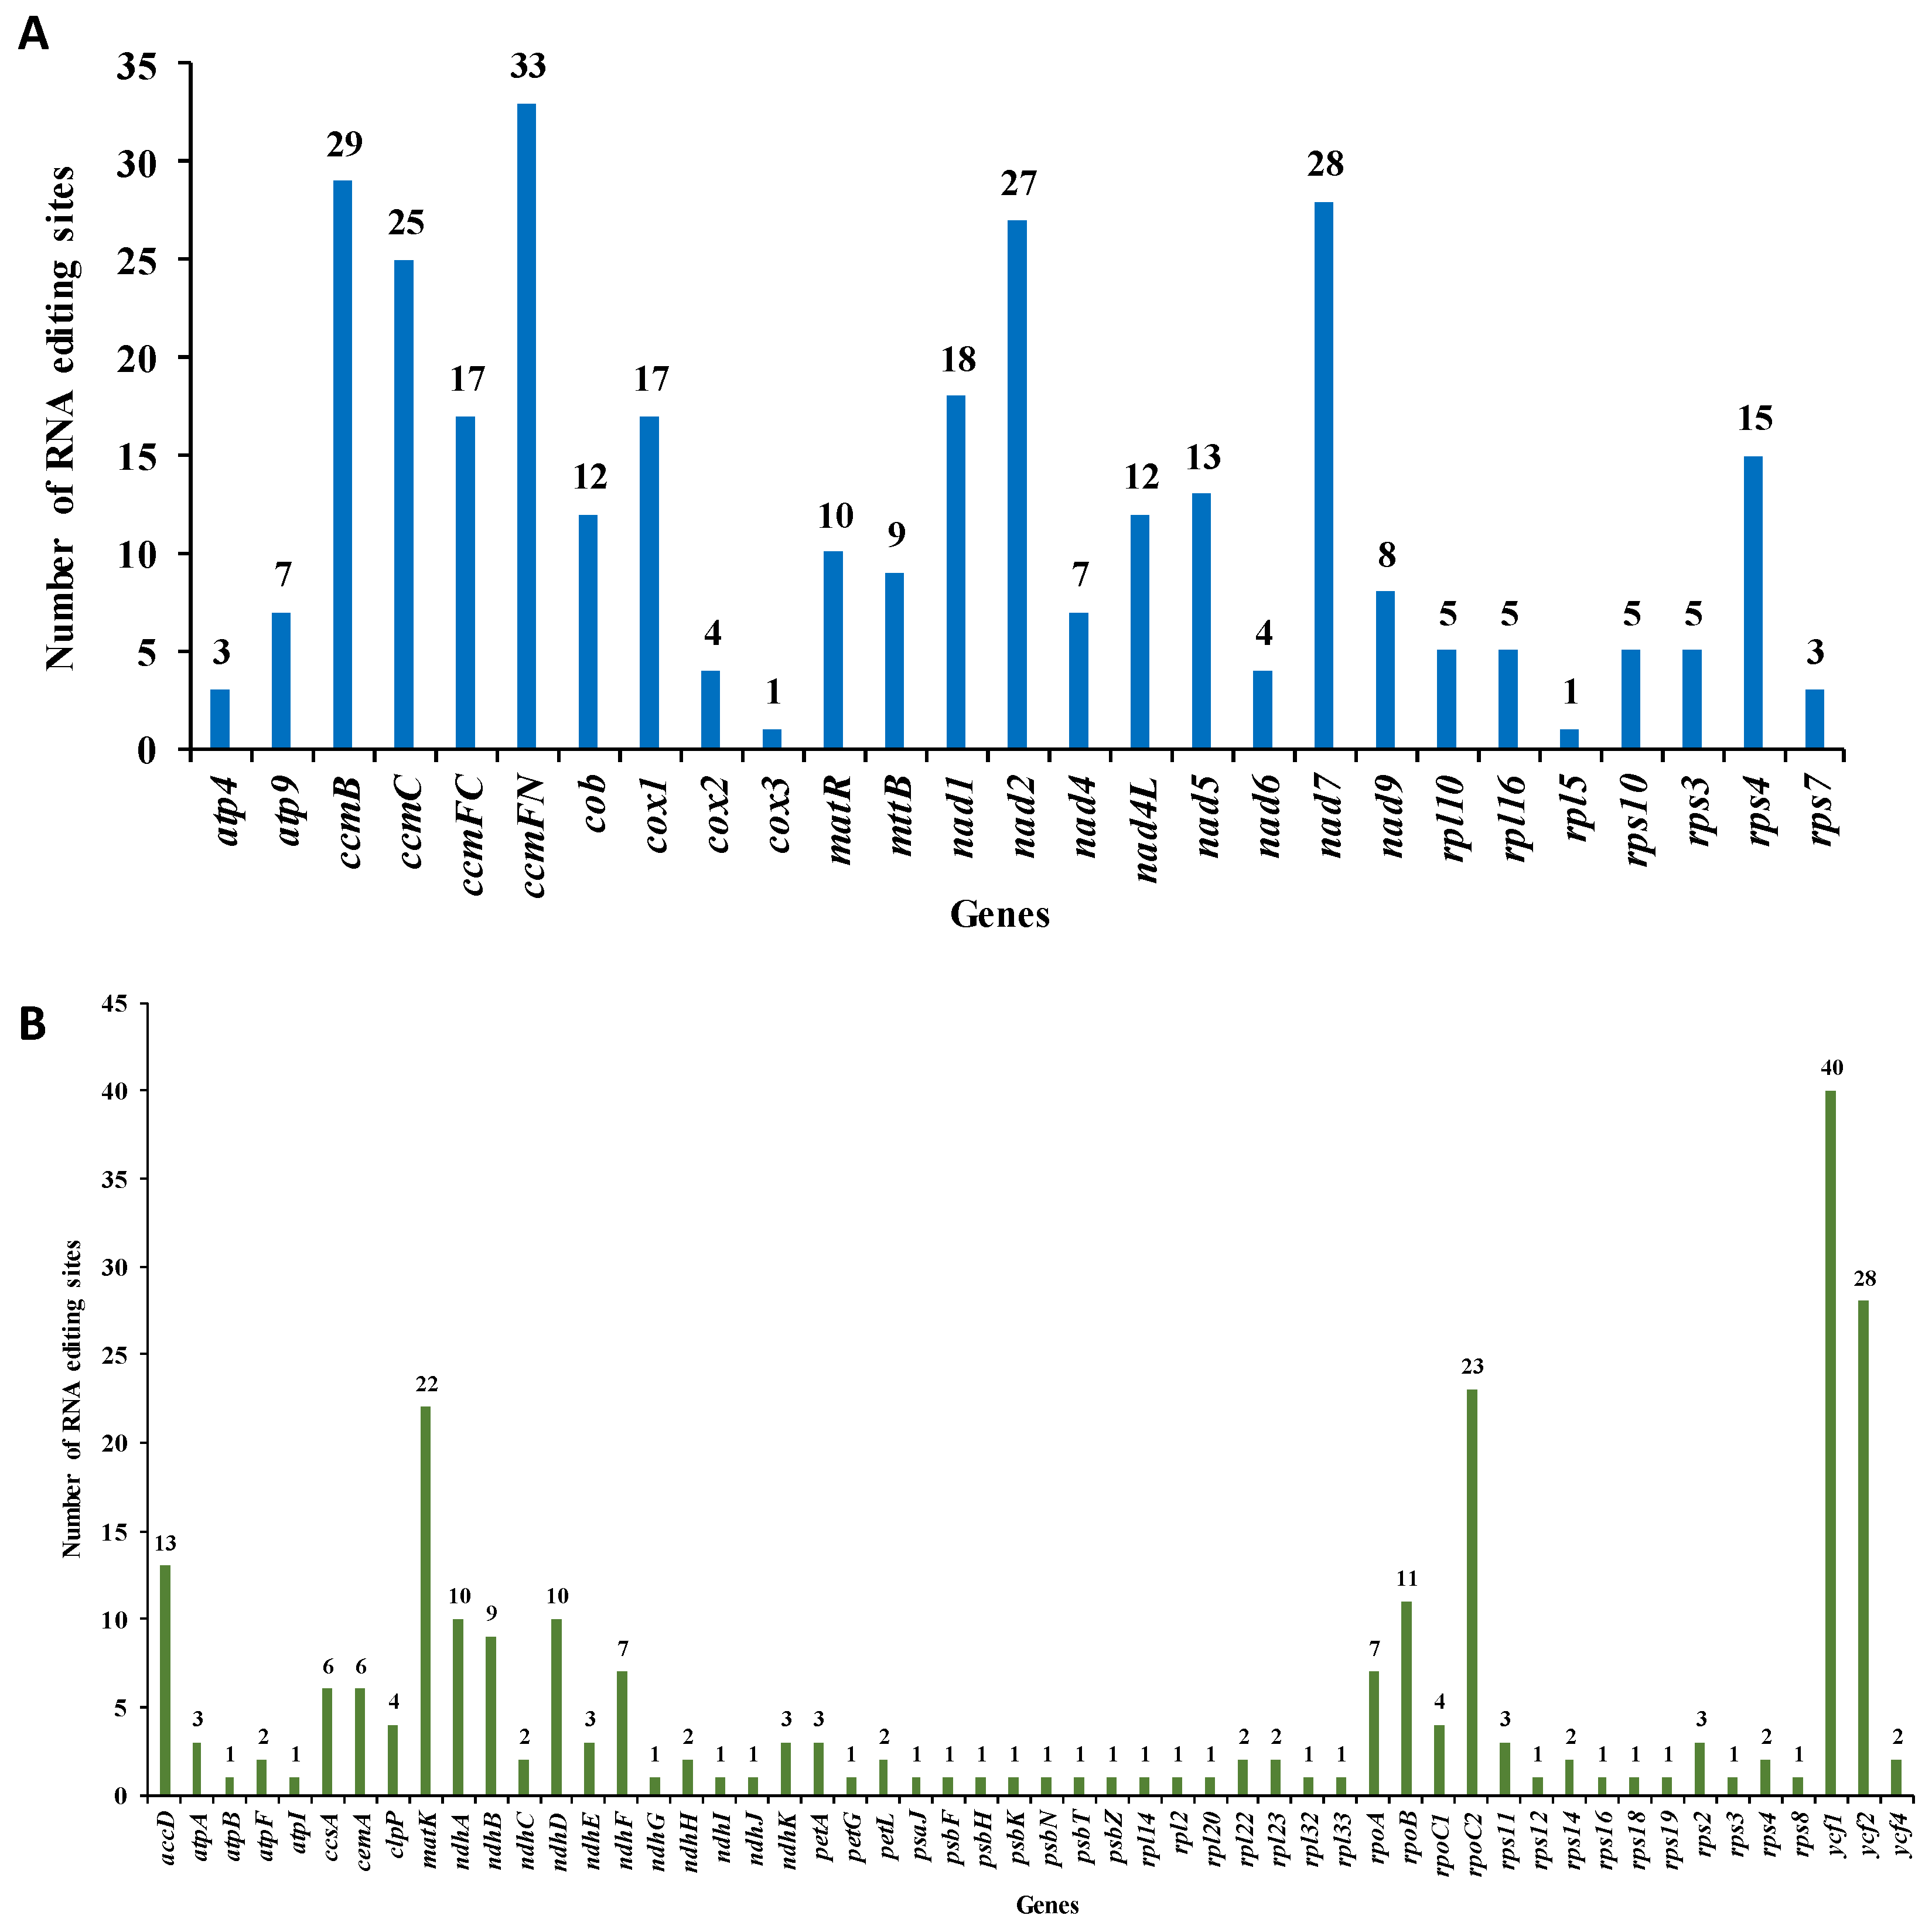
RNA editing refers to the process of base insertion, deletion, or modification that takes place during DNA transcription into RNA within mitochondria, chloroplasts, and nuclei [22]. By aligning transcriptome data with mtDNA and cpDNA, we identified 323 RNA editing sites in 27 mitochondrial genes and 260 in 54 chloroplast genes of M. pteleifolia (Figure 4A). In mtDNA, five genes with more than 20 RNA editing sites were found: ccmB, ccmC, ccmFn, nad2, and nad7. Four genes in cpDNA, including matK, rpoC2, ycf1, and ycf2, were also identified to have more than 20 editing sites. All the editing sites of the mitochondrial genome were observed to be C to T transitions (Table S7), which led to the premature translation termination of mitochondrial genes atp9, ccmFc, rsl16, and rps10. Post-editing, 14.55% of the hydrophilic amino acids in the mt genome transformed into hydrophilic ones, while 47.06% of the hydrophilic amino acids transformed into hydrophobic ones.
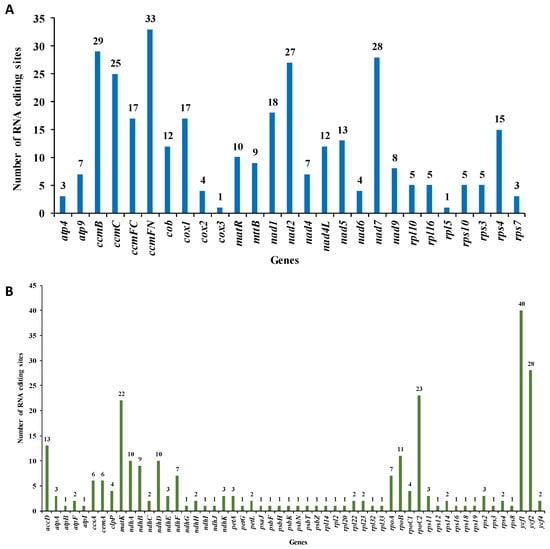
Figure 4.
The prediction of RNA editing sites in the organelle genome PCGs of M. pteleifolia. (A), RNA editing site prediction in mtDNA. (B), RNA editing site prediction in cpDNA.
3.5. Plastid DNA Transfer
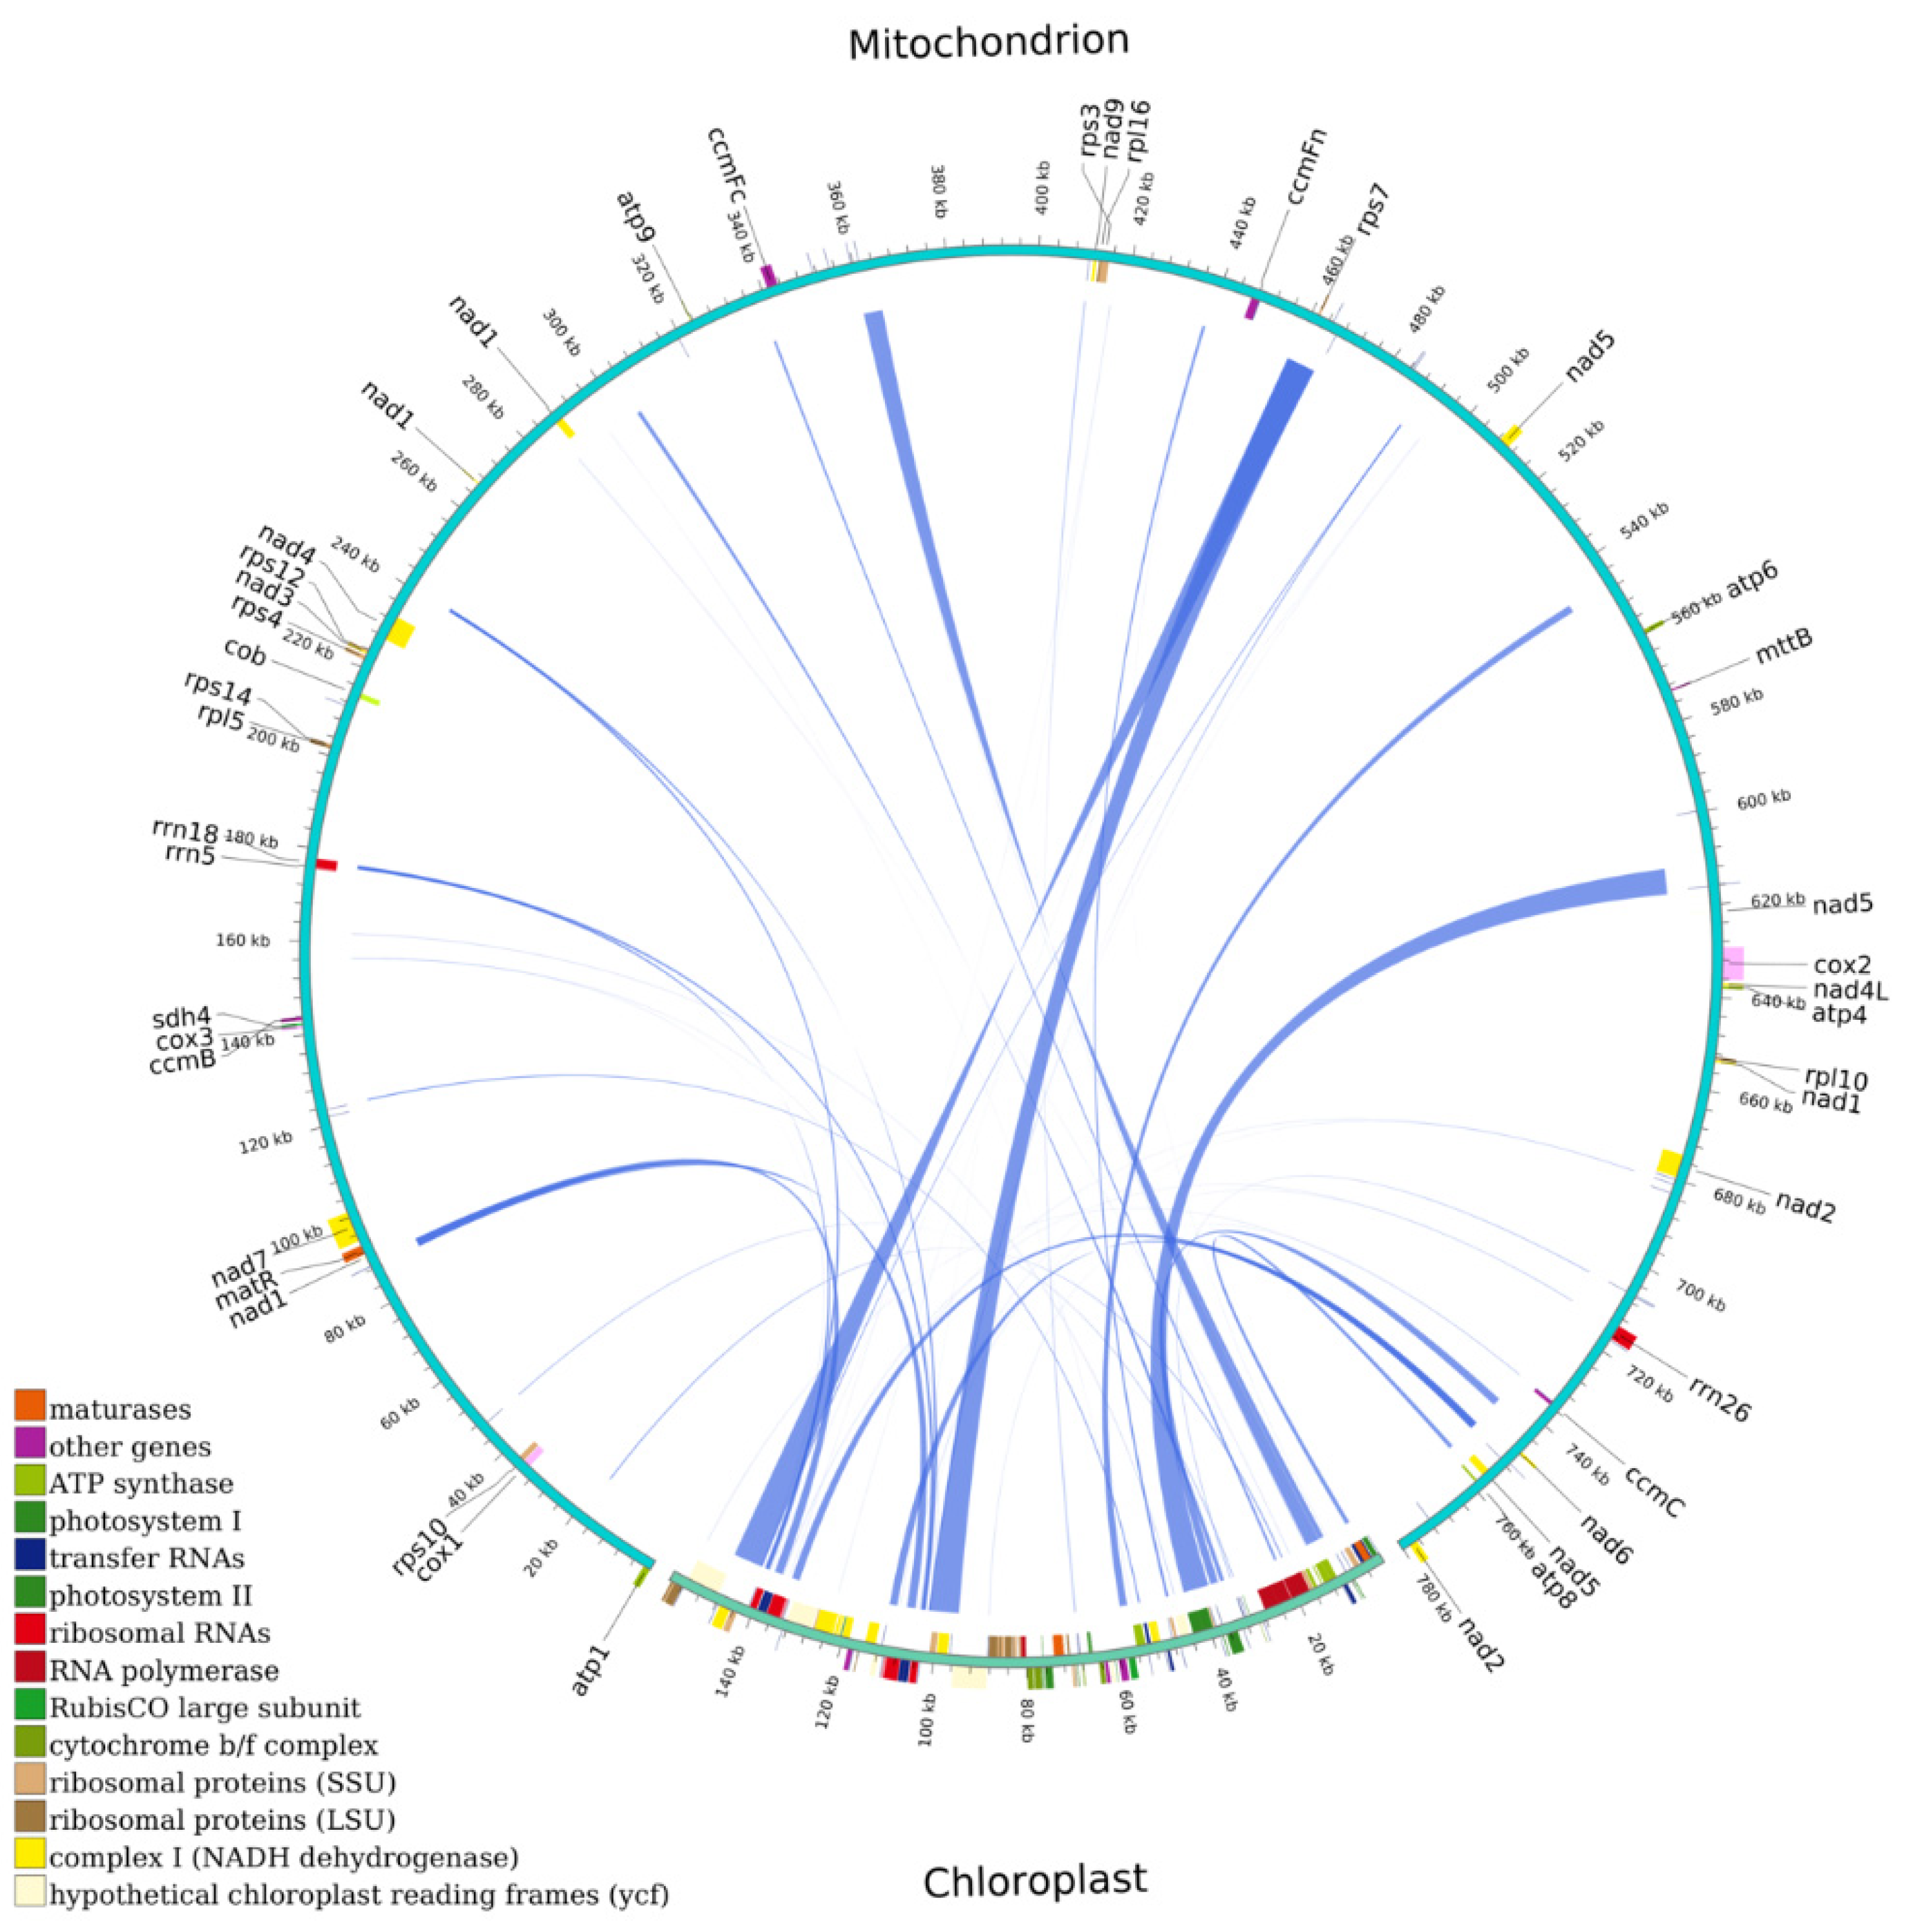
mtDNA typically includes sequences from plastid DNA, referred to as mitochondrial plastid DNA (MTPT) [23]. Through the nucleotide sequence analysis, 34 MTPTs were found in the mtDNA of M. pteleifolia, likely sourced from cpDNA, with lengths of between 30 and 6720 bp (Figure 5 and Table S8). The cumulative length of the MTPTs from the cpDNA was 44,434 bp, making up 27.95% of the cpDNA. The mtDNA contained MTPTs with a total length of 31,755 bp, representing 4.07% of the mtDNA. Among these MTPTs, 13 fully intact genes were related to chloroplast genes, including rps7, trnL-CAA, trnM-CAT, trnG-GCC, trnR-TCT, trnA-TGC, trnR-ACG, trnD-GTC, trnM-CAT, trnY-GTA, trnW-CCA, trnN-GTT, and trnI-TAT. Furthermore, some smaller fragment sequences from chloroplasts were parts of larger fragments or appeared repeatedly in mtDNA, implying that these fragments might have experienced multiple independent transfer integrations, replications, and recombinations within the mtDNA post-transfer integration [24].
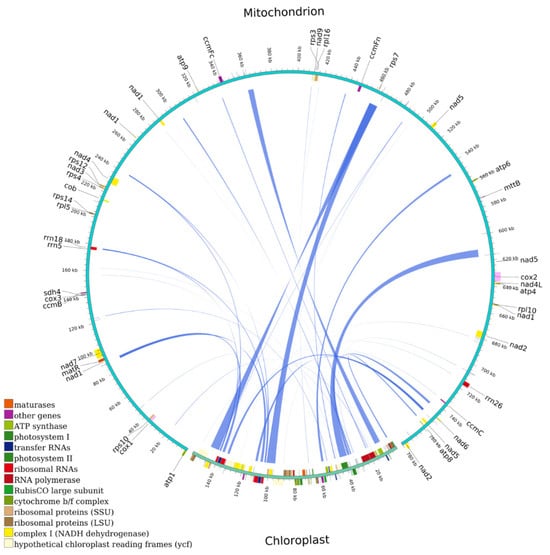
Figure 5.
Transfer events of plastid DNA to the mitochondrial genome in M. pteleifolia. The outer arc represents mtDNA and cpDNA, while the inner arc represents the corresponding transfer mitochondrial plastid DNAs (MTPTs).
3.6. Phylogenetic Analysis
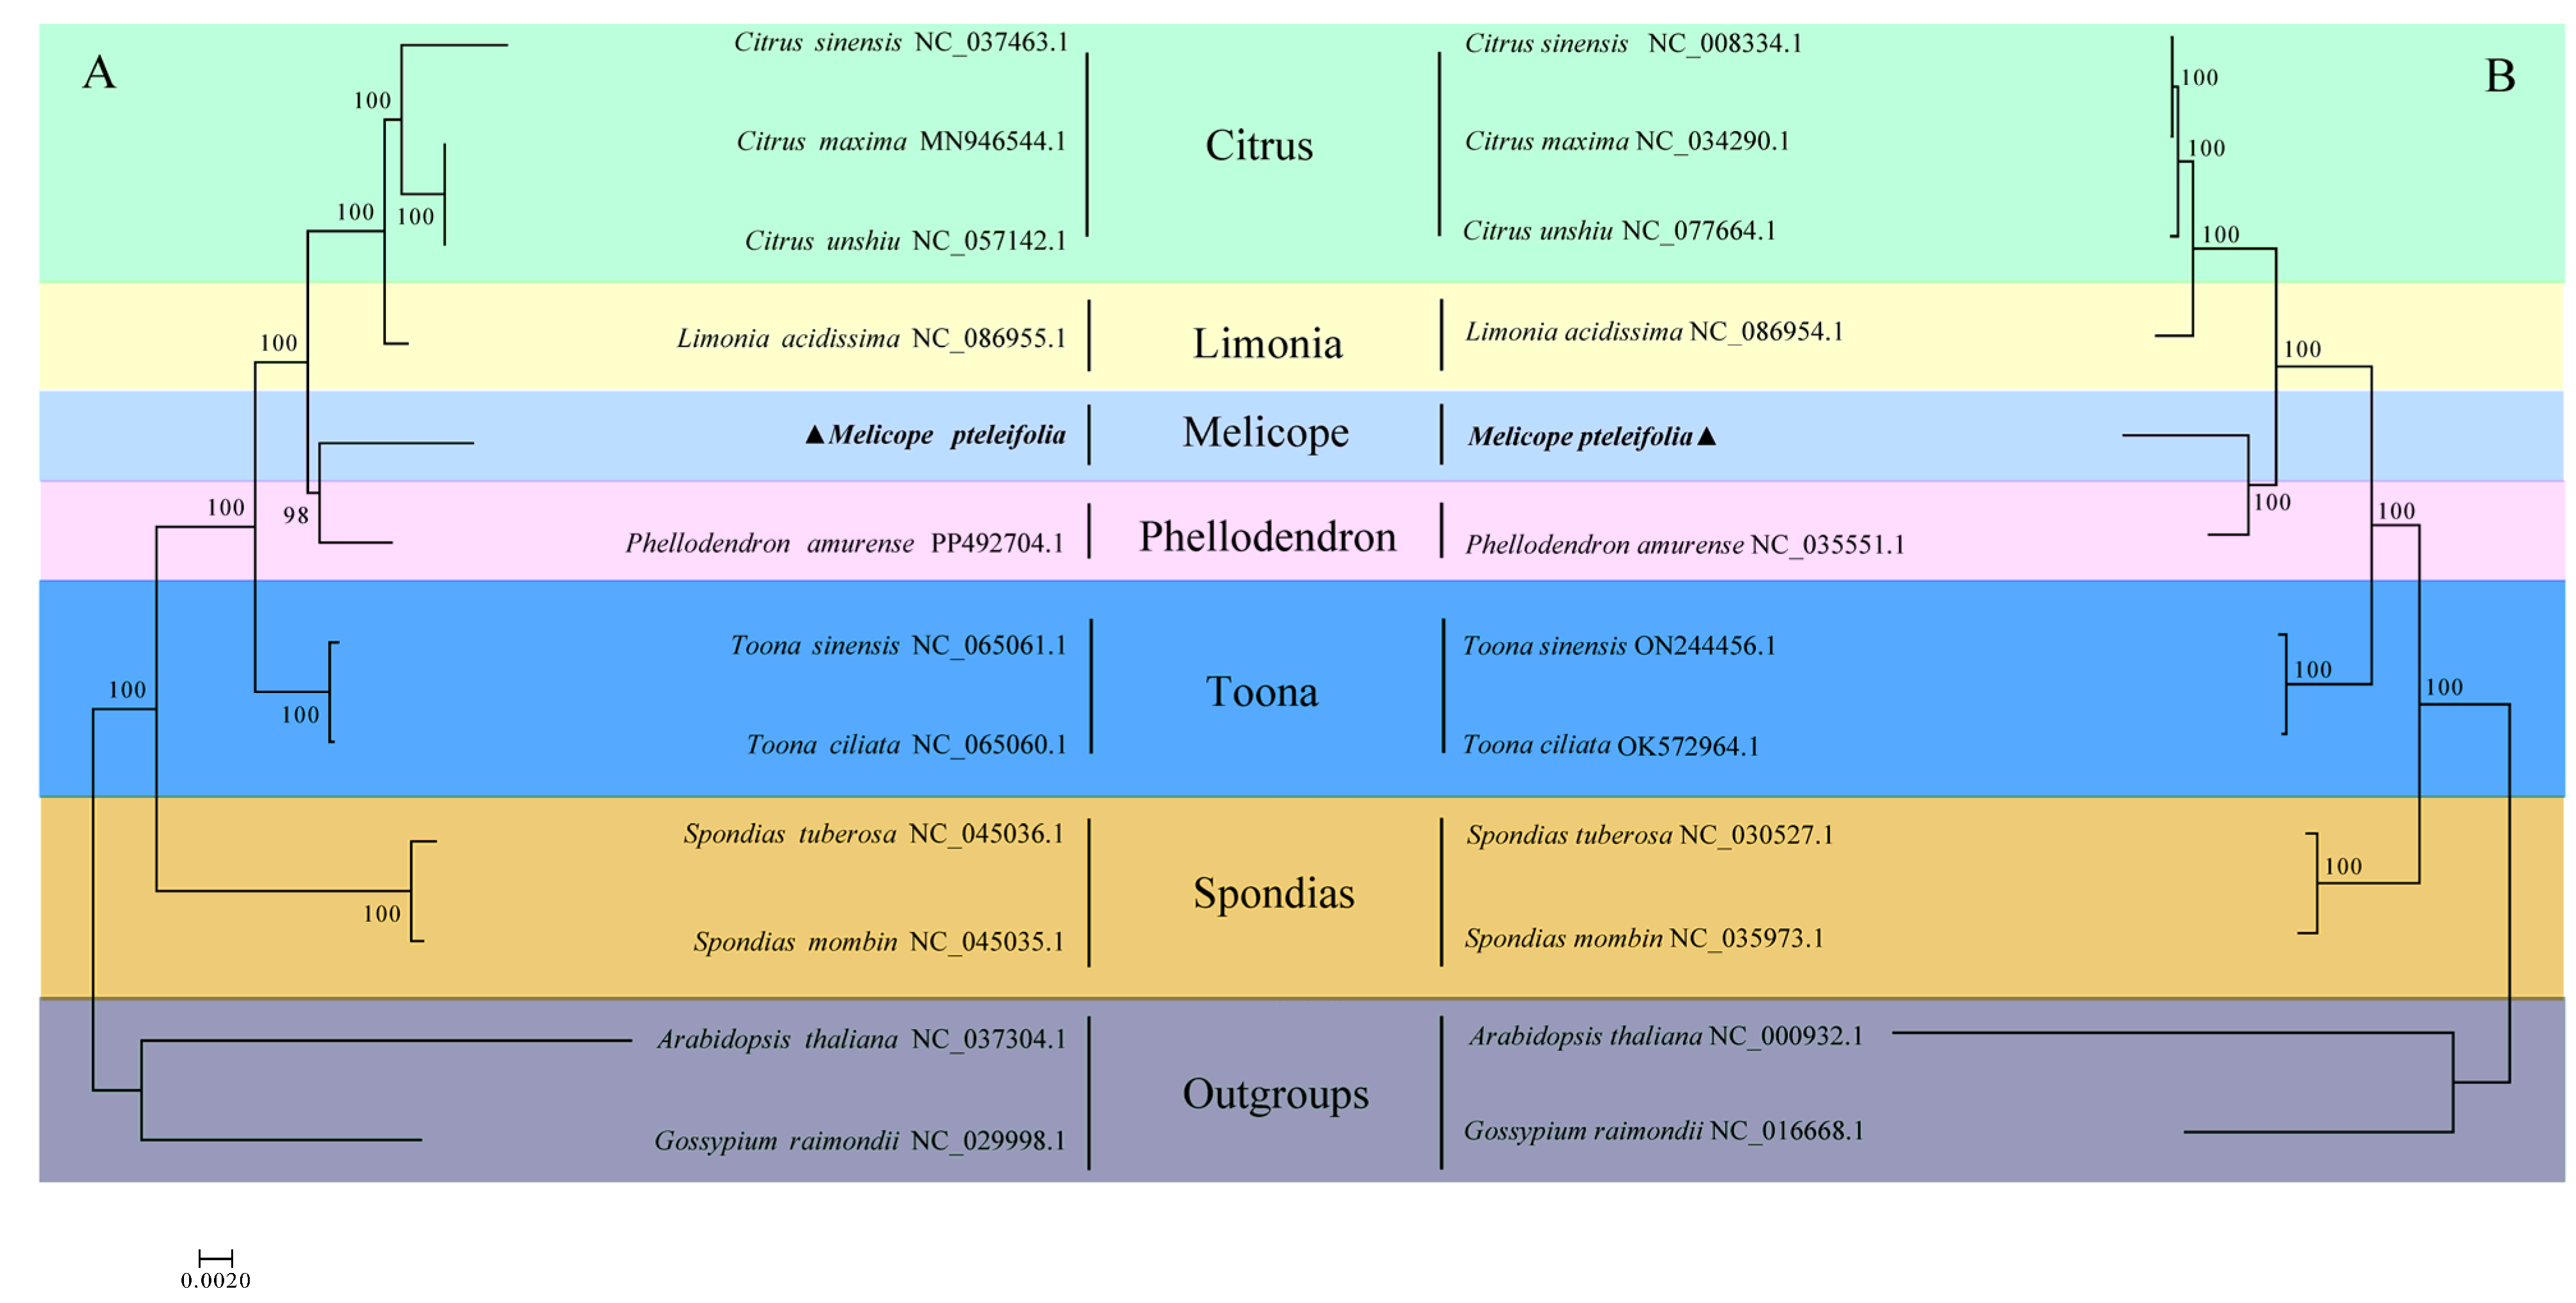
Using shared mitochondrial and chloroplast genes, we employed the maximum likelihood (ML) method to analyze the evolutionary relationships among ten species of Rutaceae, with Arabidopsis thaliana and Gossypium raimondii serving as outgroups. A phylogenetic tree based on mitochondrial genomes across the 12 species is shown in Figure 6A. The analysis revealed that M. pteleifolia is most closely related to Phellodendron amurense, followed by a cluster consisting of three Citrus species and Limonia Acidissima. The most distantly related species is Spondias. A similar phylogenetic tree constructed using cp genomes (Figure 6B) showed that the overall structures of both mitochondrial and chloroplast phylogenetic trees were consistent, further supporting the evolutionary relationships among the six genera. This congruence between the two trees strengthens the understanding of the evolutionary connections within the Rutaceae family.
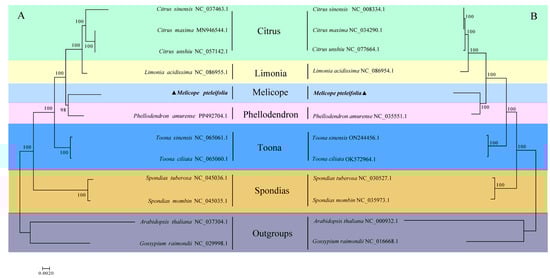
Figure 6.
The phylogenetic relationship between M. pteleifolia and 11 other species based on mtDNA (A) and cpDNA (B). The colors represent plants of the same family.
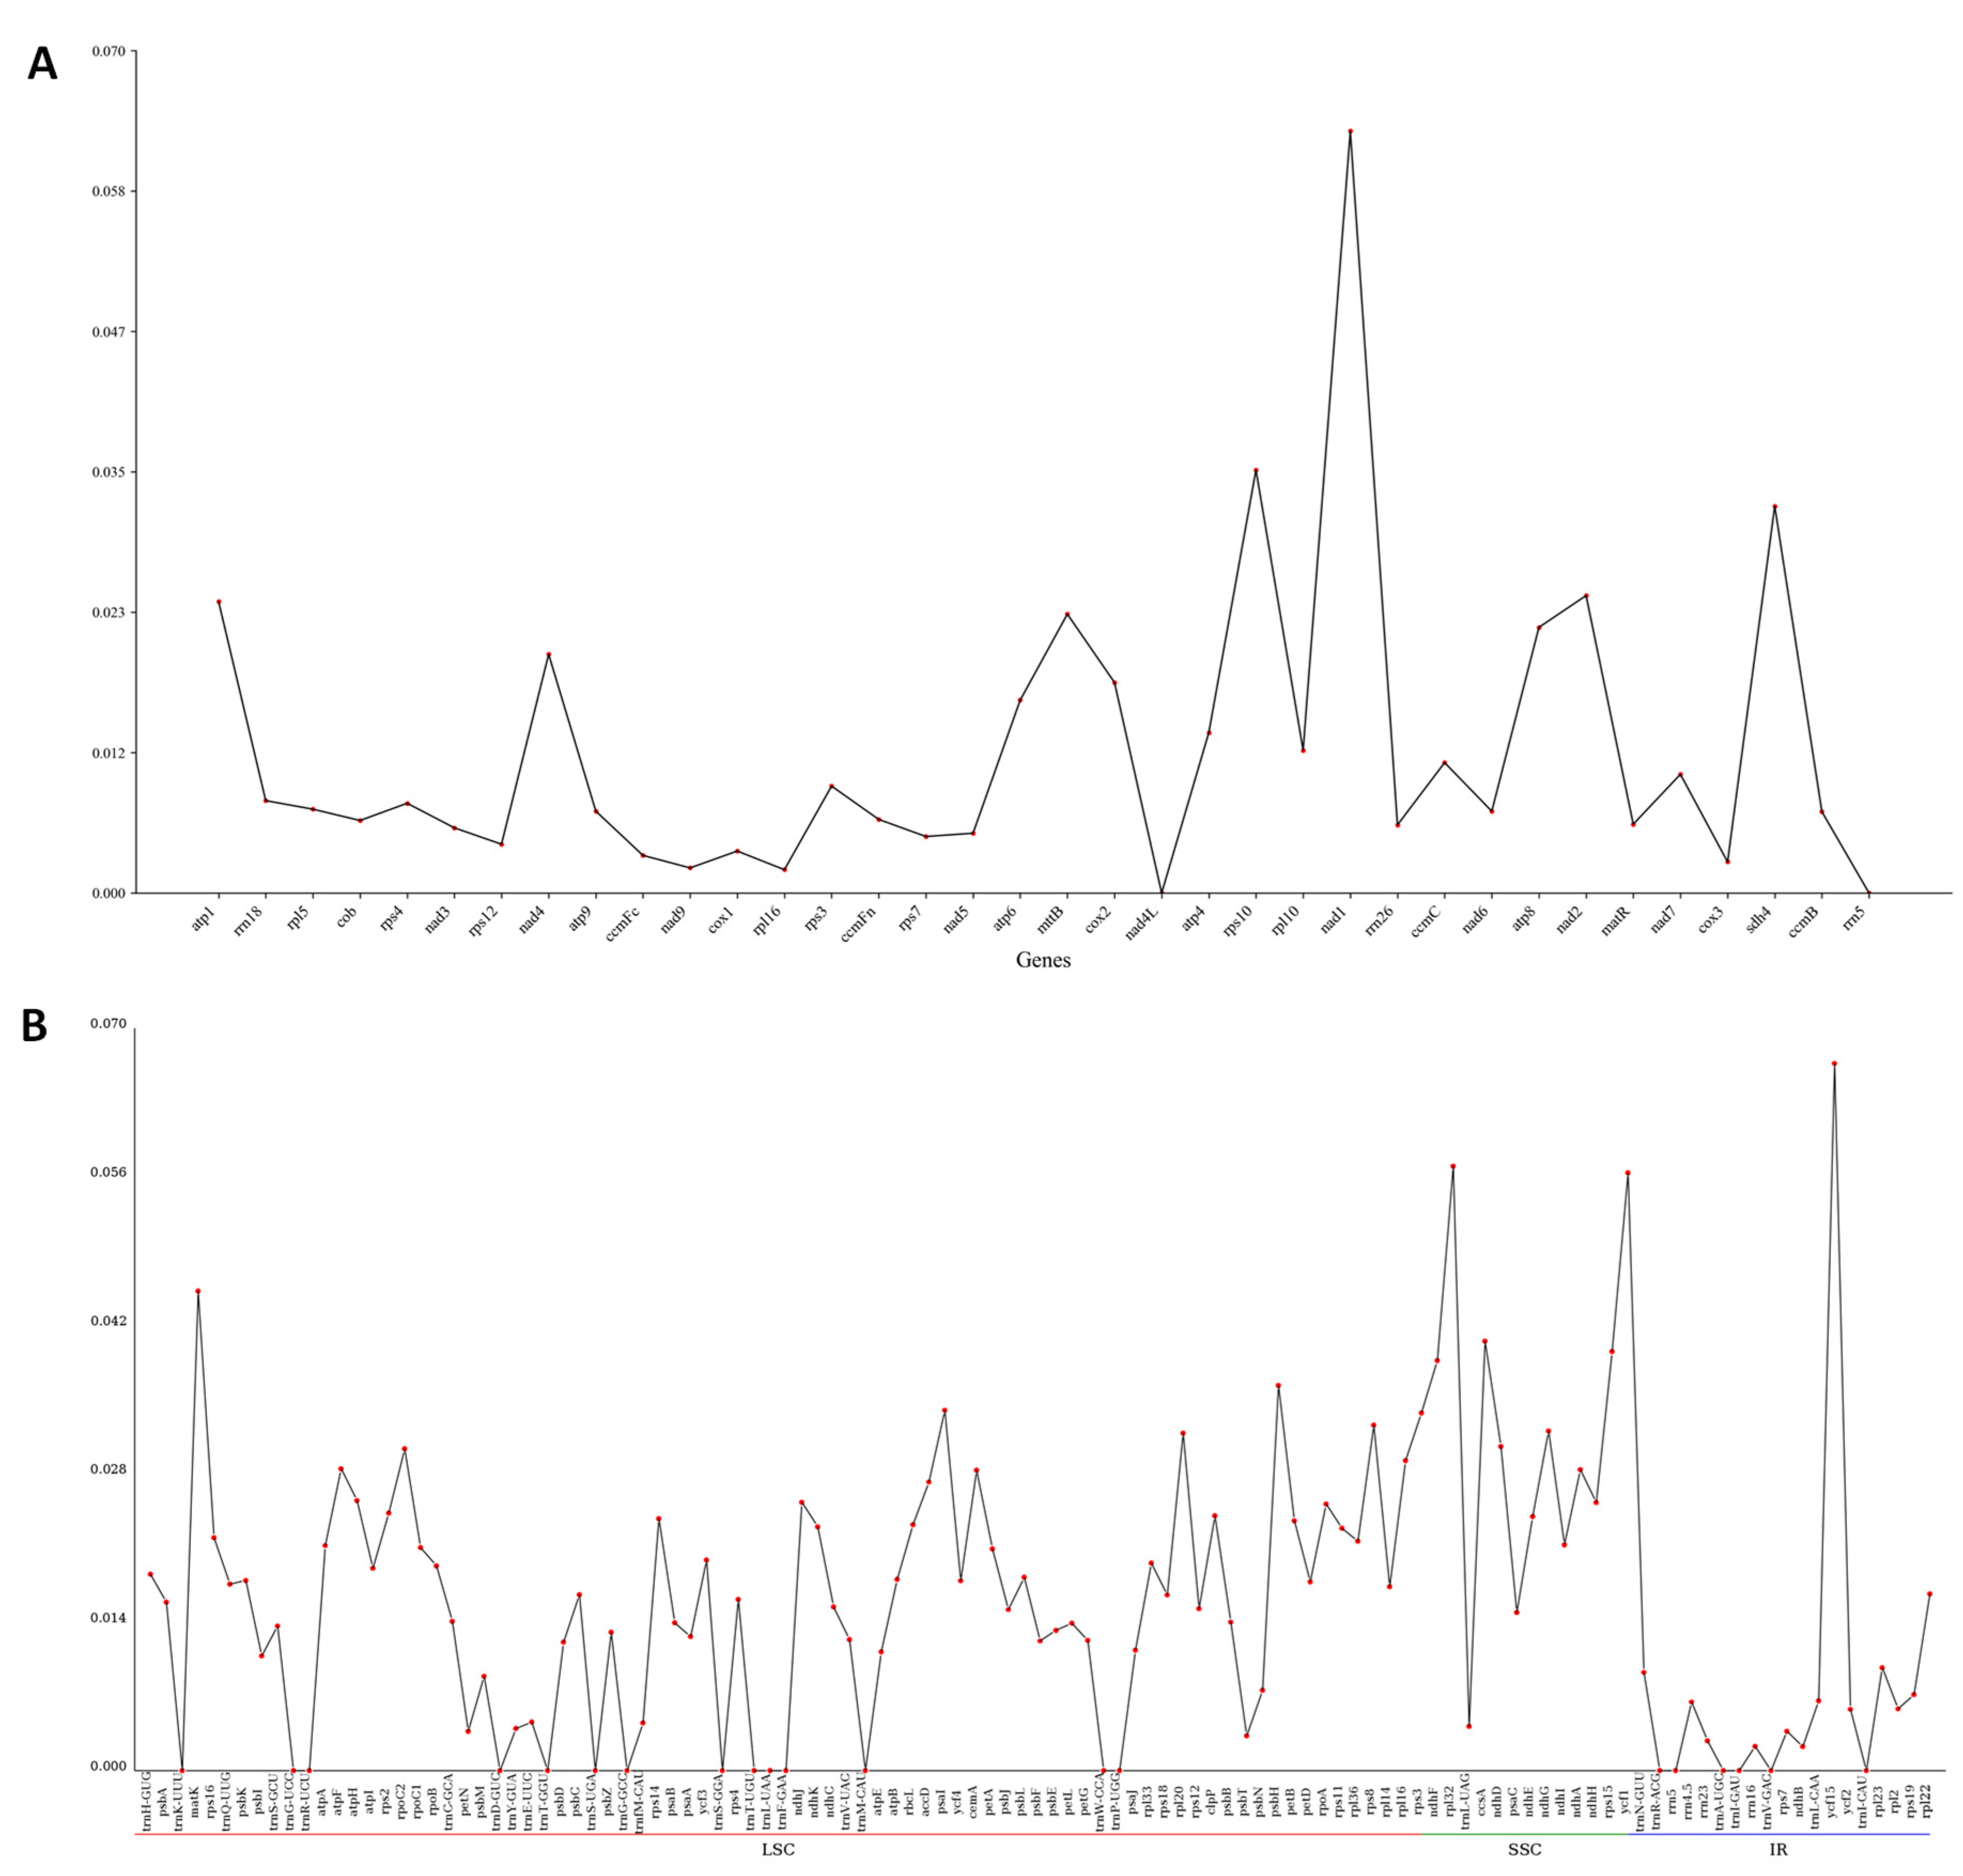
3.7. Nucleotide Diversity (Pi)
Pi serves as an indicator for evaluating genetic variations in nucleotide sequences across different species and populations, with regions exhibiting high variability frequently selected as prospective molecular markers for studies on populations [25]. A Pi analysis on organellar genes in M. pteleifolia was performed, showing that the mitochondrial genes were highly conserved. Only one gene exhibited Pi > 0.05, with a variability of 0.063 (Figure 7A and Table S9). The most conserved genes were nad4L and rrn5, with a Pi value of zero. For chloroplast protein-coding genes (PCGs), the values of Pi varied between 0 and 0.067, with three genes exhibiting values exceeding 0.05 (Figure 7B, and Table S9). The gene exhibiting the highest variability was ycf15 (Pi = 0.067), with rpl32 (Pi = 0.057) and ycf1 (Pi = 0.057) following closely behind. Among cp genes, 20 genes were highly conserved with a Pi value of zero.
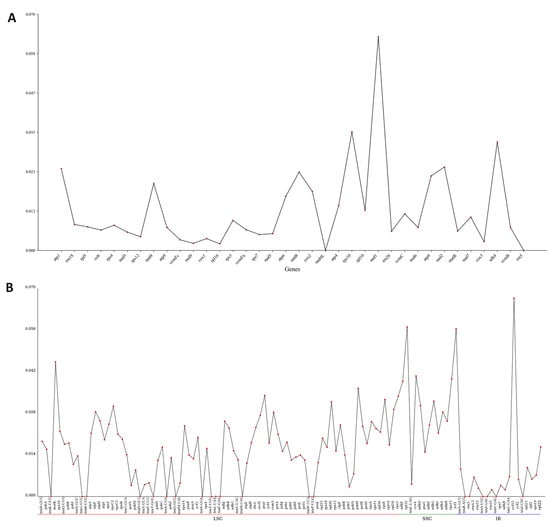
Figure 7.
The nucleotide diversity of genes in organelle genomes of 9 closely related species. (A), the Pi value of mitochondrial genes. (B), the Pi values of chloroplast genes.
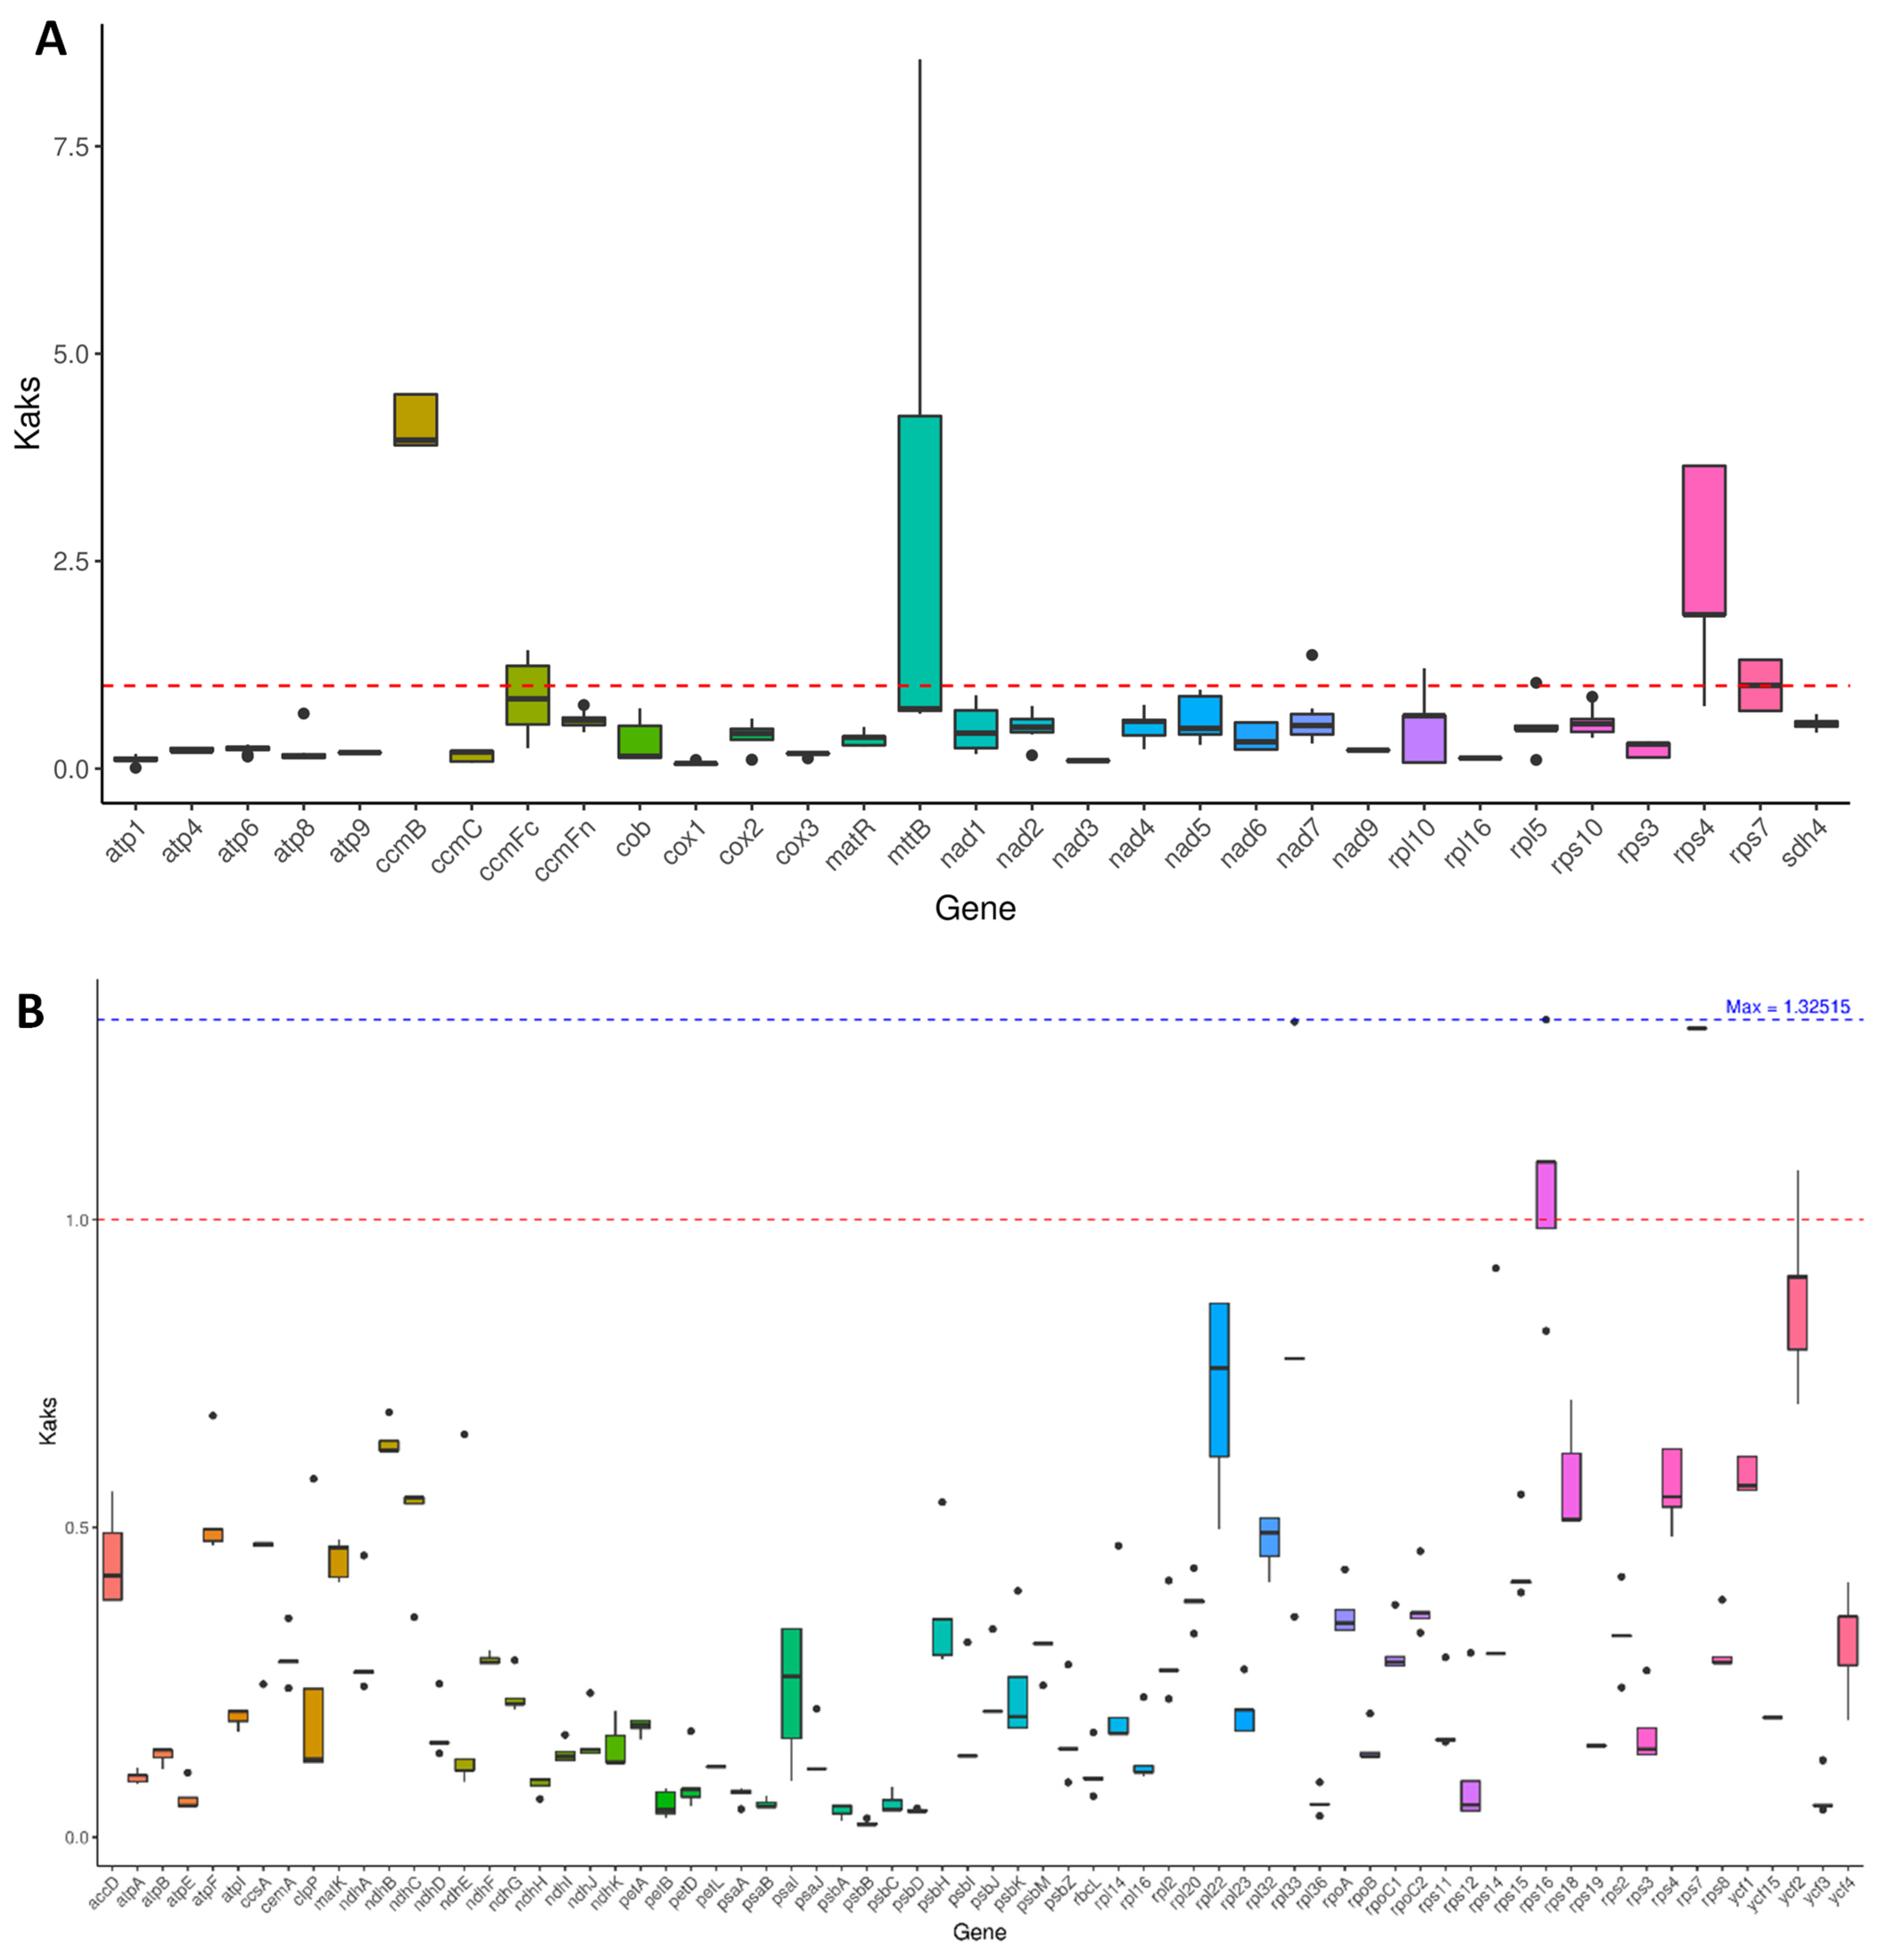
3.8. Nonsynonymous Substitution Rate/Synonymous Substitution Rate (Ka/Ks) Analysis
The Ka/Ks ratio is used to assess the selective pressure on proteins during the evolution of species [26]. A Ka/Ks ratio exceeding one indicates positive selection, a ratio of one signifies neutral evolution, while a ratio below one suggests negative or purifying selection [27]. To examine the selection pressure on protein-coding genes (PCGs) in species closely related to M. pteleifolia, Ka/Ks values were calculated for 31 mitochondrial and 71 chloroplast genes (Figure 8). The results revealed that 27 mitochondrial PCGs had Ka/Ks values below one, particularly cox1 (Ka/Ks = 0.06) and nad3 (Ka/Ks = 0.10) (Table S10), indicating that these genes have been subjected to purifying selection, maintaining stable protein functions. Conversely, the Ka/Ks values of rps7, rps4, mttB, and ccmB were greater than one, with ccmB (Ka/Ks = 4.15), mttB (Ka/Ks = 2.60), and rps4 (Ka/Ks = 2.53) undergoing strong positive selection. In comparison, for chloroplast genes, only rps7 and rps16 had values exceeding one, whereas the remaining 69 genes showed values below one (Figure 8B and Table S10), indicating that most chloroplast PCGs have undergone negative selection and have maintained a high level of conservation over the course of evolution.
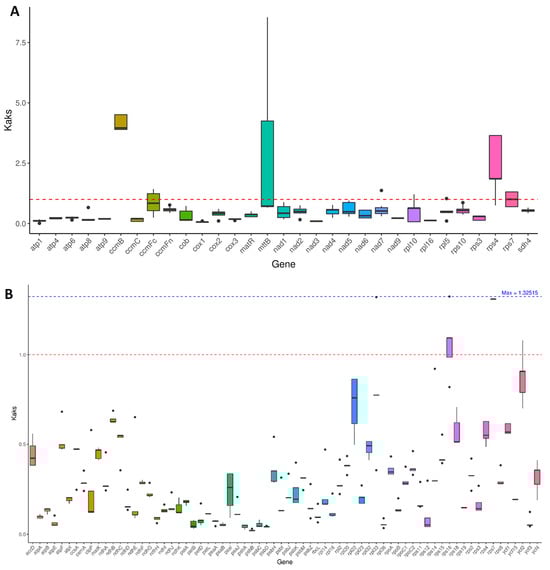
Figure 8.
The Ka/Ks analysis of PCGs in the organelle genomes of 9 closely related species. (A), the Ka/Ks of mitochondrial PCGs. (B), the Ka/Ks of chloroplast PCGs. The black solid lines on the box plot represents the average value, and the dashed lines represent the middle value.
4. Discussion
The recent fast advancements in sequencing and assembly technologies have significantly increased the quantity of high-quality organellar genome assemblies. At present, 20,600 complete cp genome sequences are available, while only 640 mtDNA sequences from plants have been released on NCBI (https://www.ncbi.nlm.nih.gov/nuccore, as of 29 October 2024). The composition and structure of cpDNA exhibit a remarkable degree of conservation. In contrast, the mitochondrial DNA of plants tends to be larger and more intricate. It can exist not only as a single circular structure but also as a polycyclic structure [28], linear structure [29], multi-branched structure [21], and even as DNA with complex structural conformations [30]. The findings of this study indicated that the mtDNA of M. pteleifolia comprised a single circular DNA molecule. The size of plant mitogenomes is notably larger compared to other species. For example, animal mitogenomes generally range from 15 to 17 kb [31], whereas algal mitochondria, which are slightly larger, can vary from 13 to 96 kb. In comparison, the mitogenomes of angiosperms generally range from 200 to 700 kb, with some reaching sizes up to 11 Mb [32]. In our study, the mt genome size of M. pteleifolia reached 780 kb, which was larger than most angiosperm mitogenomes. However, the sequences of the coding regions account for only 4.74% of the total mt genome, which is less than previous reports in angiosperms, where coding regions typically represent 7–17% of the total genome [33]. Additionally, plant mitochondrial genomes typically include a limited number of coding genes, usually ranging from 50 to 60 [34]. The M. pteleifolia mitogenome has 63 annotated genes, including 33 protein-coding genes (PCGs), which is comparable to the gene count in Citrus sinensis [35]. The GC content is another key metric for species identification. The GC content of the M. pteleifolia mitogenome was 44.85%, higher than the GC content of the C. sinensis mitogenome (43.89%) [35], but lower than that of Phellodendron amurense (44.50%) [36].
A significant quantity of repeats was identified in organelle genomes of M. pteleifolia. SSRs are important genetic markers that play vital roles in species identification, comparative genomics, and genetic linkage mapping [37]. In the mitochondrial genome and cp genome of M. pteleifolia, 211 and 286 highly polymorphic SSRs were identified, which may function as significant molecular indicators for species identification and assessing genetic diversity. Notably, dimeric repeats were found to lack CG/GC combinations, aligning with SSR distributions typically observed in eukaryotes [38]. In plants, tandem repeats are associated with phenomena such as paramutation and enhancer activity [39]. In the M. pteleifolia mitogenome, 61 tandem repeats were identified, suggesting they may serve as molecular biomarkers for the species. Dispersed repeats are also significant components of plant genomes, affecting evolution, gene expression, and function, which can ultimately influence plant phenotypes [40]. Furthermore, dispersed repeats have the potential to give rise to mutant populations [41]. The mitochondrial genome of M. pteleifolia revealed 235 pairs of dispersed repeats, significantly surpassing the 34 found in the cp genome, underscoring their crucial role in sequence rearrangement. Thus, the organelle genomes of M. pteleifolia enhance genetic diversity and are essential for study on lineage geography. Such investigations may elucidate the origins of present distribution patterns and highlight the impact of geological changes on the development of M. pteleifolia.
Throughout plant evolution, mitochondrial DNA has experienced substantial alterations in gene sequences, genomic structure, and sequence transference from other organelles [42]. MTPTs are prevalent in higher plants and are crucial to the plant’s evolutionary development [43]. Nuclear genome and cpDNA fragments are frequently integrated into mtDNA, a phenomenon that may be linked to the common ancestor of gymnosperms and angiosperms some 300 million years ago [44]. As evolution progresses, chloroplast DNA (cpDNA) tends to decrease in size, while mtDNA increases owing to frequent exchanges between the nuclear and cp genomes [24]. Here, the mtDNA of M. pteleifolia was 780 kb, which was 4.91 times more than its cpDNA. Plasmid-transferred fragments were randomly distributed throughout cpDNA, totaling of 31.75 kb in M. pteleifolia. Horizontal gene transfer (HGT) has been suggested as a substitute for vertical gene transfer, which transpires from parent to progeny. HGT overcomes the constraints of genetic relationships, resulting in more complex patterns of gene flow [45]. Given the present deficiency of data on the nuclear genome of M. pteleifolia, more study is essential to ascertain if DNA transfer takes place between the nuclear genome and the mt and cp genomes. Understanding these interactions could provide fundamental understanding of the processes of evolution that influence genome structure and function in M. pteleifolia.
Gene expression in plant organelles encompasses many co-transcriptional and post-transcriptional nucleic acid modifications, including as 5′ and 3′ RNA processing, cis- and trans-splicing, and RNA editing [22]. RNA editing results in RNA sequences that deviate from their DNA templates, enabling modifications of genetic information at the mRNA level. The primary type of RNA editing in plant organellar genomes is the conversion of C to T [46], which was consistent with our observation in M. pteleifolia mitogenome. RNA editing may alter encoded amino acids and possibly generate stop codons, which may result in the premature termination of the translation process [47]. In the organelle genomes of M. pteleifolia, such premature terminations could occur in atp9, ccmFc, rsl16, and rps10. RNA editing sites in organelle genomes exhibit significant variation across species, which can vary from zero to several hundred, characterized by recurrent acquisitions and deletions of these sites [48]. In the present study, the organellar genomes of M. pteleifolia contain abundant editing sites, which could provide a basis for future research into RNA editing within the Rutaceae family. Understanding the distribution and function of these editing sites may reveal insights into how RNA editing contributes to the adaptation and evolution of these plants.
Ka/Ks analysis provides a comprehensive insight into genome evolution. In the organelle genomes of M. pteleifolia, the Ka/Ks ratio for most genes was below one, which was consistent with the findings from previous research [21,28]. Our study identified Ka/Ks ratios greater than one for the genes rps7, rps4, mttB, and ccmB, suggesting that the above genes have experienced positive selection and are evolving at a rapid pace. The rps genes in mitogenomes encode ribosomal proteins that are essential for the assembly and function of mitochondrial ribosomes. The rps7 gene exhibits positive selection in mangrove genomes, suggesting that changes in these genes experienced a fitness advantage in certain environments or conditions [49]. ccmB is involved in the synthesis and assembly of cytochrome c oxidase and is associated with the mitochondrial respiratory chain. It has also been reported to experience positive selection in the mitochondrial genome of Calophyllum [50].
The phylogenetic analyses on organelle genomes both suggested that M. pteleifolia is most closely related to Phellodendron amurense, followed by a cluster consisting of three Citrus species and Limonia Acidissima. The close evolutionary relationship between M. pteleifolia and P. amurense is consistent with the topological structure, as both species are native to eastern Asia. This study provides the first comprehensive analysis of the evolutionary relationships among the four species using mitogenomes. The accuracy of the phylogenetic relationship will be enhanced with the increasing availability of complete mitochondrial genomes from Rutaceae species.
5. Conclusions
In this study, we successfully assembled and annotated the mitochondrial genome and the cp genome of M. pteleifolia, conducting extensive analyses on the annotated genes. The mitochondrial genome of M. pteleifolia was circular, measuring 780,107 bp in length. We annotated 66 genes, which include 33 PCGs, 30 tRNAs, and 3 rRNAs. Comprehensive analyses were conducted on the gene composition, repeat sequences, codon preference, RNA editing sites, and Ka/Ks of the organellar genomes of M. pteleifolia. Gene conservation between the cpDNA and mtDNA was also observed in M. pteleifolia through the detection of gene transfer events. The Ka/Ks analysis of codon substitutions revealed that most coding genes have experienced negative selection, underscoring the conservation of mitochondrial genes throughout evolution. The phylogenetic analyses showed that M. pteleifolia is most closely related to Phellodendron amurense. This study offers comprehensive insights into the mitochondrial genome of M. pteleifolia and provides a basis for the future clarification of the evolutionary relationships within Rutaceae.
Supplementary Materials
The following supporting information can be downloaded at https://www.mdpi.com/article/10.3390/horticulturae11060628/s1. Table S1: The gene composition of the organelle genomes in Melicope pteleifolia. Table S2: The length of PCG, rRNA, and tRNA in the organelle genome of Melicope pteleifolia. Table S3: Tandem repeats in the organelle genomes in Melicope pteleifolia. Table S4: Dispersed repeats in the organelle genomes in Melicope pteleifolia. Table S5: Simple sequence repeats in the organelle genomes in Melicope pteleifolia. Table S6: RSCU values for the PCGs in the organelle genome of Melicope pteleifolia. Table S7: The prediction of RNA editing sites in the organelle genome of Melicope pteleifolia. Table S8: The homologous sequence of mtDNA and cpDNA in Melicope pteleifolia. Table S9: The nucleotide diversity (Pi) of mitochondrial and chloroplast genes in 6 closely related species. Table S10: The Ka/Ks values of mitochondrial and chloroplast PCGs in 6 closely related species.
Author Contributions
Conceptualization, L.G. and A.W.; methodology, Y.L. and J.H.; software, W.S. and K.G.; validation, L.H., D.X., J.Z. and A.W.; formal analysis, L.G. and K.G.; investigation, W.S., J.H., H.W. and P.L.; resources, H.W. and P.L.; data curation, W.S. and Y.L.; writing—original draft preparation, L.G.; writing—review and editing, L.G. and A.W.; visualization, L.G. and Y.L.; supervision, L.H., G.Z. and A.W.; project administration, G.Z. and A.W.; funding acquisition, G.Z. and A.W. All authors have read and agreed to the published version of the manuscript.
Funding
This research was funded by the National Natural Science Foundation of China (32260680); the China Agricultural Research System of the Ministry of Finance and the National Agricultural Research Center (CARS-21); the Guangxi self-funded forestry science and technology project of China (2023GXZCLK61); and the Melicope pteleifolia horizontal project of Guangxi University of China (KY03000033124007).
Institutional Review Board Statement
Not applicable.
Informed Consent Statement
Not applicable.
Data Availability Statement
The data supporting this study have been deposited in the GenBank database of the National Center for Biotechnology Information (NCBI) (https://www.ncbi.nlm.nih.gov/genbank/, accessed on 30 May 2025) with the following accession number: PQ221922 (cpDNA) and PQ221923 (mtDNA).
Conflicts of Interest
The authors declare no conflicts of interest.
Abbreviations
The following abbreviations are used in this manuscript:
| cp | chloroplast |
| mt | mitochondrial |
| bp | base pair |
| LSC | large single copy |
| SSC | small single copy |
| IR | inverted repeat |
| RSCU | relative synonymous codon usage |
| SSR | simple sequence repeats |
| Pi | nucleotide variability |
| PCGs | protein-coding genes |
| MTPT | mitochondrial plastid DNA |
| Ka | nonsynonymous substitutions |
| Ks | synonymous substitutions |
References
- Yao, Q.; Gao, Y.; Lai, C.; Wu, C.; Zhao, C.-L.; Wu, J.-L.; Tang, D.-X. The phytochemistry, pharmacology and applications of Melicope pteleifolia: A review. J. Ethnopharmacol. 2020, 251, 112546. [Google Scholar] [CrossRef] [PubMed]
- Deng, Q.; Huang, M.; Guo, L.; Hu, X. Effects and its mechanism of Evodia lepta on anti-inflammation and abirritation. China J. Exp. Tradit. Med. Formulae 2011, 17, 125. [Google Scholar]
- Kabir, M.F.; Mohd Ali, J.; Abolmaesoomi, M.; Hashim, O.H. Melicope ptelefolia leaf extracts exhibit antioxidant activity and exert anti-proliferative effect with apoptosis induction on four different cancer cell lines. BMC Complement. Altern. Med. 2017, 17, 252. [Google Scholar] [CrossRef] [PubMed]
- Bi, H.; Zhang, L.; Ren, L.; Yang, P. Study on the scavenging effect of evodia lepta on hydroxyl radical. J. Chin. Clin. Med. 2003, 4, 32–34. [Google Scholar]
- Nguyen, N.H.; Ha, T.K.Q.; Choi, S.; Eum, S.; Lee, C.H.; Bach, T.T.; Chinh, V.T.; Oh, W.K. Chemical constituents from Melicope pteleifolia leaves. Phytochemistry 2016, 130, 291–300. [Google Scholar] [CrossRef]
- Pang, H.; Yu, Y.H.; Tang, G.F. Protective effects of Evodia lepta extracts on experimental liver injury in mice. J. Guangxi Med. Univ. 2006, 23, 961–962. [Google Scholar]
- Flora of China Editorial Committee. Flora of China; The Chinese Academy of Sciences, Beijing Science Press: Beijing, China, 1997; pp. 59–63. [Google Scholar]
- Huang, X.; Coulibaly, D.; Tan, W.; Ni, Z.; Shi, T.; Li, H.; Hayat, F.; Gao, Z. The analysis of genetic structure and characteristics of the chloroplast genome in different Japanese apricot germplasm populations. BMC Plant Biol. 2022, 22, 354. [Google Scholar] [CrossRef]
- Li, Y.-X.; Li, Z.-H.; Schuiteman, A.; Chase, M.W.; Li, J.-W.; Huang, W.-C.; Hidayat, A.; Wu, S.-S.; Jin, X.-H. Phylogenomics of Orchidaceae based on plastid and mitochondrial genomes. Mol. Phylogenetics Evol. 2019, 139, 106540. [Google Scholar] [CrossRef]
- Wu, Z.; Wu, L.; Xing, J.; Li, Y.; Wang, Y.; Yao, H. The complete chloroplast genome of Melicope pteleifolia (Champ. ex Benth.) TG Hartley (Rutaceae). Mitochondrial DNA Part B 2021, 6, 1339–1340. [Google Scholar] [CrossRef]
- Yu, J.; Chen, L.; Mao, J.; Jin, X.; Shen, J. The complete chloroplast genome of Melicope pteleifolia (Rutaceae), a traditional medicinal plant in Southeast China. Mitochondrial DNA Part B 2021, 6, 60–61. [Google Scholar] [CrossRef]
- Abdel-Latif, A.; Osman, G. Comparison of three genomic DNA extraction methods to obtain high DNA quality from maize. Plant Methods 2017, 13, 1. [Google Scholar] [CrossRef] [PubMed]
- Li, H. Minimap2: Pairwise alignment for nucleotide sequences. Bioinformatics 2018, 34, 3094–3100. [Google Scholar] [CrossRef] [PubMed]
- Koren, S.; Walenz, B.P.; Berlin, K.; Miller, J.R.; Bergman, N.H.; Phillippy, A.M. Canu: Scalable and accurate long-read assembly via adaptive k-mer weighting and repeat separation. Genome Res. 2017, 27, 722–736. [Google Scholar] [CrossRef] [PubMed]
- Chan, P.P.; Lin, B.Y.; Mak, A.J.; Lowe, T.M. tRNAscan-SE 2.0: Improved detection and functional classification of transfer RNA genes. Nucleic Acids Res. 2021, 49, 9077–9096. [Google Scholar] [CrossRef]
- Kumar, S.; Stecher, G.; Tamura, K. MEGA7: Molecular evolutionary genetics analysis version 7.0 for bigger datasets. Mol. Biol. Evol. 2016, 33, 1870–1874. [Google Scholar] [CrossRef]
- Shapiro, J.A.; von Sternberg, R. Why repetitive DNA is essential to genome function. Biol. Rev. 2005, 80, 227–250. [Google Scholar] [CrossRef]
- Stern, D.B.; Palmer, J.D. Recombination sequences in plant mitochondrial genomes: Diversity and homologies to known mitochondrial genes. Nucleic Acids Res. 1984, 12, 6141–6157. [Google Scholar] [CrossRef]
- Li, Y.; Zhao, H.; Tan, H.; Liu, X.; Zhang, C.; Dong, Y. Analysis and comparison on characteristic of mitochondrial genome of eight plants. Biotechnol. Bull 2011, 10, 156–162. [Google Scholar]
- Zhou, P.; Zhang, Q.; Li, F.; Huang, J.; Zhang, M. Assembly and comparative analysis of the complete mitochondrial genome of Ilex metabaptista (Aquifoliaceae), a Chinese endemic species with a narrow distribution. BMC Plant Biol. 2023, 23, 393. [Google Scholar] [CrossRef]
- Guo, L.; Lao, G.; He, L.; Xiao, D.; Zhan, J.; Wang, A. De novo assembly and comparative analysis of mitochondrial genomes of two Pueraria montana varieties. Int. J. Mol. Sci. 2024, 25, 5656. [Google Scholar] [CrossRef]
- Castandet, B.; Araya, A. RNA editing in plant organelles. Why make it easy? Biochemistry 2011, 76, 924–931. [Google Scholar] [CrossRef] [PubMed]
- Stern, D.B.; Lonsdale, D.M. Mitochondrial and chloroplast genomes of maize have a 12-kilobase DNA sequence in common. Nature 1982, 299, 698–702. [Google Scholar] [CrossRef] [PubMed]
- Alverson, A.J.; Wei, X.; Rice, D.W.; Stern, D.B.; Barry, K.; Palmer, J.D. Insights into the evolution of mitochondrial genome size from complete sequences of Citrullus lanatus and Cucurbita pepo (Cucurbitaceae). Mol. Biol. Evol. 2010, 27, 1436–1448. [Google Scholar] [CrossRef] [PubMed]
- Torke, B.M.; Cardoso, D.; Chang, H.; Li, S.-J.; Niu, M.; Pennington, R.T.; Stirton, C.H.; Xu, W.-B.; Zartman, C.E.; Chung, K.-F. A dated molecular phylogeny and biogeographical analysis reveals the evolutionary history of the trans-pacifically disjunct tropical tree genus Ormosia (Fabaceae). Mol. Phylogenetics Evol. 2022, 166, 107329. [Google Scholar] [CrossRef]
- Fay, J.C.; Wu, C.-I. Sequence divergence, functional constraint, and selection in protein evolution. Annu. Rev. Genom. Hum. Genet. 2003, 4, 213–235. [Google Scholar] [CrossRef]
- Zhang, Z.; Li, J.; Zhao, X.-Q.; Wang, J.; Wong, G.K.-S.; Yu, J. KaKs_Calculator: Calculating Ka and Ks through model selection and model averaging. Genom. Proteom. Bioinform. 2006, 4, 259–263. [Google Scholar] [CrossRef]
- Miao, X.; Yang, W.; Li, D.; Wang, A.; Li, J.; Deng, X.; He, L.; Niu, J. Assembly and comparative analysis of the complete mitochondrial and chloroplast genome of Cyperus stoloniferus (Cyperaceae), a coastal plant possessing saline-alkali tolerance. BMC Plant Biol. 2024, 24, 628. [Google Scholar] [CrossRef]
- Kozik, A.; Rowan, B.A.; Lavelle, D.; Berke, L.; Schranz, M.E.; Michelmore, R.W.; Christensen, A.C. The alternative reality of plant mitochondrial DNA: One ring does not rule them all. PLoS Genet. 2019, 15, e1008373. [Google Scholar] [CrossRef]
- Xia, C.; Li, J.; Zuo, Y.; He, P.; Zhang, H.; Zhang, X.; Wang, B.; Zhang, J.; Yu, J.; Deng, H. Complete mitochondrial genome of Thuja sutchuenensis and its implications on evolutionary analysis of complex mitogenome architecture in Cupressaceae. BMC Plant Biol. 2023, 23, 84. [Google Scholar] [CrossRef]
- Janouškovec, J.; Liu, S.-L.; Martone, P.T.; Carré, W.; Leblanc, C.; Collén, J.; Keeling, P.J. Evolution of red algal plastid genomes: Ancient architectures, introns, horizontal gene transfer, and taxonomic utility of plastid markers. PLoS ONE 2013, 8, e59001. [Google Scholar] [CrossRef]
- Sloan, D.B.; Alverson, A.J.; Chuckalovcak, J.P.; Wu, M.; McCauley, D.E.; Palmer, J.D.; Taylor, D.R. Rapid evolution of enormous, multichromosomal genomes in flowering plant mitochondria with exceptionally high mutation rates. PLoS Biol. 2012, 10, e1001241. [Google Scholar] [CrossRef] [PubMed]
- Kan, S.-L.; Shen, T.-T.; Ran, J.-H.; Wang, X.-Q. Both Conifer II and Gnetales are characterized by a high frequency of ancient mitochondrial gene transfer to the nuclear genome. BMC Biol. 2021, 19, 146. [Google Scholar] [CrossRef] [PubMed]
- Kitazaki, K.; Kubo, T. Cost of having the largest mitochondrial genome: Evolutionary mechanism of plant mitochondrial genome. J. Bot. 2010, 2010, 620137. [Google Scholar] [CrossRef]
- Yu, F.; Bi, C.; Wang, X.; Qian, X.; Ye, N. The complete mitochondrial genome of Citrus sinensis. Mitochondrial DNA Part B 2018, 3, 592–593. [Google Scholar] [CrossRef] [PubMed]
- Liu, J.; Yu, S.; Lü, P.; Gong, X.; Sun, M.; Tang, M. De novo assembly and characterization of the complete mitochondrial genome of Phellodendron amurense reveals three repeat-mediated recombination. Gene 2024, 935, 149031. [Google Scholar] [CrossRef] [PubMed]
- Qi, W.-H.; Jiang, X.-M.; Du, L.-M.; Xiao, G.-S.; Hu, T.-Z.; Yue, B.-S.; Quan, Q.-M. Genome-wide survey and analysis of microsatellite sequences in bovid species. PLoS ONE 2015, 10, e0133667. [Google Scholar] [CrossRef]
- Hong, C.P.; Piao, Z.Y.; Kang, T.W.; Batley, J.; Yang, T.-J.; Hur, Y.-K.; Bhak, J.; Park, B.-S.; Edwards, D.; Lim, Y.P. Genomic distribution of simple sequence repeats in Brassica rapa. Mol. Cells 2007, 23, 349–356. [Google Scholar] [CrossRef]
- Stam, M.; Belele, C.; Dorweiler, J.E.; Chandler, V.L. Differential chromatin structure within a tandem array 100 kb upstream of the maize b1 locus is associated with paramutation. Genes Dev. 2002, 16, 1906–1918. [Google Scholar] [CrossRef]
- Lisch, D. How important are transposons for plant evolution? Nat. Rev. Genet. 2013, 14, 49–61. [Google Scholar] [CrossRef]
- Veilleux, R.E.; Mills, K.P.; Baxter, A.J.; Upham, K.T.; Ferguson, T.J.; Holt, S.H.; Lu, N.; Ruiz-Rojas, J.J.; Pantazis, C.J.; Davis, C.M. Transposon tagging in diploid strawberry. Plant Biotechnol. J. 2012, 10, 985–994. [Google Scholar] [CrossRef]
- Choi, K.-S.; Park, S. Complete plastid and mitochondrial genomes of Aeginetia indica reveal intracellular gene transfer (IGT), horizontal gene transfer (HGT), and cytoplasmic male sterility (CMS). Int. J. Mol. Sci. 2021, 22, 6143. [Google Scholar] [CrossRef] [PubMed]
- Wei, L.; Liu, T.-J.; Hao, G.; Ge, X.-J.; Yan, H.-F. Comparative analyses of three complete Primula mitogenomes with insights into mitogenome size variation in Ericales. BMC Genom. 2022, 23, 770. [Google Scholar] [CrossRef] [PubMed]
- Wang, D.; Wu, Y.-W.; Shih, A.C.-C.; Wu, C.-S.; Wang, Y.-N.; Chaw, S.-M. Transfer of chloroplast genomic DNA to mitochondrial genome occurred at least 300 MYA. Mol. Biol. Evol. 2007, 24, 2040–2048. [Google Scholar] [CrossRef]
- Bergthorsson, U.; Adams, K.L.; Thomason, B.; Palmer, J.D. Widespread horizontal transfer of mitochondrial genes in flowering plants. Nature 2003, 424, 197–201. [Google Scholar] [CrossRef]
- Hao, W.; Liu, G.; Wang, W.; Shen, W.; Zhao, Y.; Sun, J.; Yang, Q.; Zhang, Y.; Fan, W.; Pei, S. RNA editing and its roles in plant organelles. Front. Genet. 2021, 12, 757109. [Google Scholar] [CrossRef] [PubMed]
- Ichinose, M.; Sugita, M. RNA editing and its molecular mechanism in plant organelles. Genes 2016, 8, 5. [Google Scholar] [CrossRef]
- Small, I.D.; Schallenberg-Rüdinger, M.; Takenaka, M.; Mireau, H.; Ostersetzer-Biran, O. Plant organellar RNA editing: What 30 years of research has revealed. Plant J. 2020, 101, 1040–1056. [Google Scholar] [CrossRef]
- Han, K.; Shi, C.; Li, L.; Seim, I.; Lee, S.M.Y.; Xu, X.; Yang, H.; Fan, G.; Liu, X. Lineage-specific evolution of mangrove plastid genomes. Plant Genome 2020, 13, e20019. [Google Scholar] [CrossRef]
- Cadorna, C.A.E.; Pahayo, D.G.; Rey, J.D. The first mitochondrial genome of Calophyllum soulattri Burm. f. Sci. Rep. 2024, 14, 5112. [Google Scholar] [CrossRef]
Disclaimer/Publisher’s Note: The statements, opinions and data contained in all publications are solely those of the individual author(s) and contributor(s) and not of MDPI and/or the editor(s). MDPI and/or the editor(s) disclaim responsibility for any injury to people or property resulting from any ideas, methods, instructions or products referred to in the content. |
© 2025 by the authors. Licensee MDPI, Basel, Switzerland. This article is an open access article distributed under the terms and conditions of the Creative Commons Attribution (CC BY) license (https://creativecommons.org/licenses/by/4.0/).