Abstract
Meat and bone meal (MBM) is a product of the rendering industry, which is looking for high-value applications of rendered animal proteins (RAP). The objective of this research was to utilize MBM as a nitrogen source to produce astaxanthin (AX) by Xanthophyllomyces dendrorhous and quantify the bioavailability of MBM as a potential substitution of commercial nitrogen sources (i.e., yeast extract and peptone). To conduct yeast fermentation under the optimal glucose loading, the C/N ratio was optimized to achieve maximum AX content. MBM was hydrolyzed by using proteinase and alkaline (Ca(OH)2) for 4, 8, and 16 h with different enzyme and alkaline loadings to produce MBM hydrolysates (MBMHs). The MBMHs were directly fermented by X. dendrorhous under the optimum glucose concentration. Experimentally, the optimum medium contained 40 g/L glucose, 5 g/L peptone, and 3 g/L yeast extract, where AX content of 3.69 mg/g dry cell mass was achieved. MBMHs were used by X. dendrorhous as a nitrogen source, while fermentation with lyophilized MBMHs was generated using proteinase K. This resulted in a maximum AX content of 1.58 mg/g dry cell mass. This research exhibits the feasibility of using MBM as a nitrogen source to produce AX with X. dendrorhous.
1. Introduction
In 2020, over 24.75 million tons of meat and bone meal (MBM) was generated by the rendering industry in the U.S. [1]. MBM is one of the major products from the rendering industry, and is extensively used for animal feed and pet food. Due to the vast volume of MBM generated annually and the desire for added market value, the development of novel high-value applications of MBM has sparked increasing research interests. In terms of its chemical composition, MBM is nutritious and rich in protein, trace elements (e.g., phosphate and calcium), and fat [2]. With this compositional profile, MBM can be used in a variety of value-added products, such as a secondary fuel for combustion [3], cement kilns [4], renewable flocculants [5], and fertilizers [6].
Given its high protein content, MBM has been studied as a substitute for commercial yeast extract and peptone as a nitrogen source to support microbial growth and produce value-added cellular products. Garcia et al. characterized various peptones derived from different types of animal meal hydrolysates and found that MBM hydrolysates (MBMHs) exhibited equivalent viscosity properties in media preparation to commercial peptone; as such, they suggested that MBMHs could be a potential substitute for commercial peptone [7]. Further work by Garcia et al. was conducted to hydrolyze rendered animal protein using alkaline (Ca(OH)2) and to enzymatically generate water-soluble small peptides, which they suggested could be used in non-feed applications [8] such as yeast extracts and peptone substitutes. Moreover, Liang et al. compared commercial yeast extract with rendered protein hydrolysates (RPHs) as a nitrogen source for Pythium irregulare (ATCC 10951) fermentation [9]. They found that the fermentation performance of RPHs was comparable to yeast extract, i.e., RPHs had slightly lower eicosapentaenoic acid (EPA) production than yeast extract while achieving a higher specific cell growth rate and cell mass productivity [9]. All these research results illustrate that rendered proteins are promising low-cost alternative nitrogen sources for microbial bioprocessing.
Astaxanthin (3,3′-dihydroxy-β, β′-carotene-4,4′-dione) (AX) belongs to the carotenoid family, and has long been considered one of the most powerful natural antioxidants; it has been used in nutraceuticals, cosmetics, animal feed, and fish food [10]. It can be produced through both chemical and biological synthesis methods. Two major microbial strains have been used to produce AX commercially, including Haematococcus pluvialis (microalga) and Xanthophyllomyces dendrorhous (yeast, previously Phaffia rhodozyma). Research efforts are ongoing to make natural AX more affordable, including strain development (e.g., exploration of new and genetic modified strains) and process optimization (e.g., operation conditions and media) [11]. In comparison, cultivation of X. dendrorhous has more flexibility in carbon and nitrogen source selection and high efficiency in AX production, with a shorter fermentation period, which makes X. dendrohous a preferable producer for natural AX [12]. For example, X. dendrorhous can utilize both organic and inorganic nitrogen sources, meaning that cheaper inorganic nitrogen sources (e.g., ammonium sulfate, ammonium chloride, and potassium nitrate) could be used in replace of yeast extract and peptone to reduce the cost of natural AX [13]. On the other hand, AX is a secondary metabolite of X. dendrohous, and its production can be significantly influenced by the carbon to nitrogen (C/N) ratio. Excessive carbon (high C/N ratio) can enhance the cell growth, while a low C/N ratio favors the AX accumulation [14]. Therefore, the C/N ratio is an important factor in the fermentation performance of X. dendrohous. In addition, the supplement of trace vitamins and minerals to the medium has been reported to promote cell growth and AX production of X. dendrorhous, such as biotin, calcium pantothenate, thiamin, cobalamin, and inositol [15]. As a result, MBM could serve as an inexpensive nitrogen source while providing other nutritious ingredients to enrich the medium and support X. dendrorhous growth for AX production.
Therefore, the present research aims at the utilization of MBM as an alternative nitrogen source to yeast extract and peptone for producing AX with X. dendrorhous. The respective optimum loadings of glucose, yeast extract, and peptone to maximize AX production were first determined, and served as reference C and N loadings for determining the amount of MBM needed to replace yeast extract and peptone. To improve the digestibility and availability of MBM proteins, the MBM was hydrolyzed using alkaline and enzymes to prepare MBMHs as a nitrogen source for X. dendrorhous. In addition, vitamin and mineral supplementation was investigated for further enhancement of X. dendrorhous cell growth and AX production. This study is expected to demonstrate the possibility of using MBM as a low-cost nitrogen source to replace yeast extract and peptone in the production of affordable natural AX.
2. Materials and Methods
2.1. Meat and Bone Meal and Chemicals
MBM was provided by the Animal Co-Products Research and Education Center, Clemson University. It consisted of (on a dry weight basis) 50.4% crude protein, 10.0% fat, 10.3% calcium, and 5.1% phosphorus. The four types of proteinases used for MBM hydrolysis were purchased from Sigma Aldrich (St. Louis, MO, USA), including Flavourzyme® from Aspergillus oryzae (P6110), Alcalase® 2.4L from Bacillus licheniformis (P4860), proteinase K from Tritirachium album (P8044), and alkaline protease from B. licheniformis (P8038). Yeast nitrogen base (YNB) without amino acids or ammonium sulfate (BD 233520) was purchased from Fisher Scientific (Hampton, NH, USA), as were all other chemicals unless otherwise specified.
2.2. Microbial Cultivation
X. dendrorhous (ATCC 74219) was purchased from the American Type Culture Collection (ATCC, Manassas, VA, USA). Cells were cultivated in yeast malt broth (YMB) medium, which per liter contained 3 g of yeast extract, 3 g of malt extract, 10 g of glucose, and 5 g of peptone. To prepare the agar plates, 2% agar was added to the YMB medium. All media were autoclaved at 121 °C for 15 min prior to use. Following the ATCC protocol, the stock culture was used to prepare a seed culture which was cultivated in YMB medium at 25 °C and 200 rpm in an incubator (New Brunswick, Innova 4300, Edison, NJ, USA) for 48 h. An aliquot of 1 mL seed culture was transferred into fresh YMB medium (inoculation size = 1%, v/v) and incubated under the same conditions for seed culture preparation until the optical density (OD) at λ = 600 nm (OD600) reached 0.5. The cells were harvested by centrifugation at 1800× g for 5 min at 4 °C. The pellets were washed three times using sterilized deionized distilled water (DDI) and resuspended in DDI water to prepare the inoculum for fermentation. All these operations were carried out aseptically.
2.3. Optimization of Carbon-to-Nitrogen (C/N) Ratio on Astaxanthin Production
2.3.1. Effect of Glucose Loading on Astaxanthin Production
Glucose was the only carbon source in the YMB medium; a series of glucose concentrations (20, 40, 60, 80, and 100 g/L) were tested to determine the optimum glucose concentration with constant nitrogen loading (3 g/L yeast extract + 5 g/L peptone). The culture inoculation size was 1% (v/v) with a working volume of 200 mL in 1 L flasks. The flasks were incubated at 25 °C and pH5.0 with shaking at 200 rpm. During fermentation, aliquots of 5 mL fermentation broth were collected every 24 h until the end of fermentation at 120 h. Both OD600 and dry cell mass (DCM) were measured to reflect cell growth. Glucose concentration and AX content (mg/g DCM) were analyzed using high-pressure liquid chromatography (HPLC). All experiments were duplicated unless otherwise specified.
2.3.2. Effect of Nitrogen Loading on Astaxanthin Production
In the glucose loading study (Section 2.3.1), a glucose concentration of 40 g/L was determined as the optimum value to achieve the highest AX content (mg/g DCM). As such, it was used to determine the optimum nitrogen loading (i.e., yeast extract + peptone, g/L). The nitrogen source was supplied by adding both yeast extract and peptone while keeping the ratio of yeast extract/peptone constant at 3:5 (g/g) (Table 1). The C/N ratio by element was the actual carbon to nitrogen elemental ratio, while the “C/N” ratios by weight (i.e., “C/N” = glucose/(yeast extract + peptone), g/g) were 5, 10, 15, 20, and 25. The sample analysis, inoculation procedures, and other conditions were the same as in Section 2.3.1.

Table 1.
Medium profile for the nitrogen loading study (Section 2.3.2).
2.4. Meat and Bone Meal Fermentation
2.4.1. MBM Defatting
Prior to hydrolysis, MBM was defatted to prevent soap formation during alkaline hydrolysis. Soxhlet extraction was used for defatting, with hexane as a solvent. Each extraction thimble contained 25 g of dry MBM, and the hexane was loaded at the ratio of 15:1 (hexane/MBM, v/w). The extraction lasted 6 h, and the extraction speed was adjusted to six cycles per hour. The weight difference before and after extraction was calculated as the total fat content of MBM.
2.4.2. Enzymatic and Alkaline Hydrolysis of Meat and Bone Meal
Defatted MBM was hydrolyzed by alkaline and enzymes using the hydrolysis conditions listed in Table 2. This hydrolysis was carried out following the protocol published by Garcia et al. [8] and Liang et al. [9]. At the end of alkaline hydrolysis, CO2 was sparged into MBM hydrolysate until the pH dropped to 9. Sulfuric acid was then added to further reduce the pH to 7. In enzymatic hydrolysis, the reaction was terminated by heating the hydrolysate to 90 °C to deactivate the enzymes. After hydrolysis, the mixture was centrifuged at 11,250× g and 4 °C for 5 min and the supernatants containing MBMHs were collected and stored at 4 °C until used for fermentation.
Table 2.
Hydrolysis conditions of meat and bone meal.
2.4.3. Astaxanthin Fermentation with Meat and Bone Meal Hydrolysates
In this study, MBMHs obtained in Section 2.4.2 were directly used as a nitrogen source for X. dendrohous fermentation. Glucose was the only carbon source for fermentation; a concentration of 40 g/L (determined as described in Section 2.3.1) was used for fermentation with 50 mL of MBMHs. This served as the nitrogen source, replacing yeast extract and peptone. Glucose was directly mixed with MBMHs, and the pH was adjusted to 5 using 1 N HCl. The mixture was then added into 250 mL flasks with a working volume of 50 mL. The inoculation size and other cultivation conditions were the same as in Section 2.3.1. In a separate fermentation group with MBMHs, YNB mineral supplement was used to enhance cell growth and AX production. YNB mineral supplement is a commercial mineral solution that includes vitamins (biotin, thiamine hydrochloride, etc.), trace elements (boric acid, copper sulfate, etc.), and salts (sodium chloride, magnesium sulfate, etc.).
2.4.4. Astaxanthin Fermentation with Lyophilized Meat and Bone Meal Hydrolysates
In light of the practical applications, the MBMH was lyophilized to produce lyophilized meat and bone meal hydrolysate (LMBMH) powder and used as a nitrogen source for comparison with yeast extract and peptone. Freeze-drying may change the digestibility of MBMHs; therefore, the LMBMHs were compared with MBMHs for AX fermentation. For example, flocculant-like substances were formed in MBMH fermentation and were not formed in LMBMH fermentation, which was found to affect fermentation regarding cell growth and AX production. Therefore, the MBMHs from Section 2.4.2 were freeze-dried to concentrate the hydrolysates and obtain LMBMHs. The LMBMHs were stored at −20 °C in a sealed glass bottle until used as a nitrogen source, then compared with yeast extract and peptone for astaxanthin fermentation. Glucose concentration was maintained at 40 g/L, and the other fermentation conditions were the same as in Section 2.4.3. Based on the measured nitrogen content of LMBMHs, a certain amount of LMBMH was added to the fermentation medium to achieve the same nitrogen content as the control group, which had 5 g/L peptone and 3 g/L yeast extract. In addition, in order to study the effects of YNB supplementation, another group using LMBMHs for fermentation was carried out with YNB supplement added.
2.5. Analytical Methods
Cell growth and glucose consumption were monitored every day during fermentation. Cell growth was monitored by OD600, which was analyzed on a microplate spectrophotometer (BioTek Epoch 2, Winooski, VT, USA), while the DCM was measured using the gravimetric method [16]. In brief, 4 mL of fermentation broth was centrifuged at 1800× g for 5 min (Super T21, Sorvall Instruments, Newtown, CT, USA) and the cell pellet was washed three times using DDI water. Afterwards, the pellet was further washed by filtration through a preweighted 0.45 μm filter paper. The washed cell pellet was dried in an oven overnight at 105 °C. The DCM was then calculated by correcting the weight of filter paper. The correlation curve (OD600 vs. DCM) was established and used to calculate DCM for monitoring cell growth during fermentation, with the OD600 being measured as well.
The nitrogen contents of MBMHs, LMBMHs, yeast extract, and peptone were determined using a nitrogen analyzer (FP928, LECO Corporation, Saint Joseph, MI, USA). The conversion factor for nitrogen content to protein content is 6.25 [17]. Glucose quantification was performed on an HPLC (Shimadzu LC-20AB LC, Shimadzu Scientific Instruments, NJ, USA) system equipped with a reflective index detector and an analytical carbohydrate column (Rezex ROA organic acid H+, Phenomenex Inc., Torrance, CA, USA). The mobile phase was 0.005 N sulfuric acid, and the flow rate was set at 0.6 mL/min. The separation temperature was 60 °C. Fermentation broth samples were centrifuged at 44,950× g for 2 min, and the supernatants were filtered through 0.45-μm filters into HPLC vials for analysis.
At the end of fermentation, the cells were collected by centrifugation at 1800× g for 30 min. The supernatant was discarded and the cell pellet was washed three times with DDI water for, freeze-dried, and stored at −20 °C until use. To measure the cellular AX content, 20 mg of the freeze-dried cell sample was mixed with 5 mL dimethyl sulfoxide (DMSO) and vortexed for 30 s for AX extraction in the presence of glass beads to aid in cell disruption. The mixture was heated at 55 °C for 20 min followed by centrifugation at 1800× g for 20 min and the supernatant was collected. This extraction step was repeated until the cell biomass became colorless. All DMSO extracts were combined and subjected to AX analysis on an HPLC (1100 Series HPLC, Agilent Technologies, Santa Clara, CA, USA) system equipped with a diode array detector and an analytical column (ZORBAX Eclipse Plus C18, Agilent Technologies, Santa Clara, CA, USA) following an existing method [18]. The mobile phase was a mixture of acetonitrile, methanol, dichloromethane, and 1% formic acid, and the flow rate was 1.5 mL/min. The signals were recorded at wavelength of 470 nm and 25 °C. AX production was reported as the AX content (mg/g DCM) and concentration (mg/L).
2.6. Data Analysis
Statistical significance was determined by analysis of variance (ANOVA) and Tukey’s test using JMP Pro 15 (JMP Statistical Discovery LLC, Cary, NC, USA) with α = 0.05. All treatments were duplicated in this study unless otherwise specified.
3. Results and Discussion
3.1. Effect of Glucose Loading on Astaxanthin Production
Figure 1 shows the time course of cell growth, glucose consumption, and astaxanthin accumulation at different glucose concentrations. Overall, the cell growth increased with time during fermentation for 120 h at all glucose concentrations, demonstrating a typical microbial cell growth pattern, including lag, exponential, and stationary phases (death phase not recorded) (Figure 1A). Higher initial glucose concentration achieved higher cell growth rate and maximum DCM. The lag phase lasted for about 24 h for all glucose concentrations, and the length of the exponential phase was dependent on the glucose concentration. The cell growth did not show much difference among glucose concentrations during the first 72 h. However, cells stopped growing and entered the stationary phase after 72 h at 20 g/L glucose, with a maximum DCM of 4.96 g/L. Cells continued growing until 96 h at 40 and 60 g/L glucose, reaching peak DCMs of 8.23 and 8.70 g/L, respectively, followed by the stationary phase. Further increasing the glucose concentration to 80 and 100 g/L extended the exponential phase to 120 h and achieved maximum DCMs of 10.17 and 12.75 g/L, respectively.
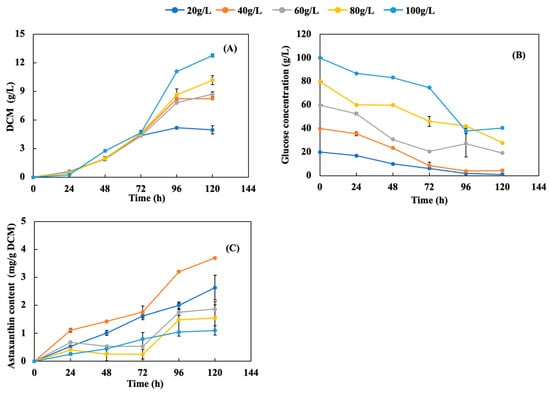
Figure 1.
Effects of glucose concentration on (A) cell growth, (B) glucose consumption, and (C) astaxanthin content. Nitrogen loading was kept constant with 3 g/L yeast extract +5 g/L peptone under different glucose concentrations of 20, 40, 60, 80, and 100 g/L. The temperature, pH, and shaking speed were 25 °C, pH 5.0, and 200 rpm, respectively.
As shown in Figure 1B, glucose consumption during fermentation followed a similar trend for all initial glucose concentrations, i.e., a rapid and continuous decrease of glucose concentration during the first 72 h (for 20, 40, and 60 g/L glucose) or 96 h (for 80 and 100 g/L glucose) followed by a slow change until 120 h. The variation in the glucose substrate was consistent with the cell growth and phase transition (Figure 1A,B), i.e., higher initial glucose led to a longer exponential phase. In addition, higher initial glucose concentrations led to higher residual glucose. For both 20 and 40 g/L initial glucose, almost all of the glucose was consumed, while 30−40% of glucose remained unused for 60, 80, and 100 g/L initial glucose. This could be caused by C/N unbalance (i.e., nitrogen deficiency), especially in the stationary phase under high initial glucose concentration. The slight glucose consumption during the stationary phase was likely used for cell maintenance and/or accumulation of cellular compounds (e.g., AX and lipids). The limited amount of nitrogen could be a reason for this inhibition of cell growth, even though there was residual glucose; the nitrogen source is indispensable for protein synthesis for cell formation, and the carbon source provides carbon and energy for cell growth. The relative carbon and nitrogen contents (i.e., C/N ratio) should be balanced to maximize cell growth. Therefore, Figure 1A,B could indicate that the carbon source in this study was excessive when the glucose concentration exceeded 40 g/L with constant yeast extract (3 g/L) and peptone (5 g/L) loadings. This observation is consistent with Stoklosa et al. [19], who found that excessive sugar loading did not allow for complete sugar metabolism by X. dendrorhous under conditions involving nitrogen limitation.
The respective cellular AX contents for each glucose concentration are shown in Figure 1C. It was observed that the fermentation broth underwent a distinct color change from light yellow to orange and eventually red towards the end of fermentation, indicating carotenoid accumulation in cells. Overall, the AX content increased with time during fermentation, and the AX accumulation rate increased as the initial glucose concentration being increased from 20 to 40 g/L. Further increasing the initial glucose concentration from 60 to 100 g/L reduced the AX accumulation rate (Figure 1C). In addition, the maximum AX content at 120 h increased from 2.63 and 3.4 mg AX/g DCM for 20 and 40 g/L initial glucose, respectively, while the AX content decreased significantly to 1.86–1.10 mg AX/g DCM, respectively, when the initial glucose concentration was increased to 60–100 g/L. AX synthesis is growth-associated, meaning that higher DCM from higher initial glucose concentrations (Figure 1A) should be accompanied by higher AX production. However, the results in Figure 1A,C show that high glucose concentration is not necessary to simultaneously achieve both high cell mass and AX content, which could be due to restricted oxygen uptake and limited nitrogen.
Under high initial glucose concentrations (e.g., over 40 g/L), dissolved oxygen (DO) in the media can be reduced to a level that inhibits AX synthesis. In order to maintain a high level of AX production, enough DO to eliminate or reduce the Crabtree effect is necessary [14,20]. From the aspect of intracellular energy transformation, NADH plays the role of a preliminary electron carrier for intercellular adenosine triphosphate (ATP) production [21]. Due to the restriction of DO, respiration is restricted and NADPH accumulation can happen, meaning that insufficient utilization of energy causes repression of AX production [14]. In addition, an oxygen molecule is incorporated into the astaxanthin molecule, serving as a substrate material required for AX biosynthesis. Therefore, sufficient DO is important to enhance AX production by preventing NADPH accumulation and repression and by providing oxygen as a starting material for AX synthesis. In addition to oxygen, the C/N ratio can affect AX production, with a high C/N ratio usually conducive to high AX production. Sufficient nitrogen is critical for amino acid and/or protein synthesis, which requires NADPH to support cell growth, i.e., nitrogen depletion can lead to global inhibition of amino acid and/or protein synthesis [21]. Meanwhile, AX synthesis is a secondary metabolism and requires a large amount of NADPH. With a proper C/N ratio, most NADPH is prioritized for primary metabolism, such as cell anabolism to synthesize proteins for cell growth, which reduces the amount of NADPH available for AX production. Thus, an increased C/N ratio could increase the amount of NADPH available for AX production. However, an excessive C/N ratio could result in an inhibitory effect on AX synthesis due to repression of the lycopene-to-β-carotene and β-carotene-to-astaxanthin steps in the pathway [22]. As a result, the C/N ratio should be well controlled to achieve a trade-off between cell growth and AX production by X. dendrorhous. Fed-batch fermentation could be a good operating strategy to replace batch fermentation in order to achieve high cell growth and AX production simultaneously through decoupling the optimization of cell growth and AX production in two stages. In this study, 40 g/L of glucose was the most favorable initial concentration for AX production, even though it did not achieve the highest cell growth. Thus, it was selected for the subsequent study on the effects of nitrogen loading.
3.2. Effects of Nitrogen Loading on Astaxanthin Production
At a fixed initial glucose concentration of 40 g/L, increasing the C/N ratio from 5 to 25 decreased DCM and growth rate, extended the length of the lag phase, and shortened the exponential phase (Figure 2A). For instance, the lag phase was about 24 h for C/N ratios of 5, 10, and 15, while it increased to 48 h at C/N ratios of 20 and 25. The exponential phase for C/N ratios of 5 and 10 lasted about 96 h, from 24 to 120 h, while it was shortened to 72 h for C/N ratios of 15 and 20 and to 48 h for a C/N ratio of 25. The maximum DCM of 8.23 g/L was achieved at a C/N ratio of 5 after 120 h, while the increase of the C/N ratio to 25 resulted in the lowest cell biomass of 2.57 g/L due to insufficient N for protein synthesis for cell growth. According to Figure 1A and Figure 2A, a balanced C/N ratio is more important than N concentration in terms of its effect on cell growth. Both overdose and underdose of N can inhibit cell growth, causing low DCM, meaning that there must be an optimum N concentration for each level of carbon concentration to achieve maximum cell growth [23,24]. Therefore, both carbon and nitrogen concentrations need to be optimized simultaneously to maximize DCM. In this study, the optimum C/N ratio was 5 under a fixed glucose concentration of 40 g/L with 3 g/L yeast extract and 5 g/L peptone.
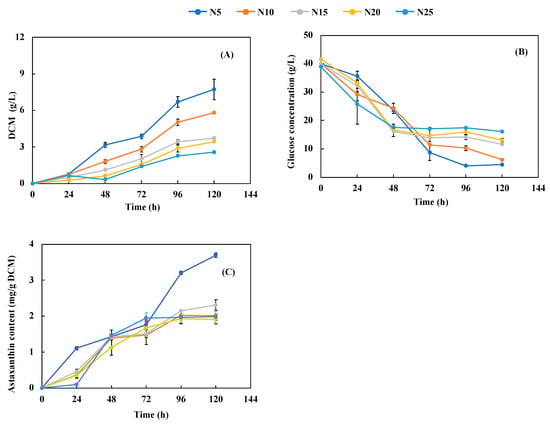
Figure 2.
Effects of nitrogen loading on (A) cell growth, (B) glucose consumption, and (C) astaxanthin content. The definition of NX (X = 5, 10, 15, 20, and 25) is shown in Table 1. The glucose concentration was 40 g/L. The temperature, pH, and shaking speed were 25 °C, pH 5.0, and 200 rpm, respectively.
As shown in Figure 2B, glucose titer was monitored along with time course, while a higher C/N ratio (i.e., lower N concentration) had lower total glucose consumption and higher residual glucose concentration. At the beginning of fermentation, the glucose concentration decreased rapidly for all N concentrations, followed by a negligible change after 48 h for C/N ratios of 15, 20, and 25 (about 40% of the glucose remained unutilized) and after 96 h for C/N ratios of 5 and 10 (about 13% glucose left) until the end of 120 h. These results were consistent with the cell growth shown in Figure 2A, i.e., more cell growth consumed more glucose and increased N concentration led to an increase in both cell growth and glucose consumption. Thus, a proper C/N ratio is critical to achieving high cell growth with a high substrate utilization rate.
Overall, the cellular AX content increased with time during fermentation and was significantly affected by the C/N ratio. The highest N concentration (i.e., the lowest C/N ratio of 5) resulted in the highest AX accumulation rate and AX content of 3.67 mg/g DCM at 96 h (Figure 2C). In a comparison of AX production between C/N ratios of 5 and 10–25, a higher C/N ratio was found to slow down AX accumulation and reduce AX content. In addition, AX content for C/N ratios of 10–25 showed insignificant change after 72 or 96 h of fermentation. The reduction of AX production and DCM could indicate nitrogen deficiency. ATP-citrate lyase (ACL) is an enzyme that supplies acetyl-CoA for carotenoid accumulation in X. dendrorhous, and the production of AX is subject to ACL activity [25]. Nitrogen depletion may cause the reduction of ACL activity, thereby repressing AX production [25]. As hypothesized by Chávez-Cabrera et al., there may be a second isoform of ACL that affects the balance between lipid and carotenoid synthesis and drives the metabolism pathway toward lipid over carotenoid production upon nitrogen deficiency, thereby reducing AX production [25,26]. In addition, the C/N ratio can cause differences in the proteomics profile. Wang et al. reported that a high C/N ratio (e.g., 76/1) led to significant alteration in expression of nine proteins involved in the synthesis of AX and reduced cellular AX content [27]. According to Figure 2A,C, the optimum N concentration was 8 g/L (3 g/L yeast extract and 5 g/L of peptone) with the glucose concentration being fixed at 40 g/L, which achieved both the highest cell growth and AX content. In fed-batch operation, the C/N ratio could be manipulated to achieve high cell growth under lower C/N ratios in the first stage and high AX content under higher C/N ratio at the second stage, as suggested in [14].
3.3. Astaxanthin Production with Meat and Bone Meal Hydrolysates (MBMHs) as Nitrogen Sources
Under different hydrolysis methods, the time (4 and 8 h) had little effect on the yield of MBMHs in terms of nitrogen content (Table 3). In comparison, alkaline hydrolysis was more efficient than enzymatic hydrolysis, and achieved MBMHs with higher nitrogen content of 2.9–3.1% within 4–8 h, while enzymatic MBMHs had nitrogen contents of 1.8–2.3% at 4 h and 1.9–2.8% at 8 h, varying by enzyme source and hydrolysis time. In contrast, hydrolysis time was found to have a significant effect on enzymatic hydrolysis of poultry byproducts for nitrogen generation in a study by Taheri et al. [28], which could be because the hydrolysis time used in this research was much longer.
Table 3.
Meat and bone meal hydrolysate fermentation results.
Alkaline and enzymatic MBMHs were used as nitrogen sources for X. dendrorhous fermentation to produce AX at 40 g/L glucose. YNB solution was used to supplement the fermentation media to stimulate cell growth and AX production [29]. The DCM, residual glucose concentration, and AX content after 120 h of fermentation were all measured (Table 3). Different MBMHs exhibited different abilities with respect to supporting cell growth. X. dendrorhous was unable to grow in the media with certain enzymatic MBMHs, including AM4, AM8, FM4, Pb4, and Pk4, which could be due to inhibition caused by unknown inhibitors in these MBMHs. However, X. dendrorhous could grow very well with other MBMHs, including FM8, Pb8, Pk8, and CM4/8/16, and achieved DCMs of 2.3, 3.1, 5.0, and 4.7/3.1/5.7 g/L, respectively. Hence, except for AM, time (i.e., 8 h) was critical in enzymatic hydrolysis of MBM to prepare consumable MBMHs to support cell growth, while all selected time periods (4, 8, and 16 h) for alkaline hydrolysis with Ca(OH)2 worked well to prepare amenable MBMHs to support cell growth. It was observed that Pk8 resulted in the highest DCM (5.0 g/L) among all MBMHs except for CM16 (DCM of 5.7 g/L), even though its nitrogen content was the lowest. However, CM16 took twice as long (16 h vs. 8 h) as Pk8 to achieve only 0.7 g/L more DCM. Therefore, the nitrogen source seems to be more important than the nitrogen content in achieving a high DCM of X. dendrorhous. YNB supplementation enhanced cell growth to the extent of 6% (YCM8)~350% (YFM8), varying with the type of MBMHs (Table 3), as compared to fermentation without YNB supplementation. It was noticed that FM8 had the lowest DCM (2.3 g/L), while YFM8 increased DCM to 10.2 g/L, the highest improvement. This finding suggests that YNB could have a synergistic effect with FM8. However, AM4, AM8, FM4, Pb4, and Pk4 did not have any cell growth even in the presence of YNB (YAM4, YAM8, YFM4, YPb4, and YPk4).
With the same initial glucose concentration of 40 g/L, a higher residual glucose concentration means less glucose was consumed. Overall, MBMHs that achieved higher DCM had lower residual glucose (Table 3). For instance, FM8 (DCM = 2.3 g/L) and CM16 (DCM = 5.7 g/L) had 16 and 13 g/L residual glucose, respectively. Meanwhile, alkaline MBMHs appeared to have higher glucose utilization efficiency than their enzymatic counterparts, achieving higher DCM with similar or even lower glucose consumption, e.g., CM4 and CM16 vs. Pb8. Supplementation with YNB resulted in less residual glucose compared to MBMHs without YNB, which could be because YNB promoted cell growth, which led to more glucose being consumed. However, cell growth and glucose consumption were not consistent between different MBMHs in the presence of YNB, i.e., higher DCM did not cause lower residual glucose. For example, YFM8 achieved 10.2 g/L DCM, higher than the other MBMHs with YNB except for YCM4 and YCM16, while it had the highest residual glucose of 17.5 g/L among all MBMHs with YNB. This result indicates that YNB can enhance carbon utilization efficiency by a synergistic effect with MBMHs to stimulate cell growth.
The different methods used to prepare MBMHs had significant impacts on AX production (Table 3). Cellular AX contents varied greatly among all MBMHs, from almost 0 (e.g., AM4) to 1.02 (CM4) mg/g, and all three alkaline MBMHs achieved significantly higher AX contents that enzymatic MBMHs. Of the enzymatic MBMHs, Pk8 led to the highest AX content (0.75 mg/g), while CM4 achieved the highest AX content (1.02 mg/g) among all alkaline MBMHs. In addition, high DCM was not accompanied by high AX content, which was consistent with the results from Section 3.1 and Section 3.2. Overall, it was found that the presence of YNB resulted in insignificant differences among different MBMH preparation methods, which could mean that YNB was important for AX production and overrode the impact of the method on AX production. However, as expected, the addition of YNB increased the AX contents of FM8 and Pb8 significantly, from 0.09 and 0.52 mg/g to 0.57 (YFM8) and 0.66 (YPb8) mg/g, respectively, while the AX content of Pk8 decreased slightly, from 0.75 to 0.71 mg/g (YPk8). Kim et al. reported that minerals (e.g., calcium dichloride, manganese sulfate, and magnesium sulfate) in YNB could significantly enhance the production of AX by the X. dendrorhous mutant strain JH1 [30]. In contrast, the presence of YNB resulted in significant reduction (55~80%) of the AX contents of alkaline MBMHs, even though cell growth was greatly increased, e.g., the AX content of CM4 decreased from 1.02 to 0.21 mg/g. In our experiments, the addition of YNB to alkaline MBMHs generated flocculant-like substances, which could impair AX accumulation for unknown reasons. Overall, while MBMHs can be used as nitrogen sources for X. dendrorhous fermentation to produce AX, they are not comparable to yeast extract and peptone. In addition, different MBMHs with and without YNB resulted in very different cell growth and AX contents, even with similar nitrogen contents, which indicates that the nitrogen source is more important than the nitrogen content in supporting X. dendrorhous growth for AX production.
3.4. Fermentation with Lyophilized Meat and Bone Meal Hydrolysates (LMBMHs) as Nitrogen Sources
Lyophilized MBMHs (LMBMHs) were used as nitrogen sources for fermentation with and without YNB supplement for AX production by X. dendrorhous under the same C/N ratio, where the medium included 40 g/L of glucose and LMBMHs (with the same nitrogen content as the sum of 3 g/L of yeast extract and 5 g/L of peptone). The effects of LMBMHs on cell growth, glucose consumption, and AX production varied with the LMBMH source in the absence of YNB, while the LMBMHs had better fermentation performance in all fermentation parameters (i.e., increase of glucose consumption and AX content) in the presence of YNB compared to the results for liquid MBMHs in Section 3.3. For example, the maximum AX content of 1.58 mg/g DCM was achieved by YPk8 with LMBMHs (Figure 3), much higher than the 0.71 mg/g DCM resulting from its counterpart with MBMHs (Table 3).
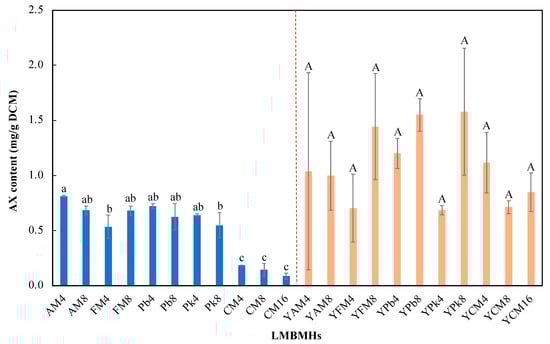
Figure 3.
Cellular astaxanthin contents from fermentation with different LMBMHs with and without YNB supplement. The columns with different lowercase letters mean significant differences among LMBMHs without YNB supplement, while the columns with the same capital letters mean insignificant differences among LMBMHs with YNB supplementation.
LMBMHs benefited cell growth with AM4, AM8, FM4, Pb4, and Pk4 as the nitrogen source compared to their counterparts with MBMHs. Except for AM4/AM8, cell growth with LMBMHs had a much longer lag phase (72 h for enzymatic LMBMHs and 96 h for alkaline LMBMHs) and was much slower in the exponential phase than in the corresponding MBMHs (Section 3.3). Similar results were reported in other studies with the microalga Schizochytrium limacinum SR-21 and fungus P. irregulare had no or slight cell growth using alkaline MBMHs due to the inhibition of cross-linked amino acids [8,9]. It was found that glucose concentration decreased rapidly in the first 24 h (for enzymatic LMBMHs) (Figure 4D,F,H) or 48 h (for alkaline LMBMHs) (Figure 4J) during the lag phase, followed by a slight change (i.e., about 50% glucose was unutilized). These findings could indicate that freeze-drying changed the properties of MBMHs by making them more digestible to X. dendrorhous. Therefore, the ratio of C to digestible N for LMBMHs was higher than that of MBMHs.
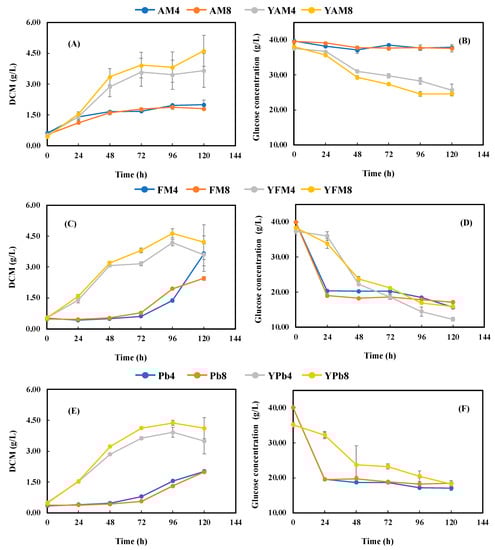
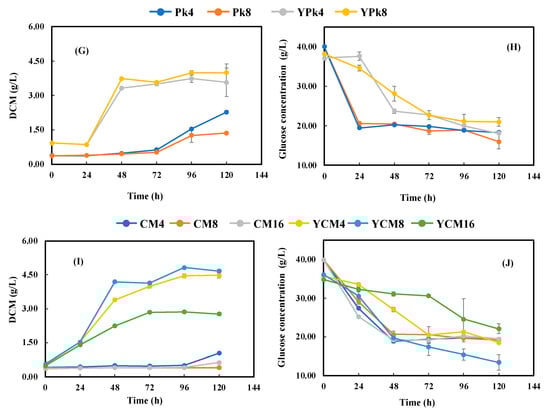
Figure 4.
Cell growth (A,C,E,G,I) and glucose consumption (B,D,F,H,J) during fermentation with LMBMHs produced from MBM hydrolysis by (A,B) Alcalase® 2.4 L, (C,D) Flavourzyme®, (E,F) Bacterial proteinase, (G,H) Proteinase K, and (I,J) Calcium hydroxide as nitrogen sources with and without YNB supplement. The glucose concentration was 40 g/L. The LMBMHs were loaded to achieve a C/N elemental ratio of 15, corresponding to the control nitrogen source with 3 g/L yeast extract and 5 g/L peptone. The temperature, pH, and shaking speed were 25 °C, pH 5.0, and 200 rpm, respectively.
The addition of YNB improved cell growth and AX content significantly, and no lag phase was found for all LMBMHs except for YPk4 and YPk8, of which the lag phase was 24 h (vs. 72 h without YNB), while the cell growth rate was increased significantly (Figure 4A,C,E,G,I). These results indicate that YNB significantly facilitated cell growth and AX production. Although the addition of YNB had only slightly positive (Figure 4D,J) or little (Figure 4F,H) effect on glucose consumption (Figure 4D,F,H,J), the AX production was significantly improved (Figure 3). With YNB supplementation, cell growth and AX content with LMBMHs were improved approximately two-fold in comparison to MBMHs. Similar results were observed by Stoklosa et al., who reported that mineral supplementation improved sugar utilization and AX production during X. dendrorhous fermentation of sweet sorghum juice [31].
In addition, the LMBMH source had a significant effect on AX content without YNB supplementation (the left half of Figure 3), and the enzymatic LMBMHs achieved higher AX content than the alkaline counterparts (CM4, 8, and 16), and AM4 resulted in the highest AX content of 0.81 mg/g DCM, which was opposite to MBMHs (Table 3), with alkaline MBMHs better than their enzymatic counterparts. In addition, it was found that enzymatic and alkaline LMBMHs were respectively better and worse than their MBMHs counterparts regarding AX content. In the presence of YNB, LMBMHs achieved higher AX content than MBMHs (the right half of Figure 3 vs. Table 3). Similar to MBMHs, the presence of YNB overrode the effect of the LMBMH source on AX content, i.e., the AX content resulting from different LMBMHs showed insignificant differences when YNB was supplied (the right half of Figure 3). Taking the best case of YPk8 as an example, a simplified mass balance was conducted based on 1 kg raw MBM, showing that 70.5 mg AX could be achieved (Figure 5). Overall, freeze-drying improved the digestibility of LMBMHs for X. dendrorhous fermentation. The amino acid profiles of MBMHs and LMBMHs need to be analyzed to reveal the property change of MBMHs resulting from freeze-drying. YNB is an effective supplement to promote AX production and sugar consumption in the case of LMBMHs used as nitrogen sources.
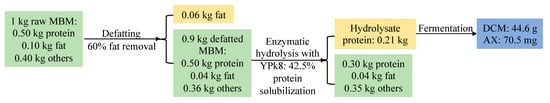
Figure 5.
Simplified mass balance for astaxanthin production from meat and bone meal.
4. Conclusions
MBM can serve as an effective nitrogen source for X. dendrorhous to produce AX, however, the efficiency depends on the method and conditions that are used to process the MBM as well as on the nitrogen source. In addition, the fermentation process can be optimized to further improve AX production. In terms of cellular AX content, 40 g/L glucose and 8 g/L nitrogen (3 g/L yeast extract+5 g/L peptone) loadings were the best conditions in this study, achieving the maximum AX content of 3.69 mg/g DCM. A balanced C/N ratio is a key factor affecting both cell growth and AX accumulation, i.e., a low C/N ratio was favorable for cell growth, while a high C/N ratio benefited AX accumulation. As a result, the C/N ratio should be well controlled to achieve a trade-off between cell growth and AX production by X. dendrorhous. Hydrolysis time and method had significant effects on MBMHs digestibility to X. dendrorhous and its yield in terms of nitrogen. As an alternative nitrogen source to yeast extract and peptone, enzymatic MBMHs were generally better than alkaline MBMHs, achieving higher cell growth and AX content. The maximum DCM and AX content could reach 4.66 g/L and 1.02 mg/g DCM, respectively. While the addition of YNB to MBMH media increased cell growth, it did not improve or only slightly improved AX content. A fed-batch approach could be used to mitigate this conflict in order to achieve both high cell growth and AX accumulation. Freeze-drying improved the digestibility of MBMHs, resulting in higher cell growth and AX accumulation with LMBMHs as a nitrogen source in the presence or absence of YNB compared to MBMHs, with the maximum DCM (3.99 g/L) and AX content (1.58 mg/g DCM) achieved by YPk8. This work could provide the rendering industry with an alternative value-added outlet for MBM through its use in AX production by X. dendrorhous.
Author Contributions
Conceptualization, Y.Z.; methodology, Y.Z. and S.L.; validation, Y.Z. and S.L.; formal analysis, S.L.; investigation, S.L.; resources, Y.Z.; data curation, S.L.; writing—original draft preparation, S.L.; writing—review and editing, Y.Z.; supervision, Y.Z.; project administration, Y.Z.; funding acquisition, Y.Z. All authors have read and agreed to the published version of the manuscript.
Funding
This research was funded by the Animal Co-Products Research and Education Center (ACREC), Clemson University, Clemson, SC, USA.
Institutional Review Board Statement
Not applicable.
Informed Consent Statement
Not applicable.
Data Availability Statement
The data presented in this study are available on request from the corresponding author.
Conflicts of Interest
The authors declare no conflict of interest.
References
- Swisher, K. US Market Report—A mixed bag during a disruptive year. Render 2021, 10–15. [Google Scholar]
- Garcia, R.A.; Rosentrater, K.A. Concentration of Key Elements in North American Meat & Bone Meal. Biomass Bioenergy 2008, 32, 887–891. [Google Scholar] [CrossRef]
- Beck, J.; Brandenstein, J.; Unterberger, S.; Hein, K.R.G. Effects of Sewage Sludge and Meat and Bone Meal Co-Combustion on SCR Catalysts. Appl. Catal. B-Environ. 2004, 49, 15–25. [Google Scholar] [CrossRef]
- Aranda Uson, A.; Lopez-Sabiron, A.M.; Ferreira, G.; Llera Sastresa, E. Uses of Alternative Fuels and Raw Materials in the Cement Industry as Sustainable Waste Management Options. Renew. Sustain. Energy Rev. 2013, 23, 242–260. [Google Scholar] [CrossRef]
- Piazza, G.J.; Garcia, R.A. Meat & Bone Meal Extract and Gelatin as Renewable Flocculants. Bioresour. Technol. 2010, 101, 781–787. [Google Scholar] [CrossRef]
- Jeng, A.; Haraldsen, T.K.; Vagstad, N.; Gronlund, A. Meat and Bone Meal as Nitrogen Fertilizer to Cereals in Norway. Agric. Food Sci. 2004, 13, 268–275. [Google Scholar] [CrossRef]
- Garcia, R.A.; Piazza, G.J.; Wen, Z.; Pyle, D.J.; Solaiman, D.K.Y. The Non-Nutritional Performance Characteristics of Peptones Made from Rendered Protein. J. Ind. Microbiol. Biotechnol. 2010, 37, 95–102. [Google Scholar] [CrossRef]
- Garcia, R.A.; Pyle, D.J.; Piazza, G.J.; Wen, Z. Hydrolysis of Animal Protein Meals for Improved Utility in Non-Feed Applications. Appl. Eng. Agric. 2011, 27, 269–275. [Google Scholar] [CrossRef]
- Liang, Y.; Garcia, R.A.; Piazza, G.J.; Wen, Z. Nonfeed Application of Rendered Animal Proteins for Microbial Production of Eicosapentaenoic Acid by the Fungus Pythium irregulare. J. Agric. Food Chem. 2011, 59, 11990–11996. [Google Scholar] [CrossRef]
- Batghare, A.H.; Moholkar, V.S. Production of Nutraceutical Astaxanthin from Waste Resources. In Waste Biorefinery: Value Addition through Resource Utilization; Bhaskar, T., Varjani, S., Pandey, A., Rene, E.R., Eds.; Elsevier Science: Amsterdam, The Netherlands, 2021; pp. 181–205. [Google Scholar] [CrossRef]
- Liu, X.; Xie, J.; Zhou, L.; Zhang, J.; Chen, Z.; Xiao, J.; Cao, Y.; Xiao, H. Recent Advances in Health Benefits and Bioavailability of Dietary Astaxanthin and Its Isomers. Food Chem. 2023, 404, 134605. [Google Scholar] [CrossRef]
- Aneesh, P.A.; Ajeeshkumar, K.K.; Lekshmi, R.G.K.; Anandan, R.; Ravishankar, C.N.; Mathew, S. Bioactivities of Astaxanthin from Natural Sources, Augmenting Its Biomedical Potential: A Review. Trends Food Sci. Technol. 2022, 125, 81–90. [Google Scholar] [CrossRef]
- Ni, H.; Chen, Q.; Ruan, H.; Yang, Y.; Li, L.; Wu, G.; Hu, Y.; He, G. Studies on Optimization of Nitrogen Sources for Astaxanthin Production by Phaffia rhodozyma. J. Zhejiang Univ. Sci. B 2007, 8, 365–370. [Google Scholar] [CrossRef] [PubMed]
- Yamane, Y.; Higashida, K.; Nakashimada, Y.; Kakizono, T.; Nishio, N. Influence of Oxygen and Glucose on Primary Metabolism and Astaxanthin Production by Phaffia rhodozyma in Batch and Fed-Batch Cultures: Kinetic and Stoichiometric Analysis. Appl. Environ. Microbiol. 1997, 63, 4471–4478. [Google Scholar] [CrossRef] [PubMed]
- Wang, B.; Ling, X.; Zheng, Z.; Xiong, W.; Lu, Y. Effect of Vitamins on Astaxanthin Production of Phaffia rhodozyma. J. Xiamen Univ. (Nat. Sci.) 2011, 50, 111–115. [Google Scholar]
- Nghiem, N.P.; Montanti, J.; Johnston, D. Production of Astaxanthin from Corn Fiber as a Value-Added Co-Product of Fuel Ethanol Fermentation. Appl. Biochem. Biotechnol. 2009, 154, 227–237. [Google Scholar] [CrossRef]
- Sriperm, N.; Pesti, G.M.; Tillman, P.B. Evaluation of the Fixed Nitrogen-to-Protein (N:P) Conversion Factor (6.25) versus Ingredient Specific N:P Conversion Factors in Feedstuffs. J. Sci. Food Agric. 2011, 91, 1182–1186. [Google Scholar] [CrossRef]
- Xiao, R.; Yang, X.; Li, M.; Li, X.; Wei, Y.; Cao, M.; Ragauskas, A.; Thies, M.; Ding, J.; Zheng, Y. Investigation of Composition, Structure and Bioactivity of Extracellular Polymeric Substances from Original and Stress-Induced Strains of Thraustochytrium striatum. Carbohydr. Polym. 2018, 195, 515–524. [Google Scholar] [CrossRef]
- Stoklosa, R.J.; Johnston, D.B.; Nghiem, N.P. Phaffia rhodozyma Cultivation on Structural and Non-Structural Sugars from Sweet Sorghum for Astaxanthin Generation. Process Biochem. 2019, 83, 9–17. [Google Scholar] [CrossRef]
- Reynders, M.B.; Rawlings, D.E.; Harrison, S.T.L. Demonstration of the Crabtree Effect in Phaffia rhodozyma during Continuous and Fed-Batch Cultivation. Biotechnol. Lett. 1997, 19, 549–552. [Google Scholar] [CrossRef]
- Flores-Cotera, L.B.; Chávez-Cabrera, C.; Martínez-Cárdenas, A.; Sánchez, S.; García-Flores, O.U. Deciphering the Mechanism by Which the Yeast Phaffia rhodozyma Responds Adaptively to Environmental, Nutritional, and Genetic Cues. J. Ind. Microbiol. Biotechnol. 2021, 48, kuab048. [Google Scholar] [CrossRef]
- Miao, L.; Chi, S.; Wu, M.; Liu, Z.; Li, Y. Deregulation of Phytoene-β-Carotene Synthase Results in Derepression of Astaxanthin Synthesis at High Glucose Concentration in Phaffia rhodozyma Astaxanthin-Overproducing Strain MK19. BMC Microbiol. 2019, 19, 133. [Google Scholar] [CrossRef] [PubMed]
- Amado, I.R.; Vázquez, J.A. Mussel Processing Wastewater: A Low-Cost Substrate for the Production of Astaxanthin by Xanthophyllomyces dendrorhous. Microb. Cell Factories 2015, 14, 177. [Google Scholar] [CrossRef] [PubMed]
- Pan, X.; Wang, B.; Gerken, H.G.; Lu, Y.; Ling, X. Proteomic Analysis of Astaxanthin Biosynthesis in Xanthophyllomyces dendrorhous in Response to Low Carbon Levels. Bioprocess Biosyst. Eng. 2017, 40, 1091–1100. [Google Scholar] [CrossRef] [PubMed]
- Chávez-Cabrera, C.; Flores-Bustamante, Z.R.; Marsch, R.; Montes, M.d.C.; Sánchez, S.; Cancino-Díaz, J.C.; Flores-Cotera, L.B. ATP-Citrate Lyase Activity and Carotenoid Production in Batch Cultures of Phaffia rhodozyma under Nitrogen-Limited and Nonlimited Conditions. Appl. Microbiol. Biotechnol. 2010, 85, 1953–1960. [Google Scholar] [CrossRef]
- Chávez-Cabrera, C.; Marsch, R.; Bartolo-Aguilar, Y.; Flores-Bustamante, Z.R.; Hidalgo-Lara, M.E.; Martínez-Cárdenas, A.; Cancino-Díaz, J.C.; Sánchez, S.; Flores-Cotera, L.B. Molecular Cloning and Characterization of the ATP Citrate Lyase from Carotenogenic Yeast Phaffia rhodozyma. FEMS Yeast Res. 2015, 15, fov054. [Google Scholar] [CrossRef]
- Wang, B.; Pan, X.; Jia, J.; Xiong, W.; Manirafasha, E.; Ling, X.; Yinghua, L. Strategy and Regulatory Mechanisms of Glutamate Feeding to Enhance Astaxanthin Yield in Xanthophyllomyces dendrorhous. Enzym. Microb. Technol. 2019, 125, 45–52. [Google Scholar] [CrossRef]
- Taheri, A.; Abedian Kenari, A.; Motamedzadegan, A.; Habibi-Rezaei, M. Poultry By-Products and Enzymatic Hydrolysis: Optimization by Response Surface Methodology Using Alcalase® 2.4 L. Int. J. Food Eng. 2011, 7. [Google Scholar] [CrossRef]
- Fang, T.J.; Wang, J.-M. Extractability of Astaxanthin in a Mixed Culture of a Carotenoid Over-Producing Mutant of Xanthophyllomyces dendrorhous and Bacillus Circulans in Two-Stage Batch Fermentation. Process Biochem. 2002, 37, 1235–1245. [Google Scholar] [CrossRef]
- Kim, J.-H.; Kang, S.-W.; Kim, S.-W.; Chang, H.-I. High-Level Production of Astaxanthin by Xanthophyllomyces dendrorhous Mutant JH1 Using Statistical Experimental Designs. Biosci. Biotechnol. Biochem. 2005, 69, 1743–1748. [Google Scholar] [CrossRef]
- Stoklosa, R.J.; Johnston, D.B.; Nghiem, N.P. Utilization of Sweet Sorghum Juice for the Production of Astaxanthin as a Biorefinery Co-Product by Phaffia rhodozyma. ACS Sustain. Chem. Eng. 2018, 6, 3124–3134. [Google Scholar] [CrossRef]


Disclaimer/Publisher’s Note: The statements, opinions and data contained in all publications are solely those of the individual author(s) and contributor(s) and not of MDPI and/or the editor(s). MDPI and/or the editor(s) disclaim responsibility for any injury to people or property resulting from any ideas, methods, instructions or products referred to in the content. |
© 2023 by the authors. Licensee MDPI, Basel, Switzerland. This article is an open access article distributed under the terms and conditions of the Creative Commons Attribution (CC BY) license (https://creativecommons.org/licenses/by/4.0/).