Article

Integration of Dark Fermentation with Microbial Electrolysis Cells for Biohydrogen and Methane Production from Distillery Wastewater and Glycerol Waste Co-Digestion

1
Faculty of Environment and Resource Studies, Mahidol University, Nakhon Pathom 73170, Thailand
2
Department of Science, Faculty of Science and Technology, Prince of Songkla University, Pattani 94000, Thailand
3
Bio-Mass Conversion to Energy and Chemicals (Bio-MEC) Research Unit, Faculty of Science and Technology, Prince of Songkla University, Pattani 94000, Thailand
4
Department of Biotechnology, Faculty of Technology, Khon Kaen University, Khon Kaen 40002, Thailand
5
Research Group for Development of Microbial Hydrogen Production Process, Faculty of Technology, Khon Kaen University, Khon Kaen 40002, Thailand
6
Academy of Science, Royal Society of Thailand, Bangkok 10300, Thailand
7
Division of Environmental Science and Engineering, Graduate School of Science and Engineering, Yamaguchi University, Yamaguchi 755-8611, Japan
*
Author to whom correspondence should be addressed.
Fermentation 2022, 8(10), 537; https://doi.org/10.3390/fermentation8100537
Submission received: 13 September 2022 / Revised: 4 October 2022 / Accepted: 9 October 2022 / Published: 13 October 2022
(This article belongs to the Special Issue Biofuels Production and Processing Technology 2.0)

Abstract

:
This study aimed to enhance dark fermentative hydrogen production from co-digestion of distillery wastewater (DW) and glycerol waste (GW) through integration with microbial electrolysis cells. First, the optimal proportion of DW and GW in hydrogen production was investigated in batch mode. The results show that DW and GW co-digestion at a ratio of 99:1 (% v/v) gave the highest hydrogen yield of 149.5 mL-H2/g − VSadded. Continuous hydrogen production using the optimal proportion was conducted in a continuously stirred tank reactor. As a result, a maximal hydrogen yield of 99.7 mL-H2/g − VSadded was achieved, and the dominant hydrogen-producing bacterium was Clostridium sensu stricto 7. The dark fermentation effluent from the continuously stirred tank reactor was later used to produce methane using batch MECs. The maximum methane yield of 115.1 mL-CH4/g − VSadded was obtained under an applied voltage of 1 V and continuous stirring at 120–140 rpm. Microbial community analysis revealed that Metahnobacterium, Methanomethylovorans, Methanoculleus, and Methanosarcina were the methanogenic archaea in the microbial electrolysis cell reactor.

1. Introduction

Renewable energy is a promising carrier that can be used to replace fossil fuels to reduce any pollution or environmental impact. Therefore, many countries are interested in producing renewable energy sources, such as biodiesel, ethanol, hydrogen (H2), and methane (CH4). Among these, biodiesel production via transesterification is a liquid fuel for replacing diesel engines [1]. However, at the end of the biodiesel production process, 10% (v/v) of glycerol waste (GW) is generated as a by-product [1,2]. In 2020, it was estimated that GW generated from biodiesel production would be more than 4.6 million tons/year [3]. Generally, GW can be refined into pure glycerol for further use as a raw material in pharmaceuticals, cosmetics, food, and many other industries. However, this route may not be economical for small and medium-sized biodiesel production plants [1,3,4]. Therefore, the biological conversion route of GW into valuable products, such as biohydrogen, bioethanol, 1,3-propanediol, 2,3-butanediol, butanol, polyhydroxyalkanoate, and docosahexaenoic acid (DHA), has gained increasing attention [2,4,5]. Among these, biohydrogen and methane have gained attention as energy carrier alternatives to fossil fuels because they are clean and renewable.
Dark fermentative biohydrogen production has attracted interest because of its high potential for energy recovery and reduced unwanted waste [6]. At the end of the dark fermentation process, the effluent leftover contains major volatile fatty acids (VFAs), such as acetic acid, butyric acid, propionic acid, and lactic acid. The effluent is not discharged directly into the environment without treatment. Therefore, further use of dark fermentation effluent by photo-fermentation or microbial electrolysis cells (MECs) is a suitable solution for gas biofuel, because this route gains energy carriers and reduces the chemical oxygen demand (COD) concentration. Photo-fermentation is a biological technique that treats organic-rich wastewater into hydrogen; therefore, enriched hydrogen gas is obtained [7]. However, some drawbacks, such as energy requirement and low hydrogen yield, are significant considerations. MECs are a highly efficient biotechnology for treating organic wastewater and producing energy carriers, such as hydrogen or methane. In practice, hydrogen production via MECs is an endothermic reaction with positive Gibbs free energy; hence, the reaction cannot occur at room temperature. Therefore, energy input from external sources is required to facilitate the reaction [8]. MECs are developed from microbial fuel cells, with similar components and working principles, except that the cathode does not use oxygen in the reaction [8]. MECs convert the remaining organic substances into hydrogen and VFAs, as well as carbon dioxide hydrogen and VFAs into methane using microorganisms as biological catalysts [8,9].
MECs can produce hydrogen via “electrochemical active bacteria” coated on the anode surface, which oxidize the organic substance and transmit the generated electrons and protons to the hydrogen in the cathode [8]. In contrast, this system can produce methane via two reactions. The first is the reduction of carbon dioxide and electrons to methane in the cathode, also known as a direct electromethanogenesis reaction [10]. The second is mediated by hydrogen and other compounds, such as acetic and formic acids, combined with carbon dioxide to form methane, or indirect electromethanogenesis [9]. Several studies have focused on hydrogen production using either dark fermentation [11] or MECs alone [12,13], and some studies have used a combination of dark fermentation and MECs to enhance hydrogen production [14,15]. However, biohydrogen production via dark fermentation has still not been integrated with an MEC system for methane production. Therefore, this study investigated dark fermentative biohydrogen production from GW and distillery wastewater (DW) co-digestion integration with methane production via an MEC system. Dark fermentation effluent could be converted efficiently to biogas with high CH4 concentration by using the anaerobic MECs due to electrochemically active bacteria (EAB) capable of directly receiving electrons under direct interspecies electron transfer (DIET) reaction for reducing proton and CO2 to form methane. Consequently, classical accumulation of organic acids due to high hydrogen partial pressure in the anaerobic digestion system is overcome [16]. Therefore, the two-stage H2–dark fermentation and CH4–MEC could provide a better bio-hythane production rate and quality than the two-stage H2–dark fermentation and CH4–anaerobic digestion. Typical bio-hythane having 10% H2, 60% CH4, and 30% CO2 can be directly used in the internal combustion gas engine without any modification [17].
GW contains glycerol as a carbon source and lacks trace elements and other nutrients, especially nitrogen, which is required for microorganism growth and replication [18]. Therefore, a nitrogen source must be added to supply nitrogen and balance the carbon-to-nitrogen ratio (C/N ratio), an essential factor for anaerobic digestion [19,20]. On the other hand, DW is a waste stream from ethanol fermentation that uses molasses as a feedstock [21]. It contains high concentrations of organic matter, nitrogen, phosphorus, and ammonium sulfate [21], making it suitable for co-digestion with GW. Moreover, it contains trace elements, such as iron, manganese, zinc, calcium, and magnesium, which are essential for microbial growth and act as co-enzymes for biohydrogen production. Therefore, GW combination with DW is an attractive way to provide essential nutrients in the dark fermentation process and increase hydrogen yield. Furthermore, co-digestion of two or more substrates can balance the C/N ratio to an appropriate level to improve production yield and enhance buffer capacity in a fermentation system [20].
As mentioned above, this study aimed to integrate dark fermentative hydrogen production from GW and DW co-digestion with an MEC system for hydrogen and methane production. Initially, we investigated the proportions of DW and GW in biohydrogen production. Second, biohydrogen was continuously produced through DW and GW co-digestion using a continuously stirred tank reactor (CSTR). Finally, the effluent leftover from the CSTR was used as a substrate for methane production using the MEC system. In addition, the microbial community responsible for hydrogen and methane production in the CSTR and MEC systems was analyzed using 16S rRNA amplicon sequencing on an illumination platform. The results of this study provide valuable insights into the integration of dark conditions and MEC processes for hythane production from DW and GW co-digestion.

2. Materials and Methods

2.1. Substrates and Inoculum

DW was collected from an industrial ethanol plant (Nateechai Co., Ltd.) in Suratthani, Thailand. The sample was stored at 4 °C, and GW was collected from biodiesel production at the Prince of Songkhla University, Songkhla, Thailand. GW was stored at room temperature prior to use. The characteristics of DW and GW are shown in Table 1.
The inoculum for hydrogen production (INH) was collected from the anaerobic digestion pond of the Palm oil mill industry, Palm Pattana Southern Border. Co., Ltd., Pattani, Thailand. It was a shock load using 80 g/L glucose and was incubated at 55 °C until methane production was not observed. It was an organic shock loading using 80 g/L glucose and was incubated at 55 °C until methane production was not observed. In this method, the mixed cultures are exposed to a high concentration of carbon source in which a diversity of hydrogen producers are enriched. This method is favored to enrich the hydrogen producer and eliminate the methane-producing archaea [22,23]. The inoculum for methane production (INM) was collected from the same location, but it was not pretreated before use as the inoculum. The characteristics of INH and INM are shown in Table 2.

2.2. Optimization of DW and GW Proportions in Dark Fermentative Hydrogen Production

The DW and GW proportions for hydrogen production were optimized in a batch test. The explored ratios between DW and GW included 100:0, 99:1, 98:2, 97:3, 96:4, 95:5, and 0:100 (% v/v). The experiment was performed using a 120 mL serum bottle with a 70 mL working volume. Different DW and GW ratios were added to the serum bottles supplemented with basic anaerobic medium (BA medium) to make up a final volume of 70 mL. Then, 25% (v/v) of INH was added as the inoculum source. The compositions of BA medium (all in g/L) were NH4Cl 100, NaCl 10, MgCl2.6H2O 10, CaCl2.2H2O 5, K2HPO4.3H2O 200, NaHCO3 52, yeast extract 100, Na2S 25, and 1 mL of solution D. Solution D contained (all in g/L) FeCl2.4H2O 2, H3BO3 0.05, ZnCl2 0.05, CuCl2.2H2O 0.038, MnCl2.4H2O 0.05, (NH4)6Mo7O24.4H2O 0.05, AlCl3 0.05, CoCl2.6H2O 0.05, NiCl2.6H2O 0.092, ethylenediaminetetraacetate 0.5, concentrated HCl 1 mL, and Na2SeO3.5H2O 0.1 [24]. The serum bottle was capped with a rubber stopper and aluminum cap, and the headspace was replaced with nitrogen gas to create anaerobic conditions. The experiments were performed in triplicate, and the samples were incubated at 55 °C. During the fermentation process, the biogas volume and content were measured. The biogas content, including hydrogen and carbon dioxide, was analyzed using gas chromatography (GC-TCD, GC-2014, Shimadzu, Kyoto, Japan). The fermentation broth was collected to measure VFA type and concentration using high-performance liquid chromatography (HPLC). The ratio of DW to GW that gave the highest hydrogen production was further used for continuous hydrogen production using CSTR.

2.3. Continuous Biohydrogen Production from DW and GW Co-Digestion in a CSTR

A 10 L CSTR with a working volume of 7 L was used to produce hydrogen from DW and GW co-digestion. The optimal DW and GW proportions obtained in the previous section (Section 2.2). were used. The 25% (v/v) of INH was added to the CSTR and supplemented with basal medium (BA medium). The pH was adjusted to 6 using NaHCO3. The headspace was flushed with nitrogen gas in an anaerobic atmosphere before incubation at 55 °C. The reactor was operated continuously at a hydraulic retention time of 3 days and an organic loading rate of 19.1 g − VSadded/L·d (optimal conditions from the preliminary study). The reactor was operated until a steady state was obtained. The variation in biogas content of ±10% indicated a steady state. Every 24 h, the gas sample and fermentation broth were collected to measure biogas content and VFA concentration using GC and HPLC, respectively. In addition, a sludge sample was collected to analyze the microbial community using 16S rRNA amplicon sequencing on an illumination platform. The effluent from the CSTR was used as the substrate to produce methane in the single-chamber MEC.

2.4. Methane Production from Dark Fermentation Effluent Using a Single-Chamber MEC

The dark fermentation effluent from the CSTR was used as a substrate in the MEC. The characteristics of the dark fermentation effluents are listed in Table 3. A single-chamber MEC with a working volume of 1.2 L was constructed with a membraneless external resistance of 10 Ω. A modulated direct current power source was used to apply voltage to the MECs. The cathode and anode were composed of graphite (7.70 cm). The distance between the cathode and anode was 2 cm. The MEC chamber was filled with 566 mL BA medium and 240 mL INM as the inoculum source. The MEC reactor was operated at 35 °C. The MEC experiment was performed at various voltages and stirring speeds, as follows:
0 V–CH4 = no voltage without stirring
0 V–S-CH4 = no voltage with a stirring speed of 120 rpm
1 V–CH4 = 1.0 V applied voltage without stirring
1 V–S-CH4 = 1.0 V applied voltage with a stirring speed of 120–140 rpm
2 V–CH4 = 2.0 V applied voltage without stirring
2 V–S-CH4 = 2.0 V applied voltage with a stirring speed of 120–140 rpm
During the operation, biogas was collected every 24 h to analyze its composition using GC. Sludge samples in the MEC reactor were collected to analyze the microbial community using 16S rRNA amplicon sequencing on an illumination platform.
Table 3. Characteristics of the dark fermentation effluent from the continuously stirred tank reactor (CSTR).
ParameterDark Fermentation Effluent
pH5.1
TS (g/L)56.6 ± 3.2
VS (g/L)31.7 ± 3.1
Ash (g/L)24.9 ± 0.2
Alkalinity (g/L)5.8 ± 0.1
Total volatile fatty acid (g/L)5.0 ± 3.0
COD (g/L)78.1 ± 7.3

2.5. Microbial Community Analysis Using 16S rRNA Amplicon Sequencing on an Illumination Platform

Total genomic DNA was extracted from the sludge samples (CSTR and MEC) using sodium dodecyl sulfonate, with some modifications [25]. Genomic DNA was further purified using a gel/PCR DNA fragment extraction kit (Geneaid Biotech Ltd., New Taipei City, Taiwan). The presence of high-molecular-weight DNA was confirmed via agarose gel electrophoresis (0.8%). DNA quality and quantity were measured using Nanodrop-ND1000 (Thermo Fisher Scientific, Waltham, MA, USA). The variable regions (V3–V4) of the bacterial and archaeal 16S rRNA gene fragments were amplified using primers 341F (5′-CCTAYGGGRBGCASCAG-3′) and 806R (5′-GGACTACNNGGGTATCT AAT-3′). The PCR products were mixed at equal density ratios. The PCR products were purified using the Qiagen Gel Extraction Kit (Qiagen, Germany). The Illumina platform was used to analyze the libraries generated using the NEBNext® UltraTM DNA Library Prep Kit for Illumina and quantified via Qubit and qPCR. Sequence analyses were performed using Uparse software v7.0.1001, employing all effective tags [26]. Sequences with ≥97% similarity were assigned to the same operational taxonomic unit (OTU). The diversity values for these samples were estimated using the abundance-based coverage estimator Chao1 and the Shannon and Simpson indices for diversity estimation.

2.6. Analytical Methods

The total solid, volatile solid, and ash contents were measured according to the APHA standard method [27]. The total Kjeldahl nitrogen was measured using the Kjeldahl method. COD was measured using closed flux analysis. The alkalinity was measured using the AOAC method [28]. The carbon, hydrogen, nitrogen, sulfur, and oxygen contents were analyzed using a CHNS/O analyzer (Flash 2000, Thermo Scientific, Milan, Italy). Biogas volume was recorded using a water displacement gas meter, and its composition was measured using GC. The GC was equipped with a 2 m stainless steel column and a shin-carbon (80/100 mesh). Argon was used as the carrier gas at a flow rate of 35 mL/min. The injection port, oven, and detector temperatures were all 100 °C. The HPLC operating conditions were set according to the method described by Sani et al. [29]. The energy yield obtained from hydrogen and methane was calculated by multiplying the hydrogen or methane yield (ml-H2/g − VSadded or ml-CH4/g − VSadded, respectively) by the hydrogen and methane density (0.09 g/L-H2 and 0.72 g/L-CH4, respectively) and then by their respective heating values (121 kJ/g-H2 and 50 kJ/g-CH4) as seen in Equations (1) and (2).
Energy production from hydrogen (kJ/g − VSadded) = Hydrogen yield (mL-H2/g − VSadded) × hydrogen density (g/L-H2) × heating values (121 kJ/g-H2)
Energy production from methane (kJ/g − VSadded) = Methane yield (mL-CH4/g − VSadded) × methane density (g/L-CH4) × heating values (50 kJ/g-CH4)

3. Results and Discussion

3.1. Biohydrogen Production from a Dark Fermentative of DW and GW Co-Digestion at Various Ratios

Biohydrogen production from DW and GW co-digestion at various ratios is shown in Figure 1A,B. Variations in DW and GW resulted in varying cumulative hydrogen and hydrogen yield. The maximum hydrogen yield of 149.5 mL-H2/g − VSadded was achieved at a proportion of DW 99:1 GW (equivalent to a C/N ratio of 15.9). In contrast, an increase in the proportion of GW from 1 to 100% resulted in a decrease in cumulative hydrogen production and hydrogen yield. This might be due to a C/N ratio higher than the required level, which slows down microbial metabolism. A suitable C/N ratio in the range of 15–30 has been reported for hydrogen production from co-digestion [30]. However, the production performance also depends on the concentration of other parameters in the mixture, such as inhibitors and toxic compounds, micronutrients, biodegradable organic and dry matter, pH, and alkalinity [31]. Hydrogen production was not observed using GW only at a proportion of DW 0:100 GW (C/N ratio of 47.8) (Figure 1A,B). In contrast, using 100% DW (C/N ratio of 14.7) achieved a hydrogen yield of 96.6 mL-H2/g − VSadded. This is because increasing the proportion of GW also increased the toxic substances it contains, including soap, methanol, and free fatty acids, halting microbial growth and activity. Generally, the soap that GW contains can limit substrate diffusion into the microorganisms [2,32]. The presence of methanol alters cell membrane function and affects bacterial growth and activity in a concentration-dependent manner. For example, Venkataramanan et al. [32] found that 2.5 and 5 g/L of methanol did not affect bacterial activity. On the other hand, methanol concentrations of 10 g/L or higher reduced bacterial growth and metabolism [32,33]. The hydrogen yield obtained from a DW and GW co-digestion at 99:1 (149.5 mL-H2/g − VSadded) was higher than that obtained from mono-digestion at 100% DW (96.6 mL-H2/g − VSadded). The results show that co-digestion could provide a suitable C/N ratio and other micronutrients and biodegradable organic matter, compared with mono-digestion. Moreover, adding DW to GW can reduce impurities. Hence, hydrogen production performance also increased.

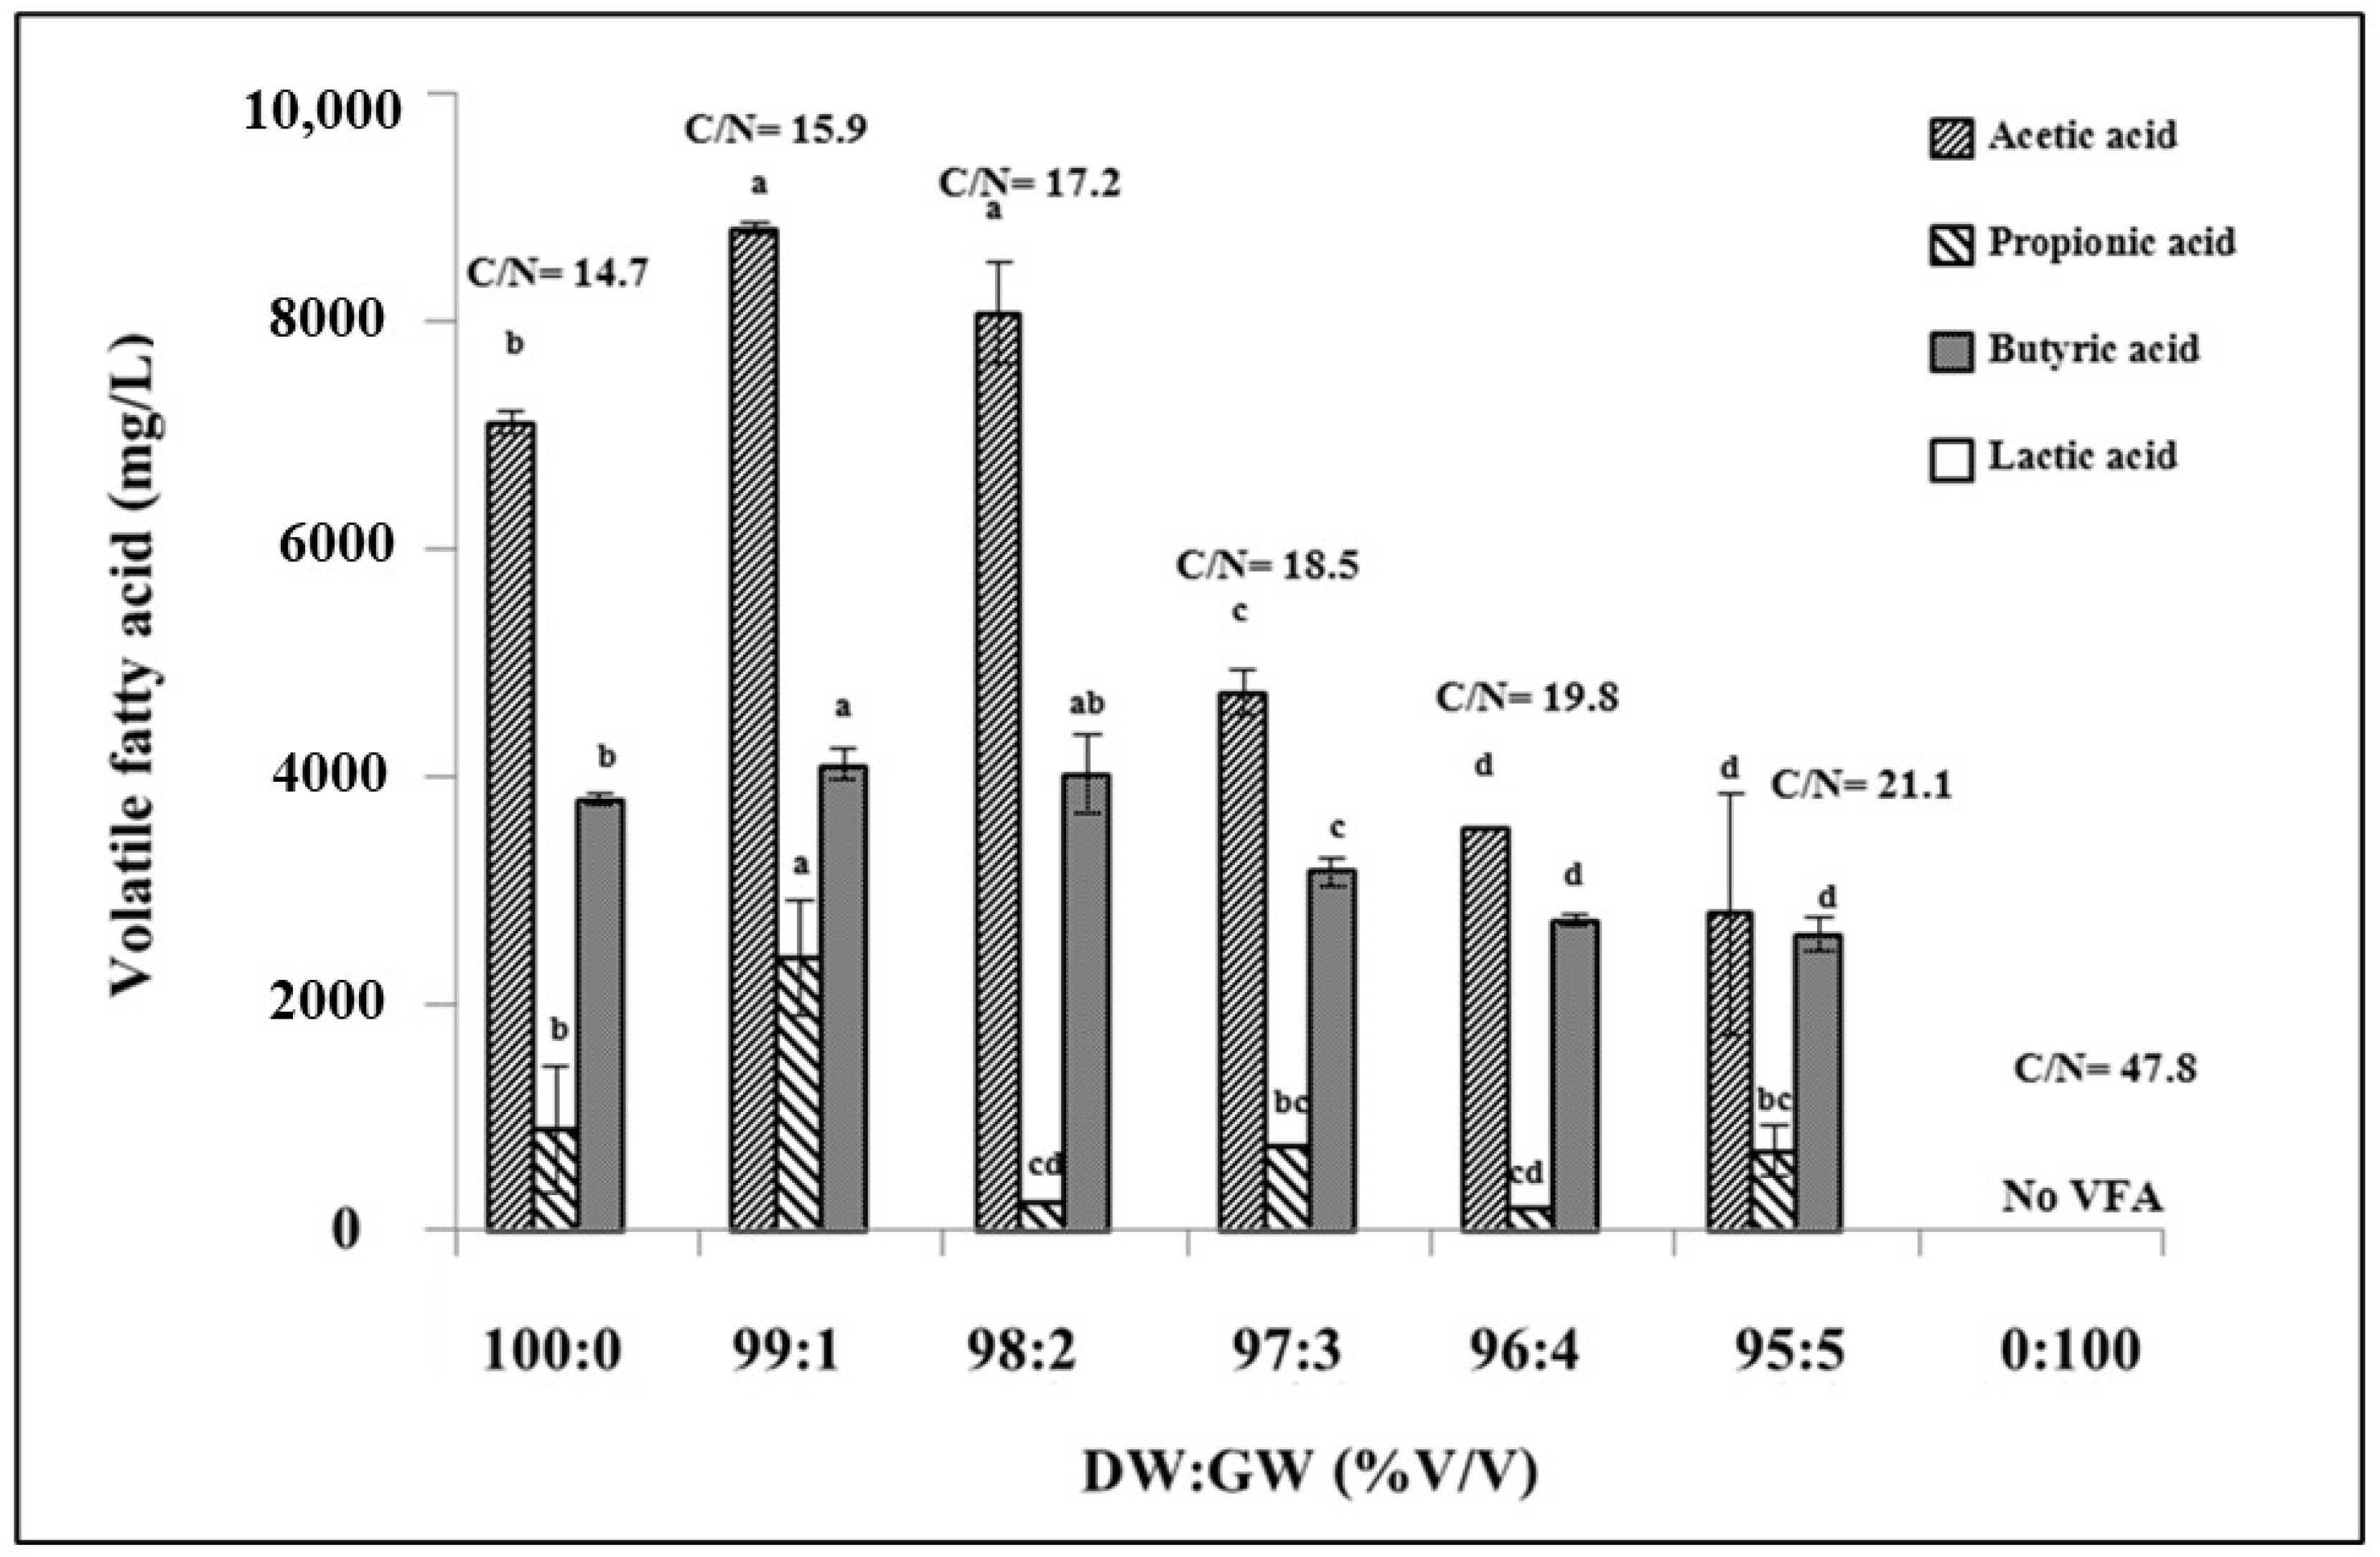
3.2. VFA Production from a Dark Fermentative of DW and GW Co-Digestion at Various Ratios

VFAs are essential parameters for determining the efficiency of hydrogen production. Therefore, measuring VFA production during the fermentation process can be used to monitor production performance. Variations in the proportion of DW and GW resulted in varying VFA concentrations and types. Acetic acid was the most abundant, followed by butyric and propionic acids (Figure 2). The highest acetic acid production of 8812.8 mg/L was observed at the optimal proportion of DW and GW of 99:1% (v/v). Under these conditions, butyric and propionic acid concentrations of 4098.1 and 2402.2 mg/L were also obtained. Lactic acid production was not observed in any of the DW or GW treatments. According to this result, the high acetic acid concentration in the dark fermentation effluent enabled its further use in the MEC system for methane production. On the other hand, propionic acid production consumes hydrogen and, consequently, results in low hydrogen production. The presence of propionic acid in the fermentation broth indicates instability of the hydrogen fermentation system. VFA production was not observed at 100% GW (v/v). This result coincided with hydrogen production, as mentioned in Section 3.1. In contrast, VFA production was observed when using 100% DW. This might be because the macro- and micronutrients in DW are suitable for supporting microbial growth and activity, where hydrogen production was observed.

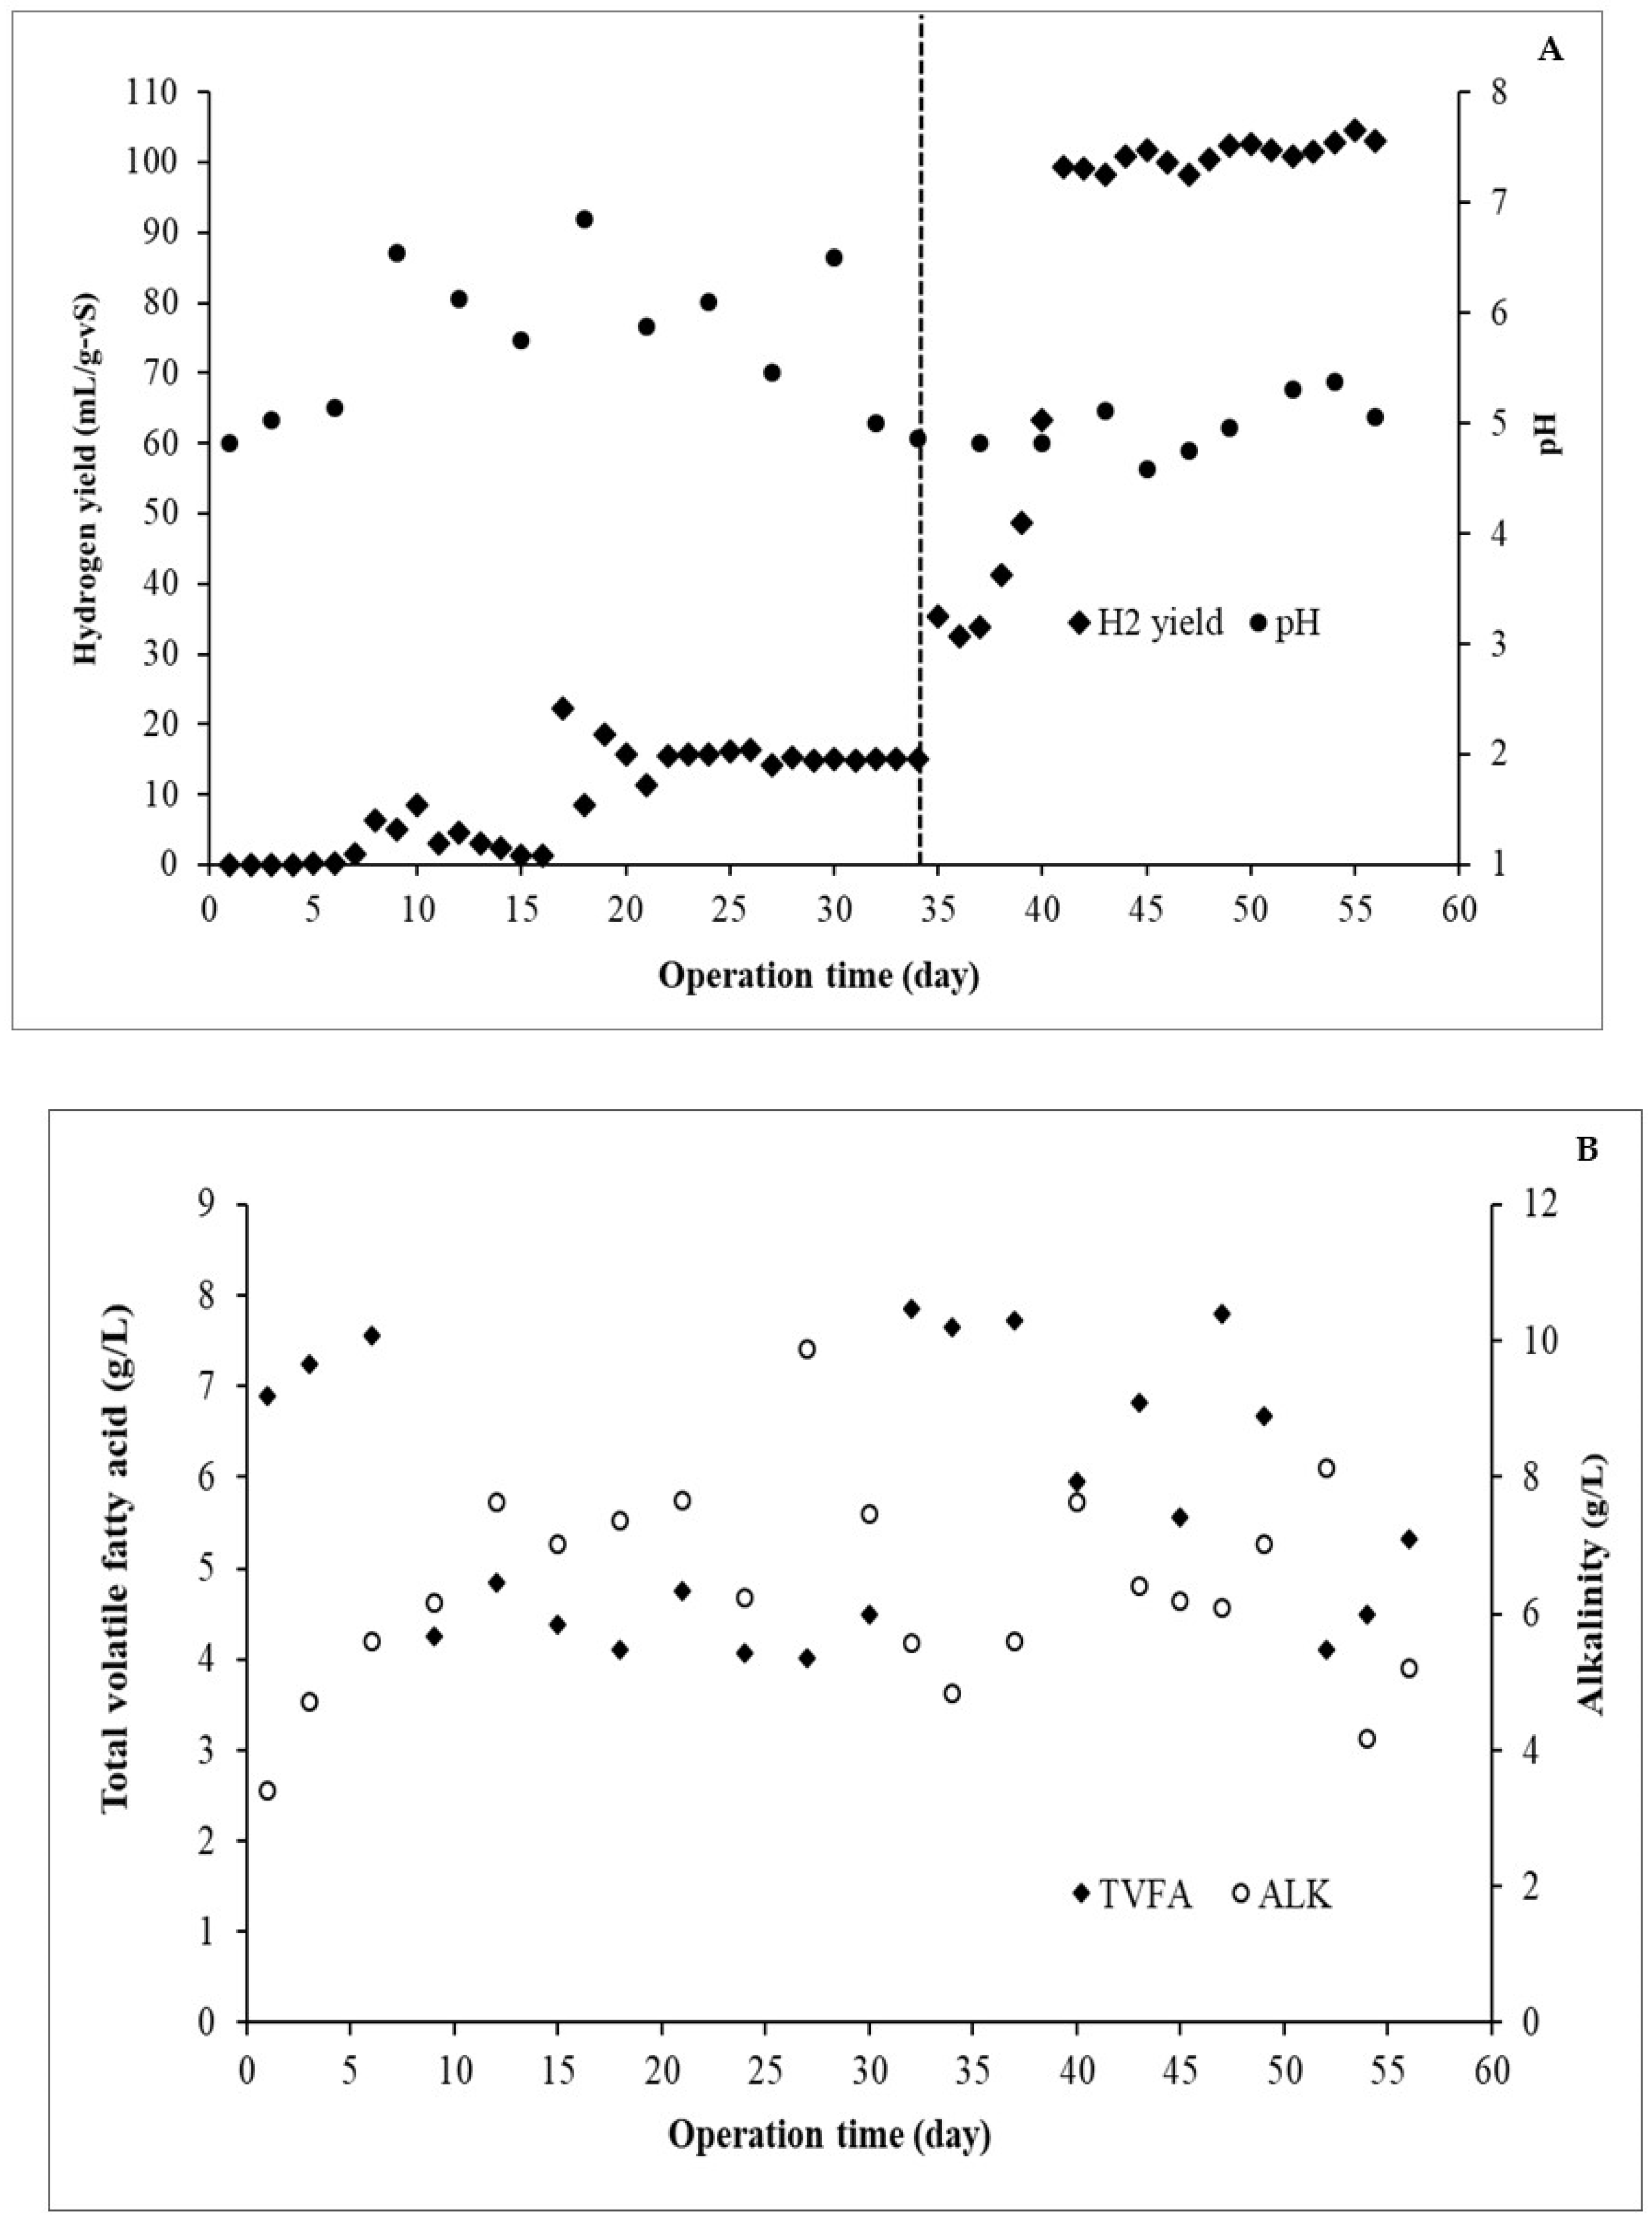
3.3. Continuous Biohydrogen Production from DW and GW Co-Digestion in a CSTR

Continuous biohydrogen production from DW and GW co-digestion in a CSTR was performed at a proportion of DW 99:1 GW (% v/v). The results are shown in Figure 3A. During the fermentation process, the monitored pH ranged from 4.8 to 6.2. No methane production was observed at any of the fermentation times. Initially, the hydrogen yields were relatively low because microorganisms might take time to adapt to the substrate use. However, after 15 days, the hydrogen yield increased slightly and rapidly at 35 days. Furthermore, after 40 d, the fermentation process was stable because the hydrogen yield was also stable (changes less than ±10%) until 60 d (Figure 3A). VFA and alkalinity monitoring during fermentation is shown in Figure 3B. Alkalinity and total VFA ranged from 4 to 10 g/L and 4 to 7 g/L, respectively. Acetic acid was the most abundant acid, followed by butyric acid (data not shown). In particular, the TVFA/alkalinity ratio should be in the range of 0.3–0.8; a value over 0.8 indicates high VFA accumulation and consequently requires a proper buffer [34,35]. On the other hand, if the TVFA/alkalinity ratio is 0.3–0.8, the operation process is at a lower risk of acid accumulation [34,35]. In this study, the TVFA/alkalinity ranged from 0.4 to 1.75, but the changes in pH during fermentation were in the range of 4.8–6.2, which is suitable for hydrogen-producing bacteria. This might be because the NaHCO3 in the BA medium acts as a sound buffer that can control dramatic changes in pH.

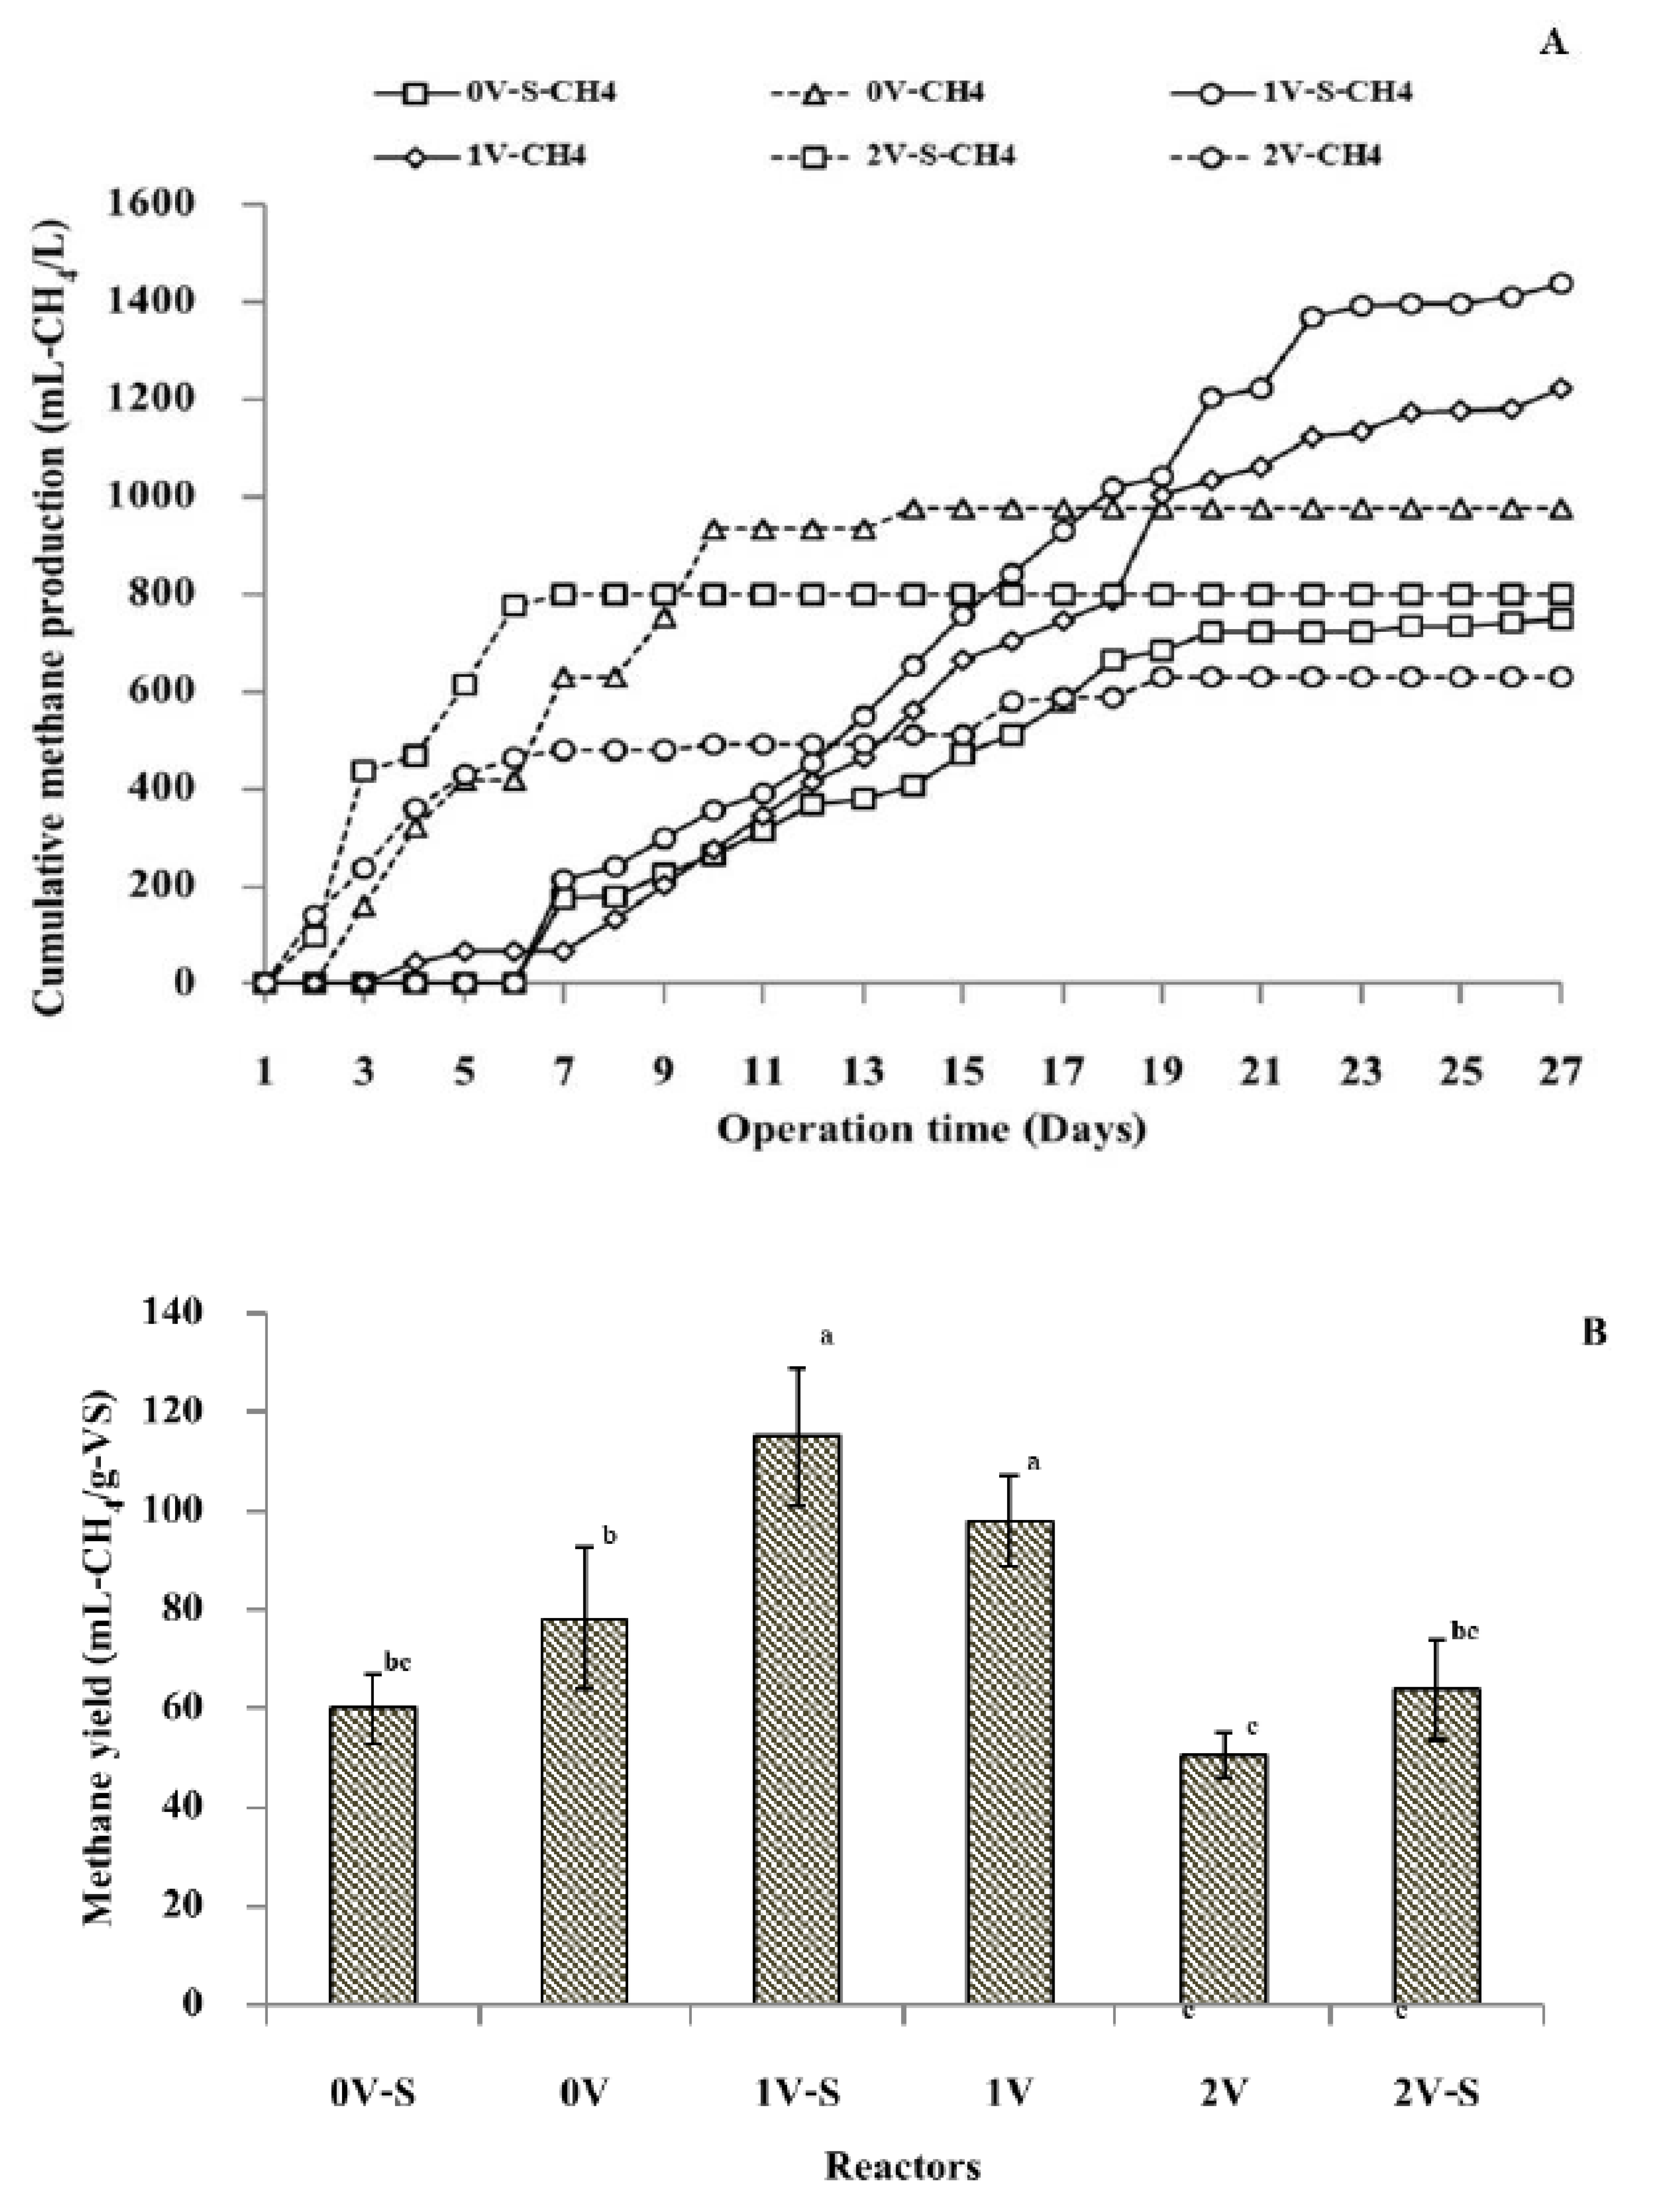
3.4. Methane Production from the Dark Fermentation Effluent Using a Single-Chamber MEC

The cumulative methane production and yield during the MEC process are shown in Figure 4A,B. The results show that applying a voltage of 0–1 V increased methane production, but further increasing the voltage to more than 1 decreased methane production (Figure 4A). Thus, an energy input of 1 V was deemed more suitable than 2 V, because the higher voltage could damage the cell membrane, inhibiting biogas production [36]. At 0–6 days, hydrogen production was observed in the reactor supplied with 1 V (data not shown). This was because the application of 1 V was suitable for enhancing the growth and activity of exoelectrogenic bacteria. This result is in agreement with the study by Jayabalan et al. [37], who found that 1 V is the optimal voltage for MEC performance, supporting the growth and activity of exoelectrogenic bacteria, crucial microorganisms that oxidize organic matter at the anode and transfer electrons directly to the cathode. Hydrogen production in the MEC system is shown in Equations (3) and (4): The exoelectrogenic bacteria coated on the anode oxidize organic matter and generate electrons, which then pass through the circuit to the cathode, while the protons move directly to the cathode, forming hydrogen. Subsequently, the produced hydrogen is further consumed by methanogenic bacteria to produce methane via an indirect electromethanogenesis reaction.
Anode: C2H4O2 + 2H2O → 2CO2 + 8e + 8H+
Cathode: 8H+ + 8e → 4H2
Cumulative methane production was observed under all conditions (Figure 4A). Without energy input, methane yields of 60.0 and 78.3 mL-CH4/g − VSadded were obtained under stirring at 120–140 rpm (0 V–S-CH4) and without stirring (0 V–CH4), respectively. This means that methane production in the MEC system could occur without any energy input. With a voltage of 0–1 V, methane production increased further, and increasing the voltage to >1 V decreased methane production. Methane yields of 50.5 and 63.8 mL-CH4/g − VSadded were obtained at 2 V with (2 V–S-CH4) and without (2 V–CH4) stirring, respectively. The highest methane yield of 115.1 mL-CH4/g − VSadded was obtained when supplying the MEC reactor with 1 V and stirring at 120–140 rpm (1 V–S-CH4). At 1 V without stirring (1 V–CH4), the hydrogen yield dropped to 97.8 mL-CH4/g − VSadded. These results indicate that stirring the MEC reactor at 120–140 rpm can increase the proton and carbon dioxide mitigation from the anode to the cathode surface to form methane with electrons because of its membraneless system. In the methane production reaction in the MEC, the CO2 and electrons generated by oxidizing organic matter via exoelectrogenic bacteria can form CH4 on the cathode surface, as shown in Equations (5) and (6). This reaction is also known as direct electromethanogenesis.
Anode: C2H4O2 + 2H2O → 2CO2 + 8e + 8H+
Cathode: CO2 + 8e + 8H+ → CH4 + 2H2O
0 V–CH4 = no voltage without stirring
0 V–S-CH4 = no voltage with a stirring speed of 120 rpm
1 V–CH4 = 1.0 V applied voltage without stirring
1 V–S-CH4 = 1.0 V applied voltage with a stirring speed of 120–140 rpm
2 V–CH4 = 2.0 V applied voltage without stirring
2 V–S-CH4 = 2.0 V applied voltage with a stirring speed of 120–140 rpm
0V-S = no voltage with a stirring speed of 120 rpm
0V = no voltage without stirring
1V-S = 1.0 V applied voltage with a stirring speed of 120–140 rpm
1V = 1.0 V applied voltage without stirring
2V = 2.0 V applied voltage without stirring
2V-S = 2.0 V applied voltage with a stirring speed of 120–140 rpm
Indirect electromethanogenesis is another possible mechanism for methane production in MEC systems. In this reaction, hydrogenotrophic methanogens can combine hydrogen and carbon dioxide to form methane [9] (Equation (7)).
CO2 + 4H2 → CH4 + 2H2O

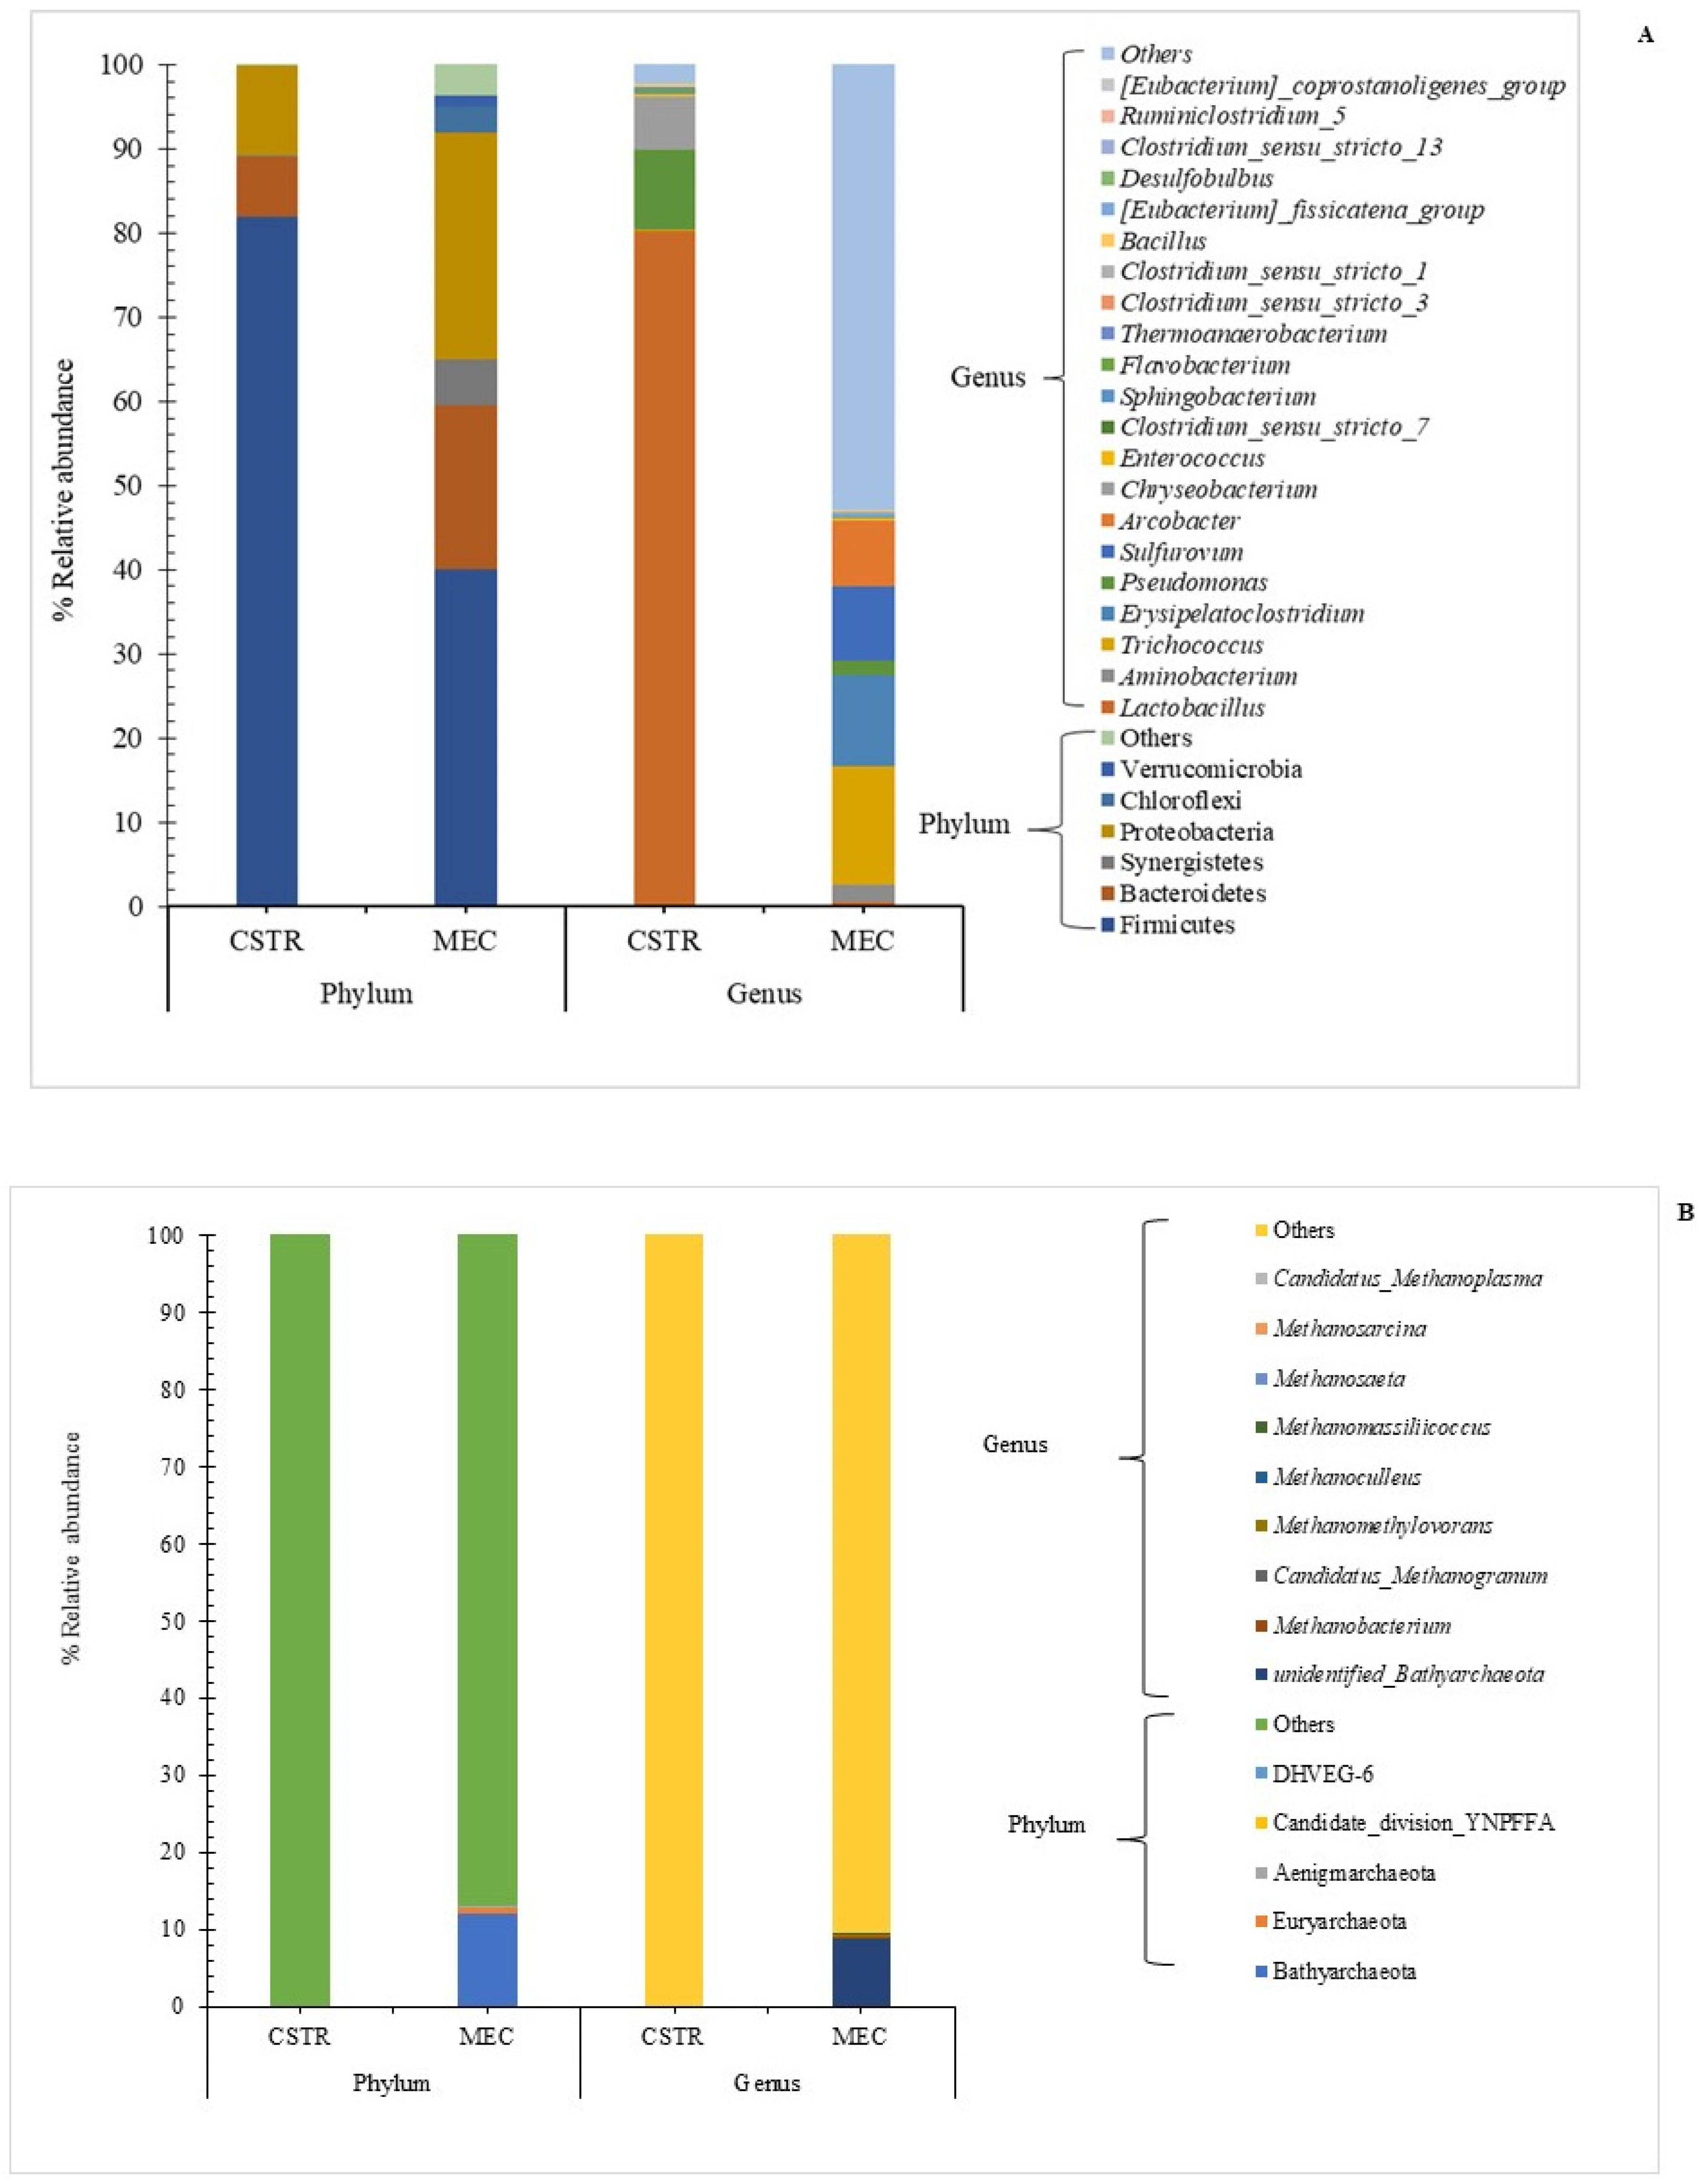
3.5. Microbial Community Analysis

The microbial community under optimal conditions of the CSTR at DW 99:1 WG (% v/v) and an MEC reactor supplied with 1 V electrical field are depicted in Figure 5. Firmicutes, Bacteroidetes, and Proteobacteria were the dominant phyla in the CSTR and MEC reactors. The relative abundances of Firmicutes, Bacteroidetes, and Proteobacteria in the CSTR were 81.86%, 7.21%, and 10.80%, respectively. In contrast, the relative abundances of Firmicutes, Bacteroidetes, and Proteobacteria in the MEC reactor were 39.96%, 19.55%, and 27.00%, respectively (Figure 5A). The Firmicutes phylum, the most abundant in the CSTR and MEC reactors, is essential for metabolizing organic molecules, such as organic acids, carbohydrates, and proteins [38]. Furthermore, Bacteroidetes have been linked to organic molecule metabolism and acidogenesis. Świątek et al. [39] reported that Firmicutes and Bacteroidetes were the dominant phyla found in the anaerobic digester using chicken manure and post-fermentation pulp as feedstock and inoculum, respectively. Proteobacteria are involved in the hydrolysis step of anaerobic digestion [40]. For the Archaea domain, the prevalence of three phyla, Bathyarchaeota (12.4%), Euryarchaeota (0.83%), and others, was only found in the MEC reactors. In contrast, only other phyla were observed in the CSTR (Figure 5B). The Bathyarchaeota and Euryarchaeota phyla were previously reported as the dominant archaea in anaerobic digesters [41].
The bacterial genera found at DW 99:1 WG (% v/v) in the CSRT reactor are presented in Figure 5A. The most abundant genera in the CSTR were Lactobacillus, Pseudomonas, Chryseobacterium, and Clostridium sensu stricto 7, and Trichococcus, Erysipelatoclostridium, Sulfurovum, and Arcobacter were the most prevalent bacteria found in the MEC (Figure 5A). Lactobacillus spp. are the most common acid-producing bacteria found during sugar fermentation [42]. Pseudomonas (Proteobacterium) is involved in hydrolytic enzyme production in the hydrolysis step and is associated with fermentation in anaerobic reactors [43]. Clostridium sensu stricto 7 (Firmicutes) is a common hydrogen-producing genus found in thermophilic fermentation [44]. All Clostridium sensu stricto strains produce butyrate as their primary metabolic product, not excluding the production of various organic acids and alcohols, such as formic acid and ethanol [45,46]. Therefore, the presence of Clostridium sensu stricto 7 confirmed that butyric acid was produced in the CSTR (Section 3.2).
For archaea, unidentified Bathyarchaeota, Metahnobacterium, Methanomethylovorans, and Methanoculleus were the dominant genera in the MEC reactor (Figure 5B). Metahnobacterium (0.30%) and Methanoculleus (0.11%) were reported as hydrogenotrophic methanogens [47]. Both species convert hydrogen and carbon dioxide into methane. Sun et al. [48] identified Methanoculleus as the dominant archaea in biogas digesters co-digested with cattle excreta and olive mill wastes during a temperature shift from 37 °C to 55 °C, which was most likely caused by an increase in hydrogen partial pressure. Methanomethylovorans (0.12%) strains were also the hydrogenotrophic methanogenic archaea [49]. The observation of Metahnobacterium (0.30%), Methanoculleus (0.11%), and Methanomethylovorans (0.12%) in the MEC reactor correlated with methane production using Equation (5). The results confirm that the archaea in the MEC reactor converted hydrogen and carbon dioxide into methane, consequently increasing methane production (Section 3.4). The presence of Methanoseata and Metahnosarcina in the MEC reactor proved that the electrons generated in the anode were further used to reduce carbon dioxide to methane, as shown in Equations (3) and (4) [50]. This methane production route is also known as direct electromethanogenesis.

4. Conclusions

This study indicates that co-digestion of DW and GW can provide suitable compositions that promote Clostridium spp. dominance as a crucial hydrogen producer in the dark fermentation process, which also enhances production. In this study, the hydrogen yield from co-digestion under optimal conditions was 1.54 times higher than from DW alone. Furthermore, hydrogen production was not observed when GW was used as a substrate alone. Coupling hydrogen production under a CSTR with the MEC–CH4 reactor promoted a better energy yield than the CSTR and MEC–CH4 alone. Therefore, integrating a CSTR with MEC–CH4 might be an excellent option for enhancing overall energy yield. Moreover, these results suggest a possible route for the integration of dark fermentation with MECs to improve hydrogen production and obtain methane as an alternative energy carrier.

Author Contributions

This study was made possible through the collaboration of all authors. Conceptualization, S.S. and P.K.; methodology, S.S. and P.K.; software, S.S., P.K. and R.J.; validation, S.S., P.K. and R.J.; formal analysis, S.B.; investigation, S.B.; resources, S.S. and P.K.; data curation, S.S., P.K. and R.J.; writing—original draft preparation, S.S., S.B., R.J. and P.K.; writing—review and editing, S.S., S.B., R.J., P.K. and A.R.; visualization, S.S.; supervision, A.R. and T.I.; project administration, S.S. and P.K.; funding acquisition, S.S. All authors have read and agreed to the published version of the manuscript.

Funding

This research was supported by Prince of Songkla University, Pattani Campus, and Tammasart University Research Fund under Research University Network (RUN) and Mahidol University; Energy cluster (Year 2017). Partial financial support was provided by Thailand Science Research and Innovation (TSRI) Senior Research Scholar (Grant No. RTA6280001).

Institutional Review Board Statement

Not applicable.

Informed Consent Statement

Not applicable.

Data Availability Statement

Not applicable.

Acknowledgments

The authors would like to thank the Bio-Mass Conversion to Energy and Chemicals (Bio-MEC) Research Unit, Prince of Songkla University, Pattani Campus, Faculty of Environment and Resource Studies, Mahidol University, and Research Group for Development of Microbial Hydrogen Production Process Khon Kaen University, and Bio-hythane Pilot Plant, Science Park, Khon Kaen University.

Conflicts of Interest

The authors declare no conflict of interest.

References

  1. Babadi, A.A.; Rahmati, S.; Fakhlaei, R.; Barati, B.; Wang, S.; Doherty, W.; Ostrikov, K. Emerging technologies for biodiesel production: Processes, challenges, and opportunities. Biomass Bioenergy 2022, 163, 106521. [Google Scholar] [CrossRef]
  2. Sittijunda, S.; Reungsang, A. Valorization of crude glycerol into hydrogen, 1,3-propanediol, and ethanol in an up-flow anaerobic sludge blanket (UASB) reactor under thermophilic conditions. Renew. Energy 2020, 161, 361–372. [Google Scholar] [CrossRef]
  3. Decarpigny, C.; Aljawish, A.; His, C.; Fertin, B.; Bigan, M.; Dhulster, P.; Millares, M.; Froidevaux, R. Bioprocesses for the Biodiesel Production from Waste Oils and Valorization of Glycerol. Energies 2022, 15, 3381. [Google Scholar] [CrossRef]
  4. Luo, X.; Ge, X.; Cui, S.; Li, Y. Value-added processing of crude glycerol into chemicals and polymers. Bioresour. Technol. 2016, 215, 144–154. [Google Scholar] [CrossRef] [PubMed] [Green Version]
  5. Kongjan, P.; Jariyaboon, R.; Reungsang, A.; Sittijunda, S. Co-fermentation of 1,3-propanediol and 2,3-butanediol from crude glycerol derived from the biodiesel production process by newly isolated Enterobacter sp.: Optimization factors affecting. Bioresour. Technol. Rep. 2021, 13, 100616. [Google Scholar] [CrossRef]
  6. Akhbari, A.; Ibrahim, S. Bioenergy recovery from food waste through dark fermentation direction. Res. Sq. 2022. preprint. [Google Scholar]
  7. Policastro, G.; Cesaro, A.; Fabbricino, M. Photo-fermentative hydrogen production from cheese whey: Engineering of a mixed culture process in a semi-continuous, tubular photo-bioreactor. Int. J. Hydrogen Energy 2022, in press. [Google Scholar] [CrossRef]
  8. Sun, M.; Sheng, G.-P.; Zhang, L.; Xia, C.-R.; Mu, Z.-X.; Liu, X.-W.; Wang, H.-L.; Yu, H.-Q.; Qi, R.; Yu, T.; et al. An MEC-MFC-Coupled System for Biohydrogen Production from Acetate. Environ. Sci. Technol. 2008, 42, 8095–8100. [Google Scholar] [CrossRef] [PubMed]
  9. Amrut Pawar, A.; Karthic, A.; Lee, S.; Pandit, S.; Jung, S.P. Microbial electrolysis cells for electromethanogenesis: Materials, configurations and operations. Environ. Eng. Res. 2022, 27, 200484. [Google Scholar] [CrossRef]
  10. Nelabhotla, A.B.T.; Dinamarca, C. Bioelectrochemical CO2 Reduction to Methane: MES Integration in Biogas Production Processes. Appl. Sci. 2019, 9, 1056. [Google Scholar] [CrossRef] [Green Version]
  11. Cheng, D.; Ngo, H.H.; Guo, W.; Chang, S.W.; Nguyen, D.D.; Deng, L.; Chen, Z.; Ye, Y.; Bui, X.T.; Hoang, N.B. Advanced strategies for enhancing dark fermentative biohydrogen production from biowaste towards sustainable environment. Bioresour. Technol. 2022, 351, 127045. [Google Scholar] [CrossRef]
  12. Badia-Fabregat, M.; Rago, L.; Baeza, J.A.; Guisasola, A. Hydrogen production from crude glycerol in an alkaline microbial electrolysis cell. Int. J. Hydrogen Energy 2019, 44, 17204–17213. [Google Scholar] [CrossRef]
  13. Sarma, S.J.; Brar, S.K.; Sydney, E.B.; Le Bihan, Y.; Buelna, G.; Soccol, C.R. Microbial hydrogen production by bioconversion of crude glycerol: A review. Int. J. Hydrogen Energy 2012, 37, 6473–6490. [Google Scholar] [CrossRef]
  14. Nguyen, P.K.T.; Das, G.; Kim, J.; Yoon, H.H. Hydrogen production from macroalgae by simultaneous dark fermentation and microbial electrolysis cell. Bioresour. Technol. 2020, 315, 123795. [Google Scholar] [CrossRef]
  15. Thu Ha Tran, T.; Khanh Thinh Nguyen, P. Enhanced hydrogen production from water hyacinth by a combination of ultrasonic-assisted alkaline pretreatment, dark fermentation, and microbial electrolysis cell. Bioresour. Technol. 2022, 357, 127340. [Google Scholar] [CrossRef] [PubMed]
  16. Im, S.; Yun, Y.-M.; Song, Y.-C.; Kim, D.-H. Enhanced anaerobic digestion of glycerol by promoting DIET reaction. Biochem. Eng. J. 2019, 142, 18–26. [Google Scholar] [CrossRef]
  17. Zeppilli, M.; Pavesi, D.; Gottardo, M.; Micolucci, F.; Villano, M.; Majone, M. Using effluents from two-phase anaerobic digestion to feed a methane-producing microbial electrolysis. Chem. Eng. J. 2017, 328, 428–433. [Google Scholar] [CrossRef]
  18. Prasertsan, P.; Leamdum, C.; Chantong, S.; Mamimin, C.; Kongjan, P.; O-Thong, S. Enhanced biogas production by co-digestion of crude glycerol and ethanol with palm oil mill effluent and microbial community analysis. Biomass Bioenergy 2021, 148, 106037. [Google Scholar] [CrossRef]
  19. Sittijunda, S.; Reungsang, A. Methane Production from the Co-digestion of Algal Biomass with Crude Glycerol by Anaerobic Mixed Cultures. Waste Biomass Valorization 2020, 11, 1873–1881. [Google Scholar] [CrossRef]
  20. Wongarmat, W.; Sittijunda, S.; Mamimin, C.; Reungsang, A. Acidogenic phase anaerobic digestion of pretreated sugarcane filter cake for co-digestion with biogas effluent to enhance the methane production. Fuel 2022, 310, 122466. [Google Scholar] [CrossRef]
  21. Hoarau, J.; Grondin, I.; Caro, Y.; Petit, T. Sugarcane Distillery Spent Wash, a New Resource for Third-Generation Biodiesel Production. Water 2018, 10, 1623. [Google Scholar] [CrossRef]
  22. Kongjan, P.; O-Thong, S.; Angelidaki, I. Biohydrogen production from desugared molasses (DM) using thermophilic mixed cultures immobilized on heat treated anaerobic sludge granules. Int. J. Hydrogen Energy 2011, 36, 14261–14269. [Google Scholar] [CrossRef]
  23. Thong, S.; Prasertsan, P.; Birkeland, N.K. Evaluation of methods for preparing hydrogen-producing seed inocula under thermophilic condition by process performance and microbial community analysis. Bioresour. Technol. 2009, 100, 909–918. [Google Scholar] [CrossRef]
  24. Angelidaki, I.; Sanders, W. Assessment of the anaerobic biodegradability of macropollutants. Re Views Environ. Sci. Bio Technol. 2004, 3, 117–129. [Google Scholar] [CrossRef]
  25. Zhou, J.; Bruns, M.A.; Tiedje, J.M. DNA recovery from soils of diverse composition. Appl. Environ. Microbiol. 1996, 62, 316–322. [Google Scholar] [CrossRef] [Green Version]
  26. Edgar, R.C. UPARSE: Highly accurate OTU sequences from microbial amplicon reads. Nat. Methods 2013, 10, 996–998. [Google Scholar] [CrossRef]
  27. Clesceri, L.S. Standard Methods for Examination of Water and Wastewater; American Public Health Association: Washington, DC, USA, 1998; Volume 9. [Google Scholar]
  28. Official Methods of Analysis of AOAC International, 19th ed.; AOAC International: Gaithersburg, MD, USA, 2012.
  29. Sani, K.; Jariyaboon, R.; O-Thong, S.; Cheirsilp, B.; Kaparaju, P.; Raketh, M.; Kongjan, P. Deploying two-stage anaerobic process to co-digest greasy sludge and waste activated sludge for effective waste treatment and biogas recovery. J. Environ. Manag. 2022, 316, 115307. [Google Scholar] [CrossRef] [PubMed]
  30. Mata-Alvarez, J.; Dosta, J.; Romero-Güiza, M.S.; Fonoll, X.; Peces, M.; Astals, S. A critical review on anaerobic co-digestion achievements between 2010 and 2013. Renew. Sustain. Energy Rev. 2014, 36, 412–427. [Google Scholar] [CrossRef]
  31. Hartmann, H.; Angelidaki, I.; Ahring, B.K. Co-digestion of the organic fraction of municipal waste with other waste types. In Biomethanization of the Organic Fraction of Municipal Solid Wastes; IWA Publishing: London UK, 2002; pp. 181–200. [Google Scholar]
  32. Venkataramanan, K.P.; Boatman, J.J.; Kurniawan, Y.; Taconi, K.A.; Bothun, G.D.; Scholz, C. Impact of impurities in biodiesel-derived crude glycerol on the fermentation by Clostridium pasteurianum ATCC 6013. Appl. Microbiol. Biotechnol. 2012, 93, 1325–1335. [Google Scholar] [CrossRef]
  33. Sittijunda, S.; Reungsang, A. Media optimization for biohydrogen production from waste glycerol by anaerobic thermophilic mixed cultures. Int. J. Hydrogen Energy 2012, 37, 15473–15482. [Google Scholar] [CrossRef]
  34. Hamawand, I.; Baillie, C. Anaerobic Digestion and Biogas Potential: Simulation of Lab and Industrial-Scale Processes. Energies 2015, 8, 454–474. [Google Scholar] [CrossRef]
  35. Issah, A.A.; Kabera, T. Impact of volatile fatty acids to alkalinity ratio and volatile solids on biogas production under thermophilic conditions. Waste Manag. Res. J. Int. Solid Wastes Public Clean. Assoc. ISWA 2021, 39, 871–878. [Google Scholar] [CrossRef] [PubMed]
  36. Ding, A.; Yang, Y.; Sun, G.; Wu, D. Impact of applied voltage on methane generation and microbial activities in an anaerobic microbial electrolysis cell (MEC). Chem. Eng. J. 2016, 283, 260–265. [Google Scholar] [CrossRef]
  37. Jayabalan, T.; Matheswaran, M.; Naina Mohammed, S. Biohydrogen production from sugar industry effluents using nickel based electrode materials in microbial electrolysis cell. Int. J. Hydrogen Energy 2019, 44, 17381–17388. [Google Scholar] [CrossRef]
  38. Li, Y.; Zhang, R.; Chen, C.; Liu, G.; He, Y.; Liu, X. Biogas production from co-digestion of corn stover and chicken manure under anaerobic wet, hemi-solid, and solid state conditions. Bioresour. Technol. 2013, 149, 406–412. [Google Scholar] [CrossRef] [PubMed]
  39. Świątek, M.; Lewicki, A.; Szymanowska, D.; Kubiak, P. The effect of introduction of chicken manure on the biodiversity and performance of an anaerobic digester. Electron. J. Biotechnol. 2019, 37, 25–33. [Google Scholar] [CrossRef]
  40. Wang, H.; Zhu, X.; Yan, Q.; Zhang, Y.; Angelidaki, I. Microbial community response to ammonia levels in hydrogen assisted biogas production and upgrading process. Bioresour. Technol. 2020, 296, 122276. [Google Scholar] [CrossRef]
  41. Vanwonterghem, I.; Evans, P.N.; Parks, D.H.; Jensen, P.D.; Woodcroft, B.J.; Hugenholtz, P.; Tyson, G.W. Methylotrophic methanogenesis discovered in the archaeal phylum Verstraetearchaeota. Nat. Microbiol. 2016, 1, 16170. [Google Scholar] [CrossRef] [Green Version]
  42. Florou-Paneri, P.; Christaki, E.; Bonos, E. Lactic acid bacteria as source of functional ingredients. In Lactic Acid Bacteria—R & D for Food, Health and Livestock Purposes; Kongo, M., Ed.; Intech Open: Rijeka, Croatia, 2012; pp. 589–614. [Google Scholar]
  43. Tsapekos, P.; Kougias, P.G.; Treu, L.; Campanaro, S.; Angelidaki, I. Process performance and comparative metagenomic analysis during co-digestion of manure and lignocellulosic biomass for biogas production. Appl. Energy 2017, 185, 126–135. [Google Scholar] [CrossRef]
  44. Zhang, J.; Zhao, W.; Yang, J.; Li, Z.; Zhang, J.; Zang, L.J.B.T. Comparison of mesophilic and thermophilic dark fermentation with nickel ferrite nanoparticles supplementation for biohydrogen production. Bioresour. Technol. 2021, 329, 124853. [Google Scholar] [CrossRef]
  45. Silva, V.; Ratti, R.; Sakamoto, I.; Andrade, M.; Varesche, M.J.R.E. Biotechnological products in batch reactors obtained from cellulose, glucose and xylose using thermophilic anaerobic consortium. Renew. Energy 2018, 125, 537–545. [Google Scholar] [CrossRef]
  46. Strazzera, G.; Battista, F.; Tonanzi, B.; Rossetti, S.; Bolzonella, D. Optimization of short chain volatile fatty acids production from household food waste for biorefinery applications. Environ. Technol. Innov. 2021, 23, 101562. [Google Scholar] [CrossRef]
  47. Enzmann, F.; Mayer, F.; Rother, M.; Holtmann, D. Methanogens: Biochemical background and biotechnological applications. AMB Express 2018, 8, 1. [Google Scholar] [CrossRef] [PubMed]
  48. Sun, L.; Pope, P.B.; Eijsink, V.G.; Schnürer, A. Characterization of microbial community structure during continuous anaerobic digestion of straw and cow manure. Microb. Biotechnol. 2015, 8, 815–827. [Google Scholar] [CrossRef] [PubMed] [Green Version]
  49. Lomans, B.P.; Maas, R.; Luderer, R.; Op den Camp, H.J.; Pol, A.; van der Drift, C.; Vogels, G.D. Isolation and characterization of Methanomethylovorans hollandica gen. nov., sp. nov., isolated from freshwater sediment, a methylotrophic methanogen able to grow on dimethyl sulfide and methanethiol. Appl. Environ. Microbiol. 1999, 65, 3641–3650. [Google Scholar] [CrossRef] [PubMed]
  50. Liu, W.; Wang, L.; Gao, L.; Wang, A.-J. Chapter 5.10—Hydrogen and Methane Production in Bioelectrochemical System: Biocathode Structure and Material Upgrading. In Microbial Electrochemical Technology; Mohan, S.V., Varjani, S., Pandey, A., Eds.; Elsevier: Amsterdam, The Netherlands, 2019; pp. 921–953. [Google Scholar]
Figure 1. Cumulative hydrogen production (A) and hydrogen yield (B) in the dark fermentative of DW and GW co-digestion at various ratios. Significant variations between samples at various DW:GW ratios are denoted by values marked with various lowercase letters (p < 0.05).
Fermentation 08 00537 g001
Figure 2. Volatile fatty acid production at the end of dark fermentative DW and GW co-digestion at various ratios. Significant variations between samples at various DW:GW ratios are denoted by values marked with various lowercase letters (p < 0.05).
Fermentation 08 00537 g002
Figure 3. Hydrogen yield and pH (A) and total volatile fatty acid and alkalinity concentrations (B) during the continuous hydrogen production from DW and GW co-digestion at 99:1 (% v/v). The solid triangle and transparent circle symbols are total volatile fatty acid (TVFA) and alkalinity (ALK), respectively.
Fermentation 08 00537 g003
Figure 4. Cumulative methane production (A) and yield (B) using the dark fermentation effluent in the microbial electrolysis cell reactor at various voltages. Different lowercase letters indicate significant differences between reactor at different operation conditions (p < 0.05).
Fermentation 08 00537 g004
Figure 5. Relative abundance of the dominant microbial taxonomic groups separated using the total 16S rRNA gene sequences. (A) Bacterial species at the phylum and genus levels and their respective distribution bar charts of relative abundance. “Others” represents the total relative abundance of the remaining genera. (B) Archaea species at phylum and genus levels and their respective distribution bar charts of relative abundance. “Others” represents the total relative abundance of the remaining genera. CSTR and MEC are the continuously stirred tank reactor and microbial electrolysis cell reactor.
Fermentation 08 00537 g005
Table 1. Distillery wastewater (DW) and glycerol waste (GW) characteristics.
ParameterDWGW
pH4.810.0
Total solid (TS, g/L)220.9 ± 53.0769.1 ± 0.5
Volatile solid (VS, g/L)160.6 ± 33.0688.7 ± 0.1
Ash (g/L)60.3 ± 49.780.4 ± 0.6
Chemical oxygen demand (COD, g/L)106.8 ± 12.9622.9 ± 93.1
Total Kjeldahl nitrogen (g/L)4.3 ± 0.20.5 ± 0.3
Nitrogen content (%wt)0.4 ± 0.0ND
Carbon content (%wt)5.7 ± 0.047.8 ± 0.0
C/N ratio14.747.8
Hydrogen content (%wt)10.2 ± 0.010.0 ± 0.0
Oxygen content (%wt)74.1 ± 0.339.3 ± 0.3
ND = Not detected.
Table 2. INH and INM characteristics.
ParameterINHINM
pH6.07.3
TS (g/L)23.6 ± 2.650.5 ± 2.5
Total dissolved solid (g/L)16.0 ± 1.54.5 ± 1.3
Total suspended solid (g/L)7.7 ± 2.946.0 ± 1.2
VS (g/L)14.3 ± 2.137.8 ± 2.6
Volatile suspended solid (g/L)7.7 ± 2.933.3 ± 1.6
Volatile dissolved solid (g/L)6.7 ± 1.04.5 ± 1.3
Ash (g/L)9.3 ± 0.712.7 ± 0.4
Publisher’s Note: MDPI stays neutral with regard to jurisdictional claims in published maps and institutional affiliations.

