Abstract
Despite the rise of ‘omics techniques for the study of biological systems, the quantitative description of phenotypes still rests to a large extent on quantitative data produced on chromatography platforms. Here, we describe an improved liquid chromatography method for the determination of sugars, carboxylates, alcohols and aldehydes in microbial fermentation samples and cell extracts. Specific emphasis is given to substrates and products currently pursued in industrial microbiology. The present method allows quantification of 21 compounds in a single run with limits of quantification between 10−7 and 10−10 mol and limits of detection between 10−9 and 10−11 mol.
1. Introduction
High performance liquid chromatography (HPLC) has been widely used for quantification of compounds in biological samples [1]. It is precise, quantitative and highly reproducible, but, depending on the analysis, HPLC can be slow and the analysis of different compound classes are best performed with dedicated columns and methods [2]. To date, numerous HPLC-based methods have been developed for analyzing sugars [3], organic acids [4,5] and alcohols [6], respectively. However, running multiple dedicated methods has an impact on sample throughput, unless several instruments are available. In addition, sample throughput can only be increased by reducing chromatographic acquisition time, which may subsequently compromise peak resolution and, thus, data reproducibility. Therefore, a combined method permitting analysis of multiple compound classes is preferable and desirable, permitting the analyst to strike a balance between best possible analysis and throughput. However, the few published combined methods were either operated at high temperatures or achieved lower compound resolutions [7,8].
Despite the progress in column development in other areas of chromatography, such as rapid resolution in reversed phase applications, the method of choice for combined quantification of alcohols, organic acids and sugars is still ion-exchange chromatography [9,10], and due to the use of refractive index detection for sugar and alcohol analysis, this is still mainly based on isocratic elution.
Amongst a wide range of applications for such analyses in the food and chemical industries, one important application is in biotechnology research. In particular, the quantitative analysis of compounds from fermentation samples can serve as an essential tool for the understanding of microbial phenotypes and for the development of improved microbial strains for the production of biofuels, fine chemicals or bulk chemical feedstocks as replacements for petrochemicals.
Here, we present a thoroughly tested method that has broad application in microbiological research, providing quantitative data for a range of common substrates in microbial fermentation including hexoses, pentoses and disaccharides, while at the same time covering a broad range of fermentation products including mono-, di-, tri-alcohols, aldehydes, mono-, di- and tri-carboxylic acids, as well as sugar acids. While still based on cation-exchange, the method provides optimized operation temperature and mobile phase composition for a recently commercialized column. It has been optimized for simultaneous quantification of at least 21 compounds, including carbohydrates to varied alcohol products via central metabolism and has been applied to three very different samples.
2. Experimental Section
2.1. Chemicals
A list of 30 compounds was tested, and all chemicals used in the study were of analytical grade and were purchased from Sigma–Aldrich (Sydney, Australia). Aqueous analyte solutions and mobile phase were prepared using high purity water (18.2 kΩ) generated by an Elga Lab water purification system (Veolia Water Solutions and Technologies, Saint Maurice Cedex, France).
2.2. HPLC Set up
Separation of compounds was performed on an Agilent 1200 HPLC system using an Agilent Hiplex H column (300 × 7.7 mm, PL1170-6830, Santa Clara, CA, USA) with a guard column (SecurityGuard Carbo-H, Phenomenex PN: AJO-4490; Lane Cove West, New South Wales, Australia) for extended column life. Moreover, to extend column life, the column is cleaned with 0.2 mL/min of high purity water (18.2 MΩ) at 60 °C overnight and then regenerated with the same conditions using 25 mM sulfuric acid for a few hours, which is ideally performed after each batch of analysis. With regular column maintenance and careful sample preparation (e.g., samples pre-filtered using 0.22 µm PES syringe filter (Millipore: Cork, Ireland) and pre-diluted microbial fermentation samples) we have been able to make more than 200 injections per batch of analysis without change in column performance (i.e., without significant RT drift or increase in back pressure).
Sugars and alcohols were monitored using a refractive index detector (Agilent RID, G1362A) set on positive polarity and optical unit temperature of 40 °C with mobile phase in the reference cell, while organic acids were monitored using RID and/or ultraviolet detector at 210 nm (Agilent MWD, G1365B).
A sample volume of 30 µL was injected onto the column using an autosampler (Agilent HiP-ALS, G1367B) and the column temperature was maintained at 40 °C using a thermostatically controlled column compartment (Agilent TCC, G1316A). Analytes were eluted isocratically with 14 mM H2SO4 at 0.4 mL/min for 38 or 65 min (elution time was dependent upon whether higher alcohols were present in the sample). Chromatograms were integrated using Agilent ChemStation (Rev B.03.02; Santa Clara, CA, USA).
3. Results and Discussions
A series of preliminary experiments were conducted to monitor the interaction of the retention times (RT) of compounds from various classes with column temperature (30, 50 and 65 °C), mobile phase concentration (2, 4, 6, 8, 10, 12 and 14 mM) and flow rate (0.4, 0.5 and 0.6 mL/min) (see supplementary information) and found that a column temperature of 40 °C, aqueous solution of H2SO4 (14 mM) and a flow rate of 0.4 mL/min was the best combination to achieve separation of the highest number of target compounds.
With the optimized operating parameters, the method developed in this article is suitable for mapping varied metabolic routes from carbohydrates, via carboxylic acids to alcoholic products (Figure 1) and is, thus, highly relevant for fermentation process development.
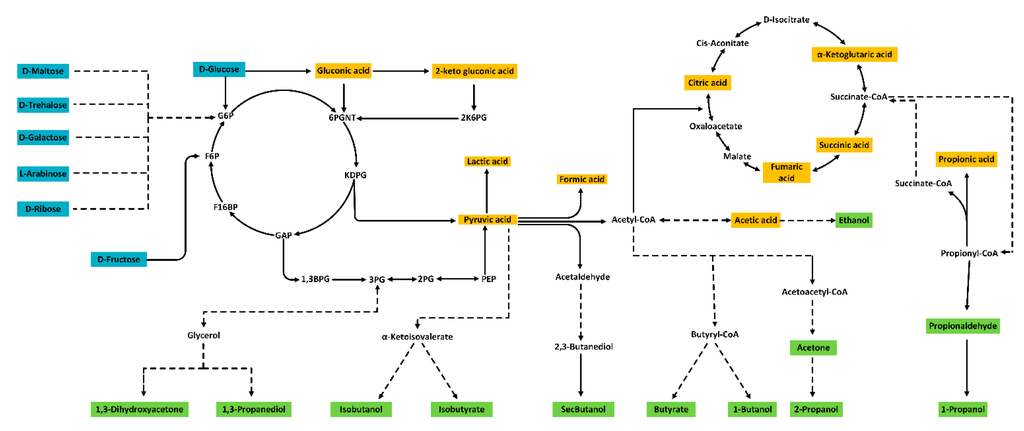
Figure 1.
Substrates, intermediates and products of microbial fermentation captured by the presented method in culture broth. Sugars (blue), organic acids (yellow), alcohols, ketones and aldehydes (green).
Looking at widely used sugar substrates for fermentation [11] and sugar products occurring in bioprocesses [12], our method has the capacity to separate d-trehalose, d-glucose, d-galactose, l-arabinose and d-ribose in the same sample. d-fructose and d-galactose partially overlap, which means they should only be quantified if the other sugar is known to be absent from the sample, the same holds for the disaccharides d-maltose and d-trehalose. Sucrose exhibited partial on/in-column inversion and cannot be analyzed reliably with the presented method, however the same column with water as the mobile phase would be suitable for sucrose quantification (data not shown).
In addition to the fermentation substrates, 10 organic acids related to central metabolism were identifiable and quantifiable in a single injection with this method, including two specific sugar acids, gluconic acid and 2-ketogluconic acid, making this method suitable for microbes that favour the Embden–Meyerhof–Parnas, as well as those using the Entner–Doudoroff pathway for sugar utilization. This extends the applicability of the method amongst others to the group of Pseudomonads, which contains a range of new strains for biotechnology that are currently widely studied for biosynthesis of chemicals [13]. It has to be noted that citric acid and 2-ketogluconic acid co-elute with this method and should not occur simultaneously. Previously published methods struggled to separate compounds like formic acid and fumaric acid, 2-ketoglutaric acid and citric acid, pyruvic acid and glucose [14]. These can now be successfully resolved and quantified in the same sample.
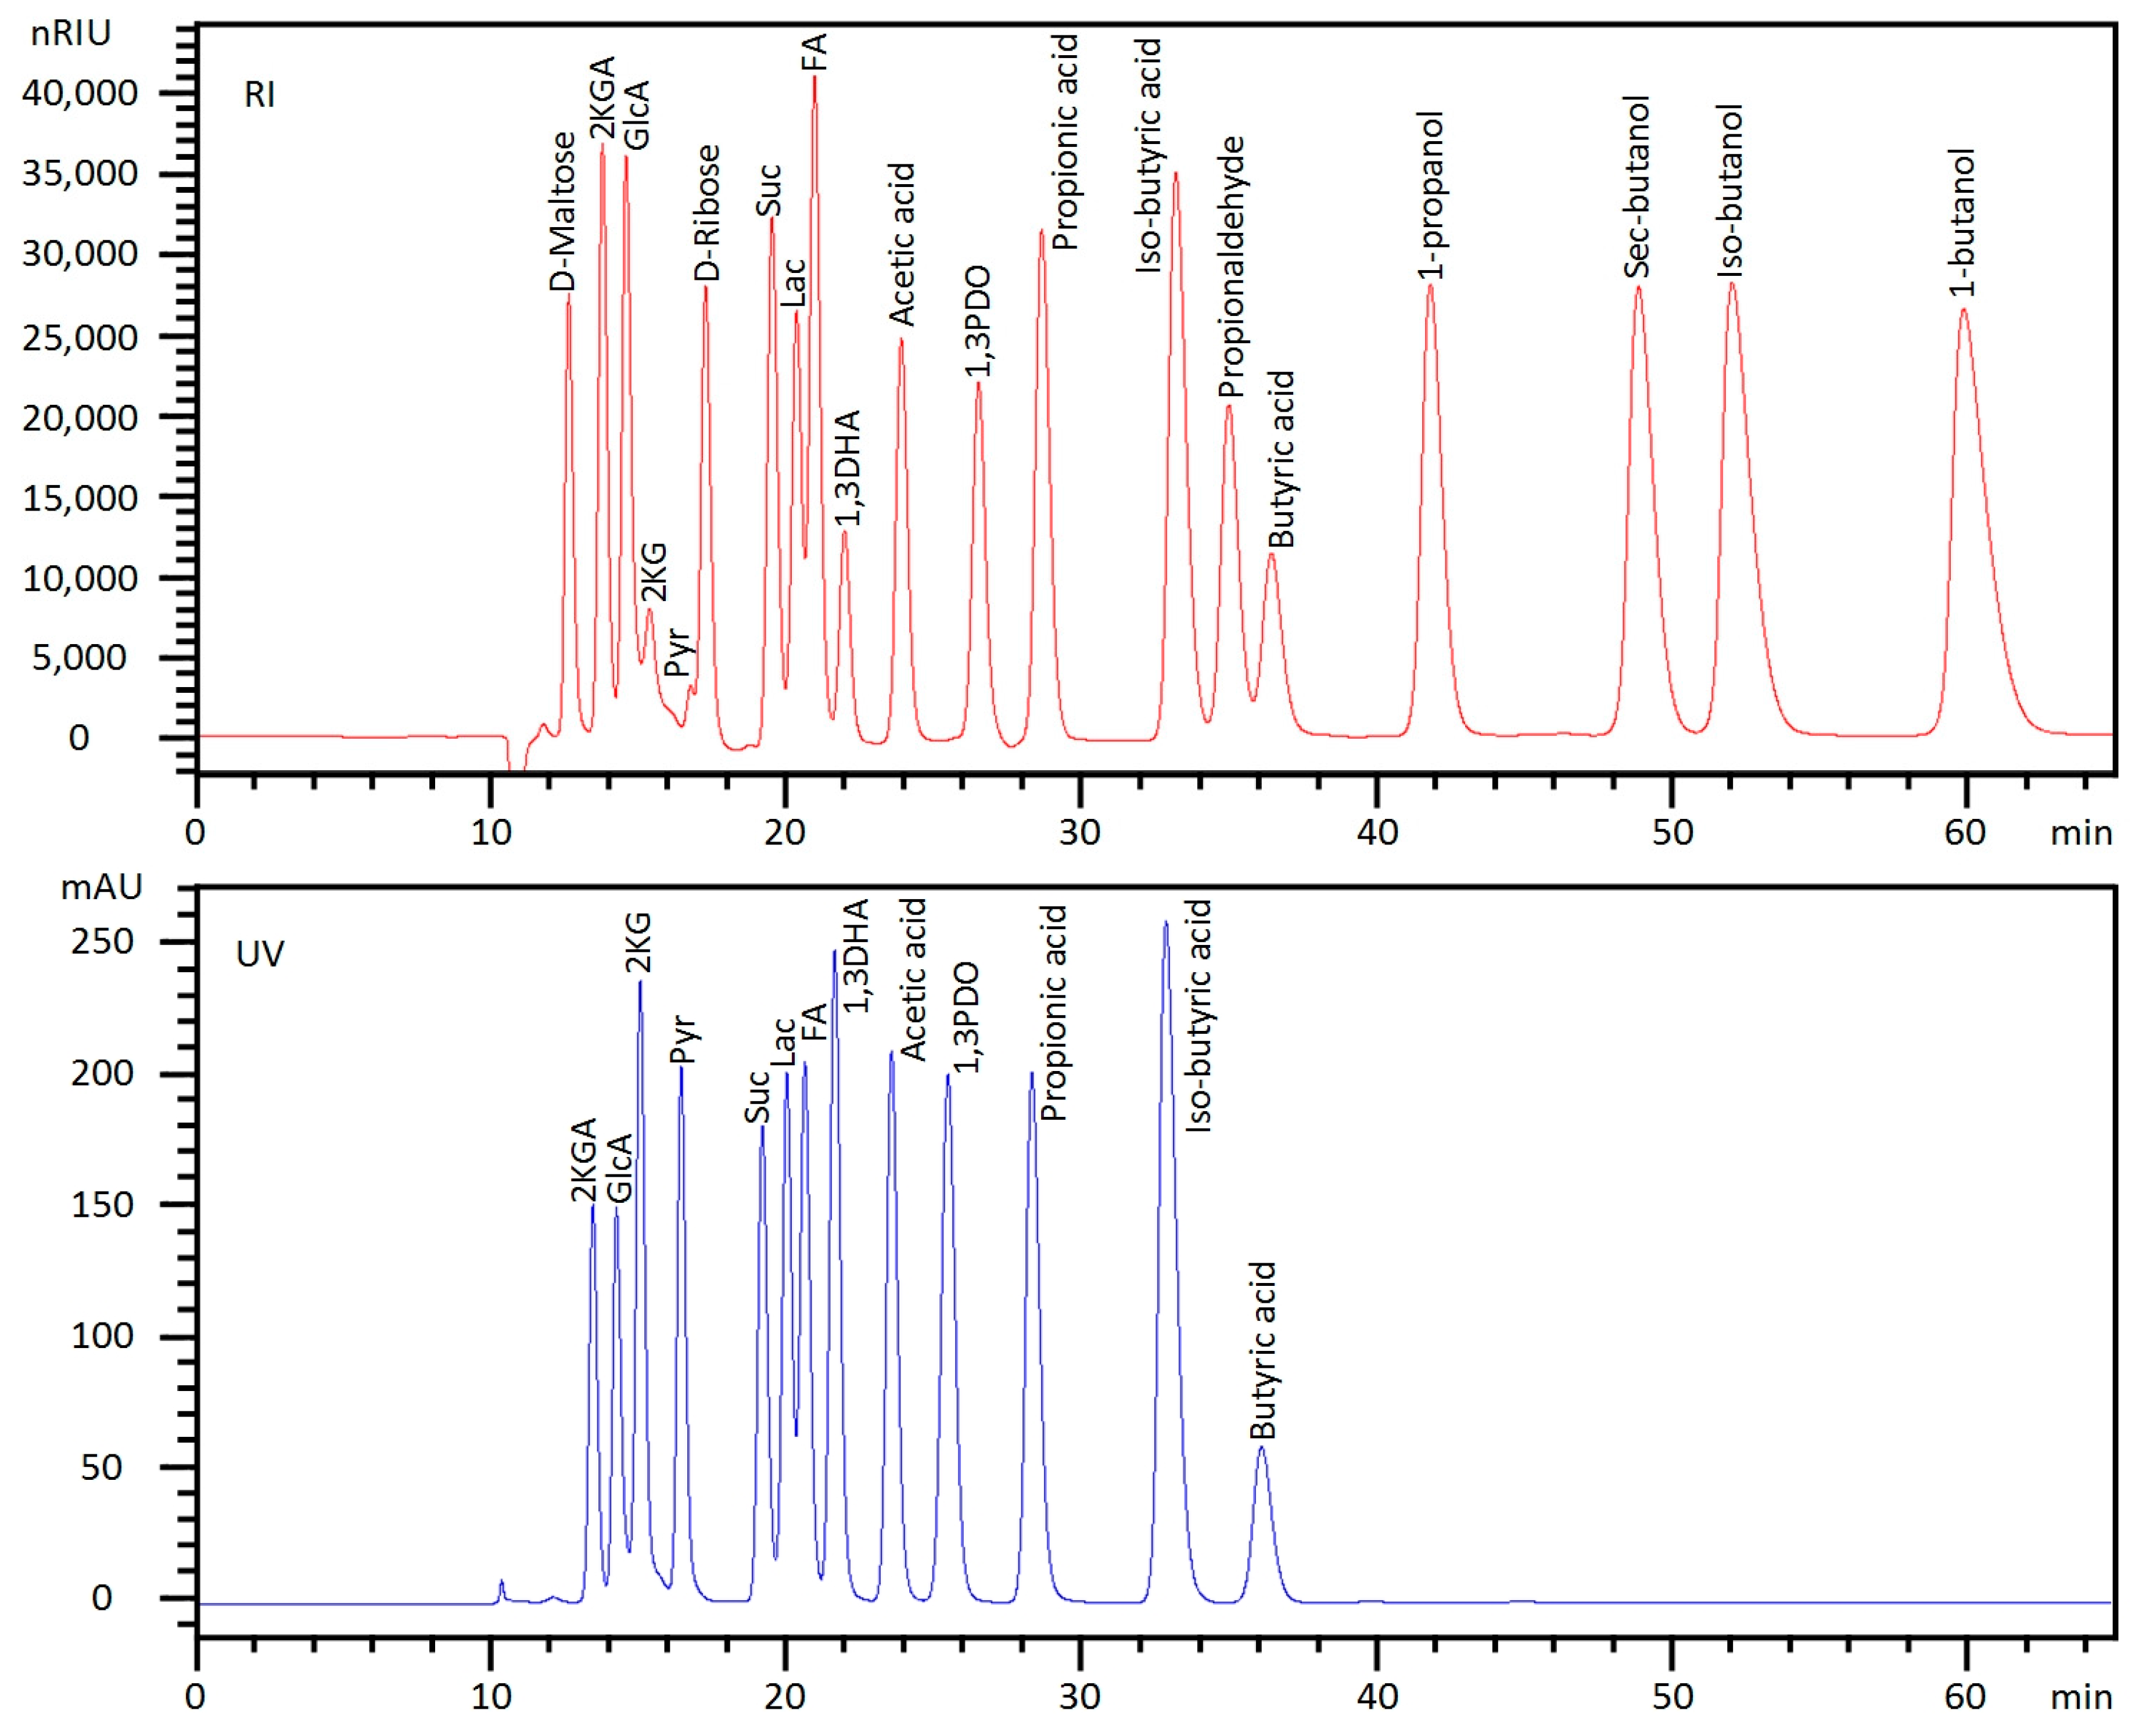
Looking at target compounds for biotechnology, this method is able to analyze a range of alcohols currently studied as biofuels and chemical feedstock replacements. This includes ethanol, 1-butanol, sec-butanol, iso-butanol, 1-propanol as well as 2-propanol (Table 1). Acetone and its structural isomer propionaldehyde are the metabolic precursors to 2-propanol and 1-propanol, respectively, and can now be analyzed with their respective end product in the same solution. Butyric acid and iso-butyric acid, the main by-products of butanol fermentation, can be quantified simultaneously as well. One problem is the separation of 2-propanol and butyric acid, these will partly overlap with the current chromatographic conditions. In any case, peak identification should be confirmed with alternative means (e.g., mass spectrometry) in complex samples. The calibration curves achieved a good fit and recoveries in the standard matrix were high (Table 1). The achieved peak shape and elution profiles were acceptable for an isocratic HPLC method (Figure 2).

Table 1.
Analytes quantified with the presented method in order of retention time. LOQ: limit of quantification; S/N: Signal-to-Noise ratio; LOD: limit of detection. LOQ and LOD are given both as concentration in the sample, as well as amount injected. LOQ, LOD and S/N were detected and calculated based on the specified detector for quantification for each compound. In other sample matrices LOQ, LOD and S/N might vary. Calibration curves were obtained through linear regression (forced through the origin) of five standard points covering the linear detection range. UV/RT: retention time in UV detector; RI/RT: retention time in RI detector, detectors in series.
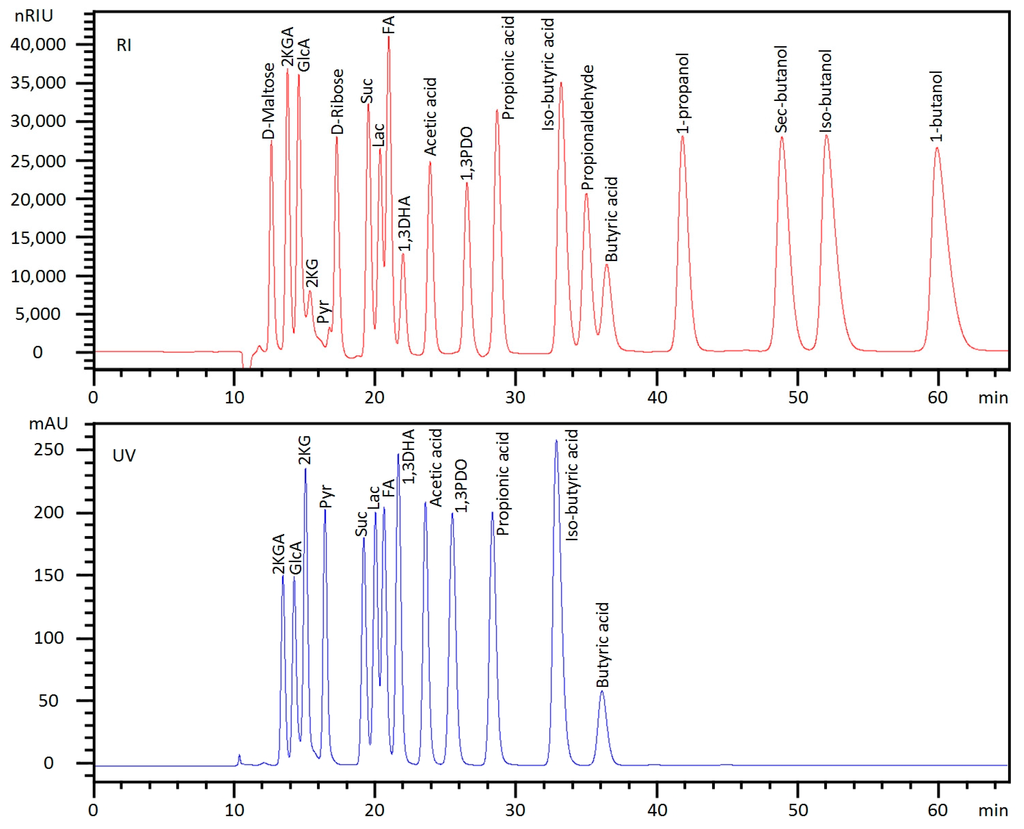
Figure 2.
HPLC chromatograms of selected standard mixture that is quantifiable in a single injection. Note: Not all compounds listed in Table 1 are included in the mixture and focus should be on peak shape. Abbreviations: Mal (Maltose), 2KGA (2-Ketogluconic acid), GlcA (Gluconic acid), 2KG (2-Ketoglutaric acid), Pyr (Pyruvic acid), Suc (Succinic acid), Lac (Lactic acid), FA (Formic acid), 1,3DHA (1,3-Dihydroxyacetone), 1,3PDO (1,3-Propanediol).
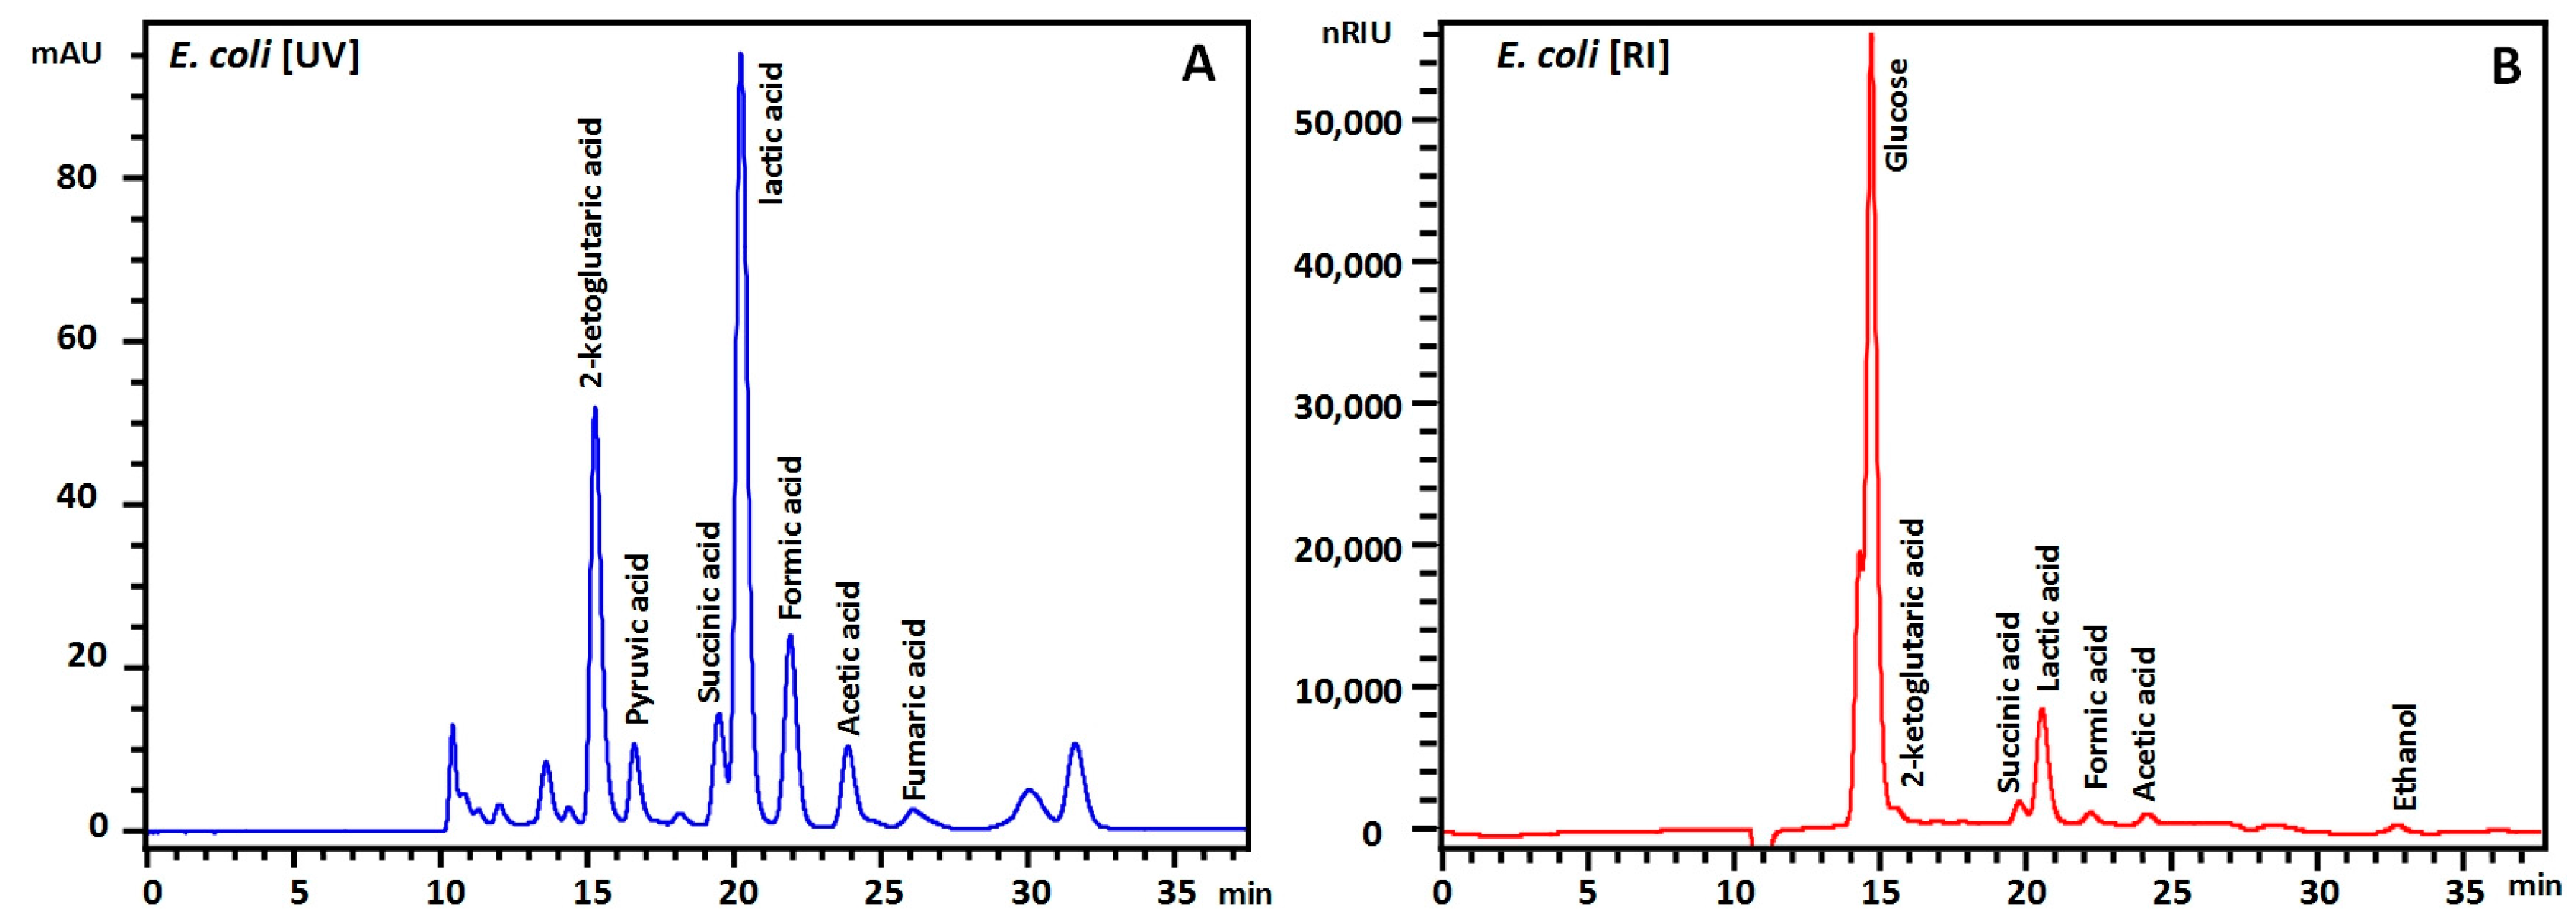
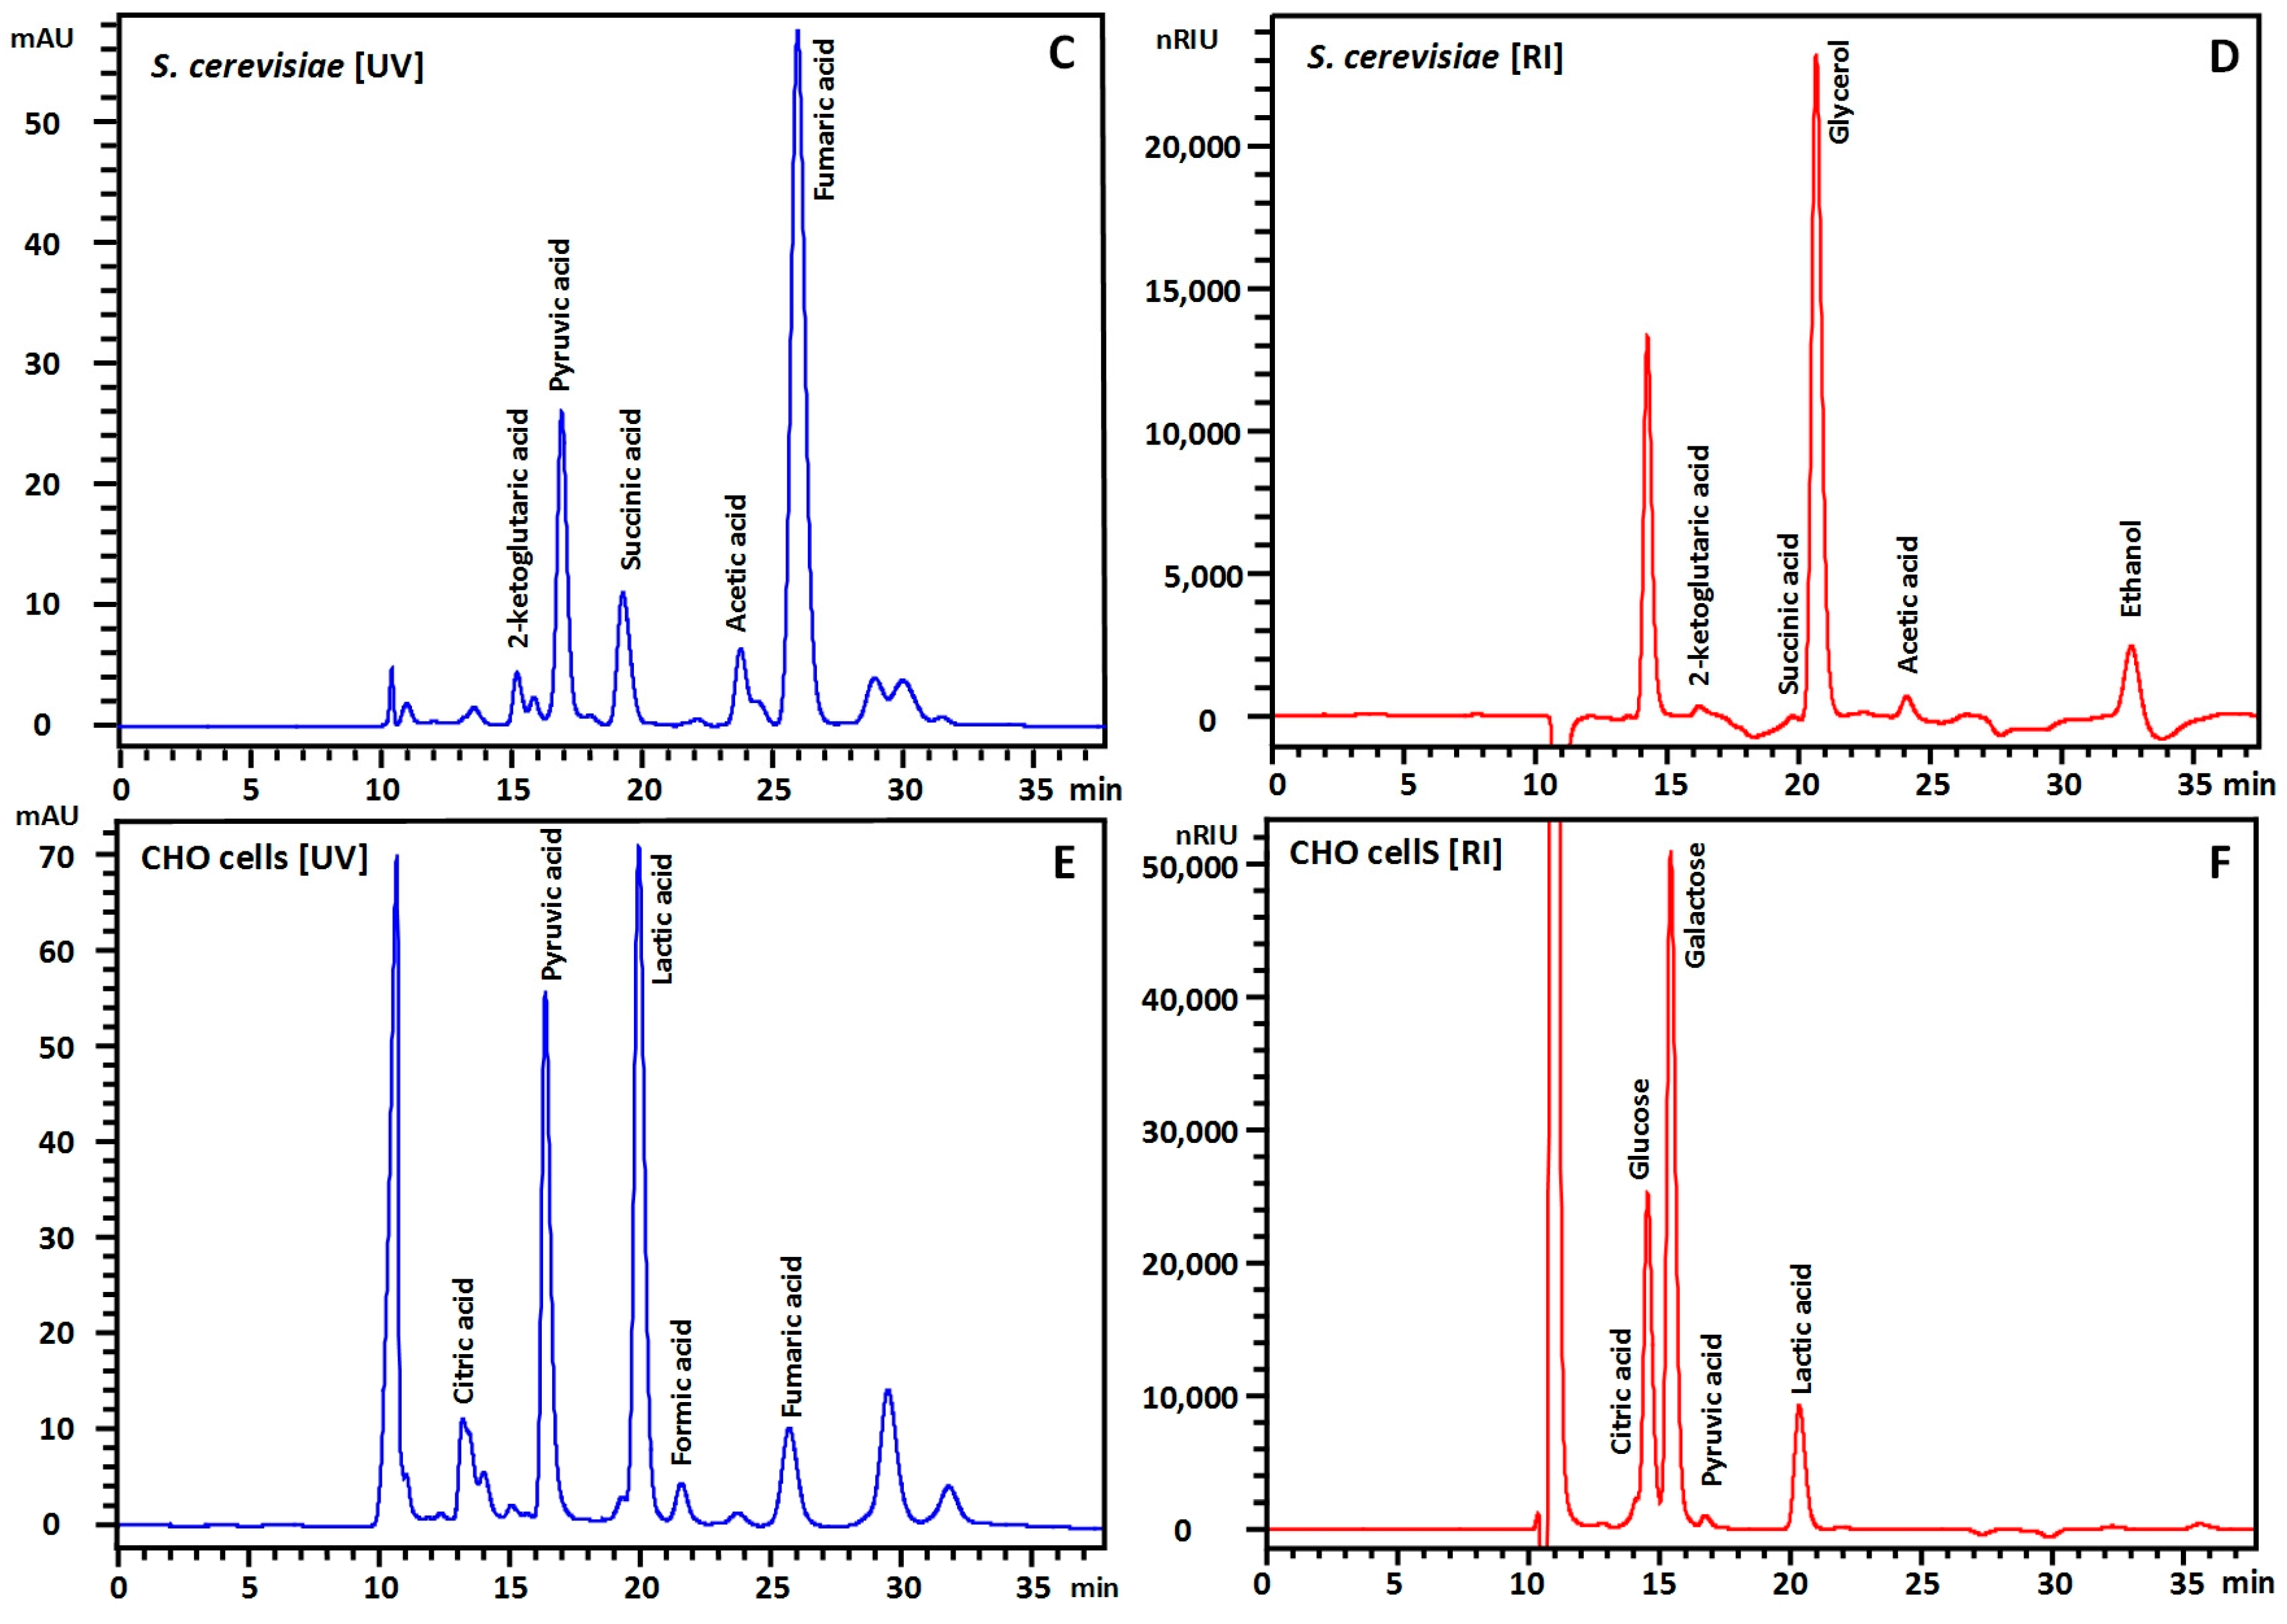
Finally, the method was tested on three different samples: (i) fermentation broth of a genetically modified Escherichia coli fermentation during aerobic growth on glucose in minimal medium; (ii) fermentation broth of Saccharomyces cerevisiae growing on the carbon sources glycerol and ethanol in minimal medium and finally; (iii) the culture supernatant of Chinese Hamster Ovary (CHO) cells in complex cell culture medium using glucose and galactose as the main carbon source (Figure 3). In all three samples peak shapes and separation was good and the main substrates and products could successfully be quantified. This demonstrates the robustness and versatility of the described method. Based on the limits of detection, this method should also in principle be applicable to cell extracts. Quantitative data obtained from this method on fermentation samples of Pseudomonas putida was of sufficient quality to close the carbon and redox balances [15], underlining the value of this method for a range of applications.

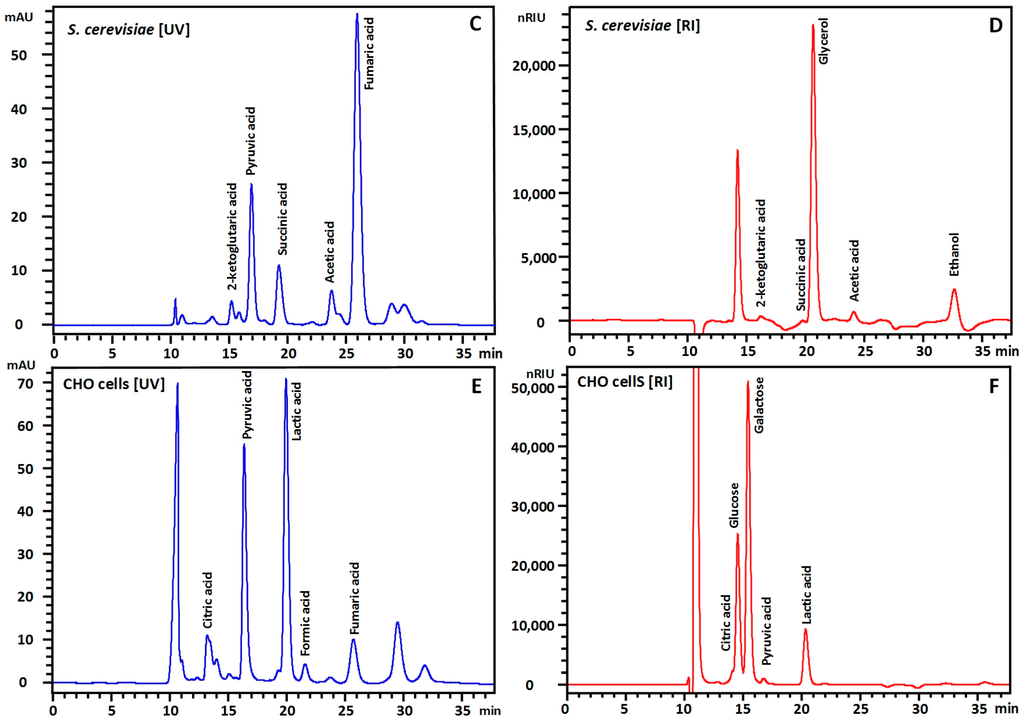
Figure 3.
HPLC chromatograms for supernatants of genetically modified E. coli (A,B) growing on glucose in minimal medium, genetically modified S. cerevisiae growing on glycerol and ethanol (C,D) in minimal medium and Chinese Hamster Ovary (CHO) cells growing on galactose and glucose in defined cell culture medium. Chromatograms serve the purpose of highlighting resolving power and are not a reference chromatogram for the respective organisms. Detection is performed with UV (A,C,E) and RI (B,D,F). In these samples, no signals were observed beyond 35 min and chromatograms have been shortened for better visibility of the peaks. Injection signals are visible at around 10 min in UV and 10.4 min RI. Complex medium components in the CHO experiment mainly pass through the column (E,F).
4. Conclusions
In summary, a broad range of metabolites could be separated and quantified in one HPLC injection with LOQ and LOD in ranges that will be suitable for a large range of fermentation samples, including microbial culture broth and cell culture media and could be extended to intracellular samples. The data quality allows drawing of carbon and degree of reduction balances. The method can be extended to other compounds, if presence of co-eluting compounds can be ruled out with alternative methods (e.g., by mass spectrometry on pooled samples).
Supplementary Materials
Supplementary materials can be found at http://www.mdpi.com/2311-5637/2/1/6/s1.
Acknowledgments
Bin Lai acknowledges scholarship support from The University of Queensland. Manuel R. Plan and Mark P. Hodson acknowledge financial support from Metabolomics Australia. Jens O. Krömer was supported by the Australian Research Council (DE120101549). We thank Alex Prima, Nils Averesch, Axayacatl Gonzalez Garcia and Veronica Martinez for the supply of samples.
Author Contributions
Bin Lai and Manuel R. Plan designed, performed the experiments and analyzed the data, under the guidance from Mark P. Hodson and Jens O. Krömer. All authors contributed to the drafting and editing of the manuscript.
Conflicts of Interest
The authors declare no conflict of interest.
References
- Pereira da Costa, M.; Conte-Junior, C.A. Chromatographic methods for the determination of carbohydrates and organic acids in foods of animal origin. Compr. Rev. Food Sci. Saf. 2015, 14, 586–600. [Google Scholar] [CrossRef]
- Ball, S.; Lloyd, L. Agilent Hi-Plex Columns for Carbohydrates, Alcohols, and Acids. Available online: http://www.agilent.com/cs/library/applications/5990--8264EN.pdf (accessed on 7 March 2016).
- Agblevor, F.A.; Hames, B.R.; Schell, D.; Chum, H.L. Analysis of biomass sugars using a novel hplc method. Appl. Biochem. Biotechnol. 2007, 136, 309–326. [Google Scholar] [CrossRef] [PubMed]
- Womersley, C.; Drinkwater, L.; Crowe, J.H. Separation of tricarboxylic acid cycle acids and other related organic acids in insect haemolymph by high-performance liquid chromatography. J Chromatogr. A 1985, 318, 112–116. [Google Scholar] [CrossRef]
- van Hees, P.A.W.; Dahlén, J.; Lundström, U.S.; Borén, H.; Allard, B. Determination of low molecular weight organic acids in soil solution by hplc. Talanta 1999, 48, 173–179. [Google Scholar] [CrossRef]
- Kumar, M.; Saini, S.; Gayen, K. Acetone-butanol-ethanol fermentation analysis using only high performance liquid chromatography. Anal. Methods 2014, 6, 774–781. [Google Scholar] [CrossRef]
- Sluiter, A.; Hames, B.; Ruiz, R.; Scarlata, C.; Sluiter, J.; Templeton, D. Determination of Sugars, Byproducts, and Degradation Products in Liquid Fraction Process Samples: Laboratory Analytical Procedure (LAP); National Renewable Energy Laboratory: Golden, CO, USA, 2008. [Google Scholar]
- Castellari, M.; Versari, A.; Spinabelli, U.; Galassi, S.; Amati, A. An improved hplc method for the analysis of organic acids, carbohydrates, and alcohols in grape musts and wines. J. Liq. Chromatogr. Relat. Technol. 2000, 23, 2047–2056. [Google Scholar] [CrossRef]
- López, E.F.; Gómez, E.F. Simultaneous determination of the major organic acids, sugars, glycerol, and ethanol by hplc in grape musts and white wines. J. Chromatogr. Sci. 1996, 34, 254–257. [Google Scholar] [CrossRef]
- Chinnici, F.; Spinabelli, U.; Riponi, C.; Amati, A. Optimization of the determination of organic acids and sugars in fruit juices by ion-exclusion liquid chromatography. J. Food Compos. Anal. 2005, 18, 121–130. [Google Scholar] [CrossRef]
- Vertes, A.A. Biomass to Biofuels: Strategies for Global Industries; Wiley: Chichester, UK, 2010; Volume 1. [Google Scholar]
- Wang, P.-M.; Zheng, D.-Q.; Chi, X.-Q.; Li, O.; Qian, C.-D.; Liu, T.-Z.; Zhang, X.-Y.; Du, F.-G.; Sun, P.-Y.; Qu, A.-M.; et al. Relationship of trehalose accumulation with ethanol fermentation in industrial saccharomyces cerevisiae yeast strains. Bioresour. Technol. 2014, 152, 371–376. [Google Scholar] [CrossRef] [PubMed]
- Nikel, P.I.; Martinez-Garcia, E.; de Lorenzo, V. Biotechnological domestication of pseudomonads using synthetic biology. Nat. Rev. Microbiol. 2014, 12, 368–379. [Google Scholar] [CrossRef] [PubMed]
- Dietmair, S.; Timmins, N.E.; Gray, P.P.; Nielsen, L.K.; Krömer, J.O. Towards quantitative metabolomics of mammalian cells: Development of a metabolite extraction protocol. Anal. Biochem. 2010, 404, 155–164. [Google Scholar] [CrossRef] [PubMed]
- Lai, B.; Yu, S.; Bernhardt, P.V.; Rabaey, K.; Virdis, B.; Krömer, J.O. Anoxic metabolism and biochemical production in pseudomonas putida f1 driven by a bioelectrochemical system. Biotechnol. Biofuels 2016, 9, 39. [Google Scholar] [CrossRef] [PubMed]

© 2016 by the authors; licensee MDPI, Basel, Switzerland. This article is an open access article distributed under the terms and conditions of the Creative Commons by Attribution (CC-BY) license (http://creativecommons.org/licenses/by/4.0/).