Proton Exchange Membrane Electrolyzer Modeling for Power Electronics Control: A Short Review

 ,
,  , ,
, , 

Abstract
1. Introduction
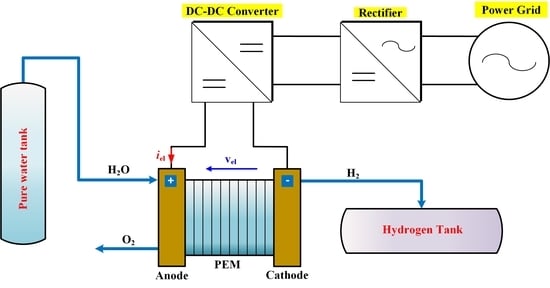
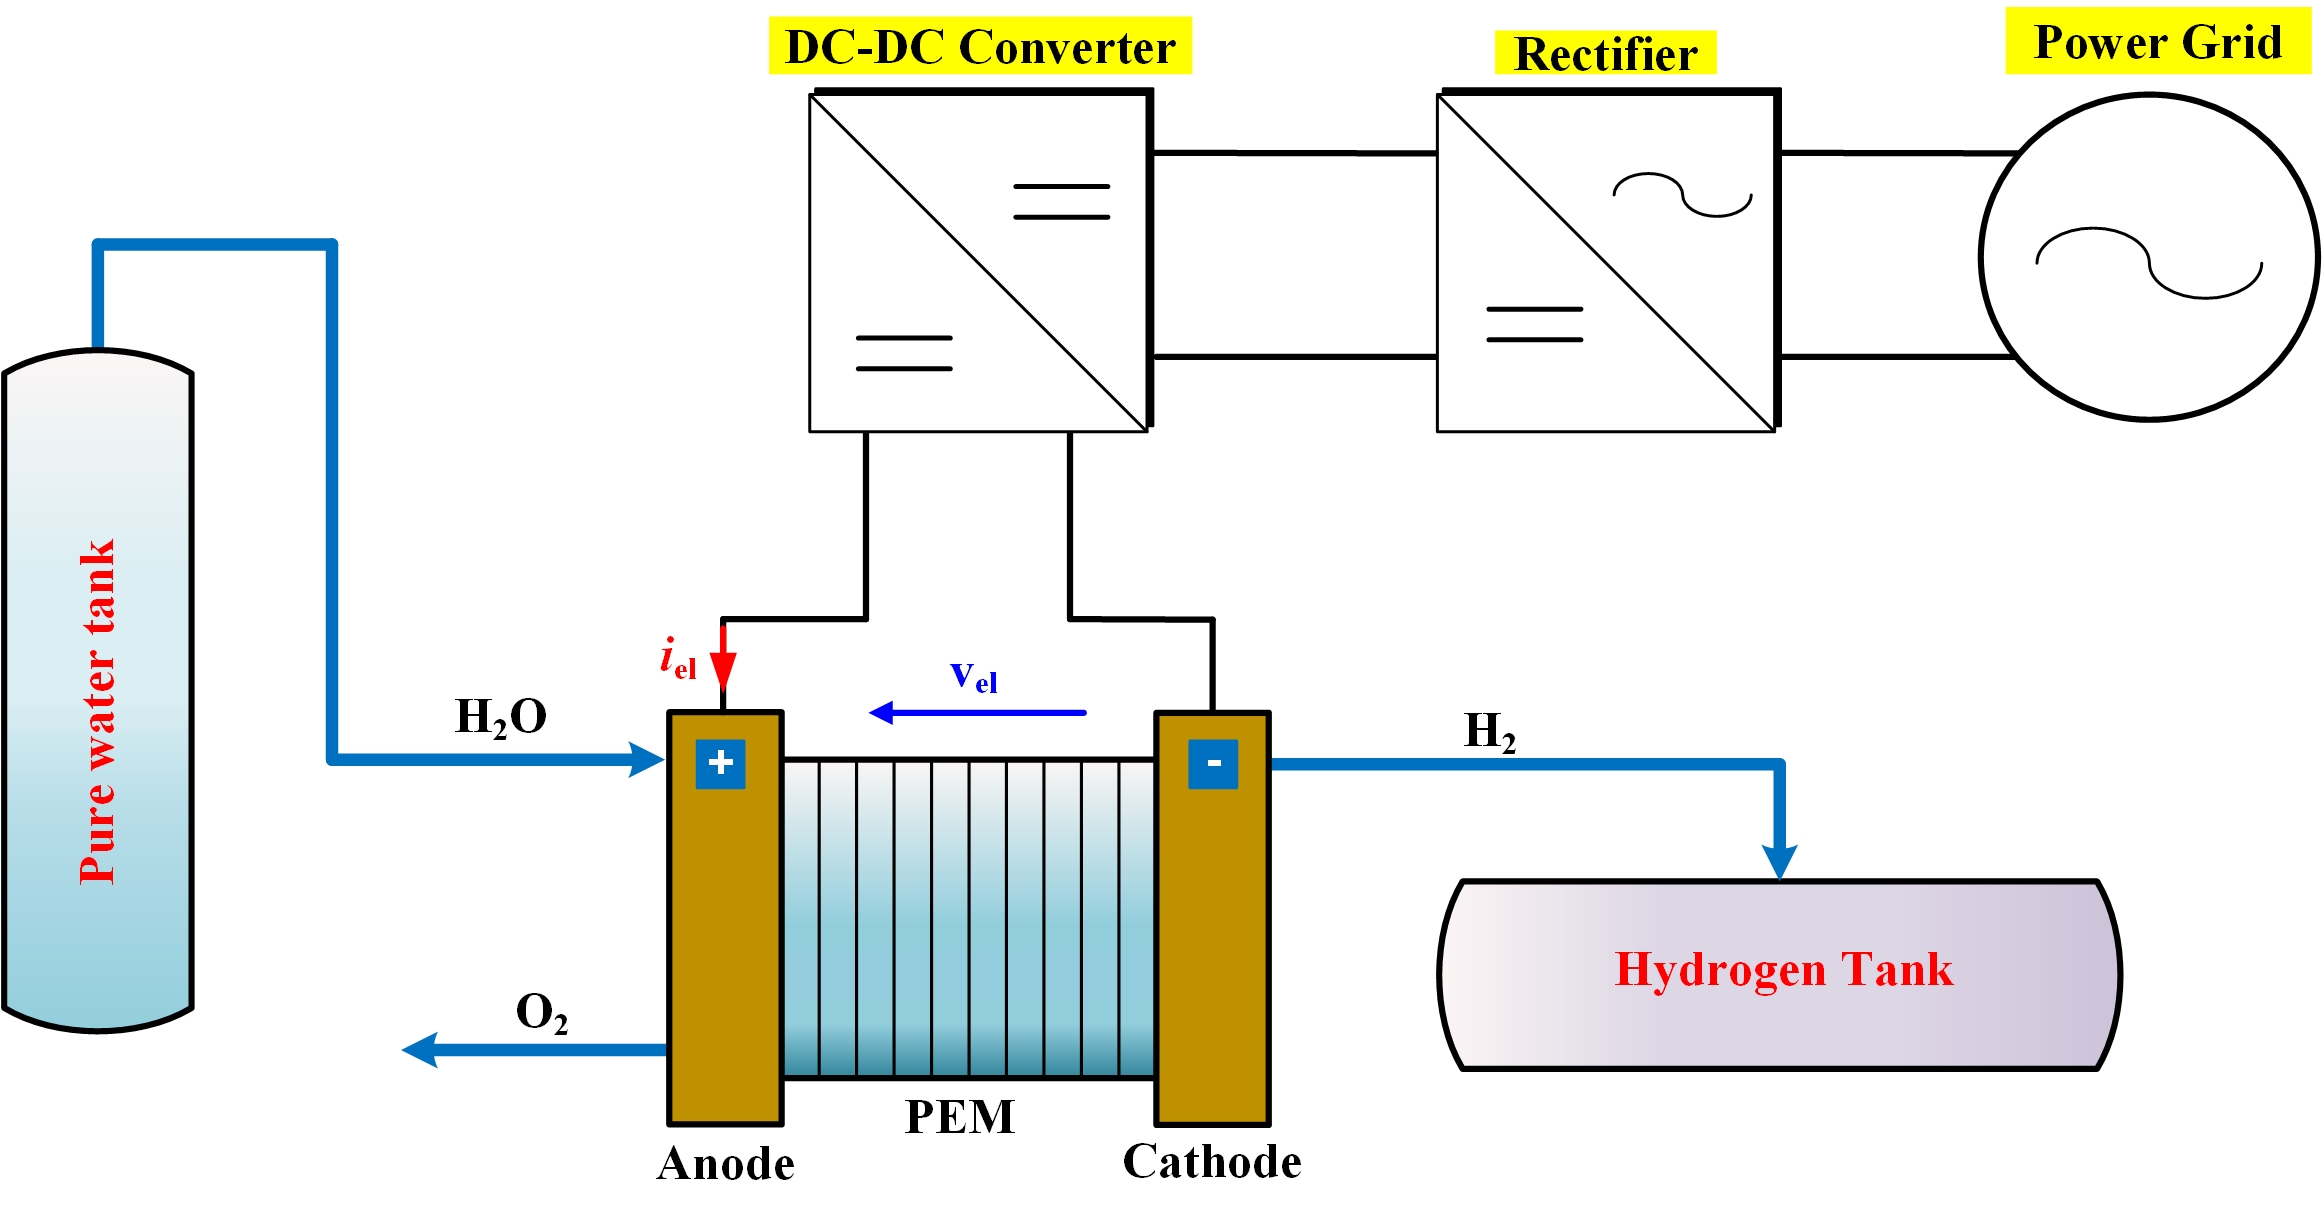
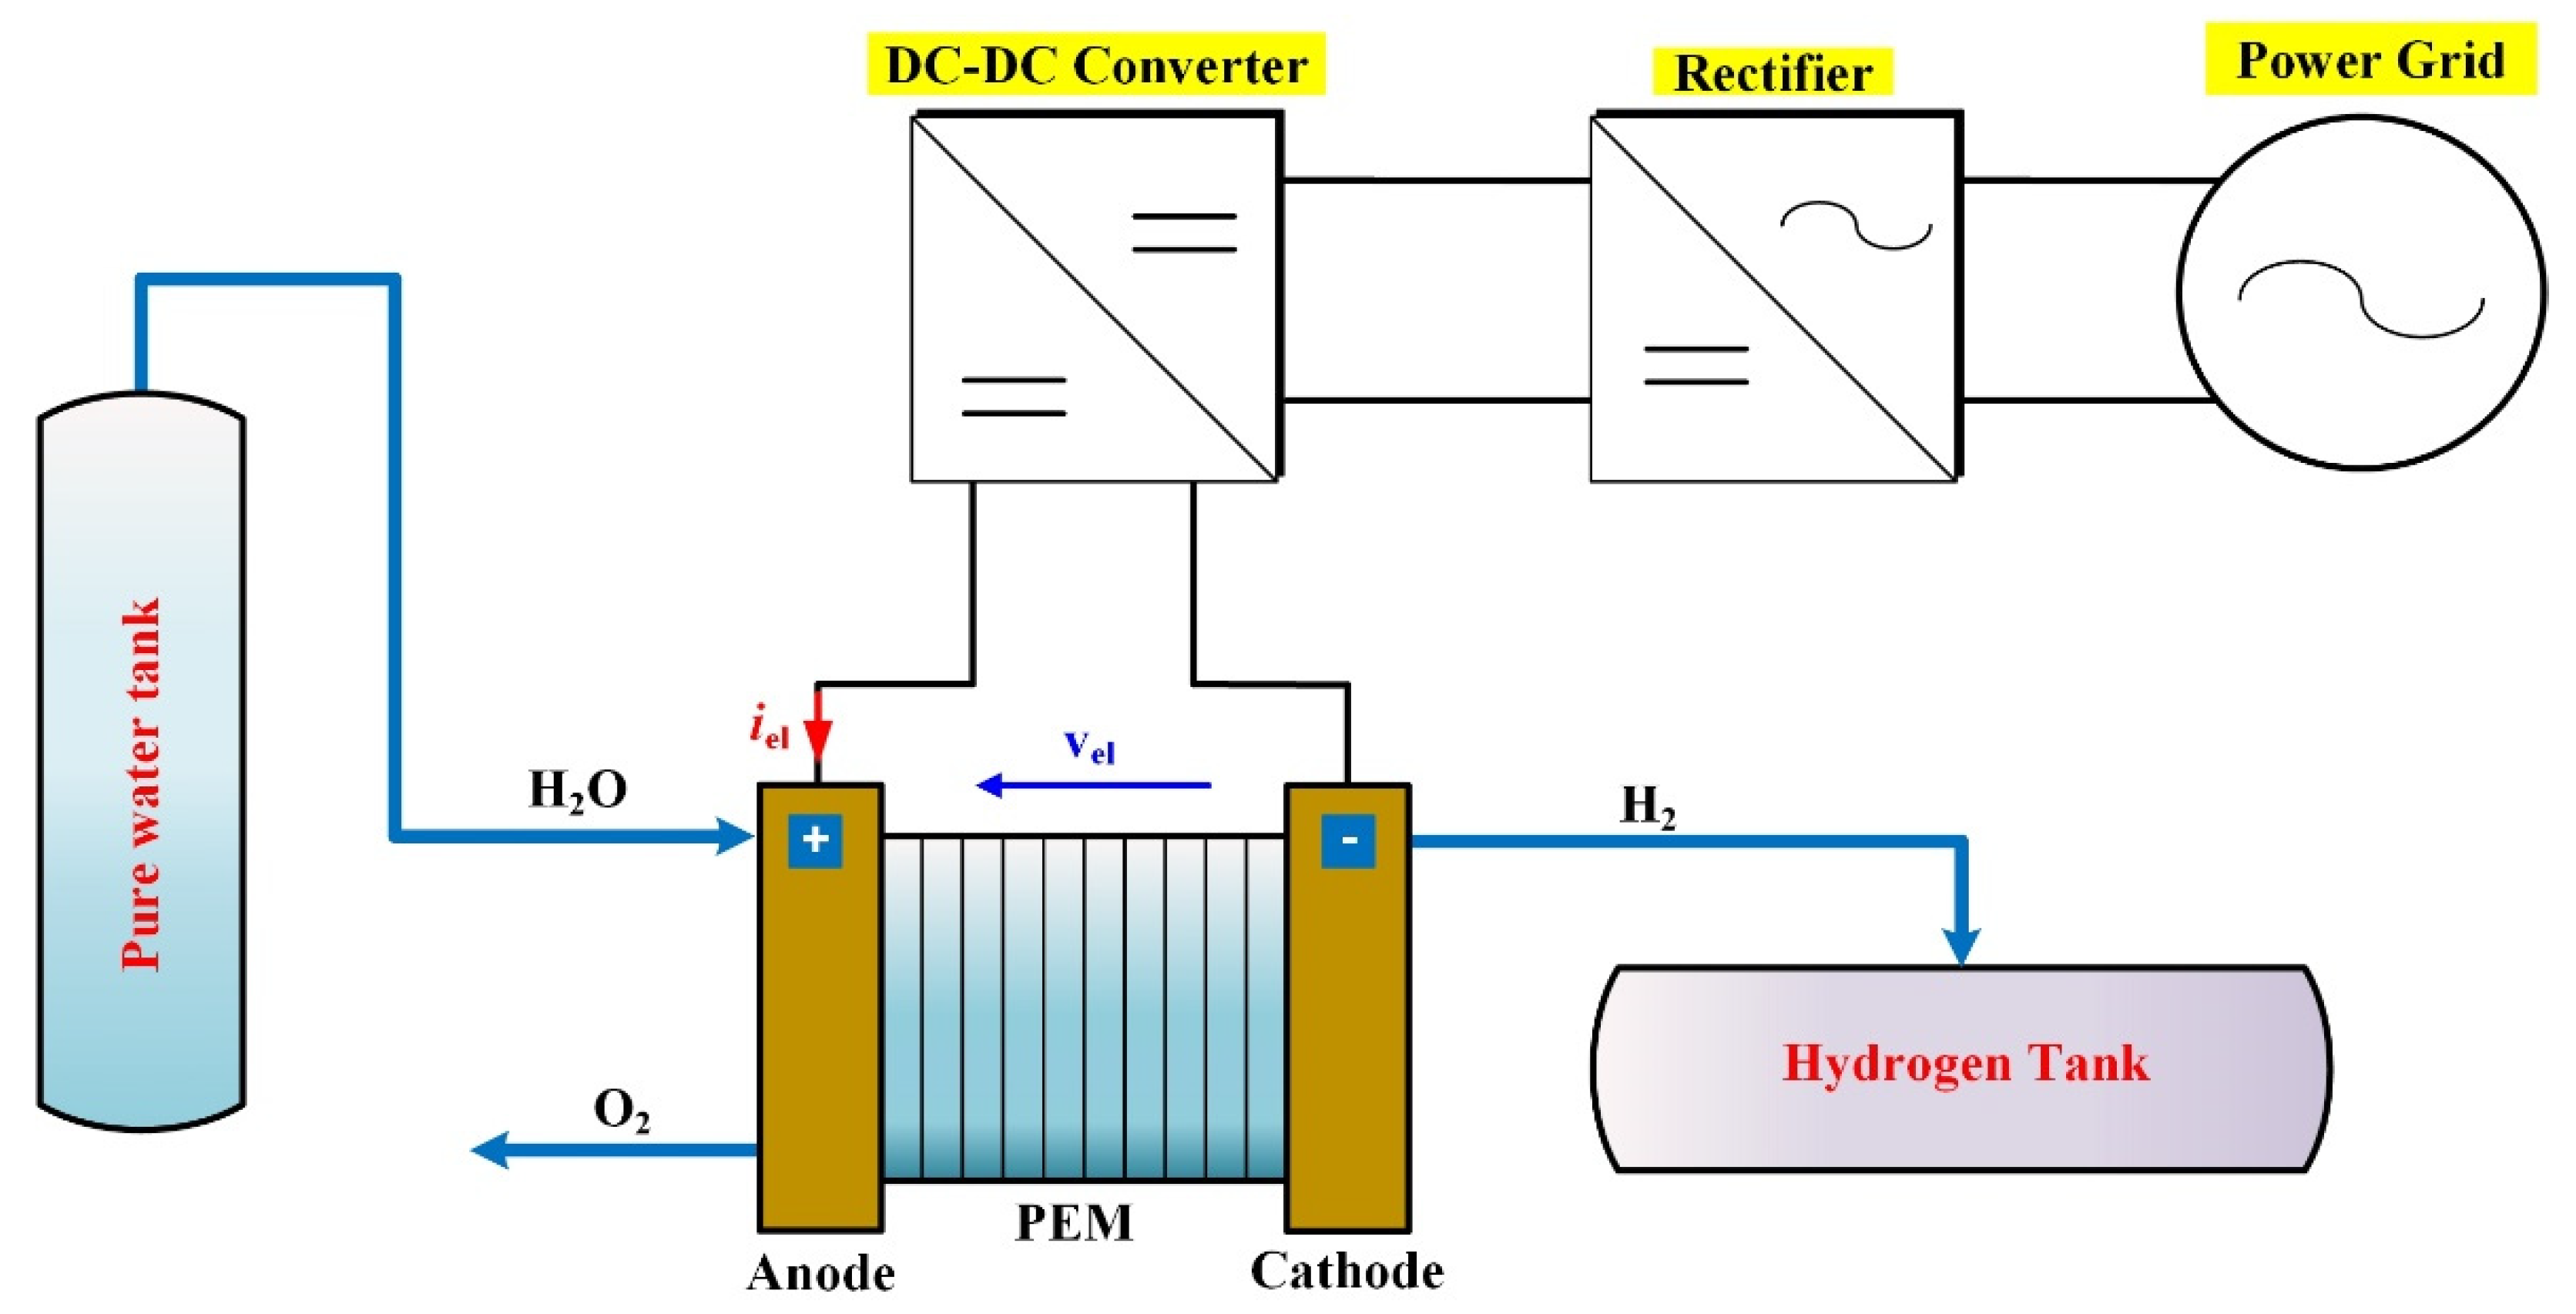
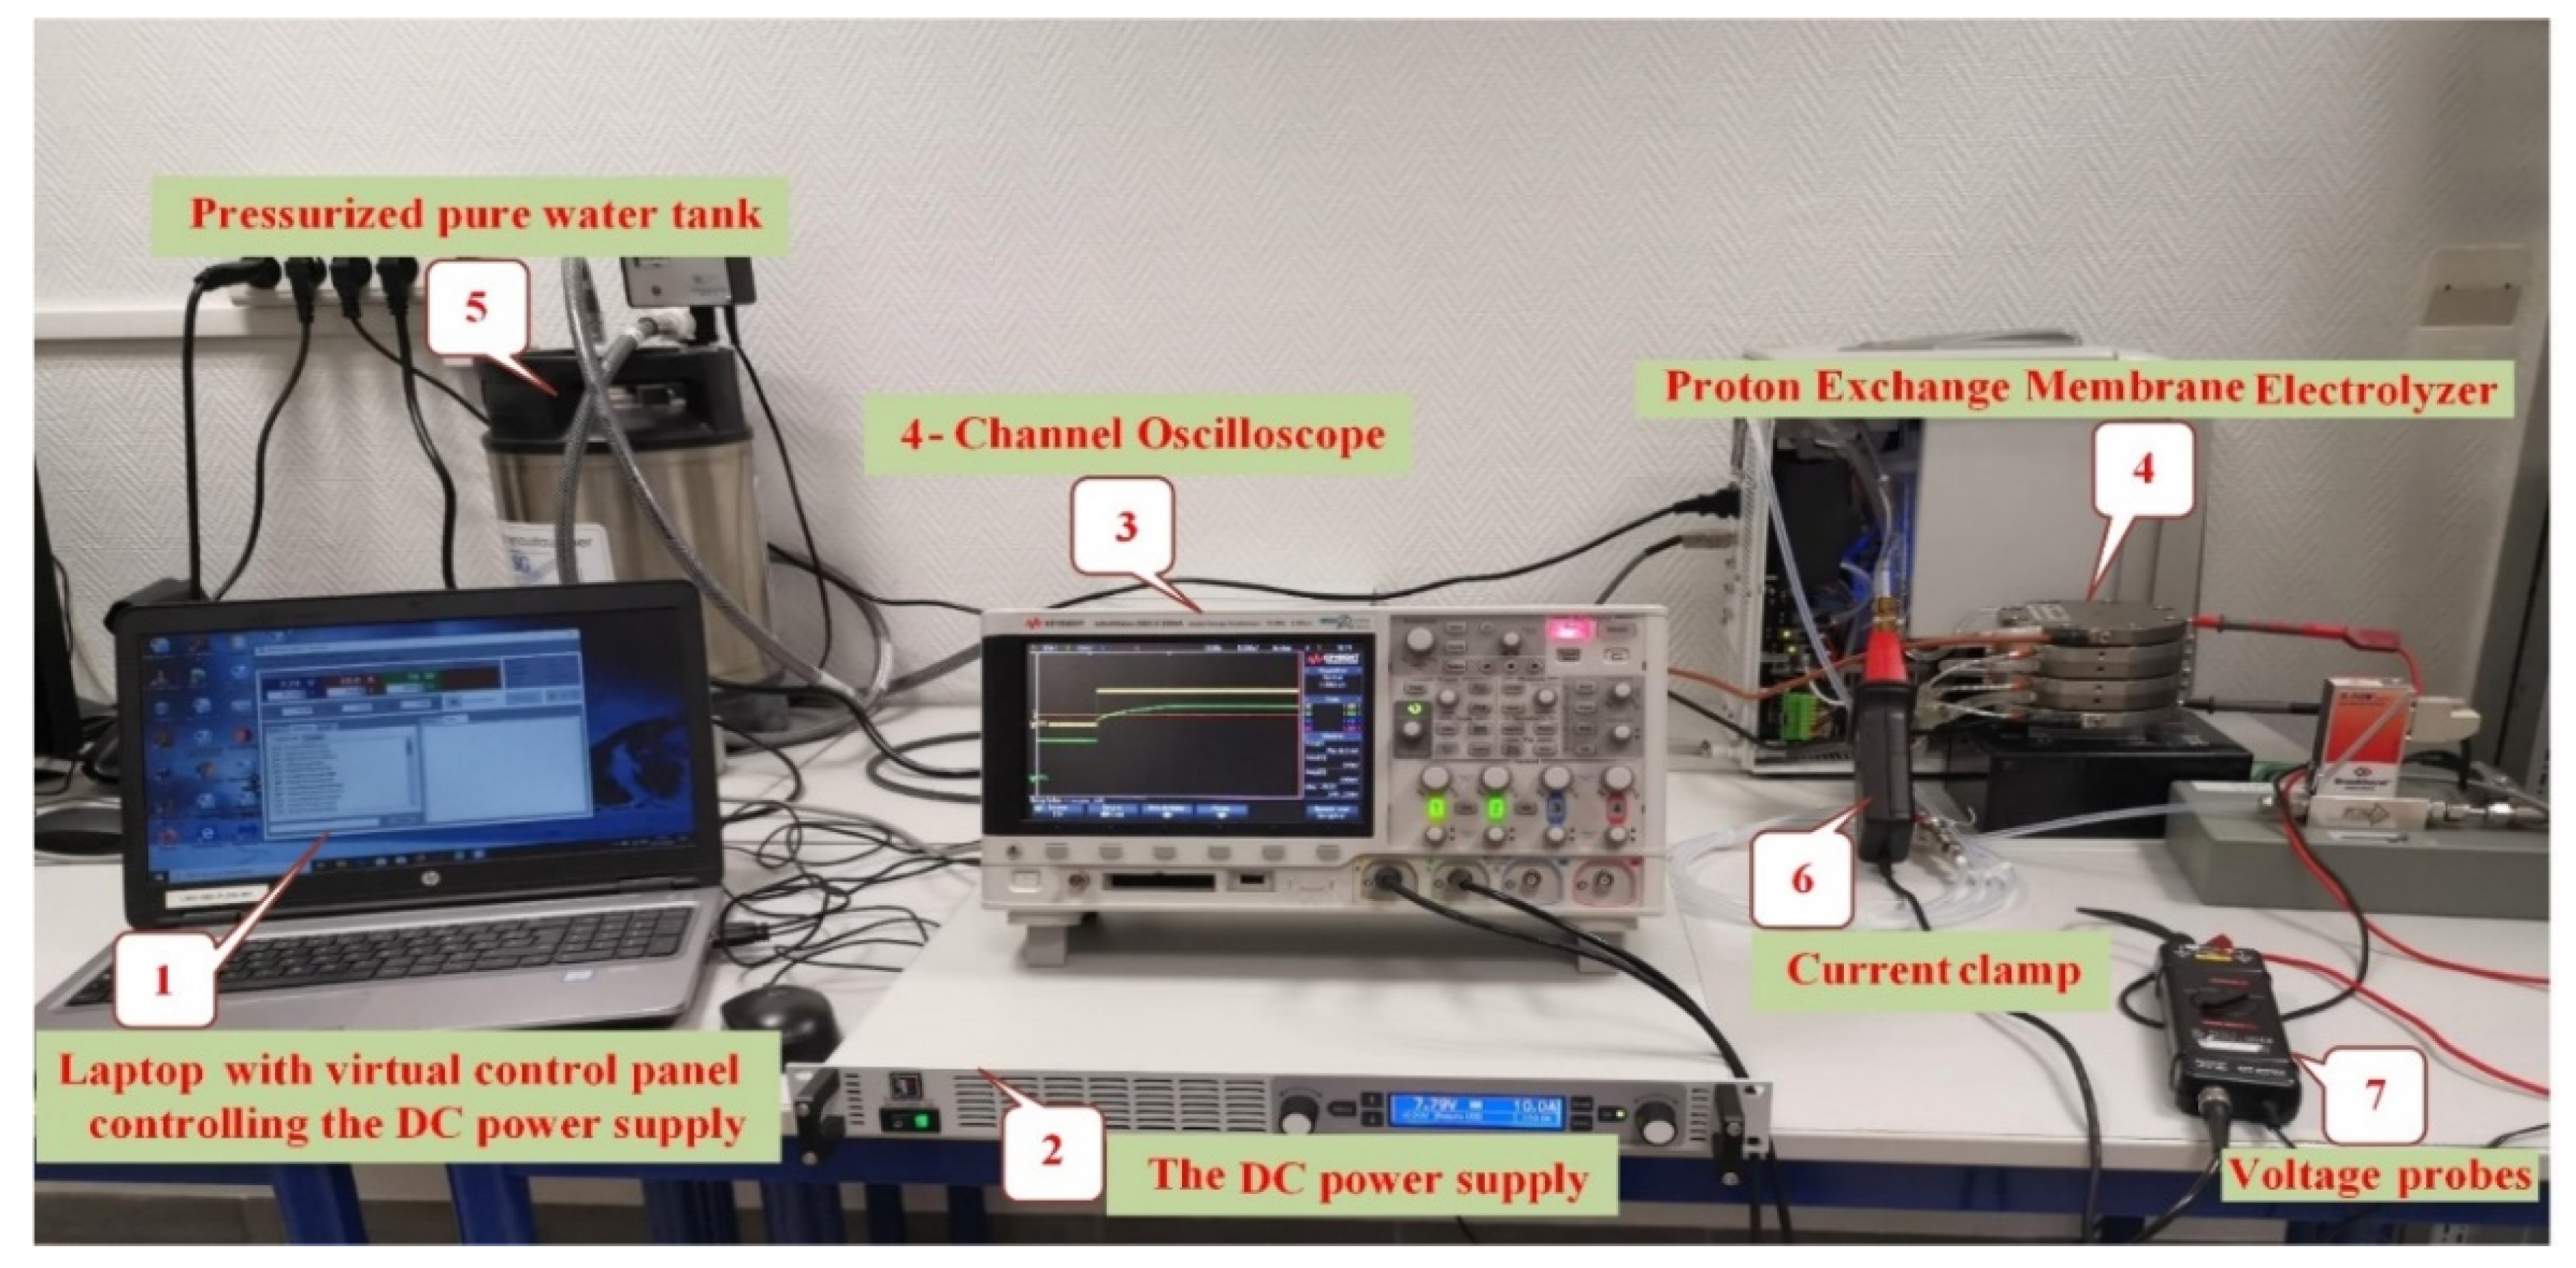
2. Proton Exchange Membrane Electrolyzer System
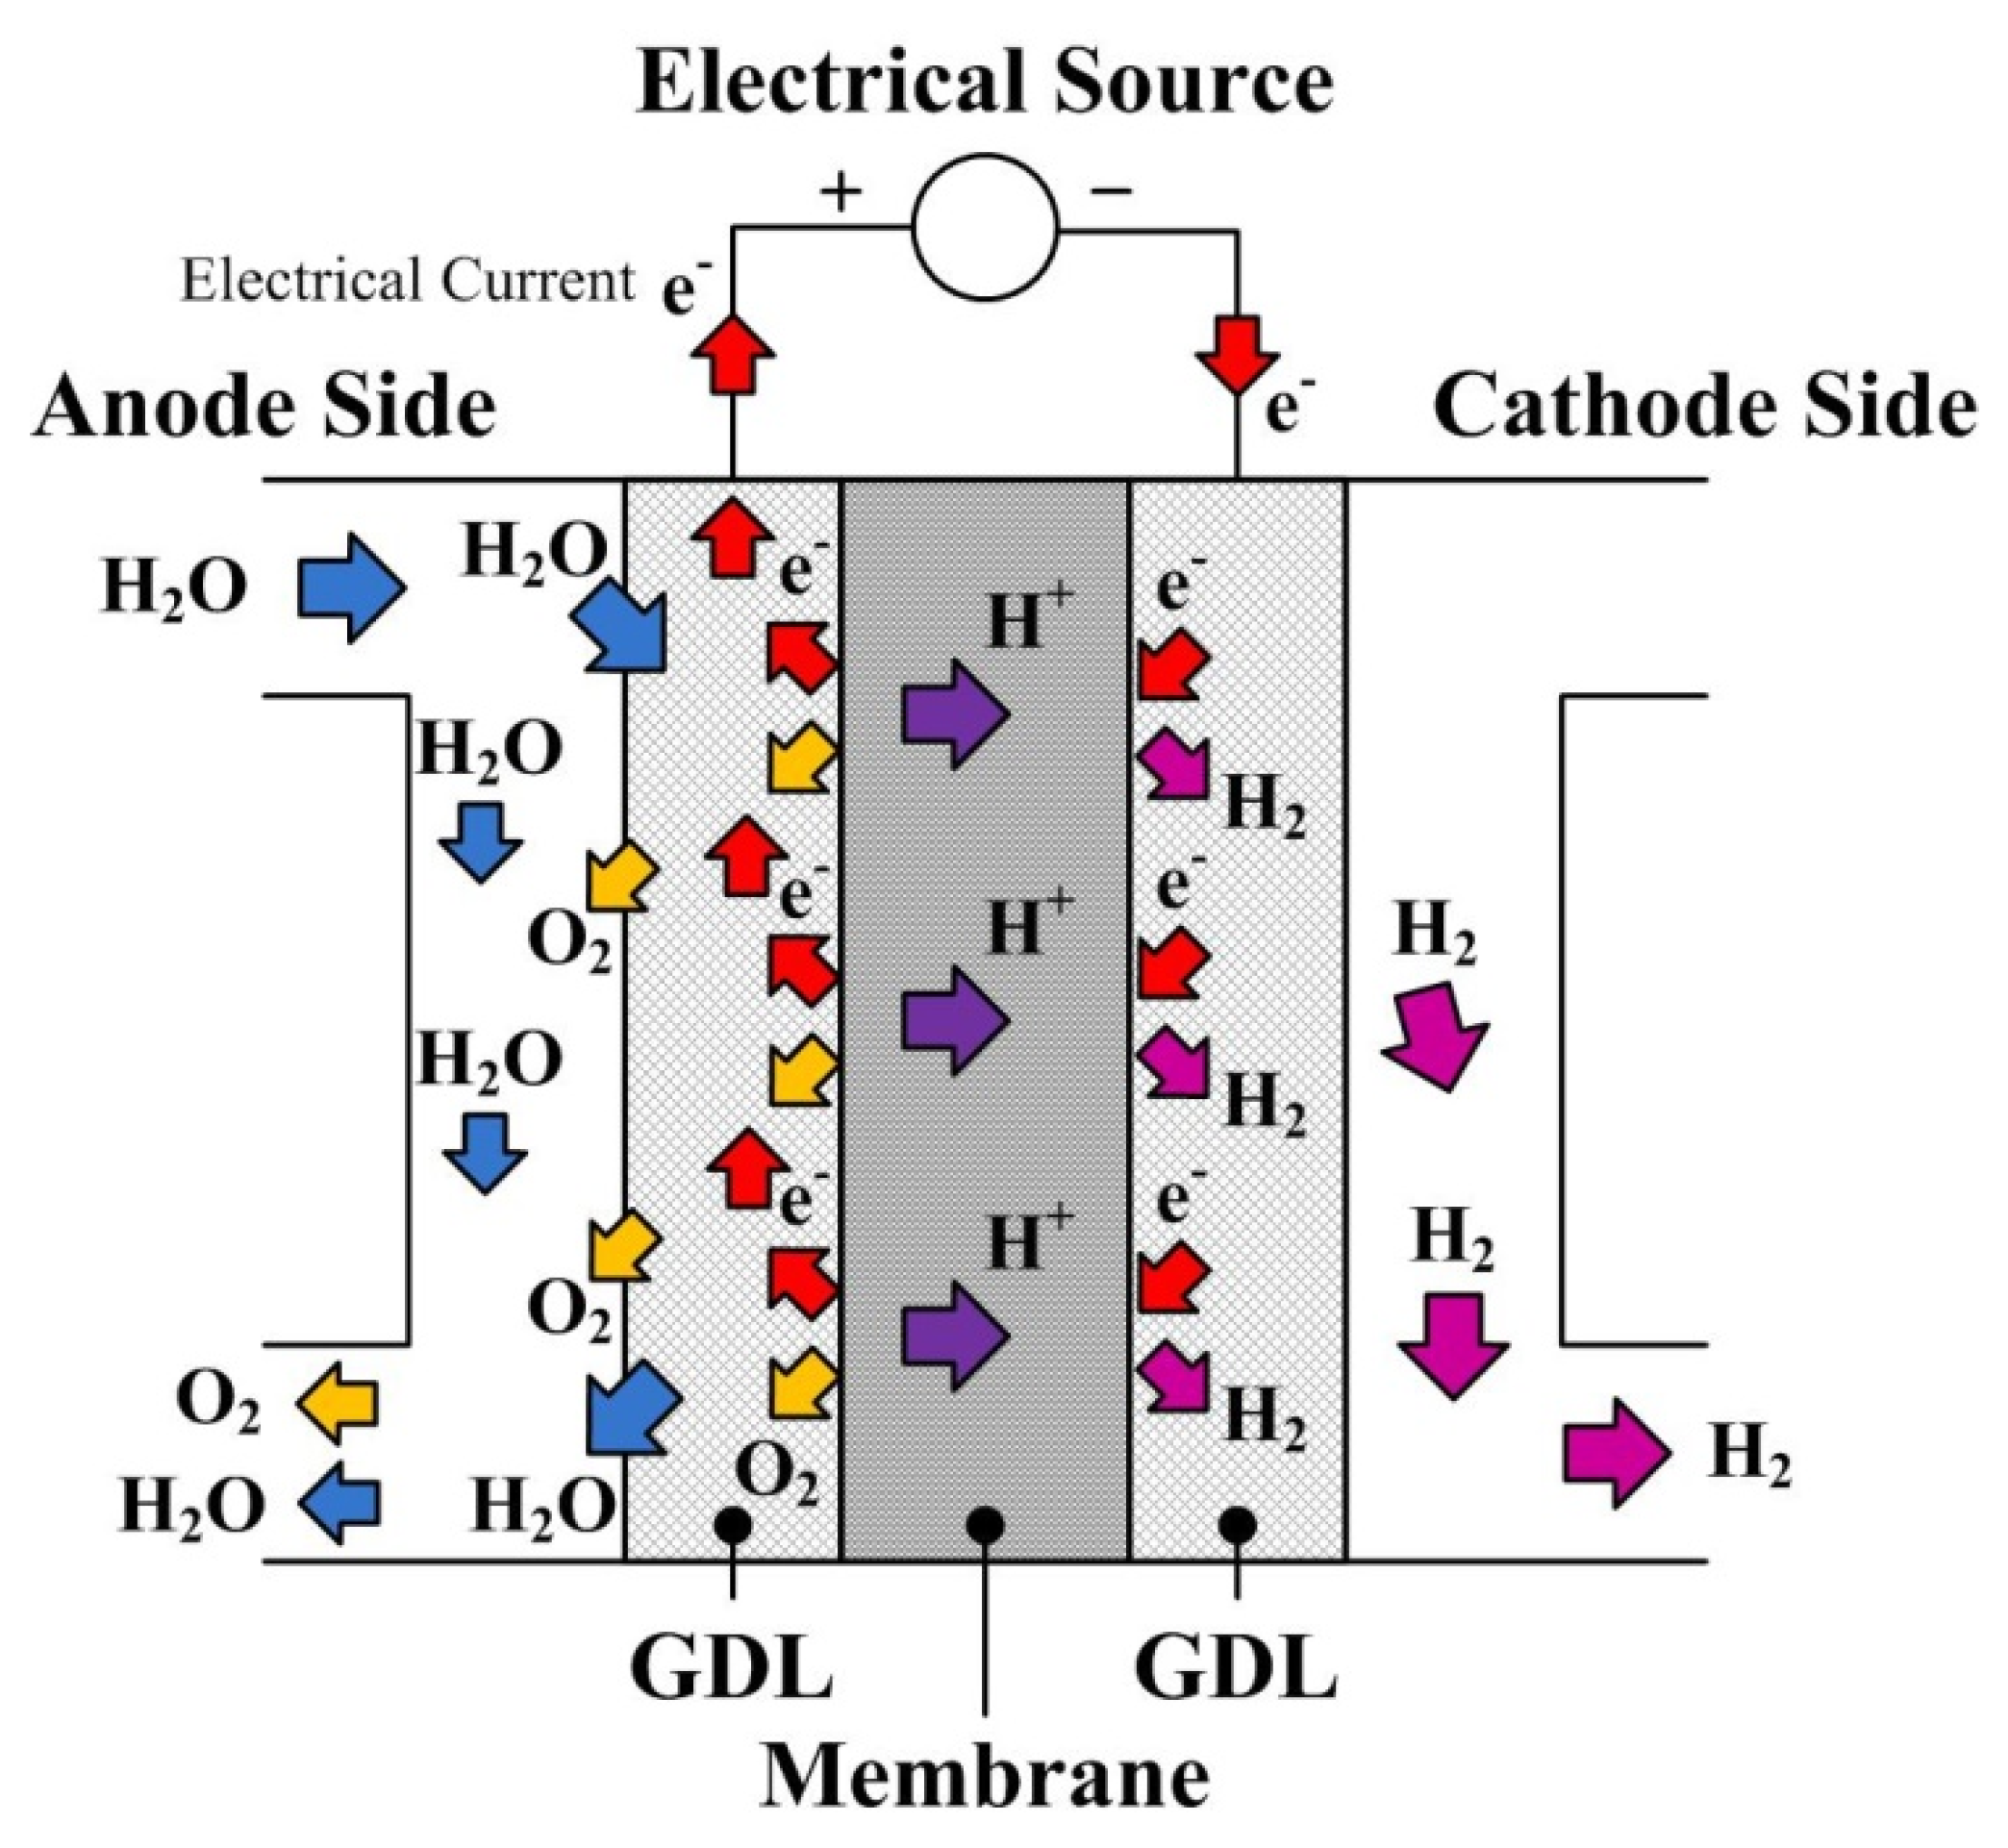
2.1. Proton Exchange Membrane Stack
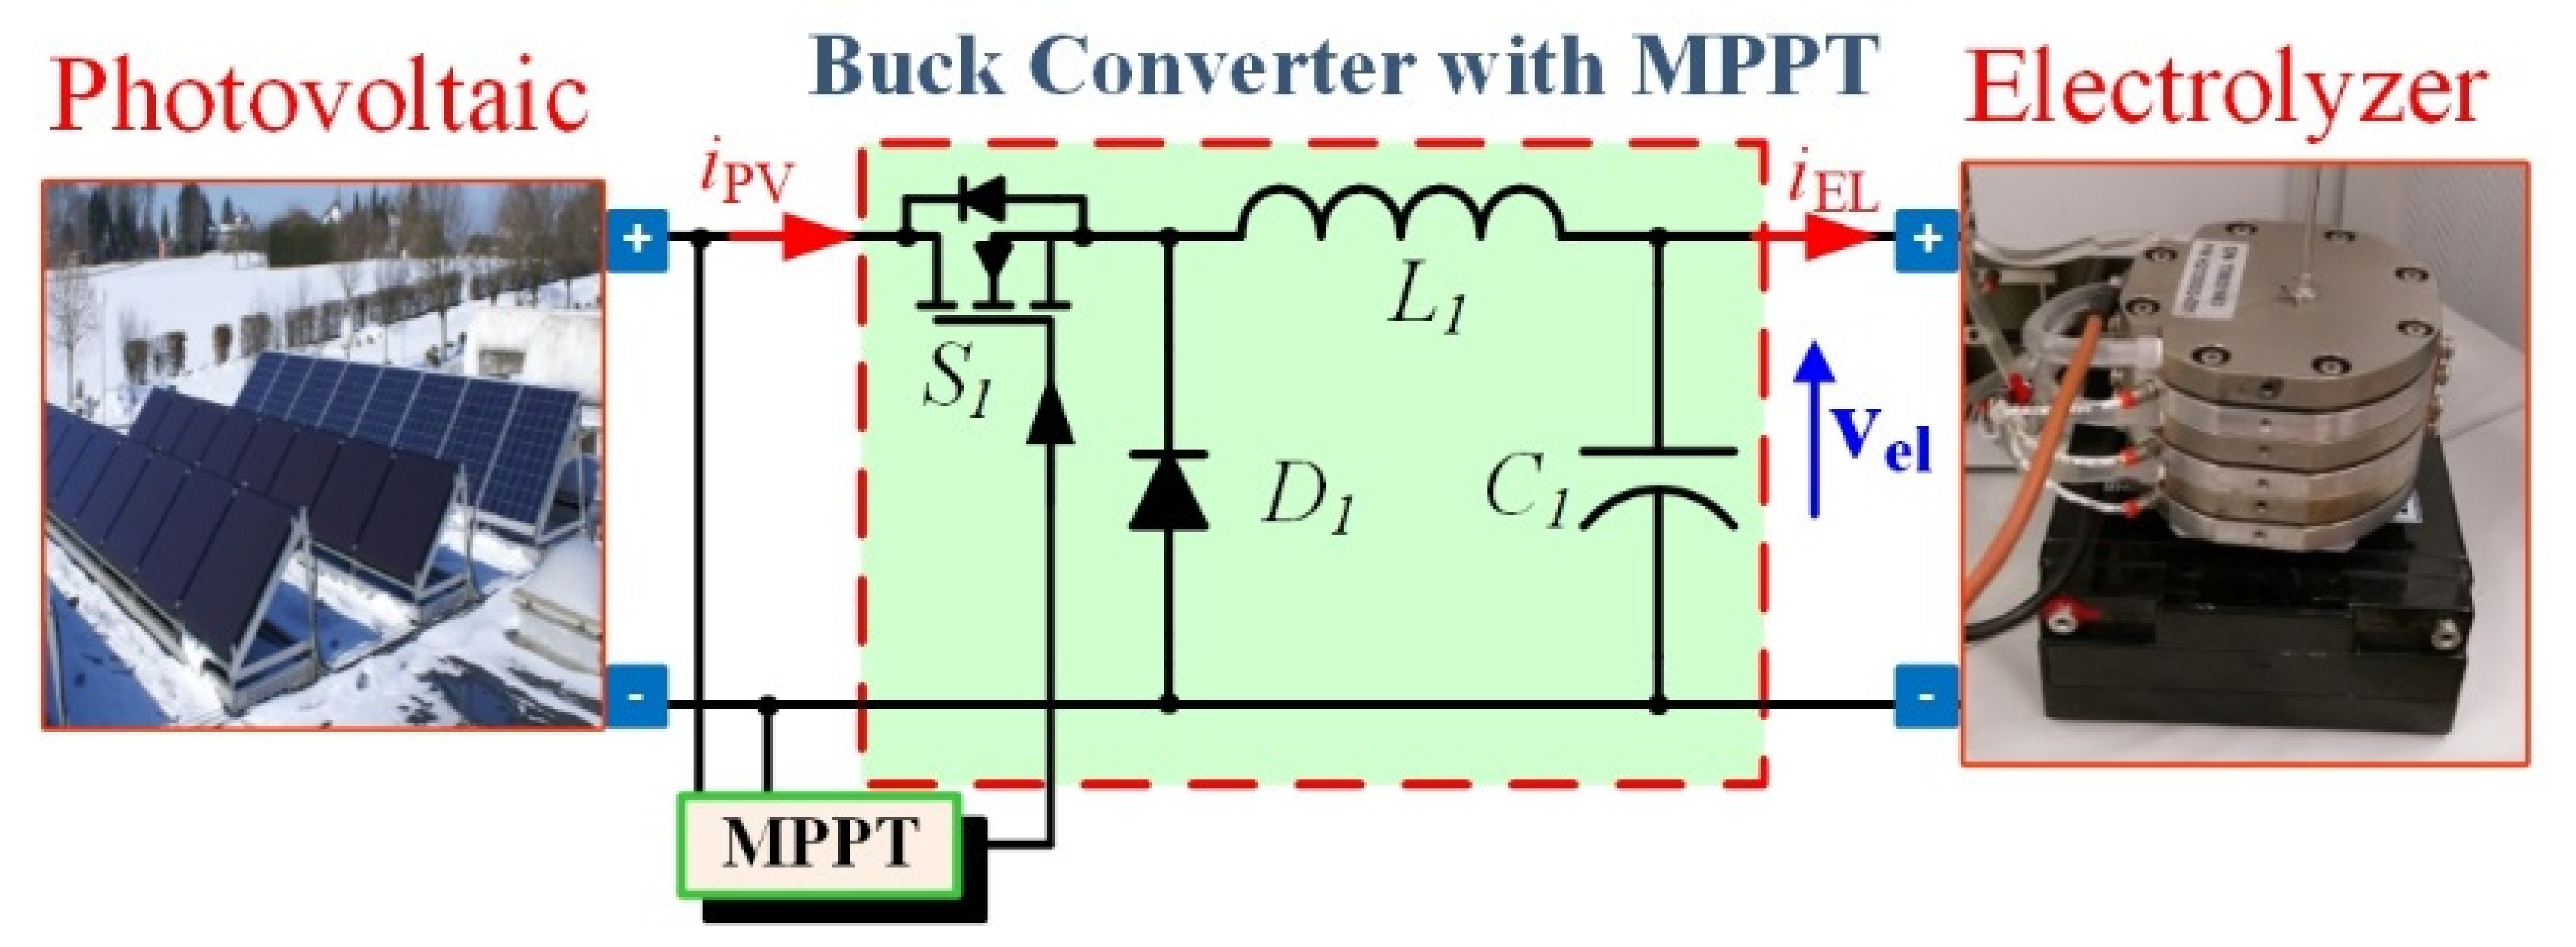
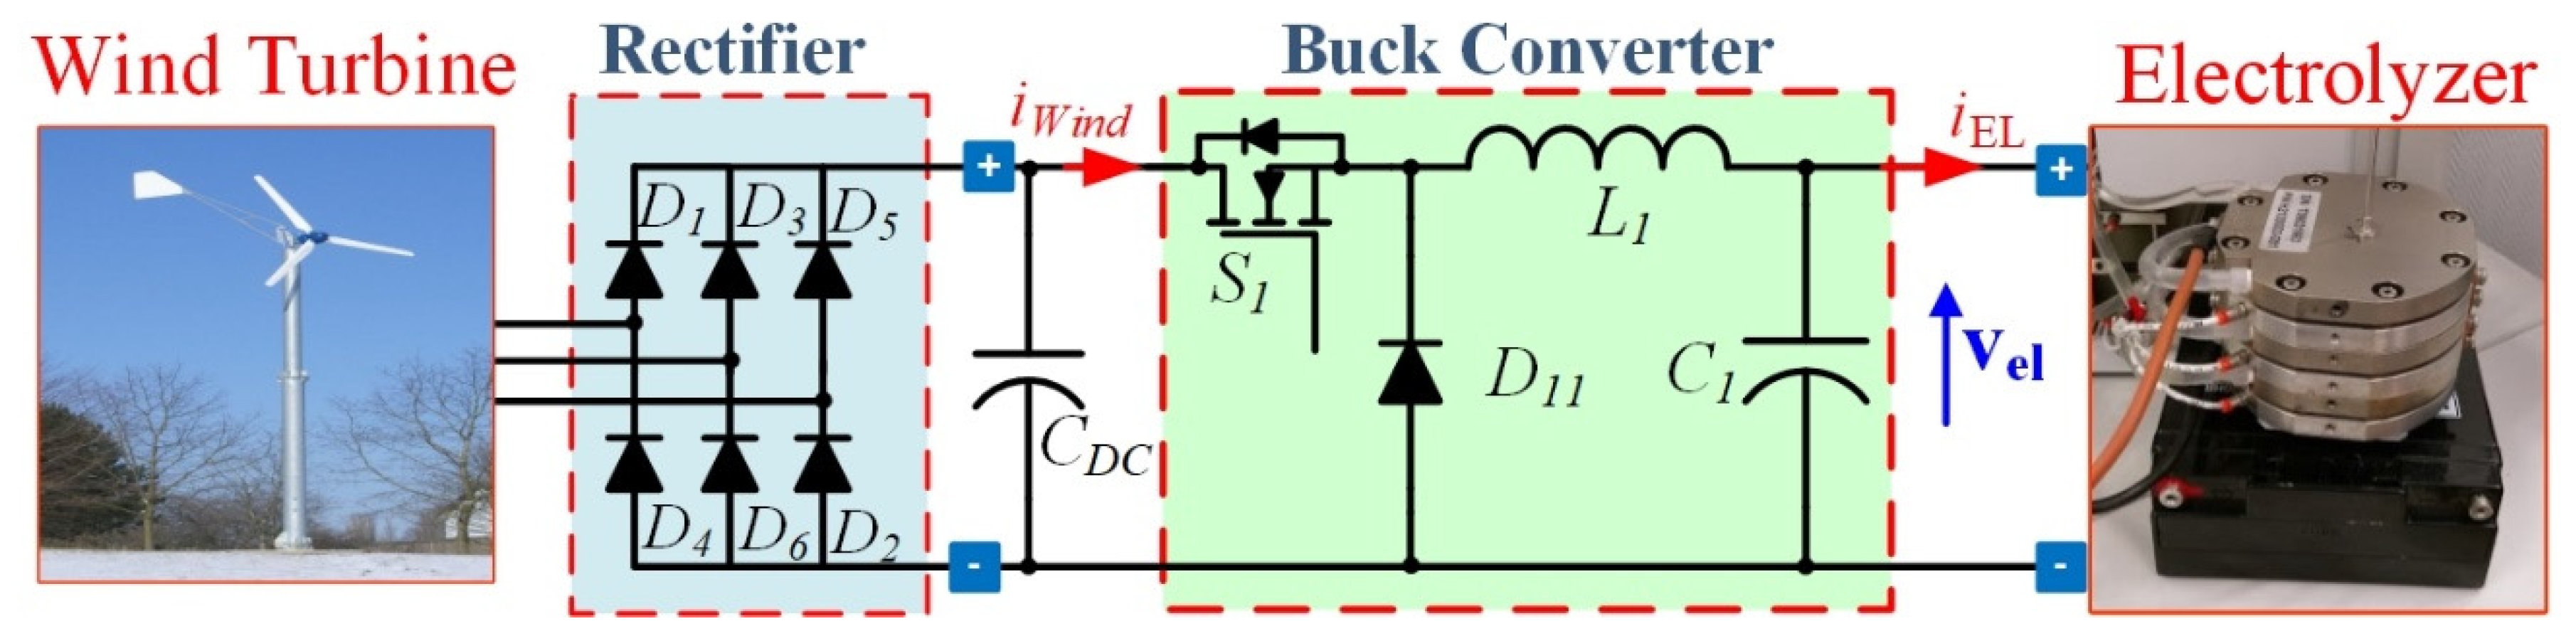
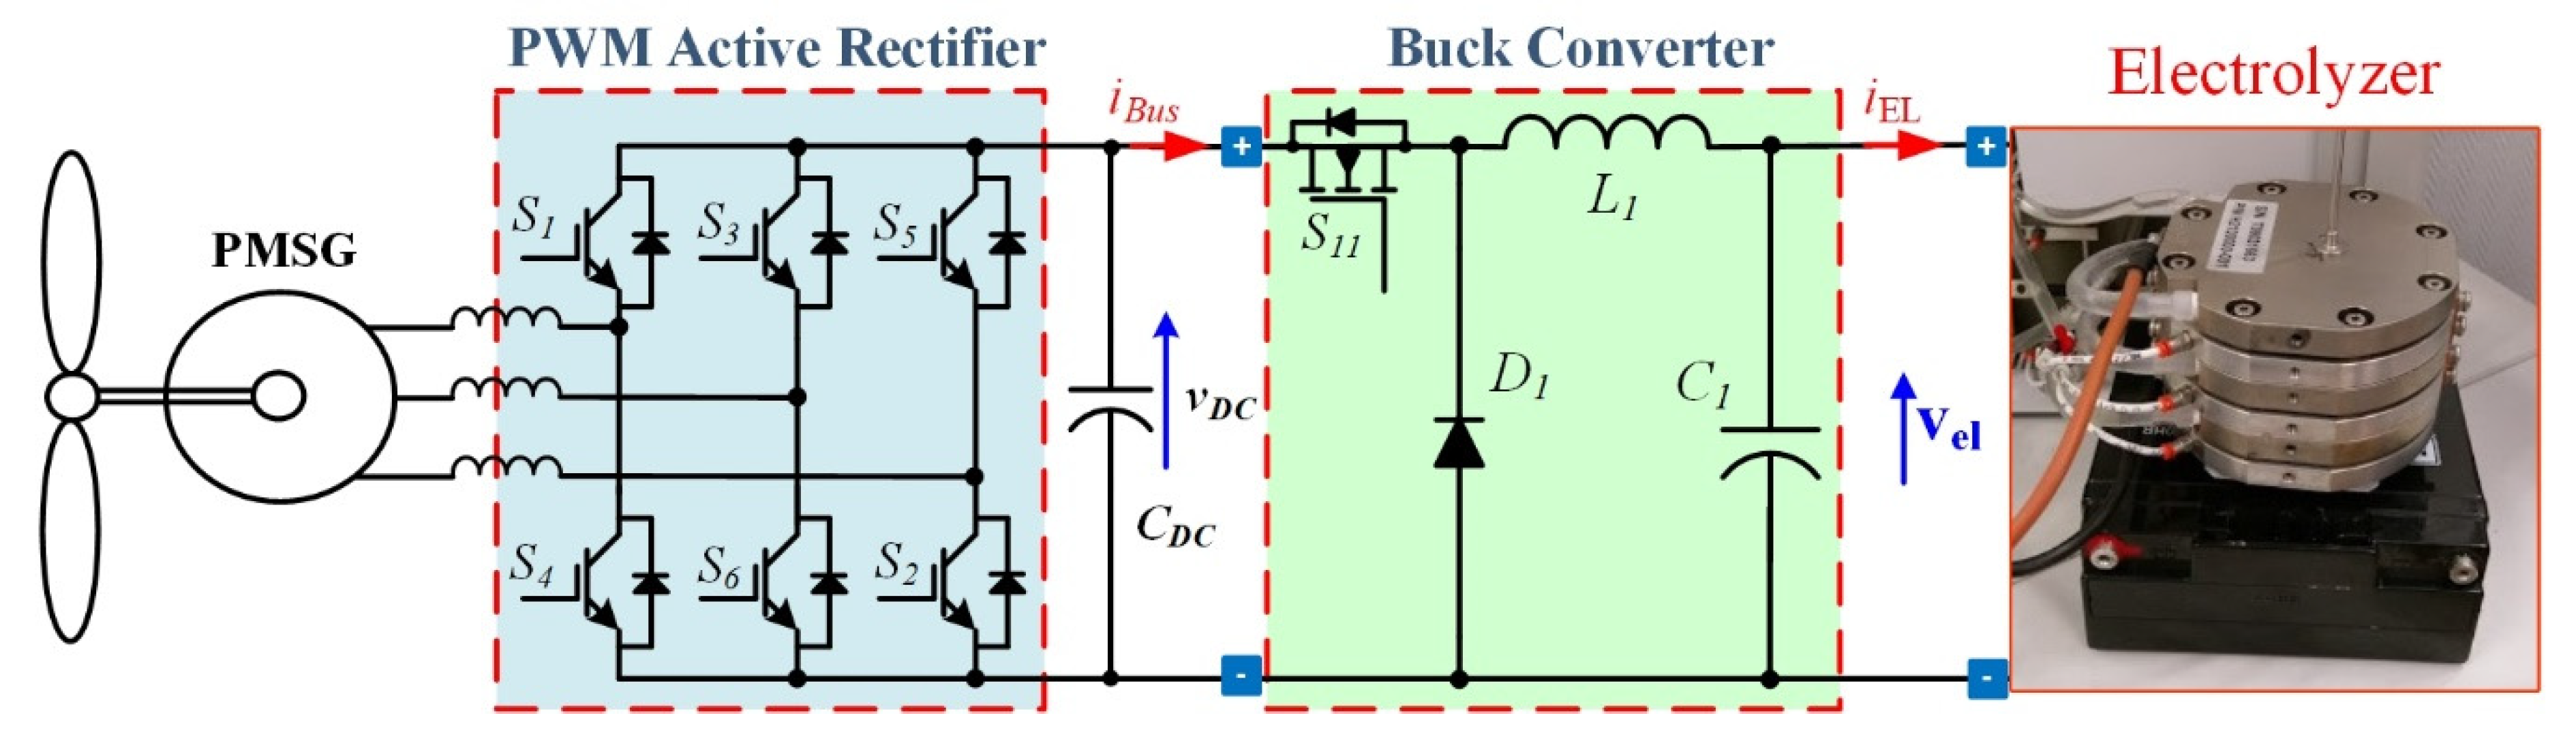
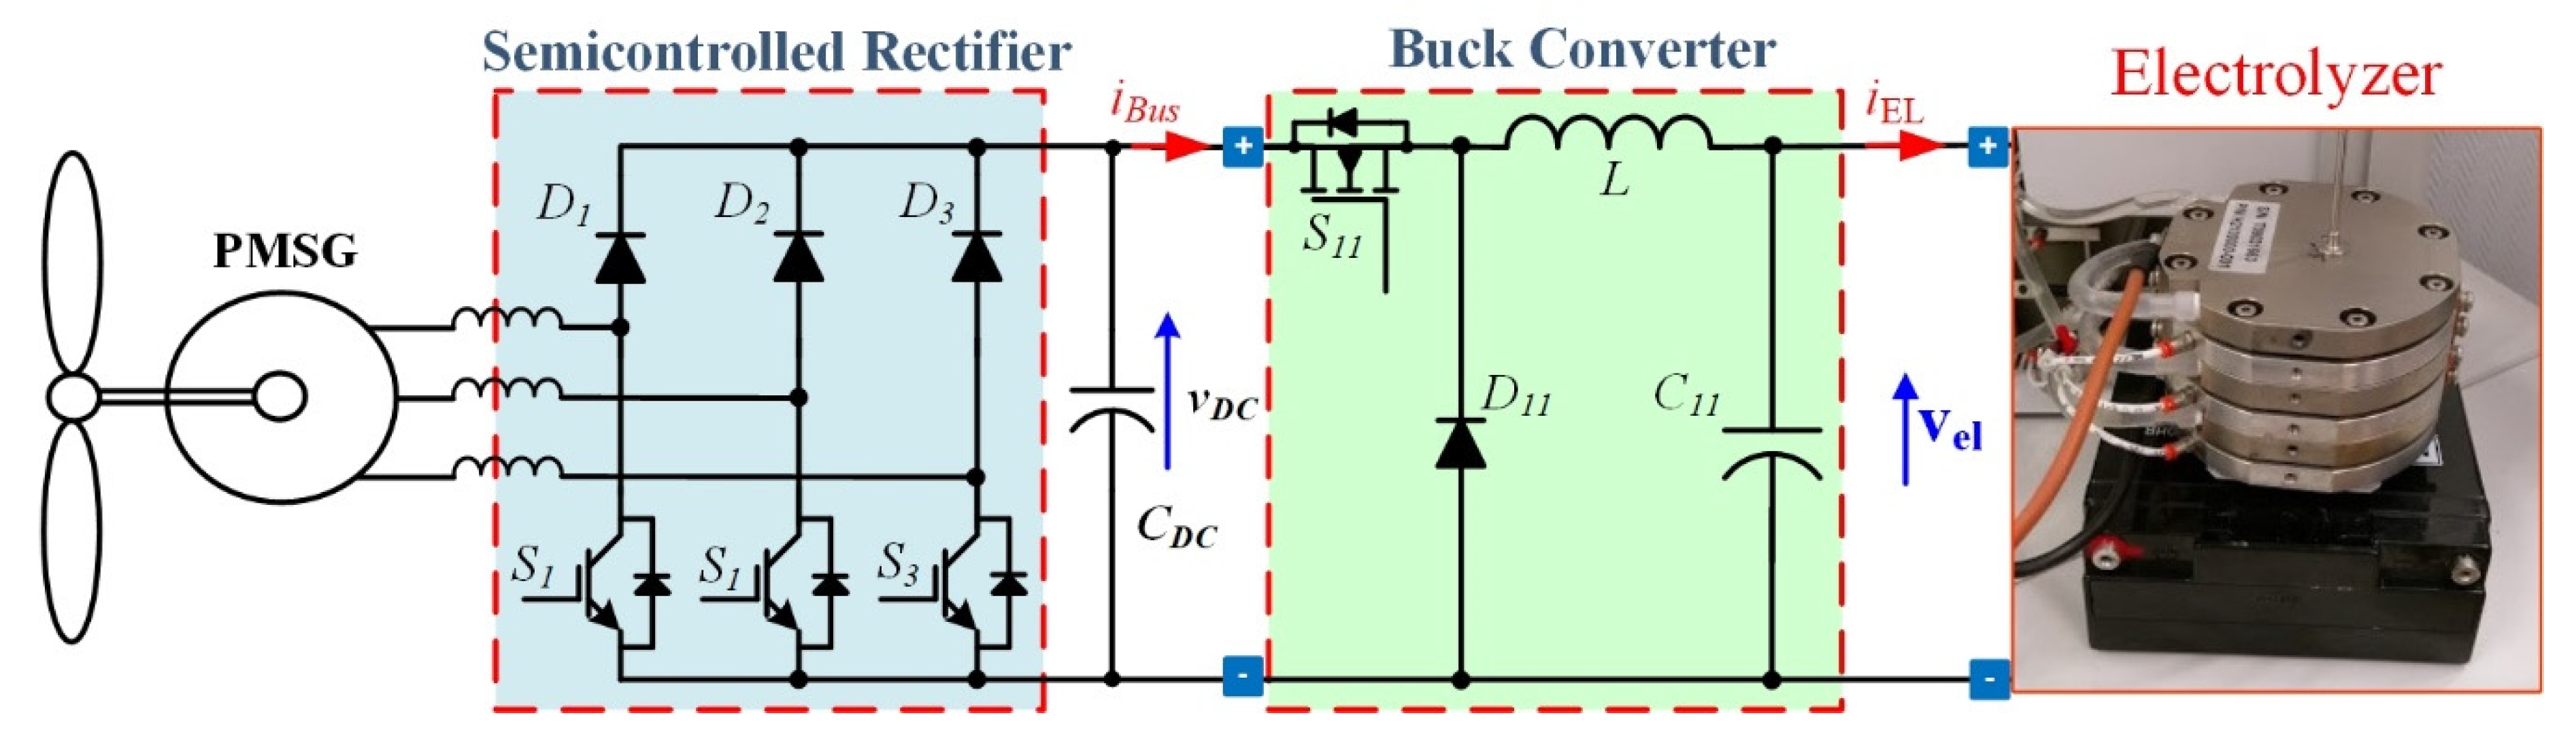
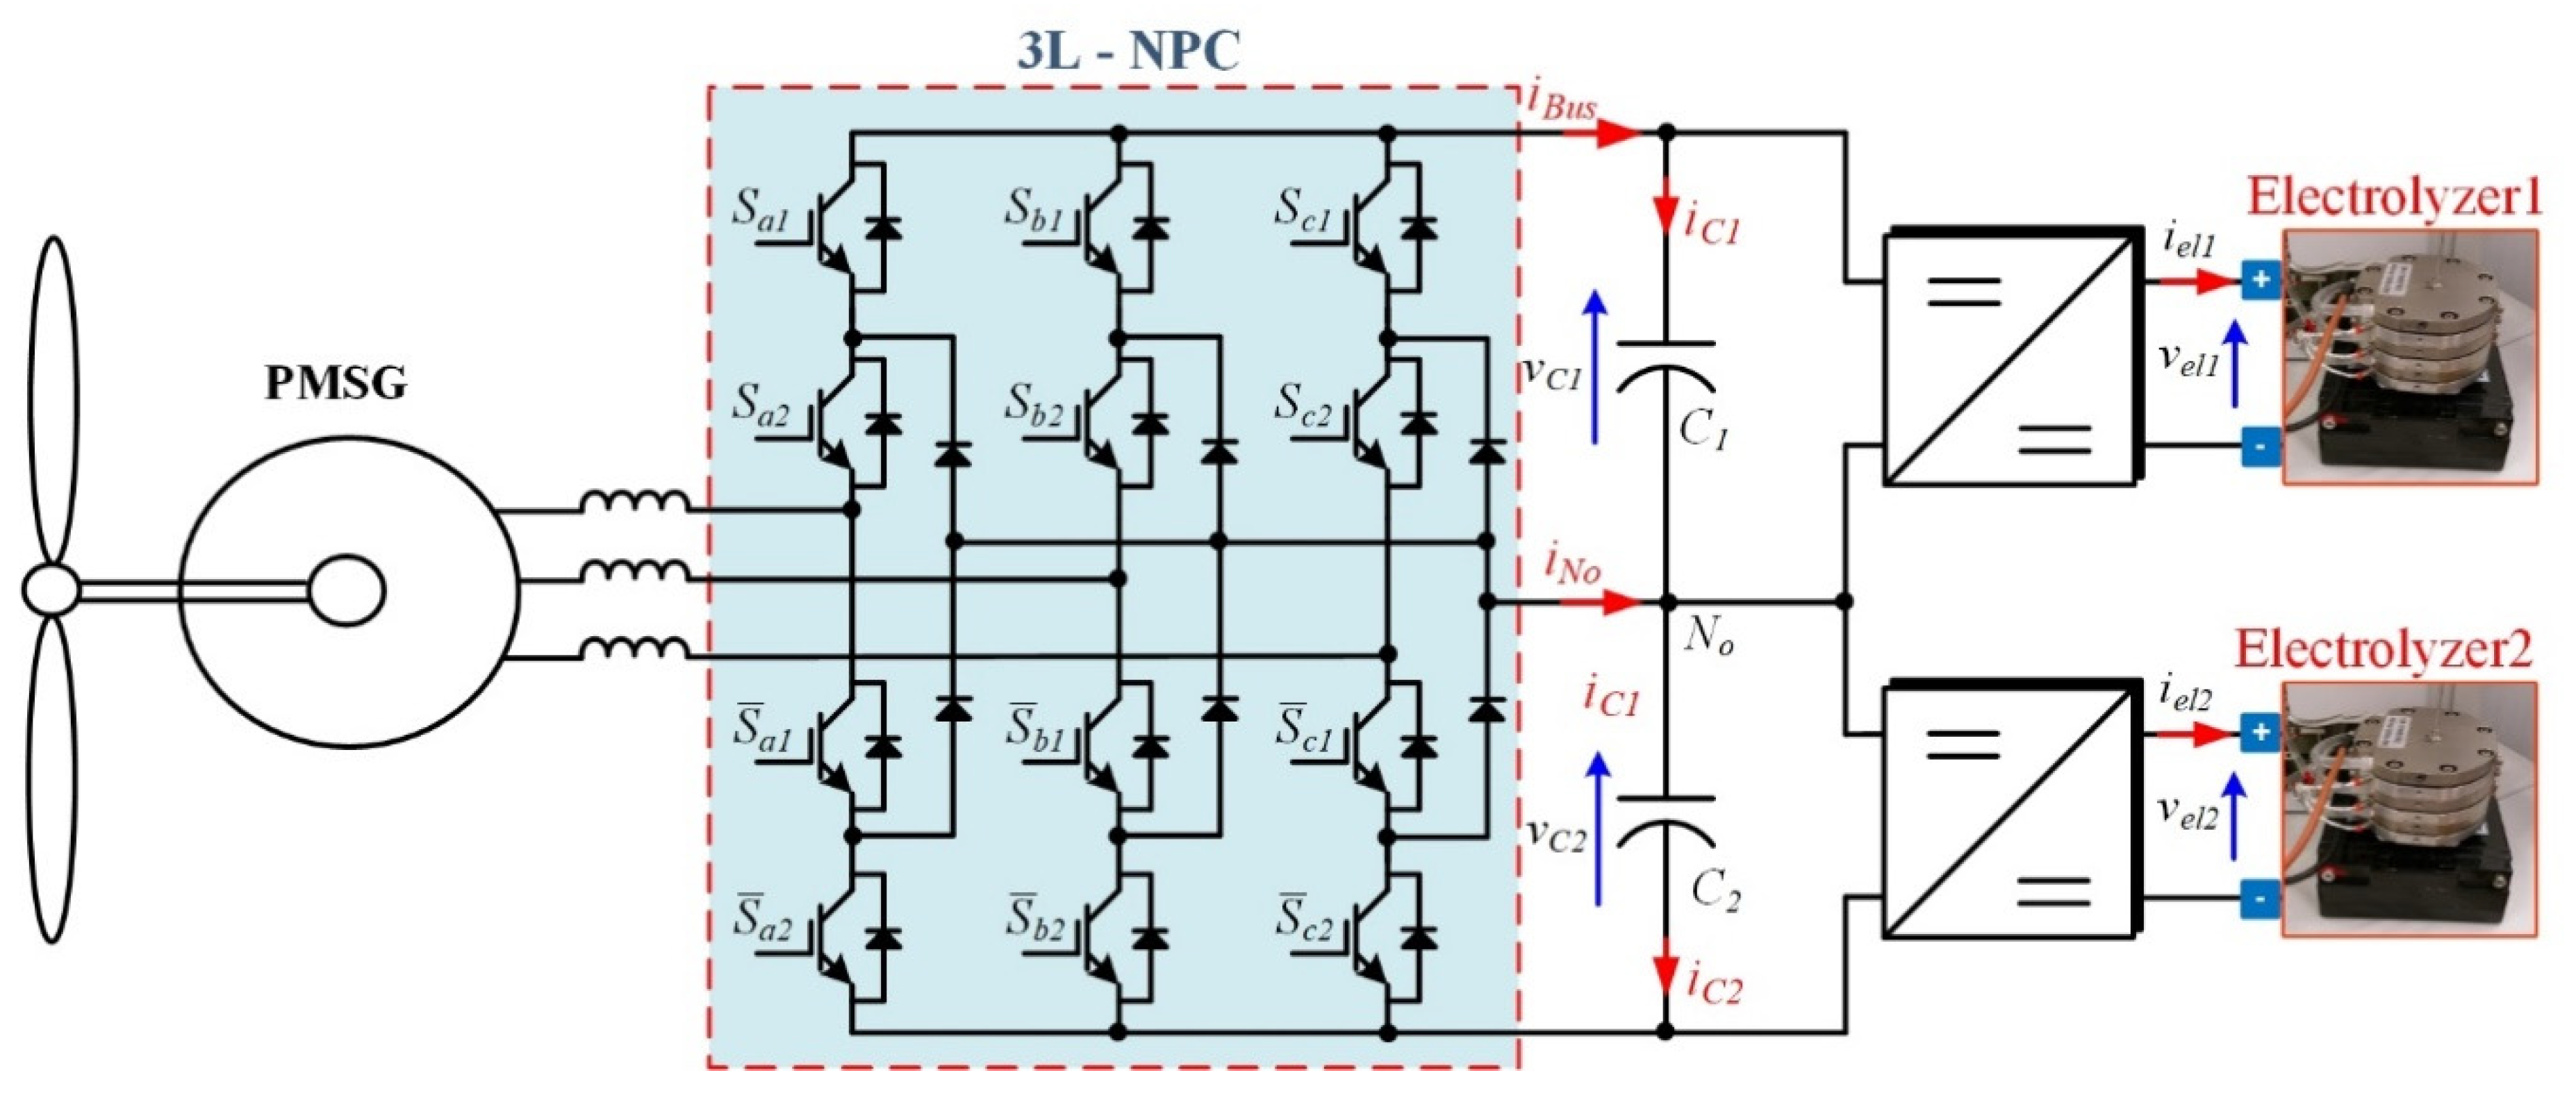
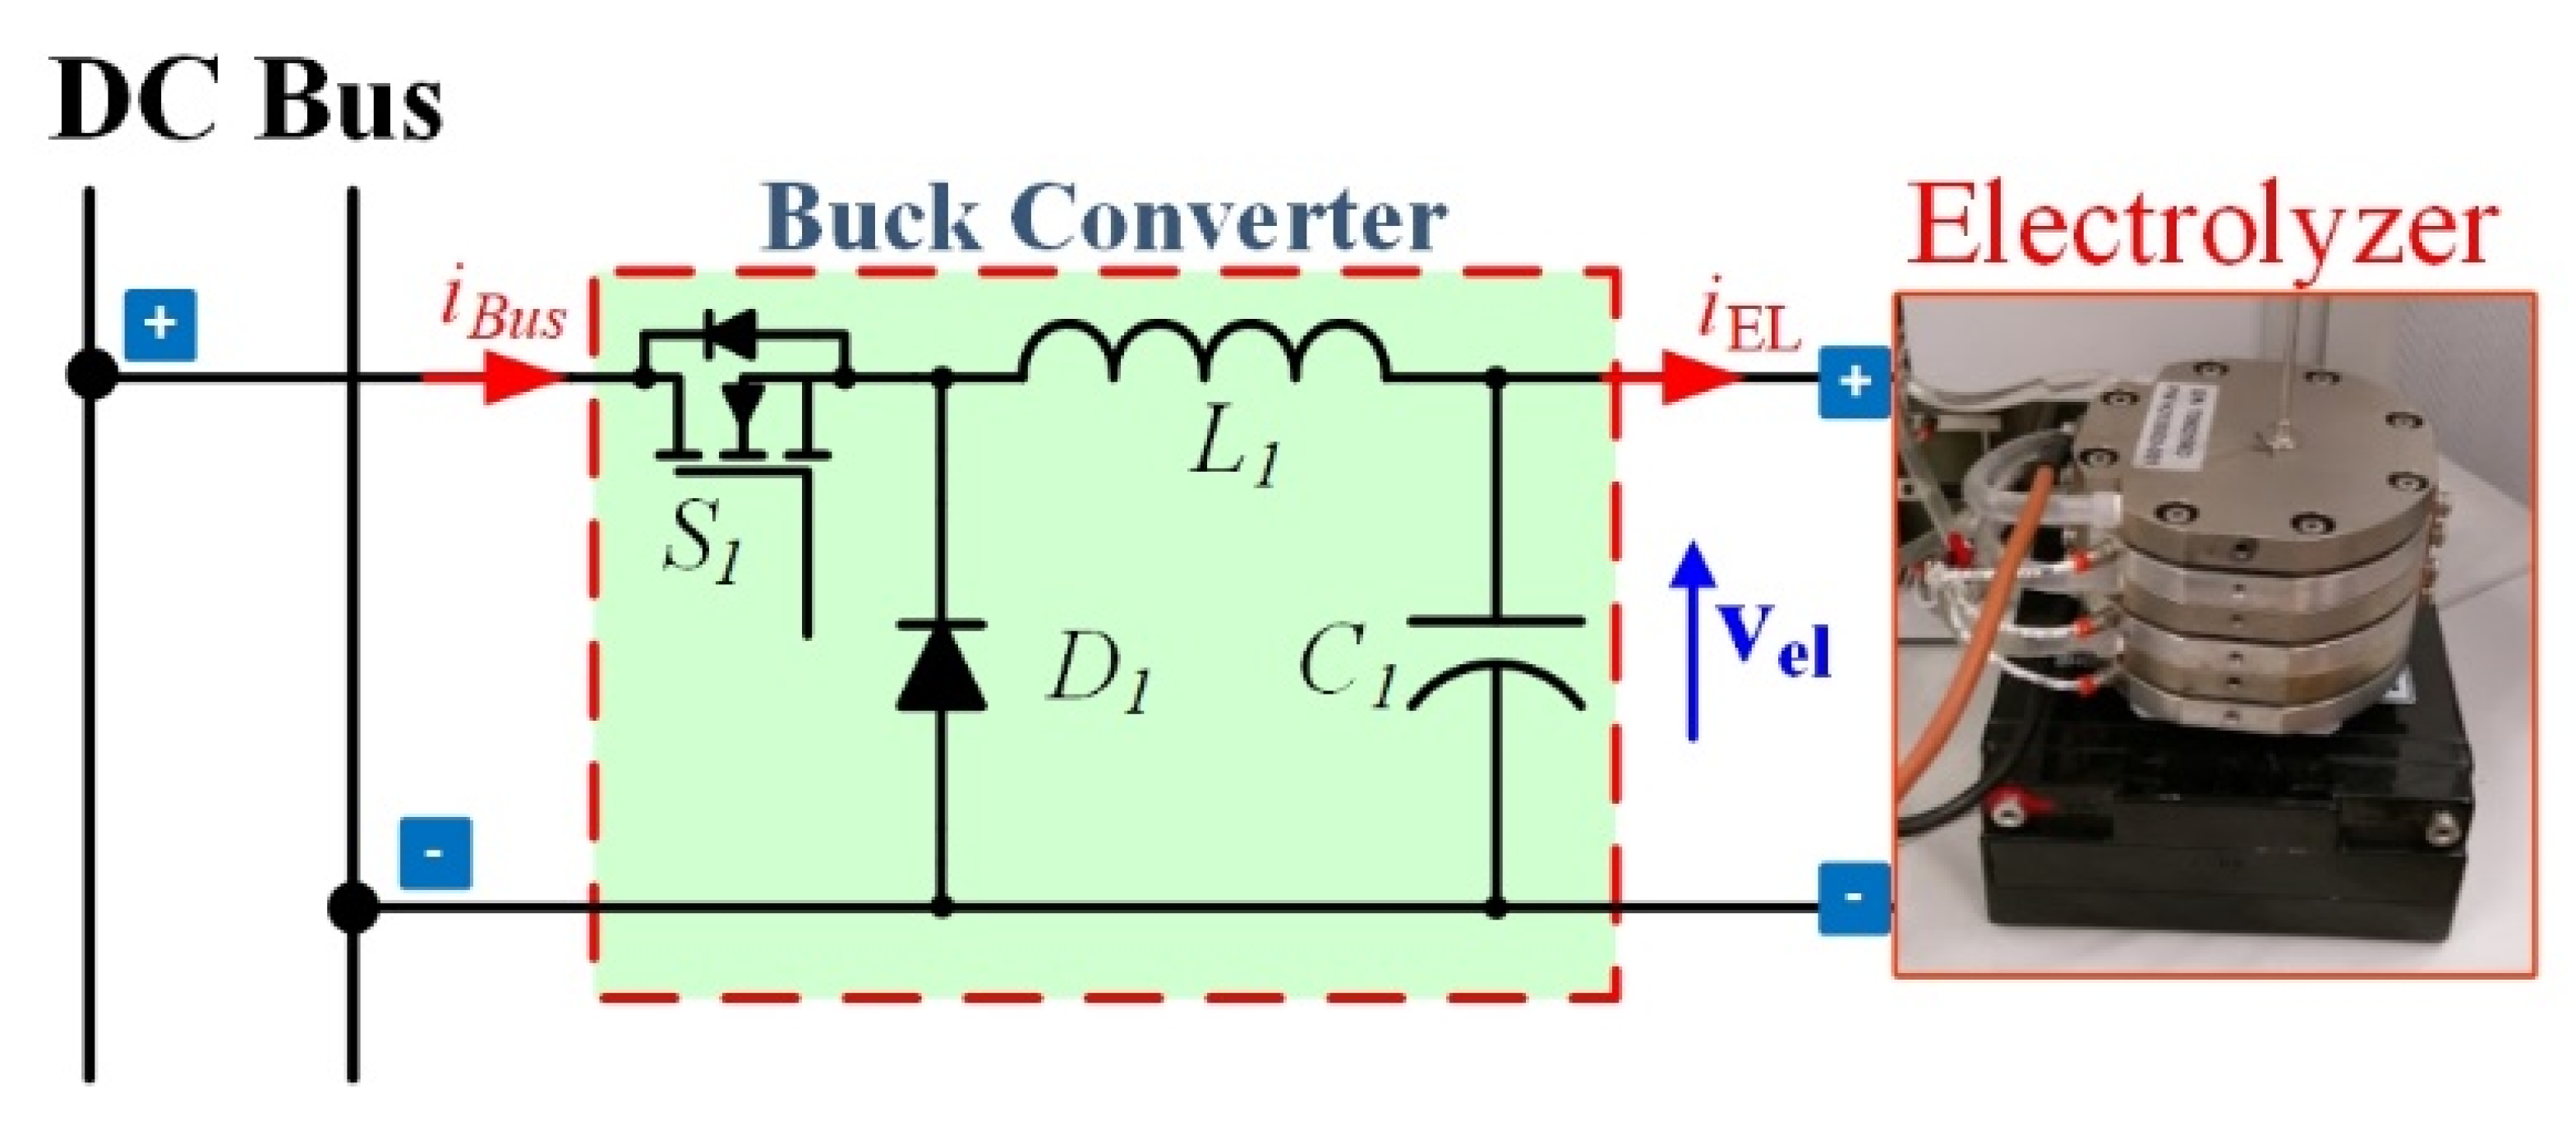
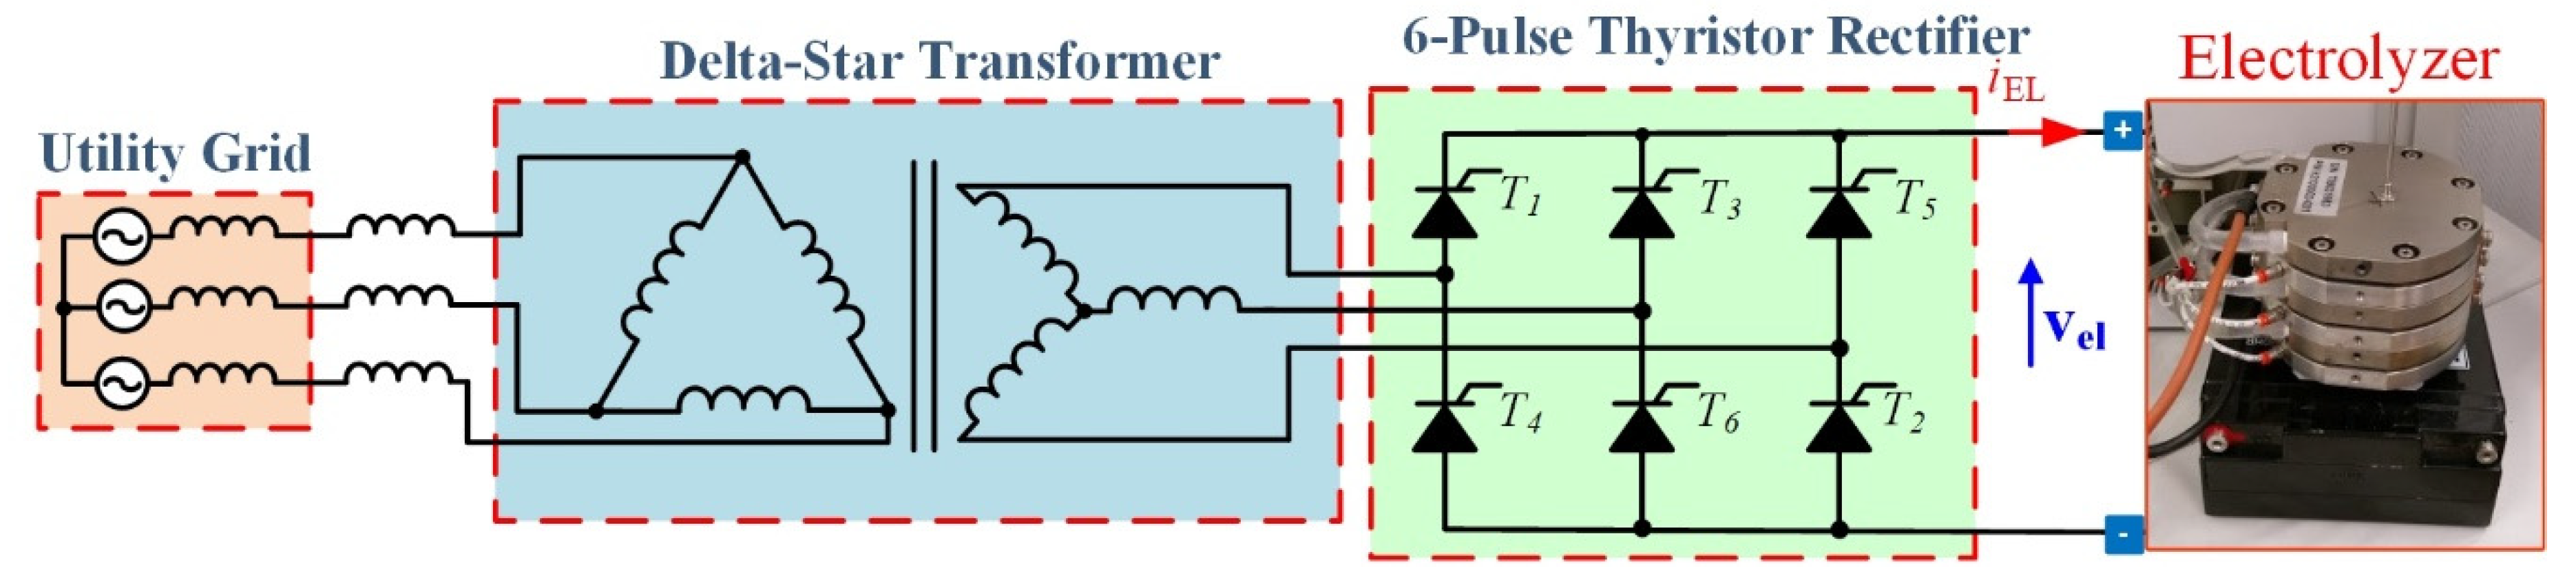
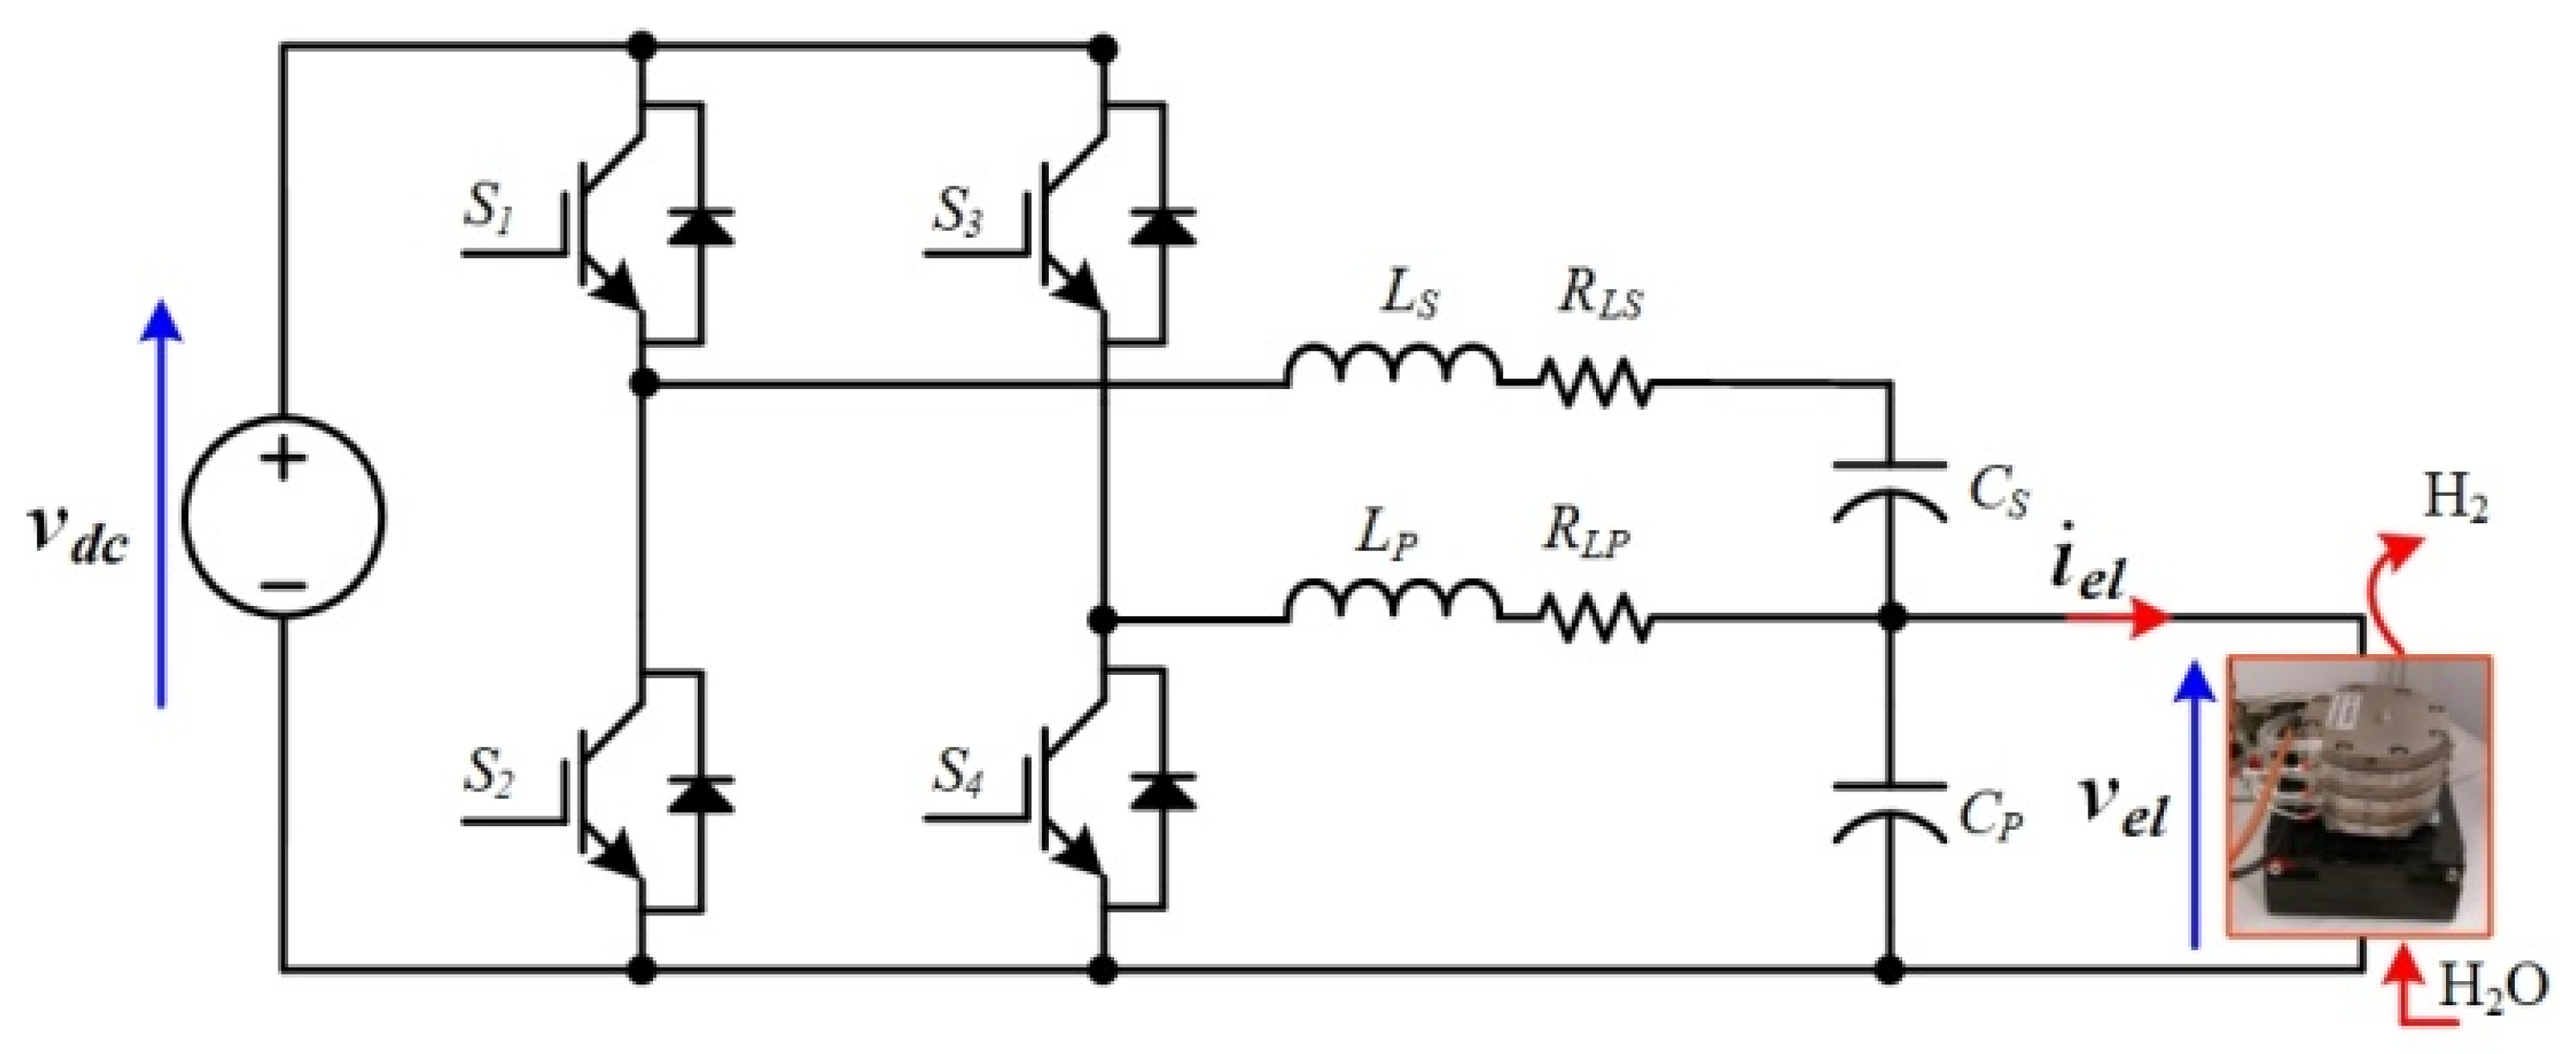
2.2. AC–DC and DC–DC Converters
3. Proton Exchange Membrane Electrolyzer Modeling for Control Purpose
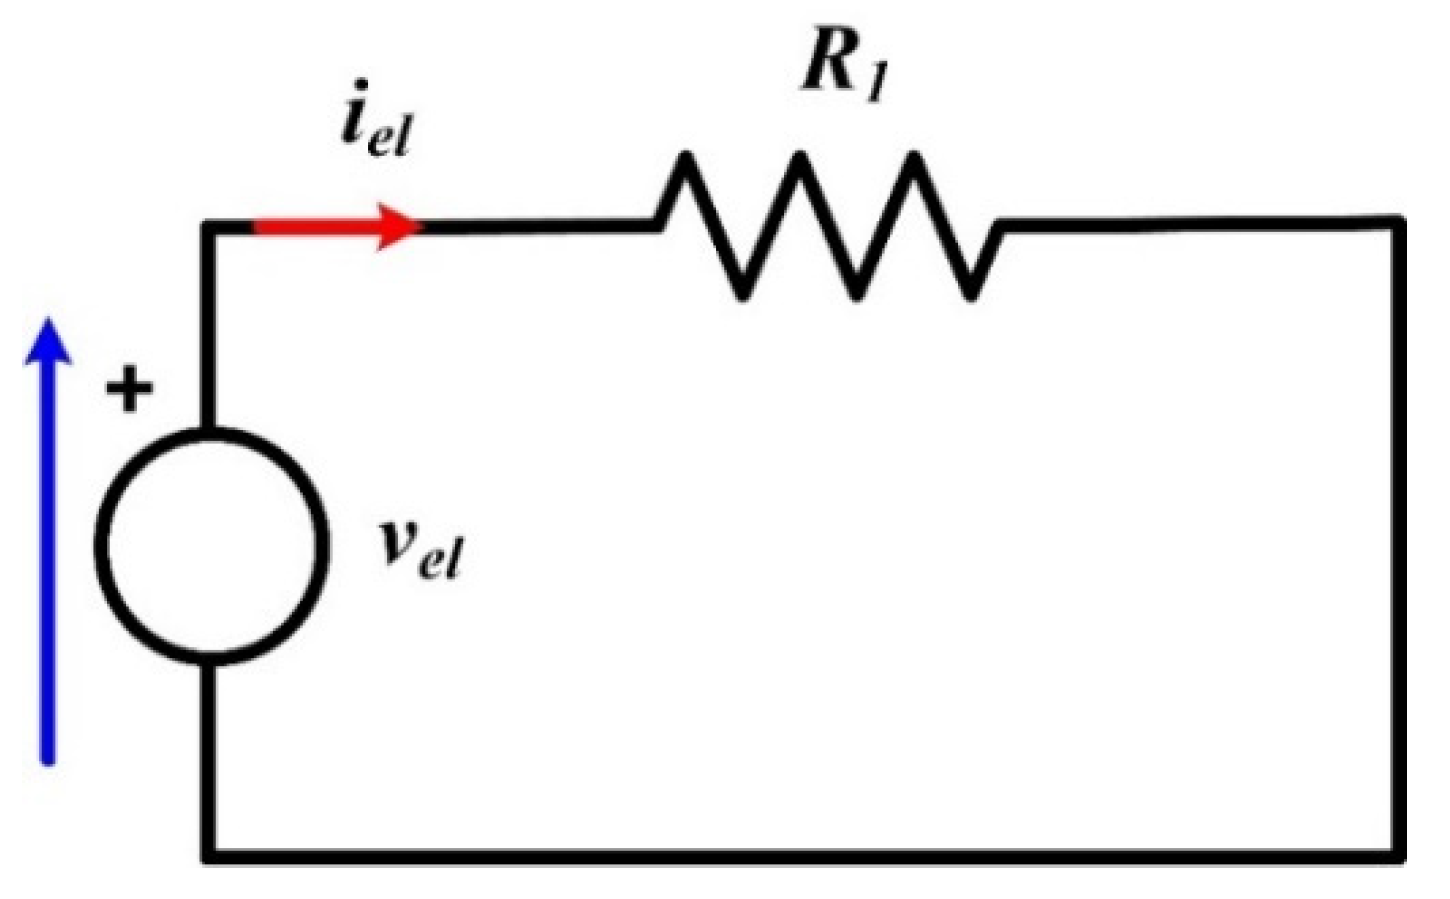
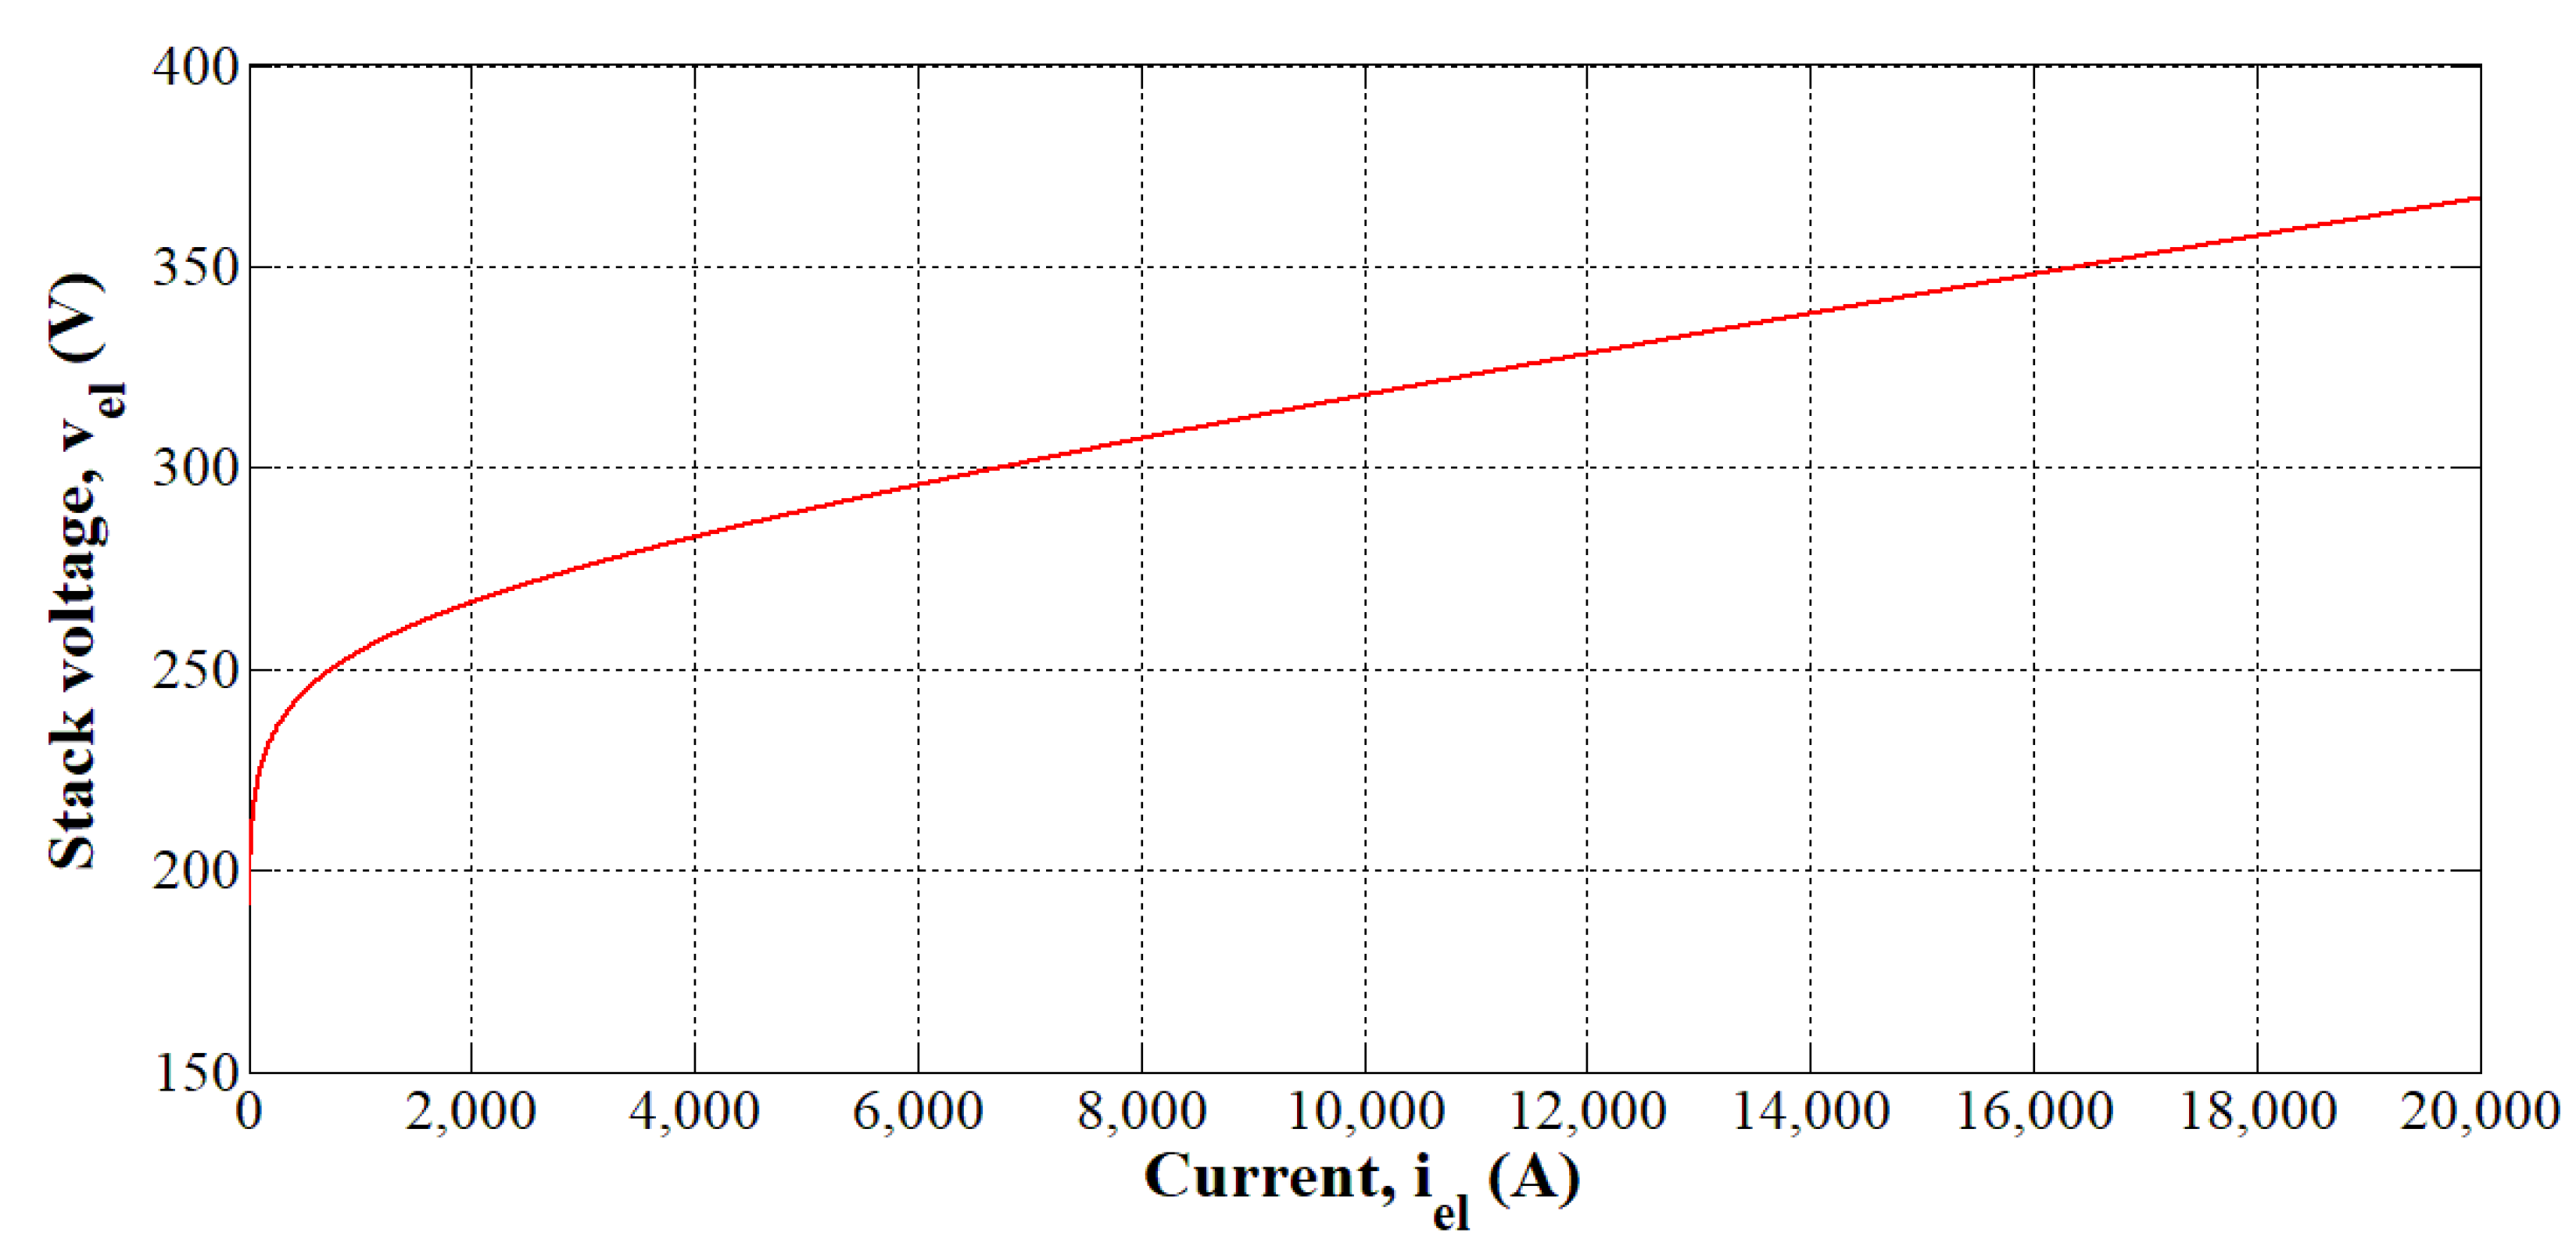
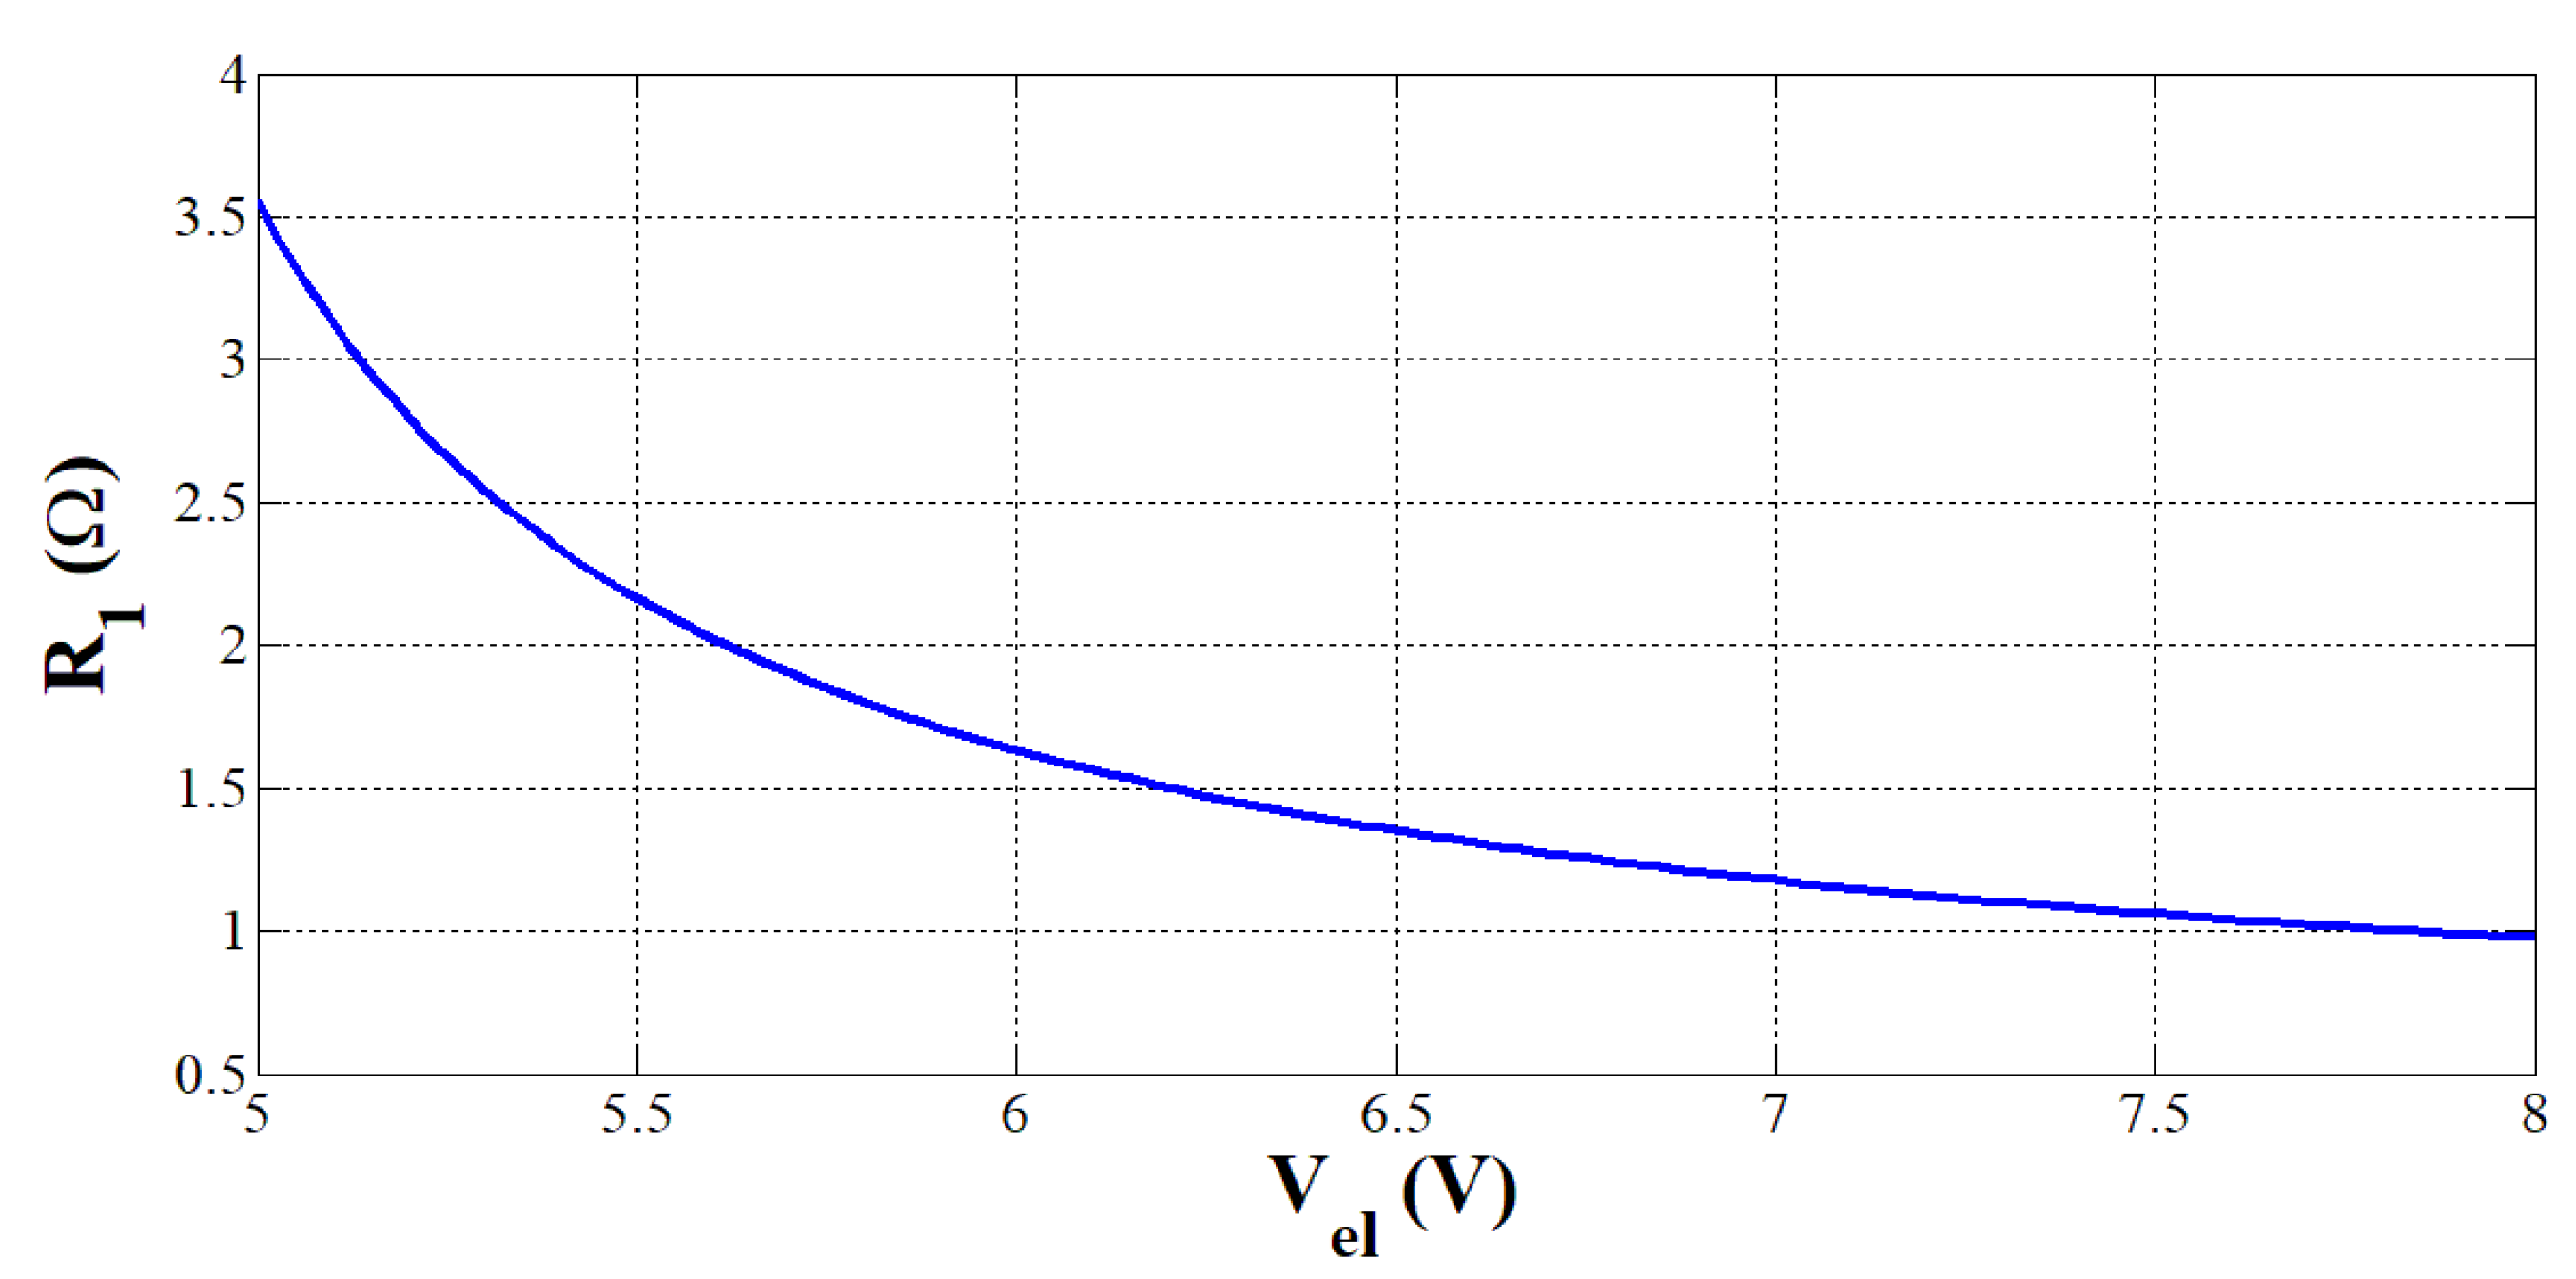
3.1. Resistive Model
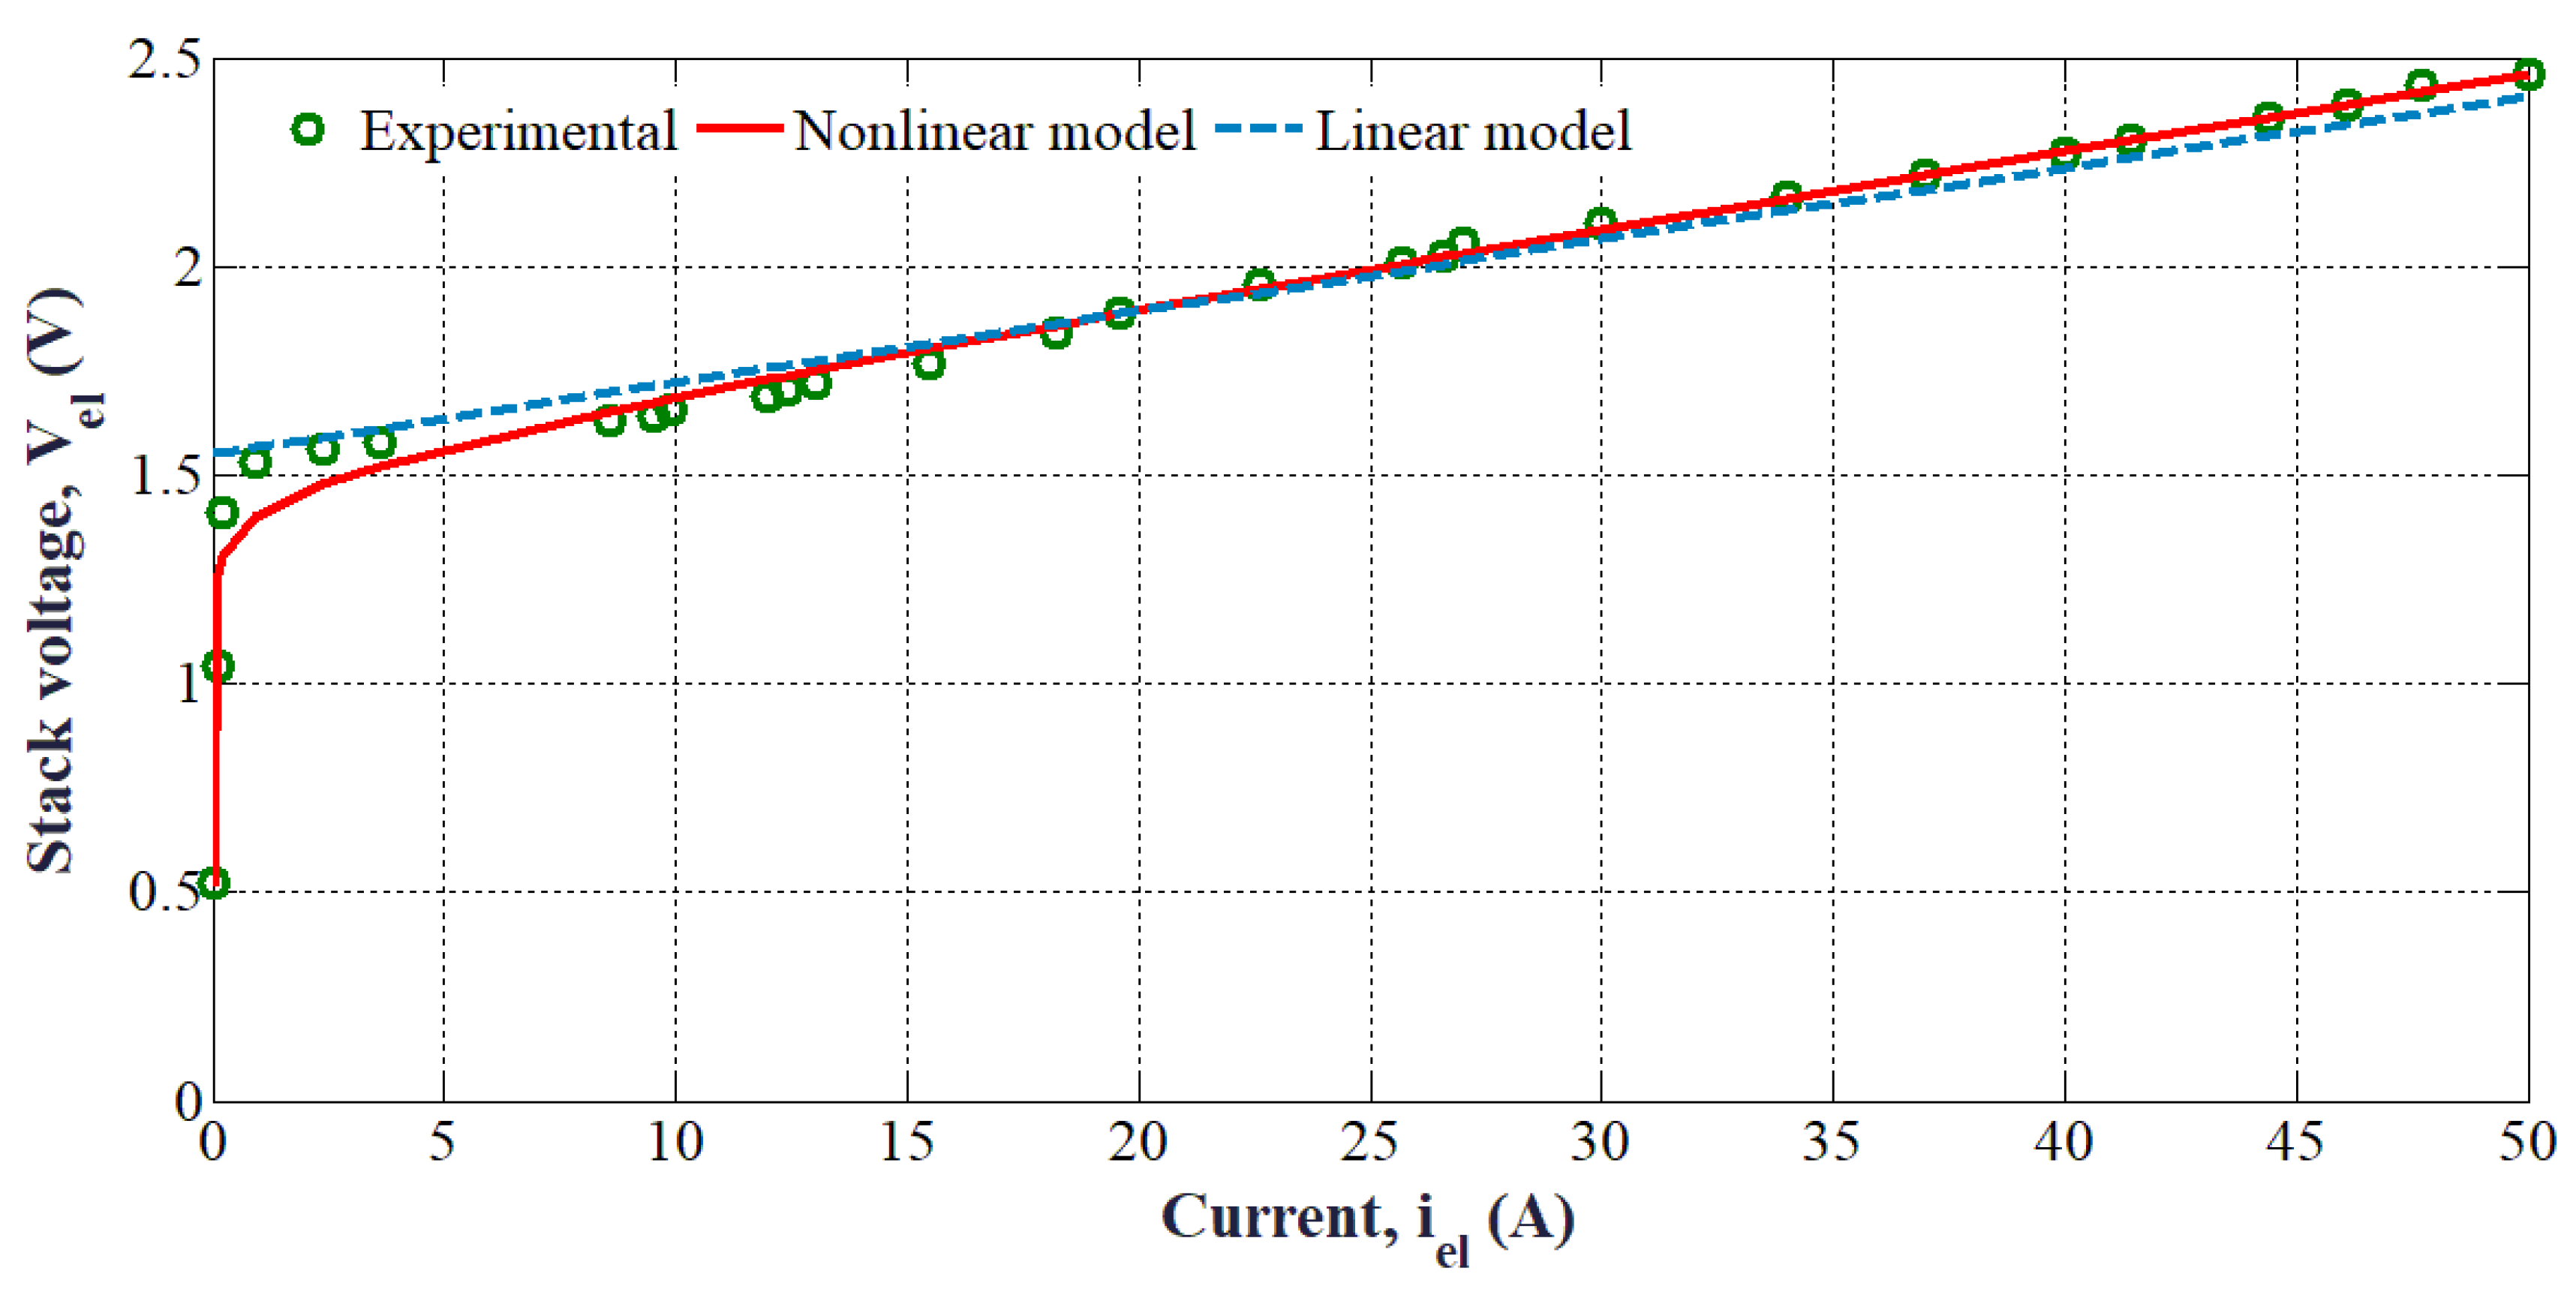
3.2. Static Model
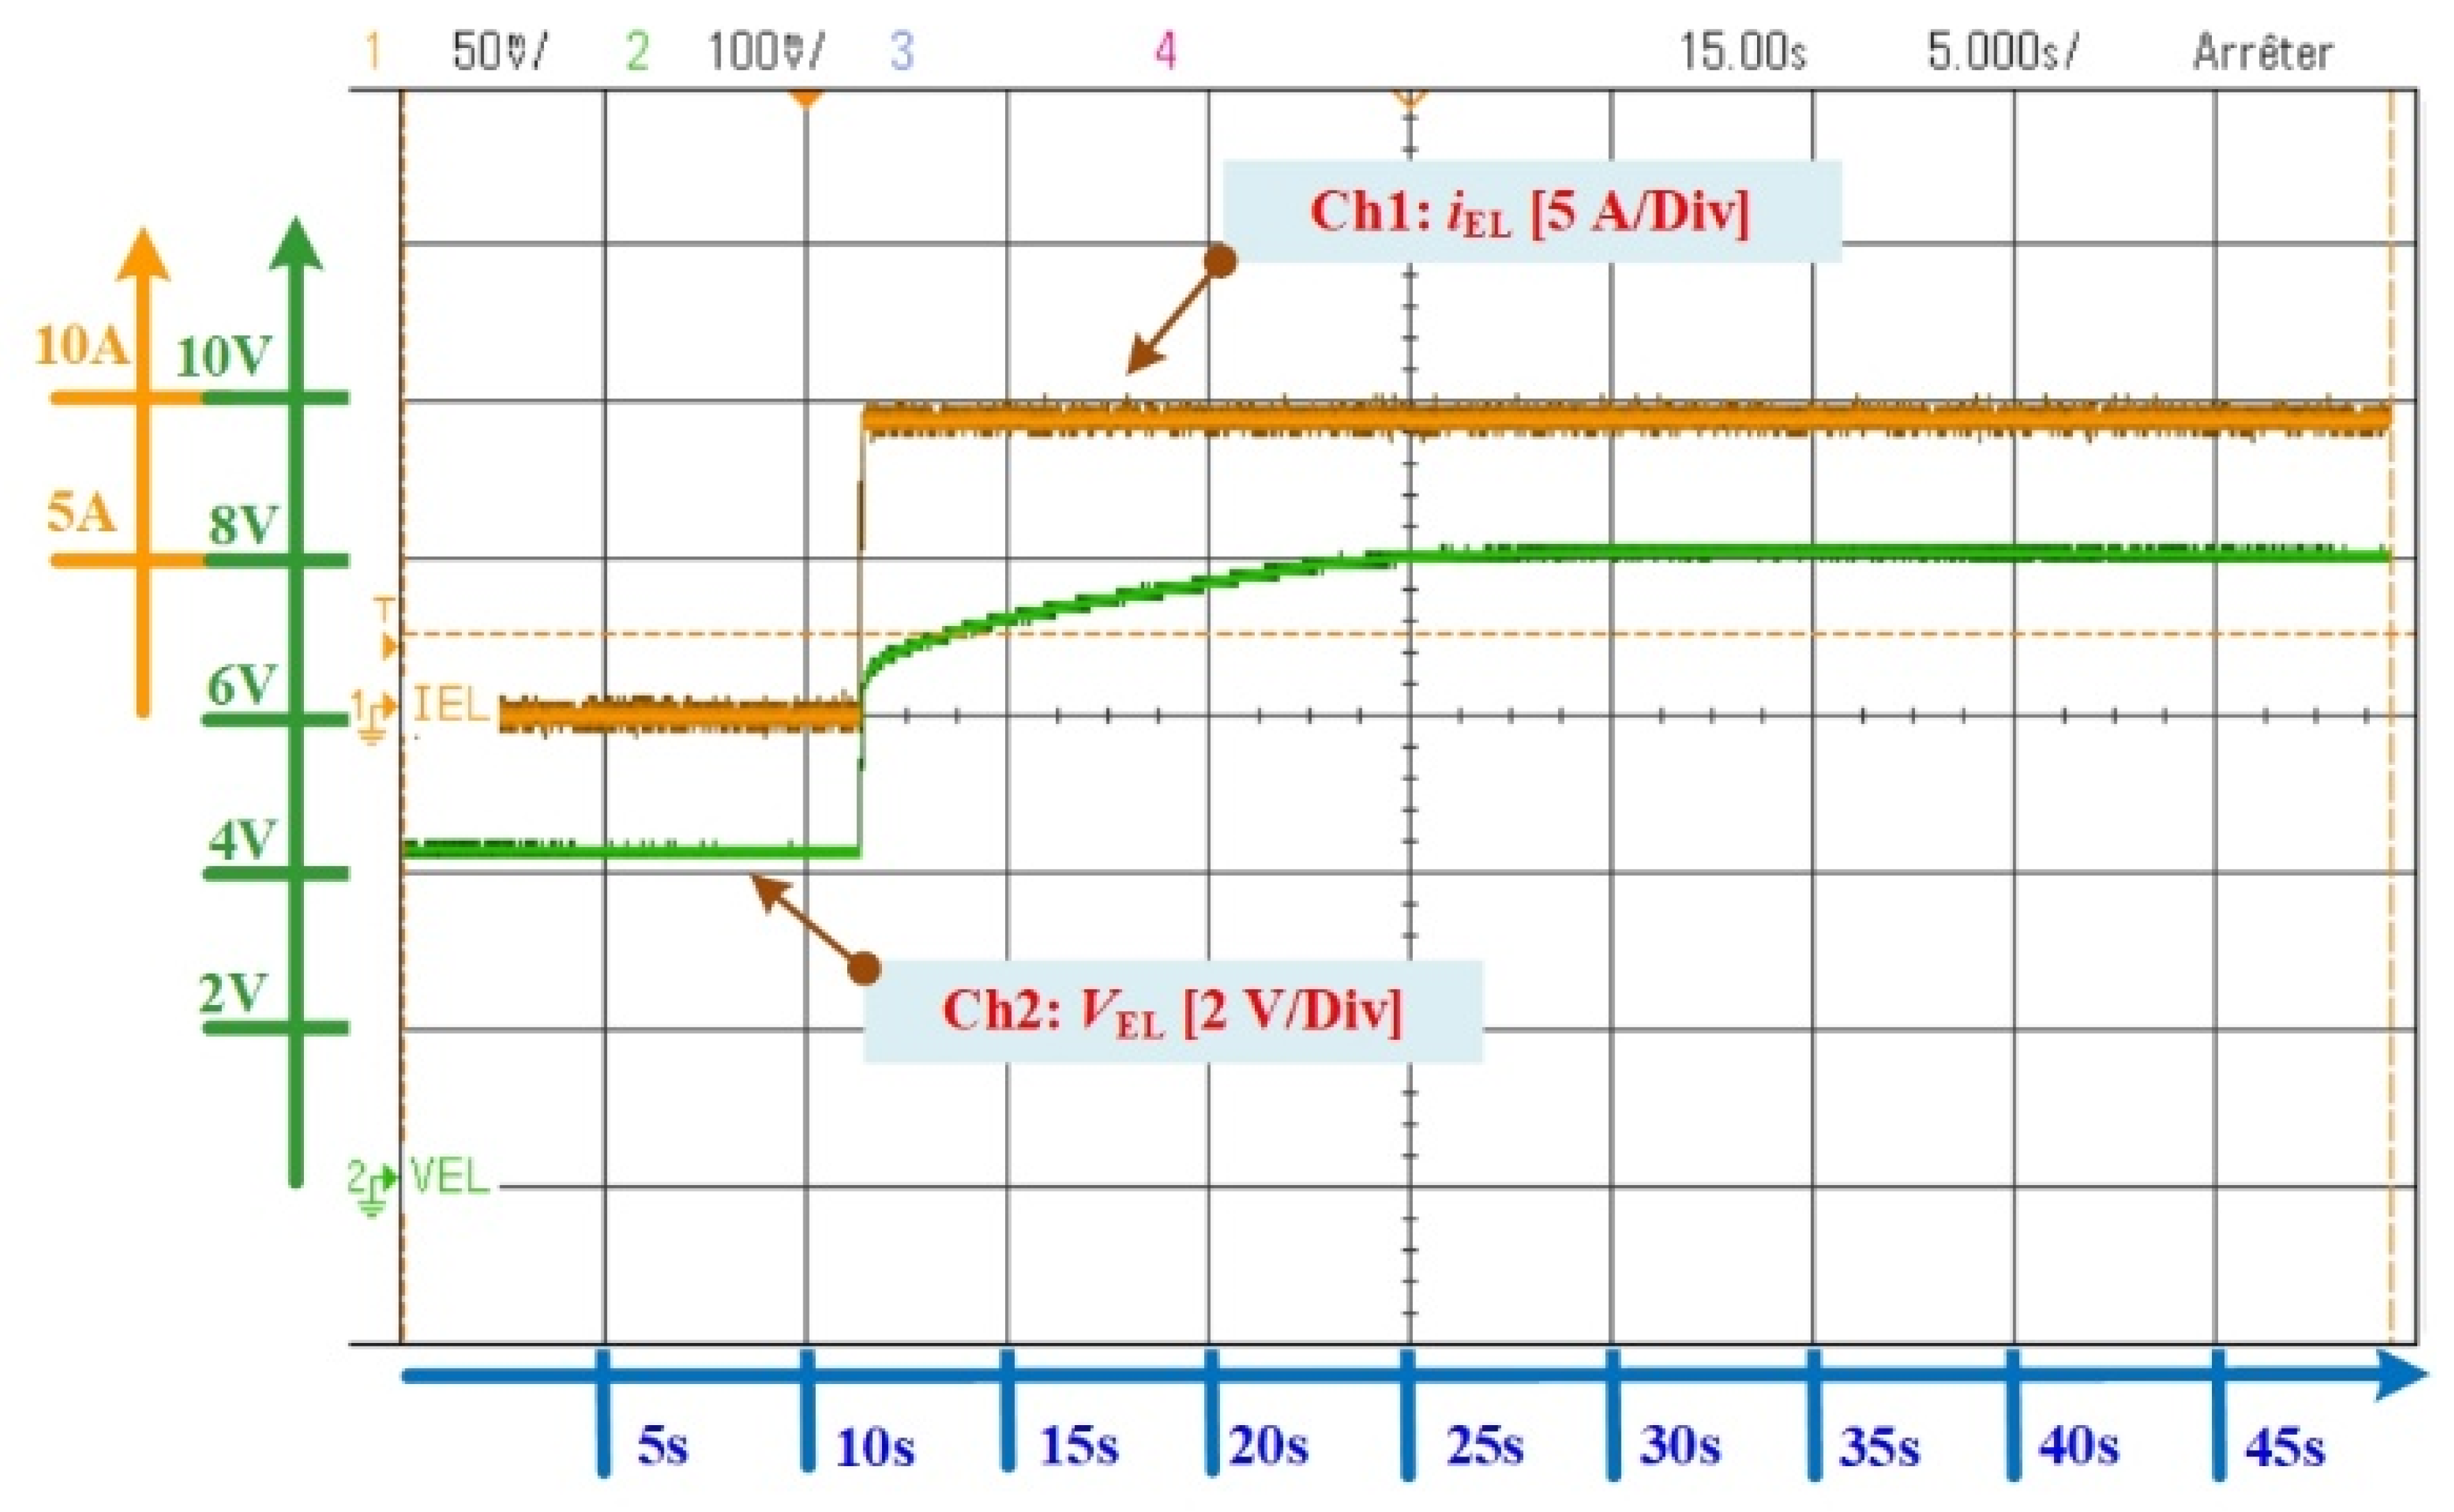
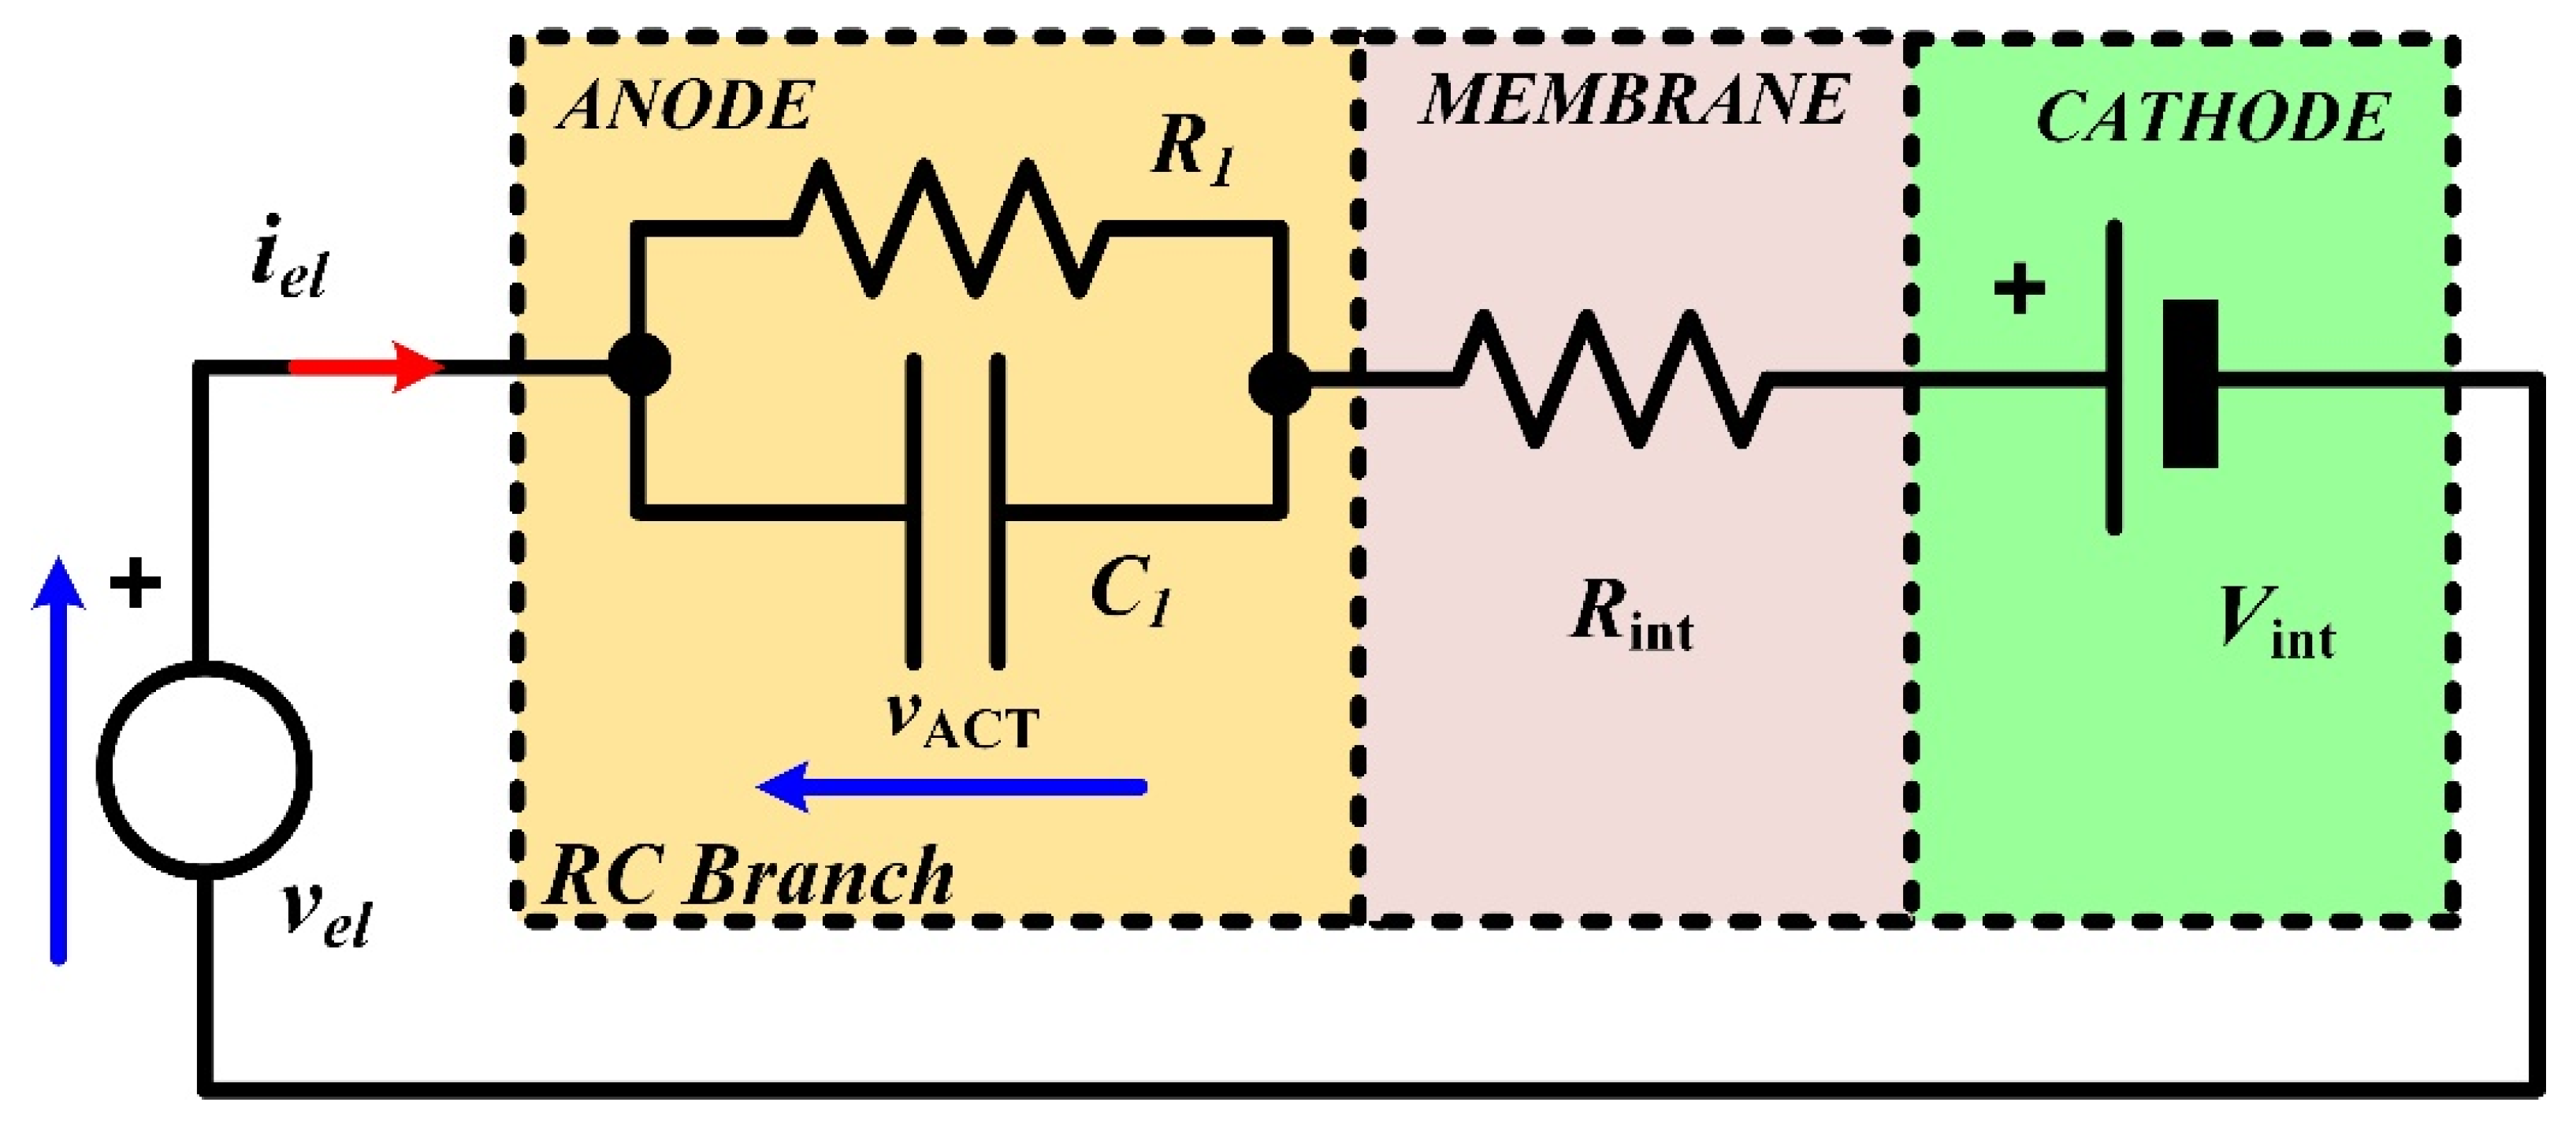
3.3. Dynamic Model
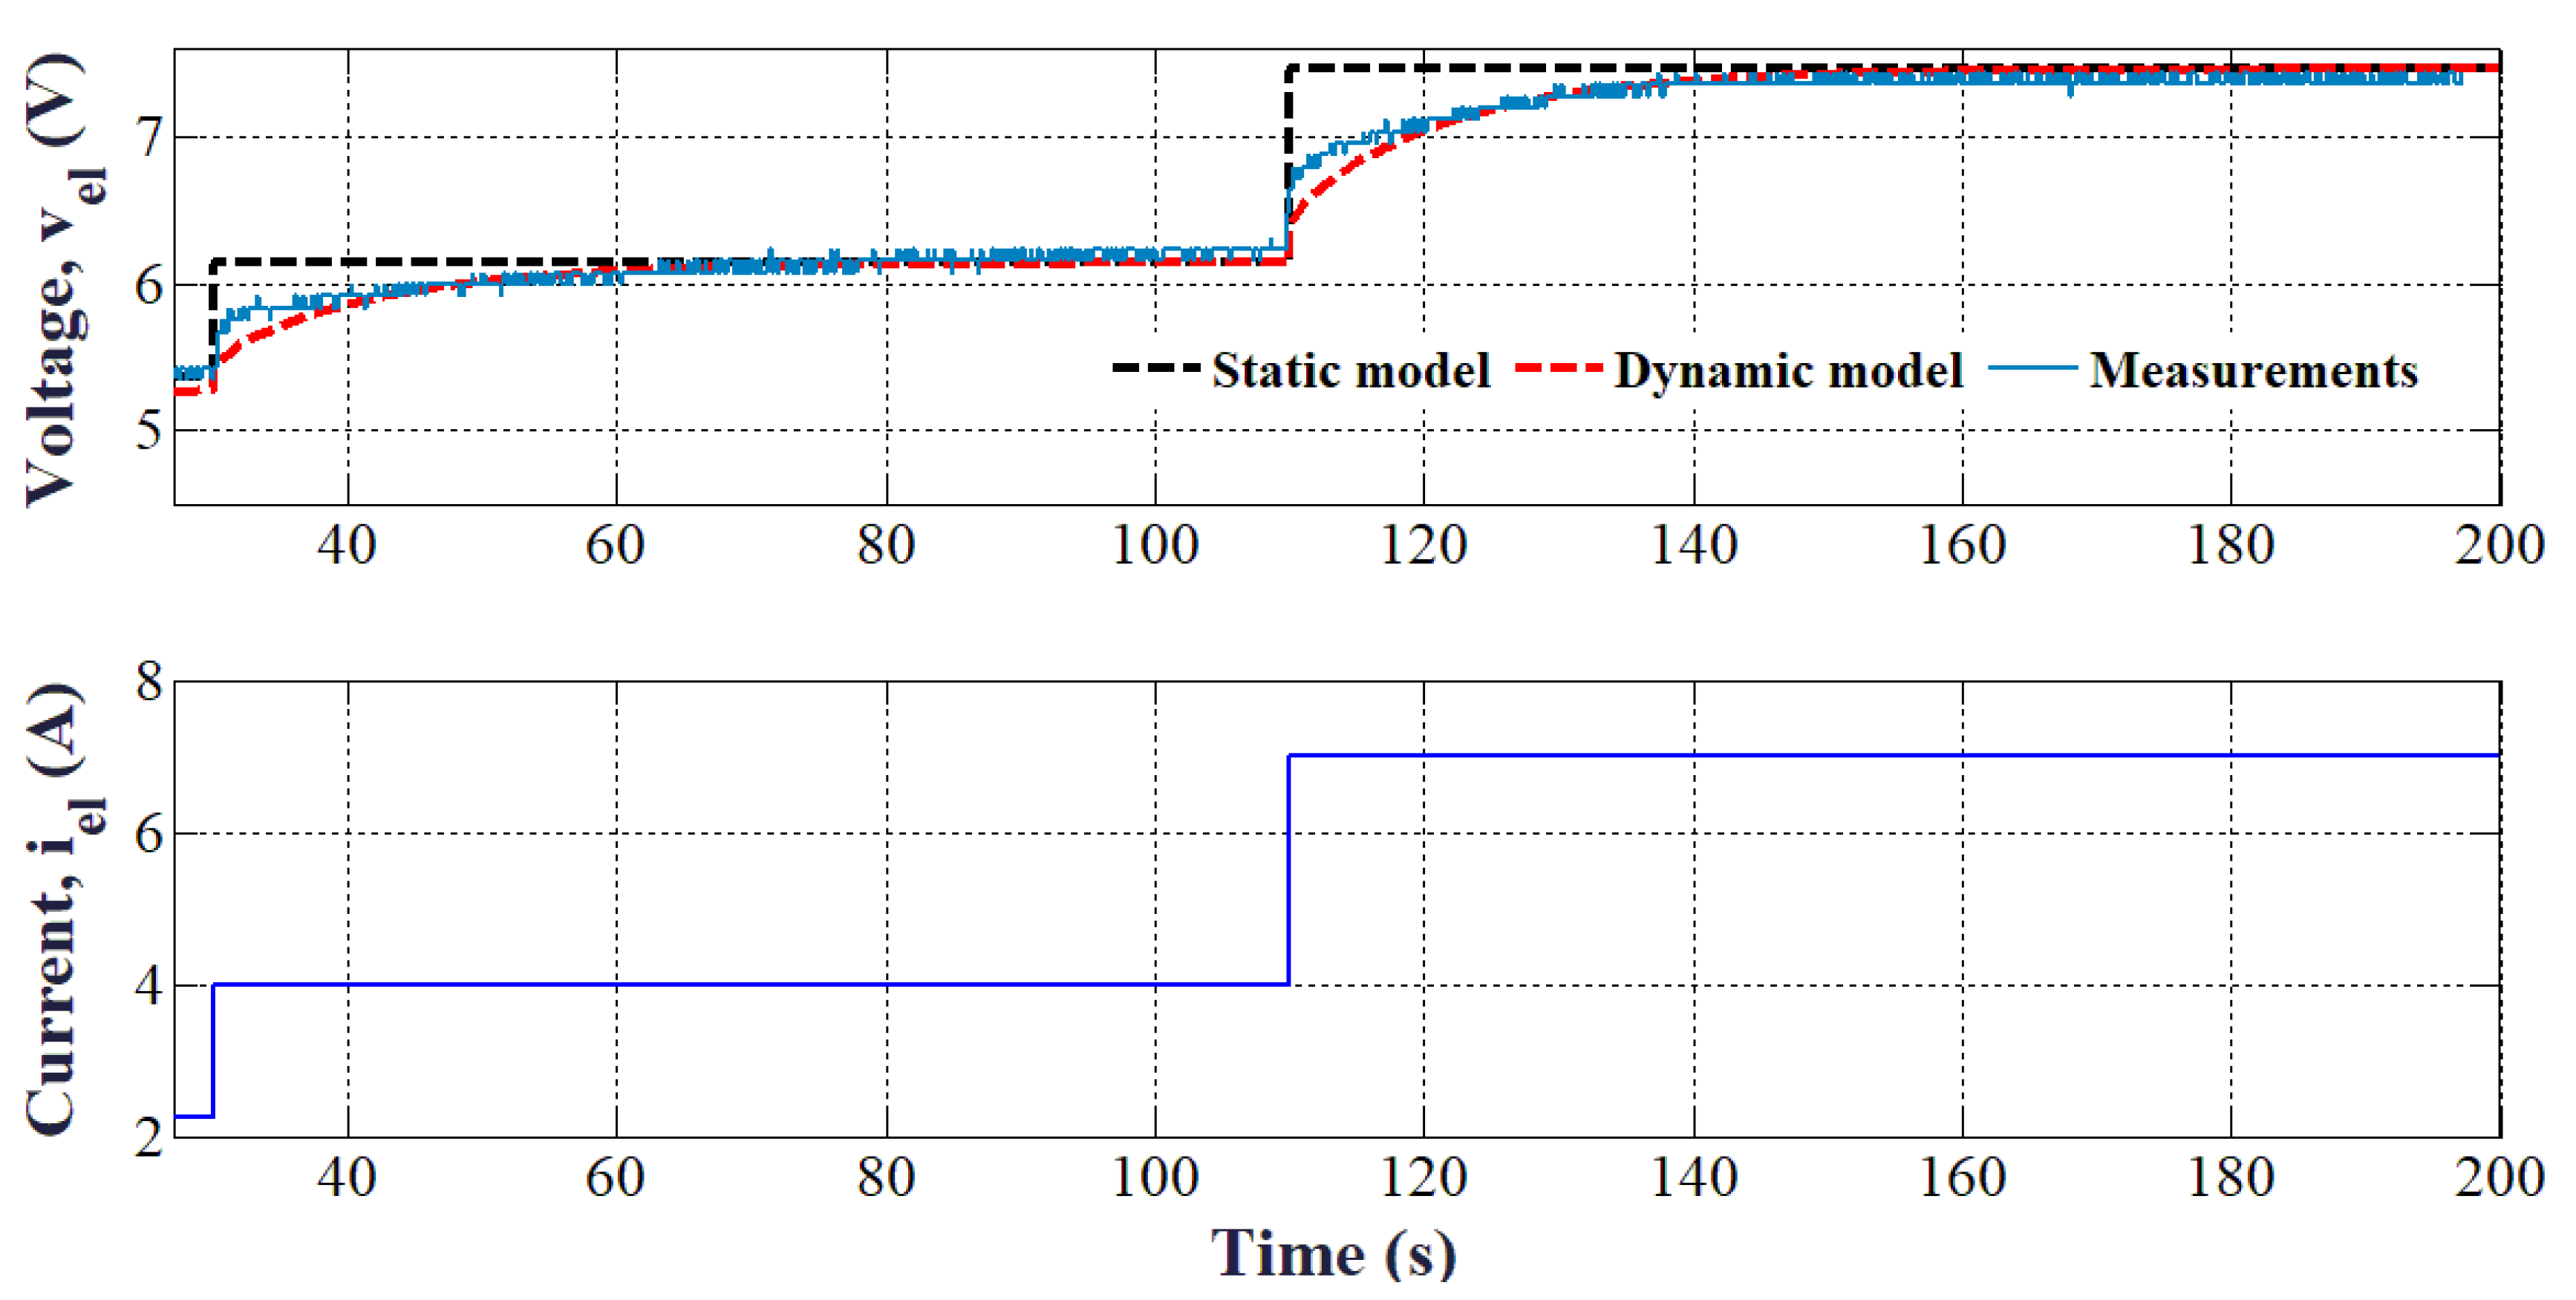
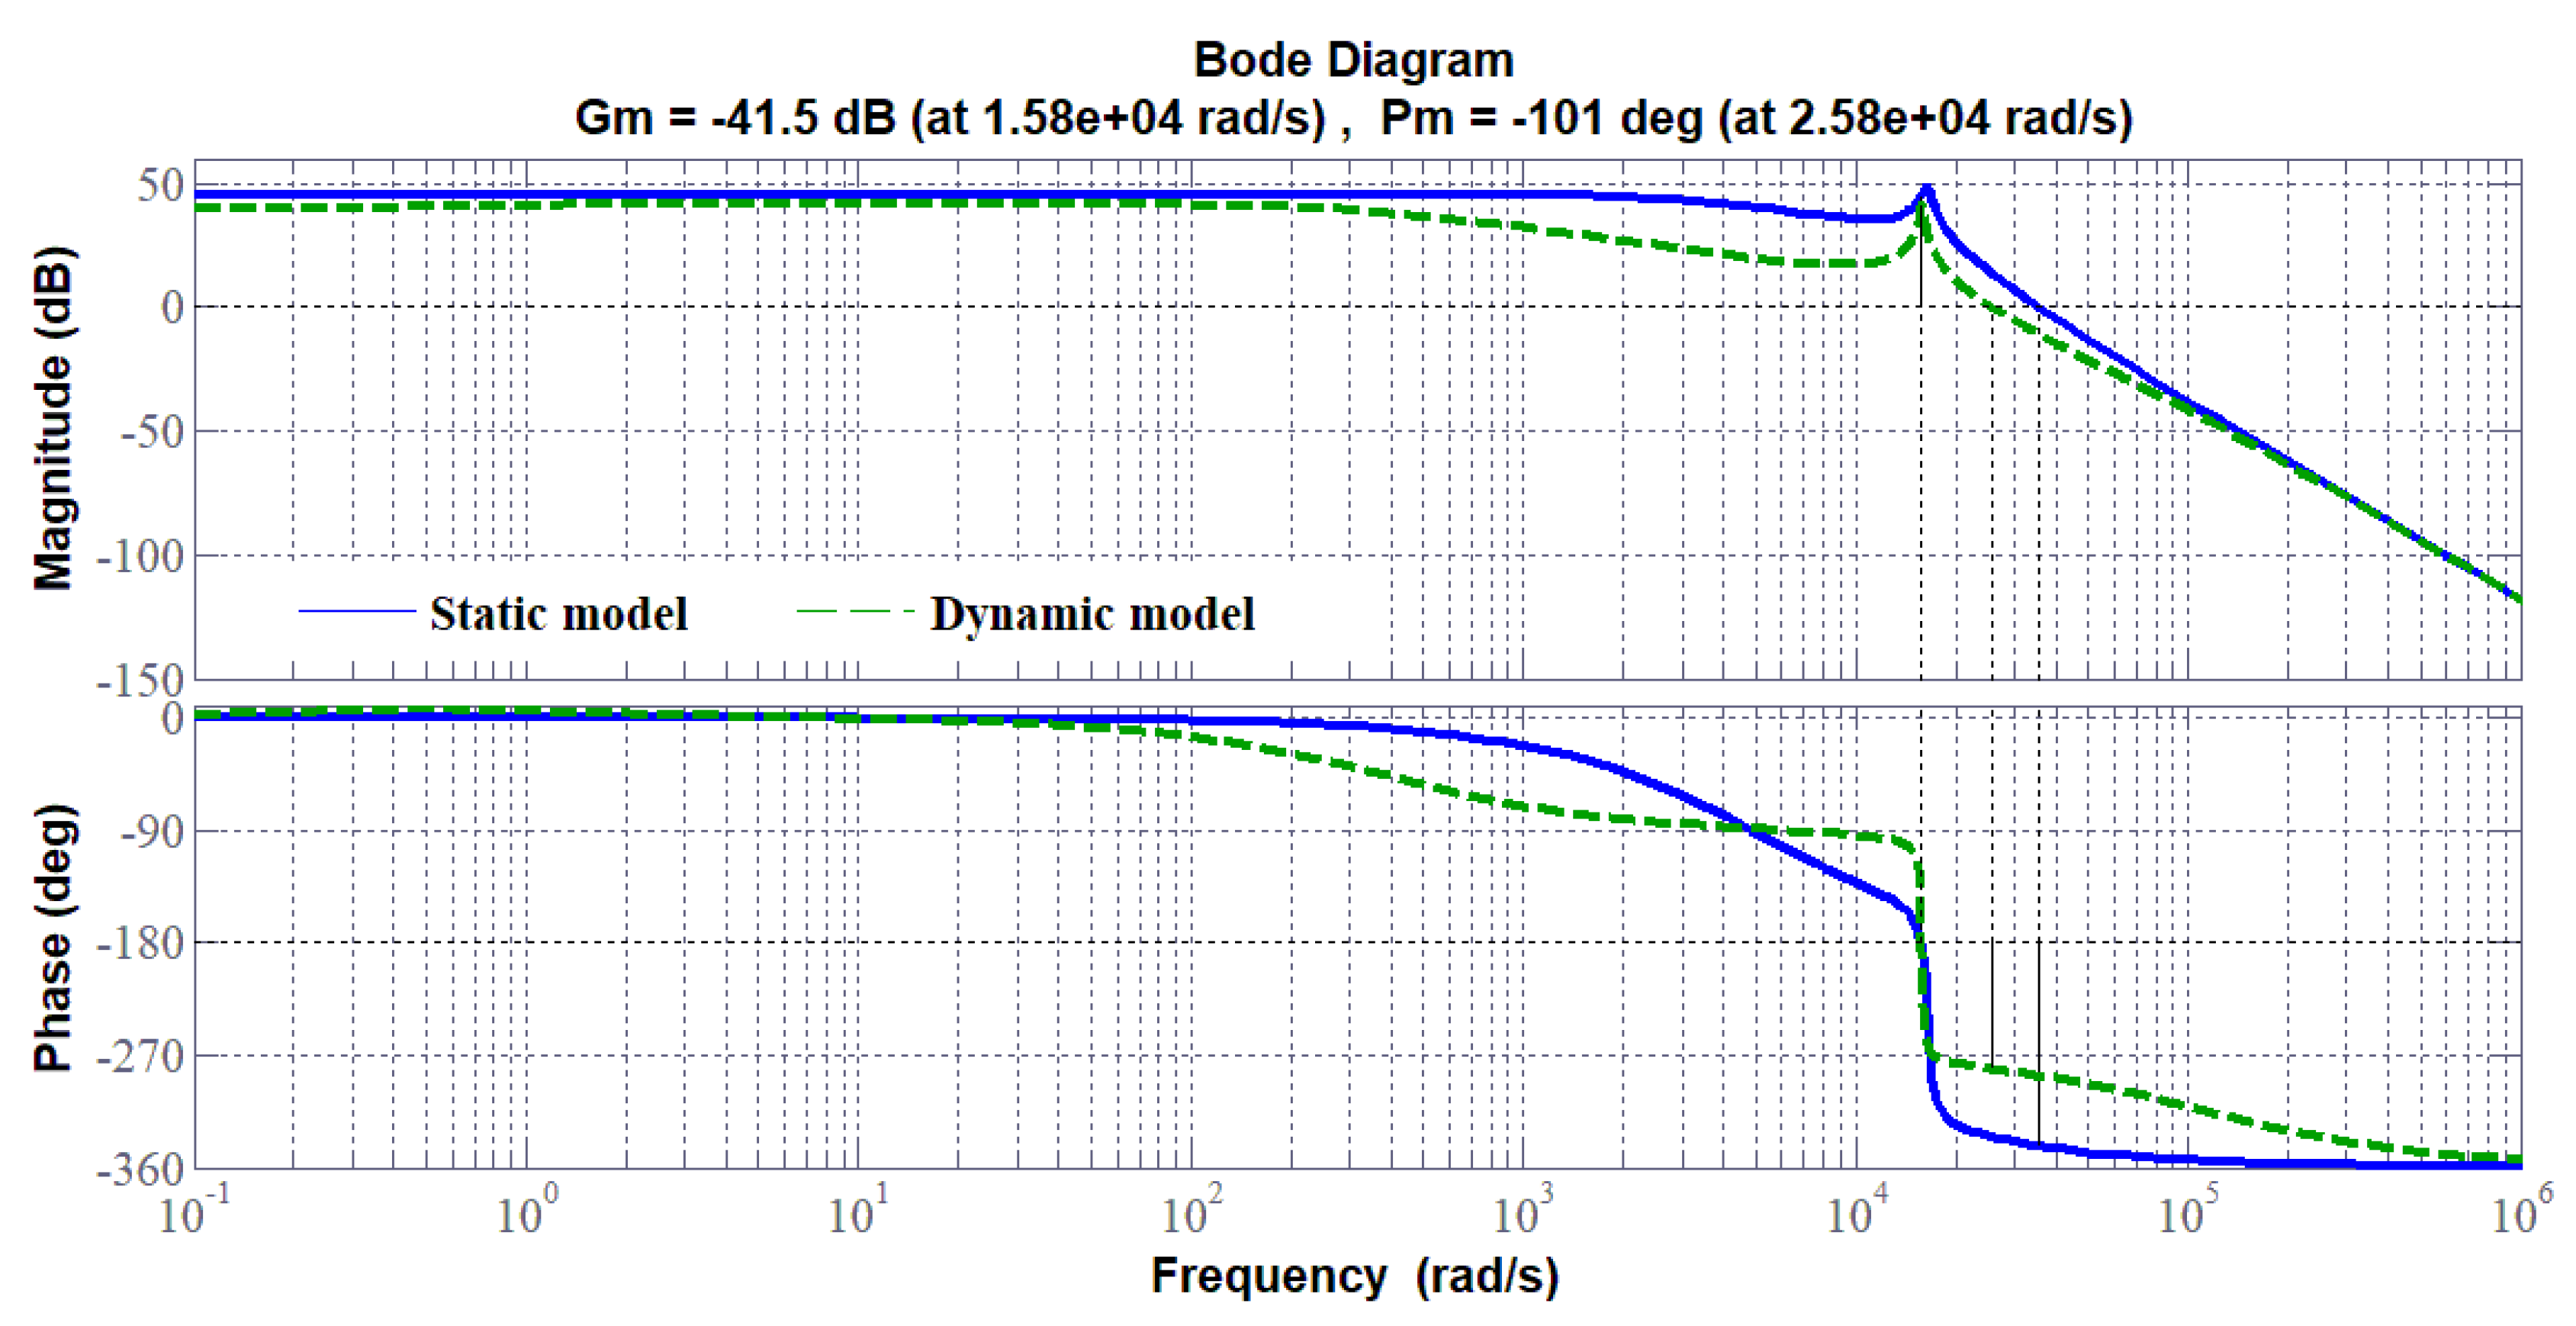
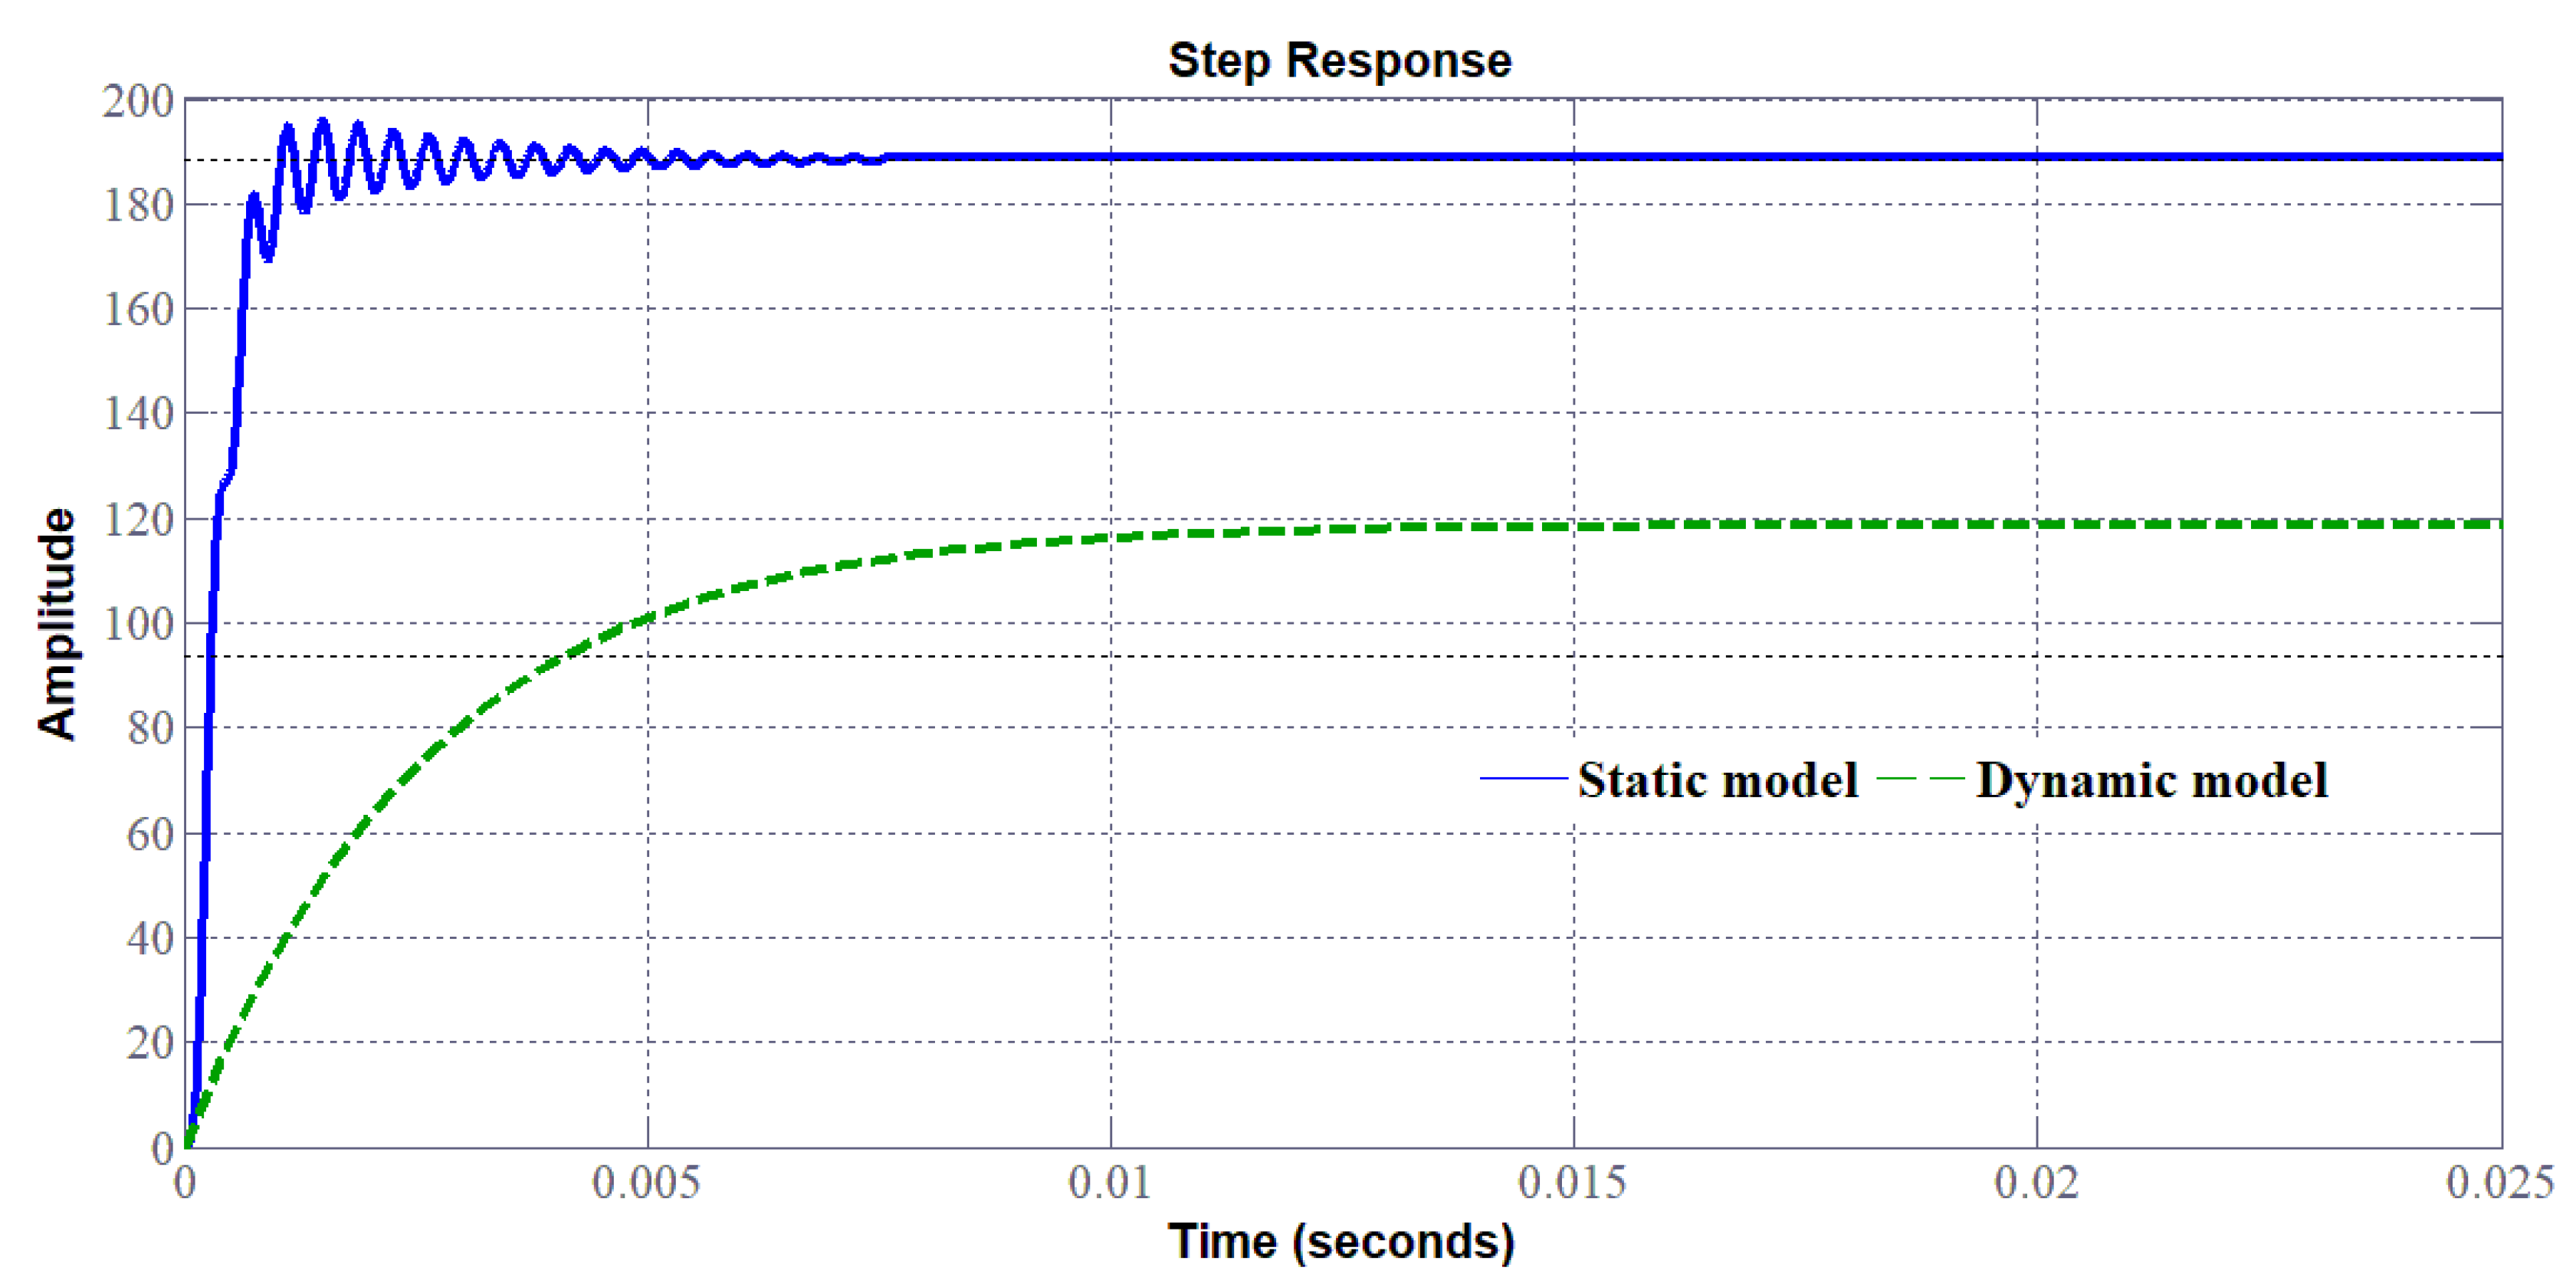
3.4. Comparison between Static and Dynamic Model
4. Conclusions
Author Contributions
Funding
Acknowledgments
Conflicts of Interest
References
- Nikolaidis, P.; Poullikkas, A. A comparative overview of hydrogen production processes. Renew. Sustain. Energy Rev. 2017, 67, 597–611. [Google Scholar] [CrossRef]
- 2019 DOE Hydrogen and Fuel Cells Program Annual Merit Review and Peer Evaluation Report Released. Office of Energy Efficiency & Renewable Energy Home Page. Available online: https://www.energy.gov/eere/fuelcells/articles/2019-doe-hydrogen-and-fuel-cells-program-annual-merit-review-and-peer (accessed on 26 March 2020).
- Shiva, K.S.; Himabindu, V. Hydrogen production by PEM water electrolysis—A review. Mater. Sci. Energy Technol. 2019, 2, 442–454. [Google Scholar]
- Melaina, M.W.; Antonia, O.; Penev, M. Blending Hydrogen into Natural Gas Pipeline Networks: A Review of Key Issues; No. NREL/TP-5600-51995; National Renewable Energy Laboratory: Oak Ridge, TN, USA, 2013.
- Haines, M.; Polman, E.; Delaat, J. Reduction of CO2 emissions by addition of hydrogen to natural gas. Greenh. Gas Control Technol. 2005, 7, 337–345. [Google Scholar]
- David, M.; Ocampo-Martínez, C.; Sánchez-Peña, R. Advances in alkaline water electrolyzers: A review. J. Energy Storage 2019, 23, 392–403. [Google Scholar] [CrossRef]
- Rajeshwar, K.; McConnell, R.; Licht, S. Solar Hydrogen Generation; Springer: New York, NY, USA, 2008. [Google Scholar]
- Koponen, J.; Ruuskanen, V.; Kosonen, A.; Niemela, M.; Ahola, J. Effect of converter topology on the specific energy consumption of alkaline water electrolyzers. IEEE Trans. Power Electron. 2019, 34, 6171–6182. [Google Scholar] [CrossRef]
- Speckmann, F.; Bintz, S.; Birke, K. Influence of rectifiers on the energy demand and gas quality of alkaline electrolysis systems in dynamic operation. Appl. Energy 2019, 250, 855–863. [Google Scholar] [CrossRef]
- Ruuskanen, V.; Koponen, J.; Kosonen, A.; Niemelä, M.; Ahola, J.; Hämäläinen, A. Power quality and reactive power of water electrolyzers supplied with thyristor converters. J. Power Sources 2020, 459, 228075. [Google Scholar] [CrossRef]
- Mohammadi, A.; Mehrpooya, M. A comprehensive review on coupling different types of electrolyzer to renewable energy sources. Energy 2018, 158, 632–655. [Google Scholar] [CrossRef]
- Guilbert, D.; Collura, S.; Scipioni, A. DC/DC converter topologies for electrolyzers: State-of-the-art and remaining key issues. Int. J. Hydrogen Energy 2017, 42, 23966–23985. [Google Scholar] [CrossRef]
- Zhou, T.; Lu, D.; Fakham, H.; Francois, B. Power flow control in different time scales for a wind/hydrogen/super-capacitors based active hybrid power system. In Proceedings of the 13th International Power Electronics and Motion Control Conference, Poznan, Poland, 1–3 September 2008. [Google Scholar]
- Şahin, M.; Okumuş, H.; Aydemir, M. Implementation of an electrolysis system with DC/DC synchronous buck converter. Int. J. Hydrogen Energy 2014, 39, 6802–6812. [Google Scholar] [CrossRef]
- Chandrasekhar, P.; Rama Reddy, S. Performance of soft-switched DC-DC resonant converter for Electrolyzer. In Proceedings of the 4th International Symposium on Resilient Control Systems, Boise, ID, USA, 9–11 August 2011. [Google Scholar]
- Gautam, D.; Bhat, A. A comparison of soft-switched DC-to-DC converters for electrolyzer application. IEEE Trans. Power Electron. 2013, 28, 54–63. [Google Scholar] [CrossRef]
- Alavi, O.; Hooshmand Viki, A.; Tavakoli Bina, M.; Akbari, M. Reliability assessment of a stand-alone wind-hydrogen energy conversion system based on thermal analysis. Int. J. Hydrogen Energy 2017, 42, 14968–14979. [Google Scholar] [CrossRef]
- Zorica, S.; Vukšić, M.; Betti, T. Design considerations of the multi-resonant converter as a constant current source for electrolyser utilisation. Int. J. Electr. Power Energy Syst. 2019, 111, 237–247. [Google Scholar] [CrossRef]
- Albarghot, M.; Rolland, L. Comparison of experimental results with simulation of a PEM Electrolyzer powered by a horizontal wind turbine. In Proceedings of the International Conference of Electrical and Electronic Technologies for Automotive 2017, Torino, Italy, 15–16 June 2017. [Google Scholar]
- Atlam, O. An experimental and modelling study of a photovoltaic/proton-exchange membrane electrolyser system. Int. J. Hydrogen Energy 2009, 34, 6589–6595. [Google Scholar] [CrossRef]
- Atlam, O.; Kolhe, M. Equivalent electrical model for a proton exchange membrane (PEM) electrolyser. Energy Convers. Manag. 2011, 52, 2952–2957. [Google Scholar] [CrossRef]
- Muyeen, S.; Takahashi, R.; Tamura, J. Electrolyzer switching strategy for hydrogen generation from variable speed wind generator. Electr. Power Syst. Res. 2011, 81, 1171–1179. [Google Scholar] [CrossRef]
- Yodwong, B.; Guilbert, D.; Kaewmanee, W.; Phattanasak, M. Energy efficiency based control strategy of a three-level interleaved DC-DC buck converter supplying a proton exchange membrane electrolyzer. Electronics 2019, 8, 933. [Google Scholar] [CrossRef]
- Guilbert, D.; Vitale, G. Dynamic emulation of a pem electrolyzer by time constant based exponential model. Energies 2019, 12, 750. [Google Scholar] [CrossRef]
- Guilbert, D.; Sorbera, D.; Vitale, G. A stacked interleaved DC-DC buck converter for proton exchange membrane electrolyzer applications: Design and experimental validation. Int. J. Hydrogen Energy 2020, 45, 64–79. [Google Scholar] [CrossRef]
- Bessarabov, D.; Wang, H.; Li, H.; Zhao, N. PEM Electrolysis for Hydrogen Production; Taylor & Francis: Abingdon, UK, 2015. [Google Scholar]
- Schalenbach, M.; Carmo, M.; Fritz, D.; Mergel, J.; Stolten, D. Pressurized PEM water electrolysis: Efficiency and gas crossover. Int. J. Hydrogen Energy 2013, 38, 14921–14933. [Google Scholar] [CrossRef]
- Nafion™ Membranes, Dispersions, and Resins Home Page. Available online: https://www.fuelcellstore.com/fuel-cell-components/membranes/nafion (accessed on 28 March 2020).
- Falcão, D.; Pinto, A. A review on PEM Electrolyzer Modelling: Guidelines for beginners. J. Clean. Prod. 2020, 121184. [Google Scholar] [CrossRef]
- Liso, V.; Savoia, G.; Araya, S.S.; Cinti, G.; Kær, S.K. Modelling and experimental analysis of a polymer electrolyte membrane water electrolysis cell at different operating temperatures. Energies 2018, 11, 3273. [Google Scholar] [CrossRef]
- Scheepers, F.; Stähler, M.; Stähler, A.; Rauls, E.; Müller, M.; Carmo, M.; Lehnert, W. Improving the efficiency of PEM electrolyzers through membrane-specific pressure optimization. Energies 2020, 13, 612. [Google Scholar] [CrossRef]
- Millet, P.; Ranjbari, A.; de Guglielmo, F.; Grigoriev, S.; Auprêtre, F. Cell failure mechanisms in PEM water electrolyzers. Int. J. Hydrogen Energy 2012, 37, 17478–17487. [Google Scholar] [CrossRef]
- Shin, D.; Guiver, M.; Lee, Y. Hydrocarbon-based polymer electrolyte membranes: Importance of morphology on ion transport and membrane stability. Chem. Rev. 2017, 117, 4759–4805. [Google Scholar] [CrossRef]
- Vivas, F.; De las Heras, A.; Segura, F.; Andújar, J. A review of energy management strategies for renewable hybrid energy systems with hydrogen backup. Renew. Sustain. Energy Rev. 2018, 82, 126–155. [Google Scholar] [CrossRef]
- Abu-Rub, H.; Malinowski, M.; Al-Haddad, K. Power Electronics for Renewable Energy Systems, Transportation, and Industrial Applications; Wiley-IEEE Press: Hoboken, NJ, USA, 2014. [Google Scholar]
- Blaabjerg, F.; Liserre, M.; Ma, K. Power electronics converters for wind turbine systems. IEEE Trans. Ind. Appl. 2012, 48, 708–719. [Google Scholar] [CrossRef]
- Cirrincione, M.; Pucci, M.; Vitale, G. Growing neural gas (GNG)-based maximum power point tracking for high-performance wind generator with an induction machine. IEEE Trans. Ind. Appl. 2011, 47, 861–872. [Google Scholar] [CrossRef]
- Oliveira, D.; Reis, M.; Silva, C.; Colado Barreto, L.; Antunes, F.; Soares, B. A three-phase high-frequency semicontrolled rectifier for PM WECS. IEEE Trans. Power Electron. 2010, 25, 677–685. [Google Scholar] [CrossRef]
- Teichmann, R.; Bernet, S. A comparison of three-level converters versus two-level converters for low-voltage drives, traction, and utility applications. IEEE Trans. Ind. Appl. 2005, 41, 855–865. [Google Scholar] [CrossRef]
- Data for: Power Quality and Reactive Power of Water Electrolyzers Supplied with Thyristor Converters. Available online: http://dx.doi.org/10.17632/ds64k8jjjy.1#file-95f3fd89-f4d6-4922-816f-9d5e07c0191f (accessed on 23 April 2020).
- Ulleberg, O. Modeling of advanced alkaline electrolyzers: A system simulation approach. Int. J. Hydrogen Energy 2003, 28, 21–33. [Google Scholar] [CrossRef]
- da Costa Lopes, F.; Watanabe, E. Experimental and theoretical development of a PEM electrolyzer model applied to energy storage systems. In Proceedings of the 2009 Brazilian Power Electronics Conference, Bonito, Brazil, 28 September–2 October 2009. [Google Scholar]
- Ayivor, P.; Torres, J.; van der Meijden, M.; van der Pluijm, R.; Stouwie, B. Modelling of large size electrolyzer for electrical grid stability studies in real time digital simulation. In Proceedings of the 3rd International Hybrid Power Systems Workshop, Tenerife, Spain, 8–9 May 2018. [Google Scholar]
- Correa, J.; Farret, F.; Popov, V.; Simoes, M. Sensitivity analysis of the modeling parameters used in simulation of proton exchange membrane fuel cells. IEEE Trans. Energy Convers. 2005, 20, 211–218. [Google Scholar] [CrossRef]
- Ursúa, A.; Marroyo, L.; Gubía, E.; Gandía, L.; Diéguez, P.; Sanchis, P. Influence of the power supply on the energy efficiency of an alkaline water electrolyser. Int. J. Hydrogen Energy 2009, 34, 3221–3233. [Google Scholar] [CrossRef]
- Dobó, Z.; Palotás, Á. Impact of the current fluctuation on the efficiency of Alkaline Water Electrolysis. Int. J. Hydrogen Energy 2017, 42, 5649–5656. [Google Scholar] [CrossRef]


| Parameters | Value | Unit |
|---|---|---|
| Rated electrical power | 400 | W |
| Stack operating voltage | 8 | V |
| Stack current range | 0–50 | A |
| Delivery output pressure | 0.1–10.5 | bar |
| Cells number, N | 3 | - |
| Active area Section | 50 | cm2 |
| Hydrogen flow rate at STP (Standard Temperature and Pressure, 20 °C and 1 bar) | 1 | slpm (standard liter per minute) P = 1 bar, T = 20 °C |
© 2020 by the authors. Licensee MDPI, Basel, Switzerland. This article is an open access article distributed under the terms and conditions of the Creative Commons Attribution (CC BY) license (http://creativecommons.org/licenses/by/4.0/).
Share and Cite
Yodwong, B.; Guilbert, D.; Phattanasak, M.; Kaewmanee, W.; Hinaje, M.; Vitale, G. Proton Exchange Membrane Electrolyzer Modeling for Power Electronics Control: A Short Review. C 2020, 6, 29. https://doi.org/10.3390/c6020029
Yodwong B, Guilbert D, Phattanasak M, Kaewmanee W, Hinaje M, Vitale G. Proton Exchange Membrane Electrolyzer Modeling for Power Electronics Control: A Short Review. C. 2020; 6(2):29. https://doi.org/10.3390/c6020029
Chicago/Turabian StyleYodwong, Burin, Damien Guilbert, Matheepot Phattanasak, Wattana Kaewmanee, Melika Hinaje, and Gianpaolo Vitale. 2020. "Proton Exchange Membrane Electrolyzer Modeling for Power Electronics Control: A Short Review" C 6, no. 2: 29. https://doi.org/10.3390/c6020029
APA StyleYodwong, B., Guilbert, D., Phattanasak, M., Kaewmanee, W., Hinaje, M., & Vitale, G. (2020). Proton Exchange Membrane Electrolyzer Modeling for Power Electronics Control: A Short Review. C, 6(2), 29. https://doi.org/10.3390/c6020029