Abstract
In pursuit of advancing the development of more electric aircraft, the present research explores the forefront capabilities of electro-hydrostatic actuators (EHAs) as potential replacements for conventional hydraulic flight control systems. EHAs are currently used primarily as backup options due to their limited durability. As of now, the high dynamic axial piston pump is the main cause of the limited longevity of the EHA, due to strong tribological wear. The primary objective of this investigation is the identification of parameters and pump behavior to determine the current wear of the pump, as well as providing valuable insights into run-ins, temperature dependencies, and wear-related efficiency losses for future pump improvements. In the scope of this paper, the design of EHAs is explained in detail and the impact of challenging working conditions on the health status of the pump by comprehensive analysis of load-holding modes is examined. The experimental data for analysis is conducted on a longevity test bench with test profiles specifically designed to simulate real-world operational scenarios.
1. Introduction
Similar to the evolution of automotive steering, which transitioned from multiple interconnected hardware components to steer-by-wire systems, the aviation industry is currently exploring the advancement of decentralized actuation options for flight control systems. In the majority of present aircraft, a centralized hydraulic control system is utilized. This system involves the installation of multiple bulky, noisy, and heavy axial piston pumps in the aircraft’s fuselage to ensure redundancy in case of a pump failure (see Figure 1).
Similarly, redundant pipelines run from these pumps to actuators in ailerons, rudders, and elevators. While this architecture meets safety requirements, it also has drawbacks such as a heavy weight and complexity that require qualified maintenance personnel. Moreover, the use of flame-inhibiting, highly hazardous hydraulic oils increases the risk of physical harm to maintenance staff, but they are necessary to mitigate safety risks during operation. In aviation, valve-actuated pressure-constant hydraulic systems are favored for their excellent dynamic performance and robust characteristics [1]. These systems employ a variable delivery pump, which can provide the necessary pressure and volume flow for various operation modes, supplemented by accumulators to handle peak operational demands. Despite meeting all control requirements, pressure-constant hydraulic system architectures face the downside of inherent inefficiency [2]. Additionally, the necessity to maintain substantial power reserves in case of emergencies further exacerbates their inefficiency.
Electro-hydrostatic actuators (EHAs) offer significant advantages over conventional flight control systems and are the preferred choice for aircraft applications due to their reduced likelihood of jamming, wearing, or overloading, in comparison to electro-mechanical actuators.

Figure 1.
Conventional hydraulic flight control topology [3].
Figure 1.
Conventional hydraulic flight control topology [3].

In the aforementioned design, each actuator is individually driven by a high-power-density permanent magnet synchronous motor, which is paired with a small fixed displacement bi-directional axial piston pump [4]. Although there are other configuration options available, such as a variable electric motor and variable pump setup, this specific design offers advantages like simplicity, reduced weight, lower energy consumption, and significantly less heat production. A comprehensive overview of the pros and cons of different designs can be found in references [5,6,7]. The control unit receives control commands through electric signals and translates them into power inputs for the electric motor. The volume flow and pressure build-up are regulated by varying the rotational speed of the electric motor and hydraulic pump.
To enable both the extension and retraction movements of the actuator while keeping the design and number of components in the EHA minimal, a bi-directional pump is employed. This eliminates the need for additional valves to control the fluid flow direction. However, pressure relief valves are incorporated to safeguard the hydraulic circuit against overload. The decentralized and encapsulated design (Figure 2) offers the advantage of allowing placement within the wings and brings specific benefits to the system.
The independence of each EHA increases safety and redundancy by allowing two units to be located in close proximity within the wing and to work in parallel. EHAs require less power, leading to an overall improvement in the aircraft’s efficiency. Additionally, eliminating redundant centralized pumps, pipes, and filters reduces weight, which can lower fuel consumption or increase the aircraft’s load capacity, leading to a more effective utilization of fossil fuels. Compared to the conventional centralized hydraulic pump system, the likelihood of errors related to the distribution of pressurized oil in the hydraulic circuit due to human errors or component failures is significantly reduced by the deployment of isolated EHAs. This is because control signals are transferred through wires instead of additional hydraulic pipes, and the likelihood of a bus failure is 100 times lower than that of a hydraulic circuit failure [8]. Furthermore, the smaller size of EHAs results in a reduced volume of hazardous fluid, leading to cost savings and lowering the risk of fire and hydraulic leaks. Additionally, the possibility of harm to the maintenance personnel due to contact with the hazardous oil can be eliminated as the entire EHA can be dismounted and replaced without opening the hydraulic circuit. The current utilization of EHAs solely as backup systems is primarily due to their limited lifespan when compared to traditional hydraulic control systems. The majority of EHA failures can be attributed to significant wear of hydraulic components.

Figure 2.
Comparison of installed aileron EHA (left) and conventional hydraulic actuator (right) [9].
Figure 2.
Comparison of installed aileron EHA (left) and conventional hydraulic actuator (right) [9].

In the scope of this paper, Section 2 presents related work and the state of the art. This includes operation conditions responsible for the wear occurrences and the different forms of tribological wear relevant to axial piston pumps. Section 3 introduces the test bench and gives a detailed look into the test profiles, which aim to represent real-world applications. Lastly, the results of the investigations are presented and insights gained from analyzing load-holding modes and their correlation to the degradation of the health status of the axial piston pump are discussed.
This paper was originally published in the Proceedings of the 2022 IEEE Global Fluid Power Society PhD Symposium and is now extended with novel implementations and results.
2. Related Work and State of the Art
Before delving into details of different forms of possible tribological wear in axial piston pumps, it is helpful to first obtain an understanding of the wear causes. For this, in the next subsection, the general design of an axial piston pump is explained followed by the operating conditions of EHAs in aviation application.
2.1. Pump Design
To gain insight into the challenging operational conditions and reasons for wear occurrences, it is helpful to examine the general design of an axial piston pump. In Figure 3, a schematic representation of an axial piston pump is shown, comprising components such as the cylinder block, slipper, piston, swash plate, and valve plate. During operation, the swash plate and the valve plate remain stationary. The pistons perform a linear motion within the bores of the rotating cylinder block. Connected to the pistons, the slippers are pressed against the swash plate. These slippers play a crucial role in increasing the load capacity by distributing the load and creating a partial hydrostatic relief. In addition to the pressure forces within the cylinder chambers, a spring is installed between the axis and the cylinder block. This spring ensures constant pressure between the cylinder block and the valve plate, effectively minimizing internal leakage by maintaining a separation between the suction and high-pressure ports. The interaction between the mentioned components will be discussed in more detail in the wear subsection.
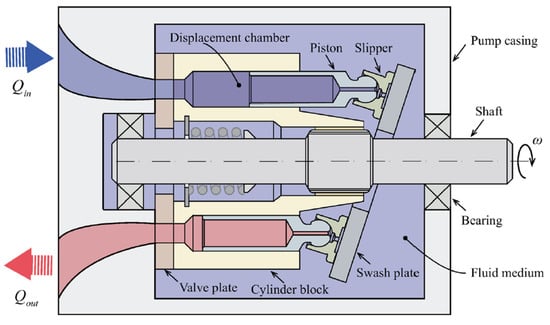
Figure 3.
Schematic of a fixed-angle axial piston pump. Adapted from [10].
In the vast majority of axial piston pump designs, the pumps are constructed to run at constant speeds below a certain maximum and above the threshold of mixed friction. This ensures one ideal working point in which little to no wear is present. To vary the volume flow of the pump, the swash plate angle is adjustable. Increasing the angle results in greater piston travel in the cylinder block, and thus, larger displacement. At identical speeds, a higher displacement correlates to higher volume flow output; vice versa, decreasing the swash plate angle causes a decrease in volume flow output. While this design has significant advantages in terms of longevity and robustness, the overall footprint of a variable displacement piston pump is larger due to the control actuator mechanism responsible for the angle alteration [11]. The design of the pumps used in EHAs aims for the smallest footprint possible to accommodate the lack of placement space and to save weight. Hence, a fixed displacement pump is selected. Here, the volume flow is altered by rotational speed changes. Since the technical challenges of varying the swash plate angle are easier than adjusting the rotational speed, high-performance E-motors are needed to reach similar hydraulic performance. This inherently presents another challenge. To meet space requirements, the motors need to be as small as possible as well. Yet, this contradicts the technological law that states that more torque requires larger rotor/stator combinations. An alternative route is to increase the rotational speeds. To fulfill reaction responsiveness, this solution requires high acceleration capabilities. For this, the inertia, and thus mass, of the rotor, shaft, cylinder block, and pistons need to be minimal. Taking into account all these listed requirements results in miniature axial piston pumps of below 1 cm3 displacement and rotational speeds above 10,000 rpm. Additionally, the movement of the control surfaces by a hydraulic piston induces the need for a bi-directional operation of the pumps to minimize the number of hydraulic components.
2.2. Operation Condition
The general flight of a cargo or passenger aircraft can be divided into three sections. During start and landing, the flight control actuators need to deploy high forces, thus high pressure levels are necessary. Similarly, high pressures combined with high flow rates are needed to handle turbulent conditions. However, these demanding conditions represent only a small portion of the entire air travel experience. During quasi-static flight states, the flight control system primarily operates under load-holding conditions, where the control surfaces experience minor position changes. For instance, in the case of an aileron during the cruise state, Shi et al. found that approximately 71% of all deflections of the aileron occurred within a range of 2% of the maximum deflection [12]. Further operational cycles and flight control behavior can be explored in greater detail in [13].
In the case of an EHA or an axial piston pump in general, load-holding states are not ideal as the rotational speeds are minimal to uphold the low actuator loads. The occurring volume flow can be traced back to internal and external leakage. In this state, the hydrodynamic lubrication film between tribological contact surfaces diminishes. Combined with the still high forces on the components, the lubrication gap decreases to the point of solid friction of the contact pairings. The low volume flow due to the slow rotational speeds during load-holding adds a further disadvantage to the operation state as the minimal fluid flow within the EHA leads to a reduced cooling capacity. Commonly, the fluid flow aids in transporting of heat away from its source. During load holding, the restricted flow limits effective cooling. Furthermore, when the pump operates in a bi-directional manner, it encounters frequent zero-crossings, causing the relative rotational speed to drop to zero. Consequently, the lubrication film between components, such as the swash plate, slippers, cylinder block, and valve plate, reduces to the point of contact during these instances.
2.3. Wear
The operation conditions have a notable impact on various component surfaces within the EHA, leading to a reduction in the functionality of the pump. Among these effects, wear is particularly prevalent in EHA piston pumps. Overheating, oil contamination, and cavitation are also significant factors contributing to the deterioration of the pump. A comprehensive understanding of all the known influences on the EHA pump is provided in reference [14].
2.3.1. Friction
In general, the design of contact pairs within hydraulic systems aims to facilitate the presence of a lubrication film that prevents detrimental solid contact. However, in real-world applications, the occurrence of force and load spikes raises the probability of encountering mixed and solid friction. While intentional in the context of run-ins for axial piston pumps to eliminate manufacturing deviations, this phenomenon leads to the degradation of functional surfaces within contact pairs during normal operation.
In Figure 3, three major friction areas can be identified, resulting from the relative rotational motion between the valve plate and cylinder block, as well as the slipper and swash plate. Additionally, the linear movement of the pistons within the cylinder block can also cause friction [15], although previous investigations at Liebherr Aerospace (LLI) have shown no significant wear in this area [16]. In contrast, the contact pairings between the slippers and swash display significant wear on the metallic sealing lands of the slipper due to solid friction (Figure 4). This wear can be a common cause of function loss in the EHA, as it impacts the performance and functionality of the system. While the surfaces between the cylinder block and valve plate may show some deterioration, no significant functional losses of the EHA have been traced back to this contact pairing. Further details on the linear movement of pistons within the cylinder block can be found in references [13,17,18], but it is not the primary focus of this paper. Instead, the main attention is directed towards understanding and addressing the issues related to the contact pairing of slippers and swash plate, which can have a significant impact on the overall performance and longevity of the EHA.
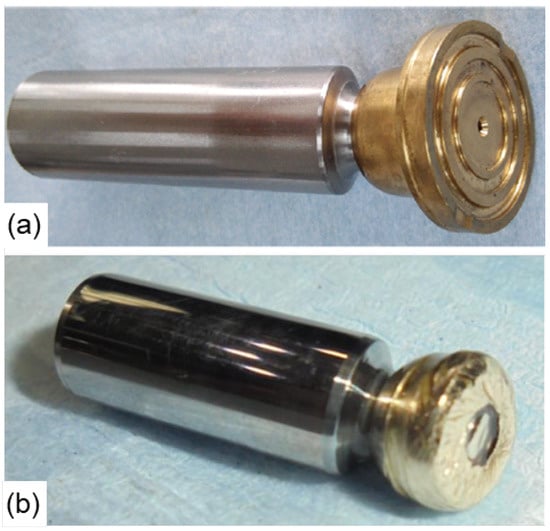
Figure 4.
(a) Factory state and (b) worn down piston [13,16].
The geometry design of the sealing lands is a critical factor for the proper functioning of the pump. A small amount of fluid flows through a bore in the slipper and piston, creating pressure between the slipper and swash plate. This pressure build-up enables the formation of a fluid film that separates the surfaces, drastically reducing wear. The outer lands in the slipper serve as controls to ensure a uniform fluid film on all sides and prevent tilting of the slipper. However, in the case of degradation (as shown in Figure 4b), the lands become worn down. As a result, a correct pressure field can no longer be maintained, leading to further wear and reduced efficiency of the pump.
2.3.2. Overheating
The encapsulated design of EHAs poses a significant disadvantage concerning heat dissipation compared to conventional hydraulic control systems. In conventional systems, the fluid is used to transport heat away from its source, effectively dissipating it. However, in EHAs, the encapsulated architecture combined with the small oil volume restricts the cooling capabilities of the system. As a consequence, additional cooling surfaces need to be incorporated to mitigate the heat build-up. When the temperature increases, the viscosity of the fluid decreases, leading to reduced load-carrying capacities of the lubrication interfaces. This decrease in viscosity also contributes to higher levels of internal leakage and cavitation within the system [19,20,21]. Rising component temperatures can cause thermal deformations, altering the gap heights between various components. An increased gap height, in turn, can lead to increased leakage or friction, further impacting the overall performance and efficiency of the EHA system.
2.3.3. Oil Contamination
Component wear, improper installation and maintenance practices, or unsealed ports can introduce foreign particles into hydraulic circuits. Among these particles, metallic wear particles of varying sizes are particularly problematic as they can travel throughout the entire system and cause significant damage [22,23]. Filter elements play a crucial role in preventing damage caused by foreign particles, but it is important to note that they can only prevent damage from particles that actually pass through the filter. Prior to reaching the filter, particles can already lead to severe damage within the system. In general, smaller particles are typically less harmful than larger ones, but they can still cause issues. Larger particles can result in deep scratches on functional surfaces or block pressure relief bores in pistons and pressure relief valves.
2.3.4. Cavitation
Cavitation refers to the phenomenon where gaseous or vaporous cavities are dynamically formed in a liquid due to rapid pressure drops [24]. The severity of the pressure drop determines the type of cavitation. When the pressure drops below the saturation level of the liquid, gaseous cavitation occurs, leading to the generation of air bubbles. If the pressure drops even further, the fluid itself starts to vaporize, resulting in the formation of vapor bubbles. However, since the difference between the saturation pressure and the vaporization pressure is significant, most instances of cavitation are associated with the formation of air bubbles [25]. Damage to hydraulic components can occur when these air bubbles travel to areas of high pressure within the system. At this point, the air bubbles collapse, generating pressure ripples strong enough to cause erosion and damage to the component surfaces.
When considering high-speed axial piston pumps used in EHAs, with rotational speeds of up to 15,000 rpm and rapid acceleration phases, four distinct areas are susceptible to cavitation. These areas can be explained in the order of their occurrence during one rotation, starting with the overlay of the piston chamber of a fully retracted piston with the inlet. In this first area, the remaining oil in the chamber is still at the outlet pressure, which is higher than the inlet pressure. As a result, there is a short backflow of oil to the inlet, leading to a significant pressure drop [26]. The second area is encountered when the extracting piston draws oil into the chamber. Due to the extremely high speeds involved, a high flow rate is required to fill the void, causing another pronounced pressure drop at the inlet and creating conditions favorable for cavitation [24]. The third area is the overlay of the outlet and piston chamber. Initially, the pressure at the outlet is higher than in the piston chamber since the piston has not reached its fully retracted position. As a result, oil flows from the outlet into the chamber, creating a jet flow that causes a pressure drop at the outer edge of the chamber [27]. Finally, the high rotational speeds generate strong centrifugal forces within the chambers of the cylinder block. These forces push denser fluid to the outer regions while leaving lighter fluid in the center, resulting in a pressure gradient [27]. The phenomenon of cavitation in EHAs cannot be neglected due to their significantly higher rotational speeds compared to more common axial piston pumps used in mobile or industrial applications.
Cavitation can negatively impact the efficiency of the pump, especially when operating at speeds close to the maximum limit. During high-speed rotation, the formation of air bubbles can hinder the delivery of oil into the chamber, leading to an underutilization of the compression volume and reduced volumetric efficiency [28]. This inefficiency can lead to energy losses and reduced overall performance of the EHA. Moreover, the collapsing of air bubbles generates noise and vibrations within the system, which can contribute to additional wear and damage to components. To protect against cavitation, EHAs are equipped with gas-charged accumulators that ensure a predefined minimal pressure on the inlet side. While the pressure drop at the inlet cannot be entirely prevented, by increasing the initial pressure level, the drops do not reach the threshold for gaseous formation.
3. Materials and Methods
To achieve durability requirements for front-line applications in modern aviation, the axial piston pump robustness needs to be improved. Liebherr Aerospace developed a test bench to test out different scenarios to identify harmful operation conditions and wear, as well as adjusted pump designs, materials, and working fluids. The test bench will be presented first, followed by test cycles representing real-world behavior developed at ifas.
3.1. Test Bench
Figure 5 shows the test bench used for evaluating the axial piston pump’s performance and durability. The unit under testing (UUT), which is the bi-directional piston pump, is connected to a high dynamic electric motor through a magnetic clutch and shaft. This arrangement replicates the geometry of an EHA accurately. To simulate the applied load, a proportional pressure control valve is utilized. The pressurized oil can flow in either direction through mirrored pneumatic actuated ball valves and check valves before reaching the control valve. The flow of oil is then directed through a 5 µm filter before proceeding to the current low-pressure side of the system.
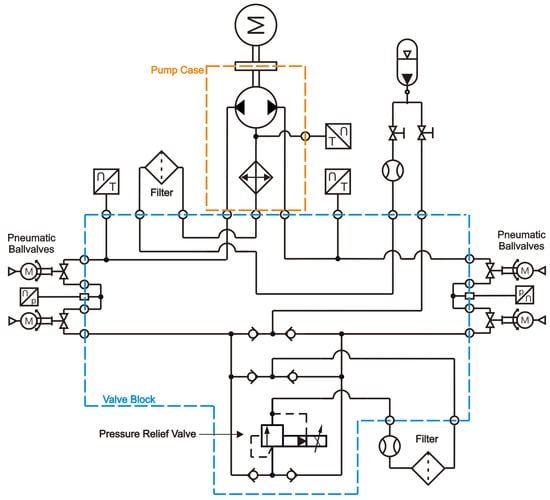
Figure 5.
Layout of the durability test bench.
The test bench also includes a second drain filter and a gas-charged accumulator, and cooling channels. The cooling channels are located in the pump casing. An external control unit manages the electric motor, while multiple sensors monitor pressure, temperature, and volume flow during each test run.
With this experimental setup, it is feasible to expose the pump to loads comparable to those of the front-line operation of an EHA.
3.2. Test Cycles
Based on the insights from an LLI test [16], ifas defined three test cycles (Figure 6) to closely resemble real-world application conditions and evaluate the pump’s robustness under mixed friction, high speed, and acceleration scenarios. All three test cycles are performed consecutively, with predefined runtimes based on their occurrence frequency in real-world applications. Each test cycle comprises three speed profiles and three pressure stages, providing a comprehensive assessment of the pump’s performance under varying conditions. Before each test cycle, the oil is cooled down to 13 °C. Sensor signals are recorded at all times. Yet, only data of steady temperature levels are used for analysis. Data of the warming phases are not taken into account. After each completed test cycle, the test bench was disassembled, and the components of the pump were examined using 3D laser profilometry [29]. In total, mixed friction, high speed, and acceleration each were run three times.
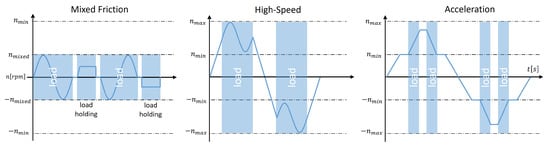
Figure 6.
Test profiles.
As previously mentioned, during the most common operation, the actuator experiences minimal movement and is primarily engaged in correcting small displacements in both positive and negative directions. To represent this behavior accurately, the mixed-friction profile is designed as a sine course around zero with low rotational speeds and load-holding states. In both the sine profile and load-holding states, the same effect of an undeveloped hydrodynamic compensation, leading to solid contact, is present.
The high-speed profile is designed to simulate critical rotational speeds that can lead to wear issues caused by unstable movements, such as tipping of the cylinder block and slippers. These unstable movements are attributed to the influence of centrifugal forces, which can result in larger gaps between contact pairs on one side and more solid contact on the opposite side [30]. Furthermore, higher speeds increase the likelihood of cavitation occurrences. Similar to the mixed-friction profile, the high-speed profile also uses a sine curve with high positive and negative rotational speeds above a minimal threshold. During the changes in direction in this profile, the load is lowered to a minimum to ensure that other factors do not have a significant impact.
The acceleration profile is designed to replicate sudden changes in the control signal that can occur during turbulent conditions. This profile comprises short accelerations from above mixed friction to high speeds. Similar to the previous profiles, the load during changes in direction is kept to a minimum to isolate the effect of acceleration and assess its impact on the pump’s performance.
4. Results
4.1. Load-Holding States Analysis
The main focus of this paper is to identify wear progression by analyzing the load-holding states of the pump. During load-holding states, the rotational speed of the pump decreases to a complete halt, and one of the pneumatic ball valves is closed depending on the rotation direction. The speed of the pump is then increased linearly until the pressure reaches a predefined level of 200 bar, at which point the second pneumatic ball valve closes to measure the leakage of the first valve. Figure 7 illustrates this process for four possible schematic courses for different states of deterioration. In the top graph, the slow increase in rotational speed from zero is depicted. The bottom graph shows the simultaneous pressure build-up between the pump and the pneumatically actuated ball valve. The higher the pump’s wear the higher the speed ramp, and thus, the longer it takes for the pump to achieve the aimed for pressure level of 200 bar.
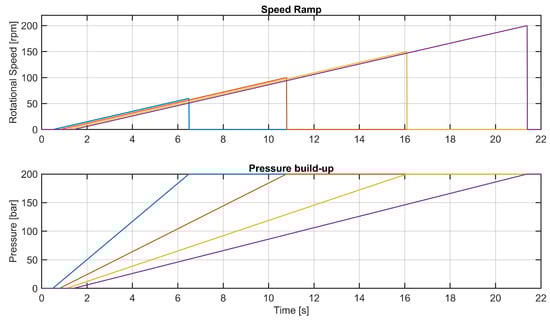
Figure 7.
Schematic speed ramp (top) and pressure build up (bottom) of load-holding states in four stages of deterioration, from left (pump functional) to right (pump worn down).
The load-holding procedure is conducted after approximately 270 sine cycles have been completed. In total, over 3700 load-holding measurements were recorded. To present the findings in a consistent and organized manner, four measurement segments are selected (Figure 8). Each measurement segment comprises 60 load-holding recordings. These recordings are carefully chosen to ensure consistency and reliability in the data. The outliers in Figure 8 (e.g., cycles 800–900) represent faulty behaviors of the cooling which resulted in manual restarts of the test bench. The findings from each of these four measurement segments are presented in Figure 9a,b, allowing for a clear and concise presentation of the results.
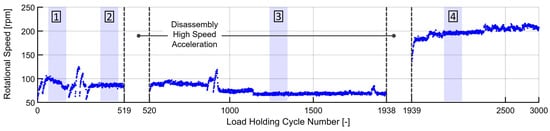
Figure 8.
Maximum rotational speeds for all load-holding states.
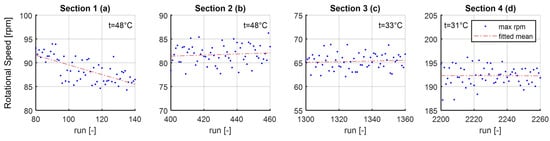
Figure 9.
Maximal rotational speeds for each segment’s load-holding states at steady temperatures. The subfigures represent the four highlighted segments of Figure 8. Each blue point represents one load-holding measurement.
At the beginning of the tests, the pump was in a factory-new condition and had only undergone run-in procedures specified by the manufacturer. The initial load-holding measurements show an increasing trend in the maximum rotational speed, reaching around 95 rpm (Figure 8, Segment 1). However, as Segment 1 progresses, the maximum rotational speed starts to decline continuously, eventually stabilizing at around 85 rpm. Throughout this segment, the fluid temperature remains constant at 48 °C, allowing for valuable observations. The decline in rotational speed offers initial insights into the pump’s behavior. The constant oil temperature and zero leakage over the ball valve suggest that the viscosity of the hydraulic fluid remains constant. Consequently, the differences observed in rotational speed can be attributed to material changes in the components of the pump. Lower rotational speeds required to achieve the same pressure build-up indicate a reduction in internal and external leakage, leading to an improvement in volumetric efficiency. This improvement is attributed to the reduction in manufacturing deviations in the pump’s functional interfaces.
Segment 3 of Figure 8 was chosen to illustrate the impact of temperature changes on the maximum rotational speeds required to reach the specified pressure level. In Figure 9b, the measurements show rotational speeds of around 82 rpm at fluid temperatures just below 48 °C, while Figure 9c displays measurements taken at a temperature of 33 °C. To ensure the validity of the results, a comparison of the wear levels of the pump’s components before both segments was conducted using 3D profilometry. The analysis revealed negligible differences in wear, ruling out any impact on the pressure build-up due to changes in the pump’s functional interfaces. Therefore, the observed differences in maximum rotational speed can be attributed solely to viscosity changes in the hydraulic fluid caused by the temperature variations.
In Segment 4 of Figure 8, additional load-holding measurements were conducted after high-speed and acceleration test runs, which represent 30% of all expected high-speed and acceleration instances during the pump’s lifespan. The mean temperature of these measurements is similar to the mean temperature of Segment 3 with 31 °C versus 33 °C. To compare the findings of Segments 3 and 4, Figure 10 is used to demonstrate the differences. Both figures present five courses of the rotational speed ramp and the simultaneous pressure build-up for Segments 3 and 4. It is observed that the pressure build-up in Segment 3 is significantly faster, requiring a shorter speed ramp to achieve the desired pressure limit of 200 bar. In contrast, the pressure build-up in Segment 4 is much slower, necessitating a higher speed ramp. To isolate the impact of wear and exclude other factors, such as viscosity and leakage, further investigations were conducted. Given that the temperatures in Segments 3 and 4 are similar, the viscosity can be assumed to be constant. Additionally, leakage tests of the ball valve and inspections of external oil flow measurements did not reveal significant increases in external leakage or leakages over the ball valves.
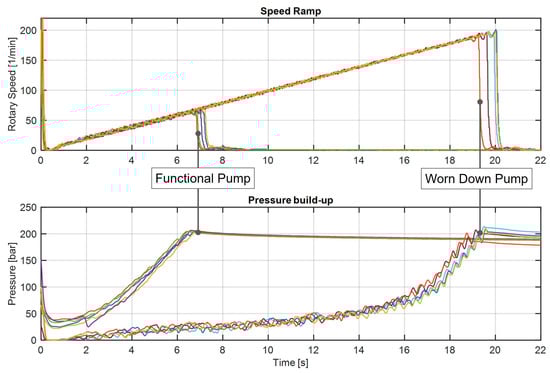
Figure 10.
Speed ramp (top) and pressure build-up (bottom) of load-holding states: 10 measurements of segment 3 and 10 measurements of segment 4.
Hence, the higher rotational speeds needed to achieve the threshold of 200 bar and the corresponding additional oil can be attributed to internal leakage, a clear indicator of a strongly deteriorated pump. For a more visible comparison, Figure 10 contrasts ten measurements of Segment 3 with ten measurements of Segment 4.
When analyzing Figure 10, a clear difference in the pressure build-up course is visible. The pump in its deteriorated state takes about three times as long as in its functional state to achieve the threshold of 200 bar. Interestingly, strong fluctuations are also noticeable in the pressure signal. While the increased time for the pressure build-up can be linked to the overall wear of the pump, the fluctuations need to be further investigated. Three possible explanations for this phenomenon include:
- An increase in gap height between the cylinder block and valve plate;
- A shift in the changeover point;
- Blockage or leakage of one or more pistons.
An increase in the gap height between the valve plate and cylinder block leads to a higher oil flow from the outlet to the inlet, which can result from wear between the contact pairs. Deviations from the mean pressure value can indicate a shift in the changeover point between the cylinder block and the valve plate. This shift, caused by increased gaps in the mounting part of the valve plate, causes the overlay of the chamber and outlet to occur earlier, leading to higher backflow. Similarly, the overlay of the chamber and inlet occurs earlier, resulting in additional backflow towards the low-pressure side [31]. A blockage or leakage due to a malfunctioning piston will similarly cause oil from the outlet to flow back into the piston chamber, and thus, momentarily result in a pressure drop as well as account for a backflow at the inlet combined with a pressure spike. As a result of these factors, the maximum potential of the pumps is not fully utilized and the efficiency is sub-optimal.
To determine which of the aforementioned three possible causes is responsible for the pressure ripples, a closer examination of the trends in rotational speed, power, and pressure build-up is necessary. In Figure 11, two load-holding operations are compared in more detail. In the first load-holding range, the pump shows no signs of wear (measurement 1300), whereas in the second range, wear is evident (measurement 2300). Between these load-holding operations, the pump was disassembled multiple times, and the high-speed and acceleration profiles were run.
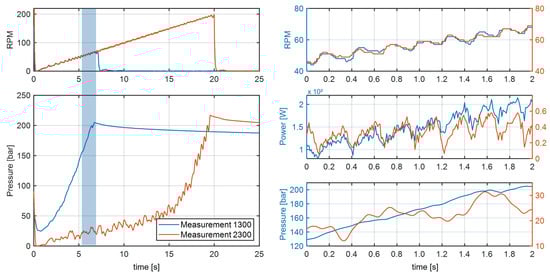
Figure 11.
Comparison of speed, pressure, and power of load-holding measurement functional (1300) and worn down pump (2300).
To facilitate comparison, both measurements focused on the same rotational speed ranges. As seen in the upper-right section of the figure, the rotational speeds are closely matched, ensuring a constant and non-deviating test profile. The comparison of power in this range also exhibits a qualitatively similar trend. However, since the pressures at these rotational speeds are significantly higher in the unworn condition, higher torques are also expected, which can account for the discrepancies in power values. Therefore, only a qualitative, not a quantitative comparison is feasible.
The lower-right graph in the figure illustrates the pressure build-up for both measurements. It is evident that the pressure at the pump outlet builds up more linearly and consistently in good condition. In contrast, the pressure build-up in the second measurement (2300) is notably more inconsistent with significant fluctuations. By further analyzing the data, a pattern can be identified. After a momentary pressure build-up between 0.4 and 0.5 s, the pressure does not continue to rise but even slightly decreases from 0.5 to 1.3 s, which suggests a higher backflow from the pressure outlet. Internal leakage is not visible at that point as the pressure at the inlet does not increase substantially. Subsequently, the pressure rapidly builds up again.
While the occurrence of a twisted valve plate is still a possibility, the level of pressure drops and increases contradicts this hypothesis. Additionally, for the present fluctuation in the pressure signal to be attributed to a twisted valve plate, the plate would need to rotate back periodically, which is unlikely since the rotation direction does not change over one load-holding test. In the case of the increased gap between the cylinder block and the valve plate at a high level, a continuous internal leakage would be the result. The pressure signal would show a similar overall pattern, but without the pressure drops and peaks. Although this cannot be ruled out, it does not explain the pressure variation. Therefore, the malfunction of one or more pistons is likely to be the root of the oscillating pressure and will be discussed in more detail in the following subsection.
4.2. Pressure Ripple Investigation
Deriving a conclusion about the pressure ripples visible in the signal in case of a damaged pump is not possible in the time domain. Therefore, a translation into the frequency domain is necessary. Figure 12 (top) displays the result of a fast Fourier transformation (FFT) of both pressure build-ups 1300 and 2300. The fast Fourier transformation is an algorithm that allows for an efficient calculation of the discrete Fourier transformation (DFT) [32]. In the case of the pressure signal, it is used to decompose a digital signal into its frequency components for later analysis. Due to the increasing rotational speed of the pump, no clear separation between both frequency spectra is noticeable. Similarly, the calculation of the power spectral density via the Welch method (Figure 12, bottom) does not differentiate both conditions clearly. The method is a viable analysis technique, as it improves the accuracy of the FFT analysis by dividing the signal into overlapping segments. For each segment, individual FFTs are computed. By averaging the resulting FFTs, signal noise is reduced, which is known to be useful for signals with non-stationary characteristics [33].
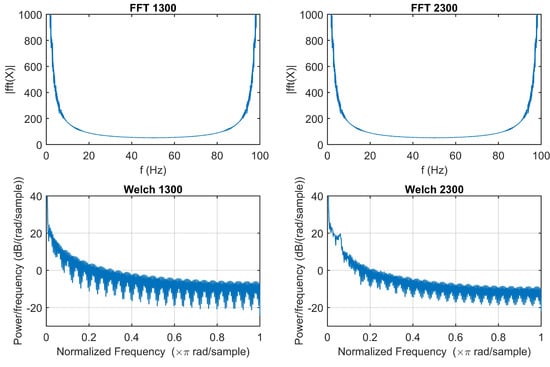
Figure 12.
Fast Fourier transformation (top) and Welch’s spectral density estimation (bottom) of load-holding states 1300 and 2300.
Going one step further, order spectrum analysis offers the option to investigate the signal decoupled from varying rotational speeds. Order analysis involves the dynamic resampling of time data based on a rotational signal. This resampling, known as order tracking, converts time data into the angle domain, resulting in equally spaced samples relative to the machine’s rotational angle. Subsequently, the data are divided into FFT angle blocks, transformed into the order domain via FFT, and phase-aligned for averaging. Similar to the Welch method, this averaging helps to reduce random noise while preserving rotational characteristics, resulting in averaged complex order spectra as the output of the analysis. Figure 13 displays the order spectra for the same ten load-holding states displayed in Figure 10. Again, there are five measurements each of the functional (top) and the deteriorated (bottom) pump.
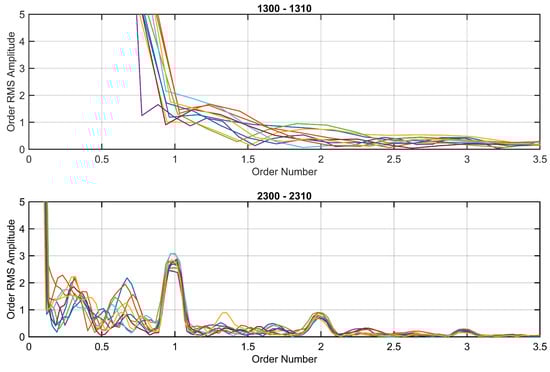
Figure 13.
Order spectra of load-holding states for functional (top, runs 1300−1310) and worn pump (bottom, runs 2300−2310).
The order spectra enable an easy separation between good and damaged states. For the functional pump, no apparent peaks of any order are visible, whereas a peak at the first order in the damaged pumps is clearly detectable. This represents a fault in one of the seven pistons, which supports hypothesis three presented earlier. Still, since more peaks at order two and three are also recognizable, possible degradation of more than one piston is probable. Nonetheless, it was possible to derive a viable solution for the cause of the pressure fluctuation.
4.3. Progressive Deterioration
Lastly, the continuous degradation of the pump after initial wear is worth mentioning. Analysis of the last 700 load-holding measurements after the high-speed and acceleration tests reveals a continuous incline in the rotational speed (Figure 14). This finding suggests that the high-speed and acceleration tests not only cause harm to the pump interfaces, leading to increased internal leakage, but they also enable subsequent wear during mixed-friction operation. As a result, the deterioration of the pump is further accelerated. The observed continuous increase in rotational speed indicates that the wear and damage caused by the high-speed and acceleration tests have long-term effects on the pump’s performance during mixed-friction operation.
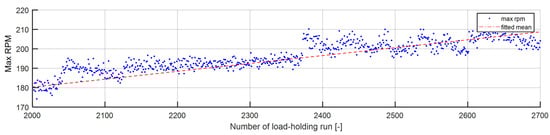
Figure 14.
Visualization of pump degradation by continuously increasing maximum rpm of load-holding states.
5. Discussion
Overall, analyzing the load-holding states presents a straightforward possibility to detect the health status of the tested high dynamic piston pump developed for application in primary flight actuation. Through the analysis of load-holding states, valuable insights into run-in processes, temperature dependencies, and wear impacts were obtained. The measurements revealed an additional run-in process beyond the initial predefined run-ins, along with an increase in internal leakage associated with rising fluid temperatures. Notably, after high rotational speed and acceleration tests, a significant increase in internal leakage and a decline in efficiency were detected. Subsequent load-holding tests also showed a continuous increase in internal leakage, indicating accelerated wear progression following initial wear occurrences. Lastly, unexpected fluctuation in the pressure signal during load-holding tests in a deteriorated state required a closer look to determine the root cause. Analysis of pressure signals in the frequency domain (FFT and Welch) resulted in no major additional information gain. Yet, order spectrum analysis provided the necessary information to identify the reason behind the increased pressure ripples. Due to a peak in the first order, a valid inference could be drawn regarding a malfunctioning piston. This would result in backflow at the high-pressure outlet as well as pressure spikes, which were present at all pressure measurements after initial wear occurred. Still, other influences, like the presented twisted valve plate and an increased gap height between valve plate and piston barrel, cannot be neglected when explaining the pressure build-up in a deteriorated state. While these appearances do not cause fluctuations on the same scale as a malfunctioning piston, they do increase internal leakage and will result in slower pressure build-up, resulting in an overall decrease in efficiency.
To ensure the reliability of the presented findings, the contact pairs were additionally analyzed visually. After each test, the pump was disassembled, and all contact surfaces were examined with a 3D laser profilometer. A detailed visual comparison of these changing scratch patterns on the slipper sealing land post mixed-friction, high-velocity, and acceleration cycles is illustrated in Figure 15. In cycles with low rotational speed, the slipper surfaces become smooth, with minimal visible abrasions and some regions showing no marks. In contrast, in high-velocity and acceleration cycles, the situation alters markedly. The slipper surfaces exhibit a substantial increase in abrasions during high-velocity cycles, leaving no large unmarked areas. This pattern persists in acceleration cycles. Furthermore, during acceleration cycles, the slipper’s outer sealing land develops fine, distinct scratch patterns. Only four images are displayed since the patterns are reoccurring when equal test profiles are run. A more detailed investigation of the scratch patterns can be found in [5]. The conclusions drawn from this visual analysis confirm the ongoing run-in process of the pump. With each start of a new test cycle, the pump is presented with new speed and load characteristics, and thus, has to adapt to these conditions. In the case of the investigated pump, this adaptation results in changes in the surface of the piston slippers. While changes were visible after every test cycle, the changes in the behavior were only marginal. A substantial behavior change became apparent only after running the second high-speed and acceleration profiles. Hence, it can be concluded that the pump was still able to perform as designed until a threshold of surface degradation was reached. After surpassing this threshold, the pump’s functionality declined continuously, as discussed in Section 4.3.
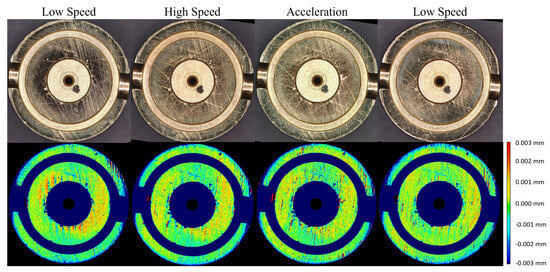
Figure 15.
Visualization of pump degradation by 3D profilometry.
The ongoing tests will continue to investigate the wear progression by analyzing load-holding modes and 3D profilometric images. Additionally, an update to the test bench will facilitate high-frequency measurements of temperature, pressure, and vibration, enabling the development of wear-detection methods independent of specific test profiles via the use of methods of machine learning. The results presented in this paper play an essential role in the use of machine learning methods as they allow for a quantitative assessment of the health status of the tested pumps. This assessment is crucial as it enables the use of supervised learning, linking data from all profiles to specific health states. Finally, in addition to the aforementioned ongoing tests, a thermo-elasto-hydrodynamic lubrication (TEHL) simulation of the contact between the piston slipper and swash plate is being developed to further improve the robustness of the pump by modifying the slipper geometry. The initial simulation will be validated using the findings of this study and the 3D profilometric imagery.
Author Contributions
Conceptualization, Y.D., A.M. and K.S.; methodology, Y.D.; software, Y.D.; validation, Y.D. and A.M.; formal analysis, Y.D.; investigation, Y.D.; resources, Y.D. and A.M.; data curation, Y.D. and A.M.; writing—original draft preparation, Y.D.; writing—review and editing, Y.D. and K.S.; visualization, Y.D.; supervision, K.S.; project administration, K.S. All authors have read and agreed to the published version of the manuscript.
Funding
This research was funded by the German Federal Ministry for Economic Affairs and Climate Actions (BMWK) within the framework concept “LuFo VI” and supervised by the Programme Management Agency for Aviation Research at DLR (registered association, PT-LF).
Institutional Review Board Statement
Not applicable.
Informed Consent Statement
Not applicable.
Data Availability Statement
The datasets generated during and/or analyzed during the current study are available from the corresponding author on reasonable request.
Conflicts of Interest
The authors declare no conflicts of interest.
References
- Moir, I.; Seabridge, A.G. Aircraft Systems: Mechanical, Electrical, and Avionics Subsystems Integration, 3rd ed.; Aerospace Series; Wiley: Chichester, UK; Hoboken, NJ, USA, 2008. [Google Scholar]
- Murrenhoff, H.; Eckstein, L. Fluidtechnik für Mobile Anwendungen: Umdruck zur Vorlesung, 5th ed.; Reihe Fluidtechnik U; Shaker: Aachen, Germany, 2011; Volume 5. [Google Scholar]
- Daniels, B. Technical Drawing. Available online: https://beaudaniels.com/aviation (accessed on 10 February 2021).
- Habibi, S.; Goldenberg, A. Design of a new high-performance electrohydraulic actuator. IEEE/ASME Trans. Mechatronics 2000, 5, 158–164. [Google Scholar] [CrossRef]
- Merkel, A.; Duensing, Y.; Schmitz, K. Electro-hydrostatic Actuators in Primary Flight Control-Lifetime and Reliability. In Proceedings of the 10th International Conference on Fluid Power Transmission and Control, Hangzhou, China, 11–13 April 2021. [Google Scholar]
- Ivantysyn, R.; Weber, J. Investigation of the Thermal Behaviour in the Lubricating Gap of an Axial Piston Pump with Respect to Lifetime. In Proceedings of the 11th IFK 2018, Aachen, Germany, 19–21 March 2018; pp. 68–83. [Google Scholar]
- Pietrzyk, T. Entwicklung Einer Hochdrehzahl-Innenzahnradpumpe für die Elektrifizierung Mobiler Anwendungen am Beispiel einer Autarken Dezentralen Elektro-Hydraulischen Achse-Design of an High Speed Internal Gear Pump for Mobile Applications. Ph.D. Thesis, Rheinisch-Westfälische Technische Hochschule Aachen, Aachen, Germany, 2022. [Google Scholar]
- Roboam, X.; Sareni, B.; Andrade, A. More Electricity in the Air: Toward Optimized Electrical Networks Embedded in More-Electrical Aircraft. IEEE Ind. Electron. Mag. 2012, 6, 6–17. [Google Scholar] [CrossRef]
- Van den Bossche, D. The A380 flight control electrohydrostatic actuators, achievements and lessons learned. In Proceedings of the 25th International Congress of the Aeronautical Sciences, Hamburg, Germany, 3–8 September 2006. [Google Scholar]
- Chao, Q.; Tao, J.; Lei, J.; Wei, X.; Liu, C.; Wang, Y.; Meng, L. Fast scaling approach based on cavitation conditions to estimate the speed limitation for axial piston pump design. Front. Mech. Eng. 2021, 16, 176–185. [Google Scholar] [CrossRef]
- Ivantysyn, J.; Ivantysynova, M. Hydrostatic Pumps and Motors: Principles, Design, Performance, Modelling, Analysis, Control and Testing, 1st ed.; Tech Books International: New Delhi, India, 2003. [Google Scholar]
- Bildstein, M. Application of electro-hydrostatic actuators (EHA) for future aircraft primary flight controls. In Proceedings of the 1st Internationales Fluidtechnisches Kolloquium, Aachen, Germany, 16–18 March 1998. [Google Scholar]
- Shi, C.; Wang, S.; Wang, X.; Zhang, Y. Variable load failure mechanism for high-speed load sensing electro-hydrostatic actuator pump of aircraft. Chin. J. Aeronaut. 2018, 31, 949–964. [Google Scholar] [CrossRef]
- Chao, Q.; Zhang, J.; Xu, B.; Huang, H.; Pan, M. A Review of High-Speed Electro-Hydrostatic Actuator Pumps in Aerospace Applications: Challenges and Solutions. J. Mech. Des. 2018, 141, 050801. [Google Scholar] [CrossRef]
- Gärtner, M. Verlustanalyse am Kolben-Buchse-Kontakt von Axialkolbenpumpen in Schrägscheibenbauweise. Ph.D. Thesis, Rheinisch-Westfälische Technische Hochschule Aachen, Aachen, Germany, 2019. [Google Scholar]
- Röben, T.; Viennet, E.; Wider, H. Robustness of the Liebherr-Aerospace Technology for Future Flight Control Application. In Proceedings of the 12th IFK, Dresden, Germany, 12–14 October 2020. [Google Scholar]
- Manring, N.D.; Mehta, V.S.; Nelson, B.E.; Graf, K.J. Scaling the Speed Limitations for Axial-Piston Swash-Plate Type Hydrostatic Machines. J. Dyn. Syst. Meas. Control. 2014, 136, 031004. [Google Scholar] [CrossRef]
- Wegner, S.; Gels, S.; Jang, D.S.; Murrenhoff, H. Experimental Investigation of the Cylinder Block Movement in an Axial Piston Machine. In Proceedings of the ASME/BATH 2015 Symposium on Fluid, Chicago, IL, USA, 12–14 October 2015. [Google Scholar] [CrossRef]
- Shang, L.; Ivantysynova, M. Port and case flow temperature prediction for axial piston machines. Int. J. Fluid Power 2015, 16, 35–51. [Google Scholar]
- Ivantysyn, R.; Shorbagy, A.; Weber, J. Investigation of the wear behavior of the slipper in an axial piston pump by means of simulation and measurement. In Proceedings of the 12th International Fluid Power Conference, Dresden, Germany, 12–14 October 2020; pp. 315–326. [Google Scholar] [CrossRef]
- Ibuki, T.; Hibi, A.; Ichikawa, T.; Yokote, H. Suction Performance of Axial Piston Pump: 2nd Report, Experimental Results. Bull. JSME 1977, 20, 827–833. [Google Scholar] [CrossRef][Green Version]
- DIN ISO 5884: 2020-11; Luft- und Raumfahrt—Fluidische Systeme und Komponenten-Verfahren zur Probenahme und Bestimmung der festen Verunreinigungen in Hydraulik-Flüssigkeiten (ISO_5884:2018). ISO: Geneva, Switzerland, 2018. [CrossRef]
- Martin, S.; Clémençon, H.; Defren, K.; Manz, R. Filtration, Druckflüssigkeit und Reinheitsgrad in der Fluidtechnik: Einführung in Theorie und Praxis, 2nd ed.; Kontakt & Studium, Expert-Verl.: Renningen, Germany, 2002; Volume 240. [Google Scholar]
- Totten, G.E.; Sun, Y.H.; Bishop, R.J., Jr.; Lin, X. Hydraulic System Cavitation: A Review. SAE Trans. 1998, 107, 368–380. [Google Scholar]
- Schleihs, C.; Viennet, E.; Deeken, M.; Ding, H.; Xia, Y.; Lowry, S.; Murrenhoff, H. 3D-CFD simulation of an axial piston displacement unit. In Proceedings of the 9th International Fluid Power Conference, Aachen, Germany, 24–26 March 2014. [Google Scholar]
- Harris, R.M.; Edge, K.A.; Tilley, D.G. The Suction Dynamics of Positive Displacement Axial Piston Pumps. J. Dyn. Syst. Meas. Control 1994, 116, 281–287. [Google Scholar] [CrossRef]
- Chao, Q.; Zhang, J.; Xu, B.; Chen, Y.; Ge, Y. Spline design for the cylinder block within a high-speed electro-hydrostatic actuator pump of aircraft. Meccanica 2018, 53, 395–411. [Google Scholar] [CrossRef]
- Kunkis, M.; Weber, J. Experimental and Numerical Assessment of an Axial Piston Pump’s Speed Limit. In Proceedings of the BATH/ASME 2016 Symposium on Fluid Power and Motion Control, Bath, UK, 7–9 September 2016; American Society of Mechanical Engineers: New York, NY, USA, 2016; p. 09072016. [Google Scholar] [CrossRef]
- Merkel, P.A.; Duensing, Y.; Schmitz, K. Identification of Wear Progression due to Variating Operation Modes of Small High Dynamic Piston Pumps Used in Frontline Flight Control Application. In Proceedings of the Fluid Power: Digital, Reliable, Sustainable: 13th International Fluid Power Conference, Aachen, Germany, 13–15 June 2022. [Google Scholar] [CrossRef]
- Borghi, M.; Specchia, E.; Zardin, B.; Corradini, E. The Critical Speed of Slipper Bearings in Axial Piston Swash Plate Type Pumps and Motors. In Proceedings of the ASME 2009 Dynamic Systems and Control Conference, Hollywood, CA, USA, 12–14 October 2009. [Google Scholar]
- Hong, H.; Zhao, C.; Zhang, B.; Bai, D.; Yang, H. Flow Ripple Reduction of Axial-Piston Pump by Structure Optimizing of Outlet Triangular Damping Groove. Processes 2020, 8, 1664. [Google Scholar] [CrossRef]
- Cooley, J.W.; Tukey, J.W. An Algorithm for the Machine Calculation of Complex Fourier Series. Math. Comput. 1965, 19, 297. [Google Scholar] [CrossRef]
- Welch, P. The use of fast Fourier transform for the estimation of power spectra: A method based on time averaging over short, modified periodograms. IEEE Trans. Audio Electroacoust. 1967, 15, 70–73. [Google Scholar] [CrossRef]


Disclaimer/Publisher’s Note: The statements, opinions and data contained in all publications are solely those of the individual author(s) and contributor(s) and not of MDPI and/or the editor(s). MDPI and/or the editor(s) disclaim responsibility for any injury to people or property resulting from any ideas, methods, instructions or products referred to in the content. |
© 2024 by the authors. Licensee MDPI, Basel, Switzerland. This article is an open access article distributed under the terms and conditions of the Creative Commons Attribution (CC BY) license (https://creativecommons.org/licenses/by/4.0/).