Article

Volumetric Flow Field inside a Gas Stirred Cylindrical Water Tank

1
Department of Mechanical and Civil Engineering, Purdue University Northwest, Hammond, IN 46323, USA
2
Center for Innovation through Visualization and Simulation, POWERS Building 123 Purdue University Northwest, Hammond, IN 46323, USA
*
Author to whom correspondence should be addressed.
Fluids 2024, 9(1), 11; https://doi.org/10.3390/fluids9010011
Submission received: 27 October 2023 / Revised: 3 December 2023 / Accepted: 6 December 2023 / Published: 28 December 2023
(This article belongs to the Special Issue Flow Visualization: Experiments and Techniques)

Abstract

:
Ladle metallurgy serves as a crucial component of the steelmaking industry, where it plays a pivotal role in manipulating the molten steel to exercise precise control over its composition and properties. Turbulence in ladle metallurgy influences various important aspects of the steelmaking process, including mixing and distribution of additives, alongside the transport and removal of inclusions within the ladle. Consequently, gaining a clear understanding of the stirred flow field holds the potential of optimizing ladle design, improving control strategies, and enhancing the overall efficiency and steel quality. In this project, an advanced Particle-Tracking-Velocimetry system known as “Shake-the-Box” is implemented on a cylindrical water ladle model while compressed air injections through two circular plugs positioned at the bottom of the model are employed to actively stir the flow. To mitigate the particle images distortion caused by the cylindrical plexi-glass walls, the method of refractive matching is utilized with an outer polygon tank filled with a sodium iodide solution. The volumetric flow measurement is achieved on a 6 × 6 × 2 cm domain between the two plugs inside the cylindrical container while the flow rate of gas injection is set from 0.1 to 0.4 L per minute. The volumetric flow field result suggests double gas injection at low flow rate (0.1 L per minute) produce the least disturbed flow while highly disturbed and turbulent flow can be created at higher flow rate of gas injection.

1. Introduction

The global steel industry stands as a cornerstone of modern civilization, serving as the backbone of infrastructure, manufacturing, and technological advancement. The rising demand for high-quality steel products with precise characteristics has prompted ongoing innovations and advancements in steelmaking industry. Secondary steelmaking processes, a vital stage following primary steel production, have emerged as a critical avenue for refining and enhancing steel properties [1]. In particular, the intrinsic part of gas stirring has garnered significant attention in recent years. It entails injecting an inert gas into the molten metal to achieve uniform mixing to facilitate the homogenization of the chemical composition of different alloy elements and the removal of inclusions from the molten steel [2]. The implementation of stirring aids elevates the caliber and purity of the steel, enhancing its mechanical attributes and minimizing defects in the final product. Turbulence, driven by the injection of inert gas, stirs the molten metal vigorously, facilitating efficient mass transfer and promoting uniform distribution of alloying elements. This dynamic mixing action intensifies the interaction between the molten steel and the slag, a process can further amplified by the distinctive depression of the slag eye. This intensified interaction zone becomes a hotspot for chemical reactions, promoting the removal of undesired impurities and inclusions from the steel, which are buoyed to the surface and subsequently removed through slag formation [1,3]. Therefore, the flow turbulence can aids in achieving the desired steel characteristics though the formation of the slag eye, enhances its purity, consistency of mechanical attributes, and overall quality in the final product. Over the past few decades, researchers have extensively studied the slag eye formation under laboratory conditions. And dynamically- scaled water model apparatus have been applied, which involves using water at room temperature instead of molten steel. Water at room temperature has the similar kinetic viscosity to molten steel [4], and thus the properly scaled water ladle apparatus is a suitable physical model to be studied for understanding the related flow process inside steel ladles.
Szekely et al. [5] first proposed a simplified water model to study the flow characteristics of a ladle by injecting gas from the bottom, assuming a constant bubble size, and using Spalding’s k-ω model to solve the Navier-Stokes equations for velocity and turbulence predictions. The model was developed to simulate the thermal and flow behavior of molten steel during the pouring process using a water ladle, offering a simple and effective way to predict the behavior of molten steel during pouring process. Debroy et al. [6] improved Szekely’s model by refining the bubble model and accounting for the effects of turbulence and bubble coalescence. These added terms helped to predict the behavior of bubbles more accurately in the liquid metal and their impact on the mixing and refining of the steel. Johansen et al. [7] furthered the research by discovering that bubbles can create turbulence and affect flow velocity in the bubble plume region thus a bottom injection water model was adapted. Peranandhantan et al. [8] conducted an experiment to study the behavior of the slag eye in a ladle during steelmaking process by injecting air into a ladle filled with water and various fluids to simulate the injection of gas into molten steel. The size and shape of the slag eye were then measured using a high-speed photography and image analysis techniques. Based on their observation from tested multiple variables, including gas flow rate, slag thickness and liquid depth, an empirical expression was derived to formulate the slag eye size in terms of gas flow rate, the ladle dimension, gravity, surface tension, and the momentum of the gas bubbles. Mazumdar et al. [9] reviewed several studies related to the physical modeling and empirical correlation of gas-stirred ladle, highlighting the impact of various variables involved in the gas-stirring process, specifically the plug positions.
Several researchers experimented with changing the plug positions in their water ladle model to achieve a better mixing and wall shear stress distribution [9,10,11]. It is argued that plug design can change the bubble size distribution close to the plug, but not the average size and distribution in the whole ladle [8,12,13,14]. The study conducted by Gajjar et al. [15] delve into the influence of injector design on turbulence within ladle metallurgy processes, investigating how different injector designs affect the level and characteristics of turbulence in the flow. In 2019, Owusu et al. [16] used Particle Image Velocimetry (PIV) to investigate the behavior of bubbles and their effect on turbulence kinetic energy (TKE) on the cross-sectional plane of the water ladle. So far, many researchers have used PIV to study the flow field in water ladle models, but only the flow field on two-dimension planes were resolved.
Therefore, in this study, to further investigate the three-dimensional internal flow field in a water ladle model of a cylindrical container, a Particle Tracking Velocimetry system with refractive index matching is implemented to quantify the unsteady/three-dimensional flow field while eliminating the particle imaging distortion. Such study cannot only improve our understanding of the complex flow behavior in gas-stirred ladles but also can be used to validate the CFD simulation models.

2. Materials and Methods

Based on an industrial steel refining ladle, a cylindrical water ladle model is designed and built. The dimensions and parameters of the industrial prototype and the downscaled water ladle are summarized in Table 1. Four typical flow rates of gas injection on the industrial ladle is also presented. To maintain a dynamic similarity on the Froude number, the flow rates of gas injection on water ladle model are calculated and determined, ranging from 0.1 L per minute to 0.4 L per minute. Although, we were able to keep a very similar Froude number between the industrial prototype and water ladle model, the Reynolds number are different remaining a considerable challenge of achieving a complete dynamic similarity. Equation (1) is utilized for estimating the Froude number, where Up is the velocity of the plume and H is the height of the molten steel/solution. Plume velocity Up is calculated with the Equation (2), where Q is the volumetric flow rate of the gas injection, R is the radius of the ladle/model [17].
F r = U p 2 g H  
U P = 3.1 Q 1 3 H 1 4 R 0.58  
Consequently, in this experiment, eight conditions of gas stirring/injection with a volumetric flow rate ranging from 0.1 L per minute (LPM) to 0.4 LPM were adopted. An overview of the experimental conditions is presented in the Table 2. Since two plugs are geometrically identical and symmetric to each other, therefore for single gas injection the same plug (plug 2) was used to inject the gas for the cases 5–8.

2.1. Cylindrical Water Ladle Model and Refractive Index Matching

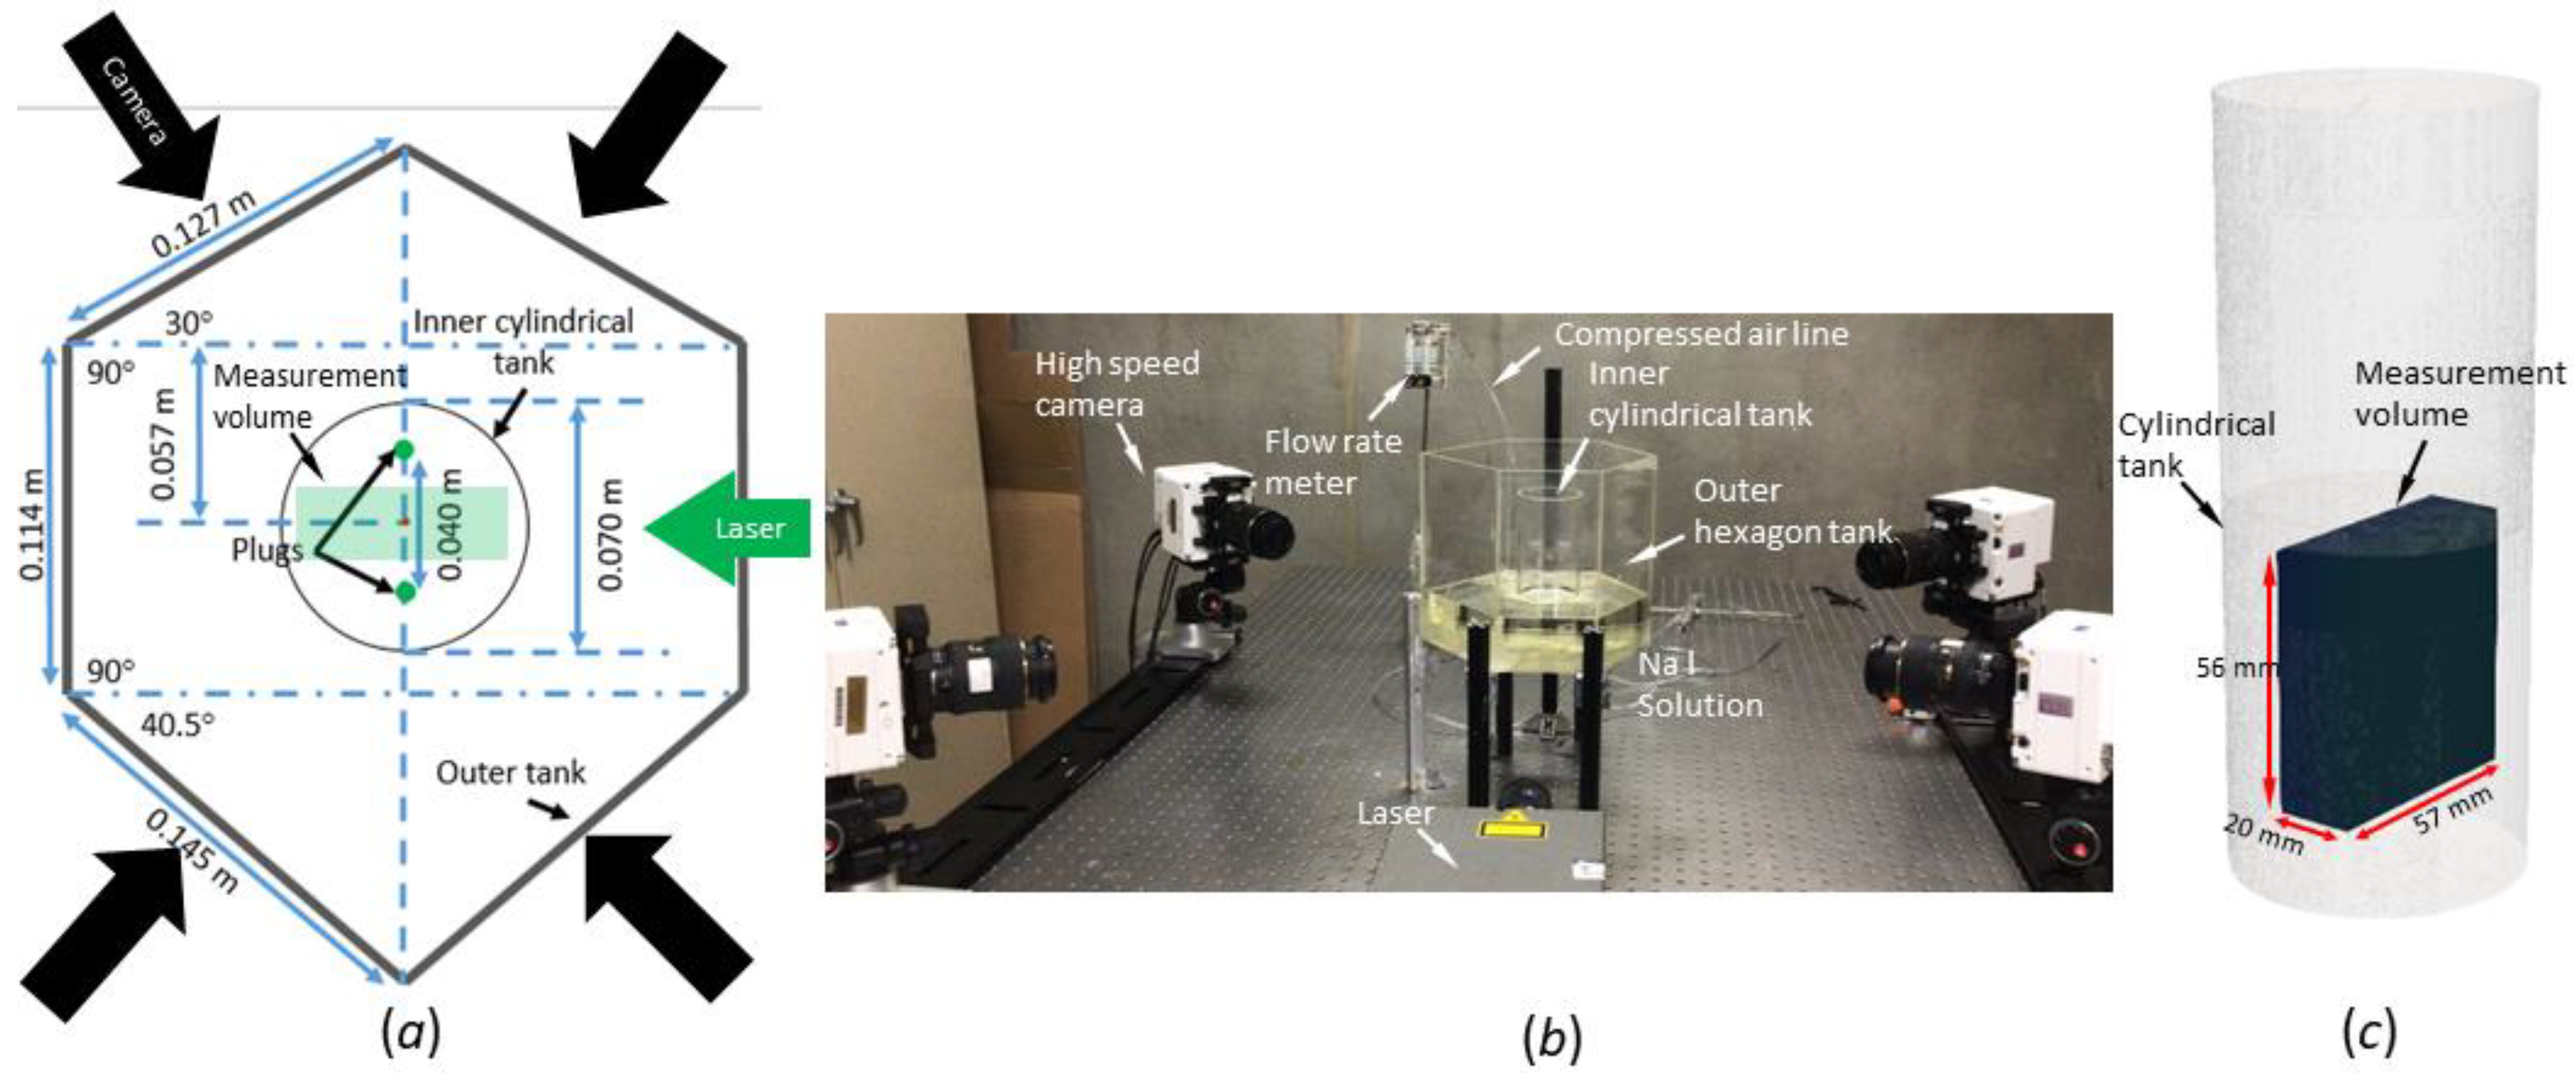
In this experiment, a cylindrical container with an inner diameter of 70 mm is implemented to simulate and replicate the characteristics of a cylindrical ladle (To avoid NaI solution spill onto the high-speed cameras and Laser a tall cylindrical wall of 178 mm is implemented). However, due to the curved surface of the cylindrical container that would introduce significant particle image distortion from refraction, the conventional flow field measurement methods, such as Particle Image Velocimetry and Particle Tracking Velocimetry, cannot be directly implemented to measure the flow field. Therefore, this study adopted the refractive index matching method to counteract the effects of image distortion due to refraction. Additionally, to capture and film the particle images from four different perspectives, a four-camera particle tracking velocimetry system was strategically configured on a larger hexagon tank with six flat walls meticulously designed to accommodate the angle of imagining. This larger hexagon tank was designed to allow the cameras to film the flow inside the cylindrical tank, which was positioned at the center of the larger hexagon tank, with the cameras filming perpendicular to the flat walls. Both tanks were fabricated from plexi-glass. To ensure optimal refractive index matching and thereby minimize image distortion, a Sodium Iodide solution was prepared and used to fill the tanks to a height of 84 mm. Importantly, the refractive index of the Sodium Iodide solution closely aligns with that of plexi-glass, ensuring minimum light refraction as the scatted light from the seeding particles traverses the curved plexiglass walls and the solution, eliminating particle image distortion when the Particle Tracking Velocimetry is employed. During the experiment, the compressed gas is introduced to the cylindrical tank through two 4.7 mm circular plugs at the bottom of the tank. The plugs sat on the centerline of tank with a distance of 40 mm. Two mechanical flow meters with an accuracy of 0.02 L per minute (Brooke Instrument, Hatfield, UK) were utilized to measure and monitor the flow rate of the compressed gas during the experiments.

2.2. Particle Tracking Velocimetry System

The state-of-the-art: Shake-the-Box system (Lavision, Gottingen) was implemented on the cylindrical water ladle model, which inject compressed air to stir the flow. To accurately track the intricate gas-stirred water flow within the water ladle model, hollow glass spheres with a diameter range of 8 to 12 μm were used as seeding particles. To capture the seeding particles in the flow field and film the particle images, a high repetition rate laser (Nd: YLF single cavity, Photonics DM-30-527) and four high-speed cameras (Phantom VEO 640), were strategically positioned on two sides of the experimental setup (See Figure 1a,b). Lenses (Tokina Macro) with a focal length of 100 mms and aperture size of f/4.5 and f/11 were incorporated into the imaging system to facilitate capturing particle images within the flow field. To ensure optimal illumination and imaging, cylindrical optical lenses were added to the laser head, generating a 20 mm thick laser light that penetrated the walls and illuminated the inner cylindrical tank from the side. The sampling frequency of the images/laser was set at 100 Hz, with an image resolution of 1024 × 1024 pixels maintained across all four high-speed cameras, enabling a flow measurement volume of 57 mm × 62 mm × 19 mm that locates between the plugs and 18 mm above the bottom of the tank (See Figure 1c). For each testing condition (see Table 1), on each high-speed camera, the maximum number of 2000 image/data samples were collected over a time duration of 20 s. During the experiment, the gas injection was started at least 2 min before the data collection (image collection with laser illumination) with a 5 min break between each case of data collection.
The software Davis 10 (LaVision, Gottingen, Germany) was employed for calibration, data collection, and velocity field constructions. To achieve accurate calibration, a 55 × 55 mm calibrate target was positioned within the Sodium Iodide solution, allowing for the acquisition of calibration images. Calibration was performed in the Davis 10 using four images of the target. On each data set of collected particle images, for enhanced accuracy in sub-pixel measurements and to facilitate volumetric flow field measurement, volume self-calibration was incorporated during the final calibration. The Shake-the-Box algorithm (LaVision, Gottingen, Germany) was then used to carry out the particle reconstruction/tracking on each data set by shaking the particle position by 1 voxel during the iterations. The culmination of these process involves the reconstruction of the instantaneous volumetric velocity field through post-processing within Davis 10. This resulted in three 13 × 14 × 5 matrices, each representing volumetric velocities along the three dimensions with a spatial resolution of 4.7 mm/velocity vector. For a more in-depth understanding of Shake-the-Box algorithm and its principle, please refer to Schanz et al. [20].

3. Results

The primary focus of this study revolves around the aggregated flow field behavior represented by the mean velocity field and turbulent kinetic energy. The experimental results of each condition of gas flow injection will be discussed with a deeper focus on conditions 1, 3, 5 and 8 to further detail the flow behavior of the water ladle model through the plots of volumetric mean velocity field, streamlines, and turbulent kinetic energy.

3.1. Mean Velocity Field

Figure 2 and Figure 3 present the volumetric contour plots of mean velocity in the x (transverse direction), y (vertical direction), and z (through thickness direction) directions, as well as the corresponding velocity magnitude, for both double and single gas injection cases. In Figure 2, representing the double gas injection, the distinct flow field behavior at case 1 (double gas injection at a flow rate of 0.1 LPM) with significantly lower mean velocity field stands out as compared to the flow field at other gas injection conditions. To accommodate this significantly lower velocity flow field at condition 1, a different scale is implemented (from −0.05 to 0.05 m/s for mean velocity plot in x, y, z directions and 0 to 0.1 m/s for velocity magnitude). In the x-direction (transverse direction) velocity plot, the flow domain splits into two at the top with negative x velocity flow (blue) on the left-side and positive x velocity flow (red) on the right-side. This flow pattern at case 1 suggests the stirred flow divided into two branches heading to opposite directions of x (transverse direction) at the top of the flow field. For the vertical velocity (y-direction velocity), a high velocity concentration is observed at the center of the top region. Moving away from the center, the vertical velocity decreases and creates a lower vertical velocity flow, resulting in a concave bowl shape from the center line and extends downwards. For the through thickness direction velocity (z-direction velocity), high velocity region moves away from the top and concentrates at the center of the flow domain, forming round contours with lower velocity away from the center.
At higher flow rates of gas injection, as more vertical momentum is added to the flow field, flow field quickly become random and lack a clear structure or pattern to be characterized. With flow rate of double gas injection goes above 0.2 L per minutes, instead of enhanced flow velocity, no clear separation of positive and negative transverse velocity can be observed at the top of the flow field. Meanwhile, instead at the top of the flow domain, the upward velocity (Y direction velocity) is mostly intensified at the mid-height of the flow field. Yet, for the through thickness velocity plot, no clear characteristics was observed. As for the mean velocity magnitude results, with increasing flow rates, the high-velocity region becomes more pronounced and extends from the top towards the bottom of the ladle model. Conversely, with single gas injection (Figure 3), the mean velocity field plots start with random distributions from the beginning at 0.1 L per minute and with less distinct flow patterns. As the flow rate increases, the high velocity region experiences subtle changes with no distinguishing variations, except the upward velocity gets more noteworthy at the center of the flow domain. Regarding to the magnitude of mean velocity, as the flow rate increases, the flow contour pattern remains consistent and becomes more distinct, intensifying at the concentrated regions at the corners. While Figure 2 and Figure 3 presenting the volumetric velocity distribution, to gain a better understanding of the underlying physical process inside the ladle model, further investigation into the complex flow field is warranted.

3.2. Mean Velocity Streamlines

The derivation of three-dimensional streamlines from the mean velocity field provides a valuable tool for visualizing fluid flow and comprehending intricate flow behaviors. Figure 4 shows the three-dimensional streamlines that are color coded with velocity magnitude. For double gas injection cases, at the low flow rate of 0.1 L per minute, the three-dimensional streamlines exhibit a high degree of structure and organization. The streamlines adheres to a well-defined, coherent pattern within the X-Y planes (the planes that are parallel to the frontal planes). Also these streamlines symmetrically distribute about the sagittal plane. However, as the gas injection flow rate increases, the streamlines adopt a more intricate and less organized character with the velocity magnitude intensified. Conversely, streamline patterns in the case of single gas injection mark disorderliness and a lack of clear patterns, even at low gas injection rates of 0.1 L per minute. The streamlines with single gas injection evade any discernible pattern while clusters or groups of streamlines exist within the flow field, regardless of the injection rate. Notably, the velocity magnitude of the streamlines is significantly lower under the single gas injection as compared to the double gas injection cases as much less momentum is added in the flow for single gas injection cases.
Furthermore, the mean velocity field results are analyzed on two dimensional planes that can detail distinct flow features such as nodal points of separation/attachment, focus points of separation/attachment, and saddle points [21]. A nodal point of attachment occurs when velocity lines radiate outward from the node, while nodal points of separation involve velocity lines converging inward towards the node. Contrasting with nodal points, focuses exhibit a spiraling movement around a singular point—either spiraling away from it (a focus of attachment) or spiraling into it (a focus of separation). Saddle points present a unique scenario where streamlines move in differing directions across two perpendicular planes. As fluid moves away from this saddle point, it diverges in one direction and converges in another. To further examine the gas stirred flow field of the water ladle model, Figure 5, Figure 6, Figure 7 and Figure 8 depict two dimensional streamlines and vectors with velocity magnitude contour on three planes on x = −5 mm (Sagittal plane), y = −5 mm (Transverse plane), and z = −5 mm (Frontal plane). Similar to the observations made on Figure 2 and Figure 4, streamlines exhibit an organized and orderly pattern for double gas injection at low flow rate of 0.1 L per minute (condition 1). In contrast, higher gas injection flow rates and single gas injection induce greater disorder and more flow features (Nodal, Focus and Saddle points) on the streamlines. Figure 5 distinctly portrays a well-structured flow pattern in the case of double gas injection at a rate of 0.1 L per minute (condition 1). In Figure 5b, on the Transverse plane a saddle point is observed near the center, where the flow bifurcates into opposing directions. Surrounding this saddle point, a focus point is captured on the upper left corner where a symmetry flow field can be observed in the plot. Figure 5c demonstrates the organized streamlines with a slight deviation from the perfect symmetry on the frontal plane. Counteracting the injected upward momentum, a prevailing downward flow is observed on the sagittal plane, leading to a concentrated region of low velocity on the plane near the saddle point.
Figure 6 presents the streamlines plot with the double gas injection at a flow rate of 0.3 LPM, marking the shift from a downward dominated to an upward dominated flow field, as previously noted. Additionally, high velocity becomes more pervasive throughout each plane, displaying a more random flow pattern compared to Figure 5. Transitioning to a single gas injection scenario at a flow rate of 0.1 L per minute is presented in Figure 7. The flow field lacks a single predominant momentum direction, exhibiting the presence of multiple flow directions. Also, low velocity concentration prevails across the flow field, while high velocity zones emerge mainly at the tips of the top flow domain, suggesting no distinct flow patterns. Finally, Figure 8 showcases the outcomes for a single gas injection at the highest rate of 0.4 L per minute. The flow remains disrupted and irregular, lacking any dominant momentum. Concentrated high velocity zones intensify at the boundaries, devoid of any discernible or consistent pattern. In summary, the two-dimensional streamline visualizations provide insightful understanding about the mean velocity field inside the model. The findings underscore the considerable influence of injection rate and gas injection type on flow behavior and resulting streamlines. Lower gas injection rates, particularly in double injections, yield more structured and organized flow patterns. In contrast, higher gas injection rates and single gas injection can lead to increased randomness and disorganized flow behavior. This randomness and disorganized flow behavior shall be attributed to the elevated turbulence in the gas stirred flow field.

3.3. Turbulent Kinetic Energy

Turbulence holds paramount importance in the realm of ladle metallurgy, where its influence resonates through the entire process, borne from the vigorous and intricate motion of molten metal, underpins the homogenization of temperature, composition, and additives within the metal. In this study, the turbulent kinetic energy is calculated from the resolved volumetric flow field to understand the turbulent behavior of the stirred flow field inside the water ladle model, using the equation below [22], where u’, v’ and w’ represent the fluctuating components of velocity in the x, y, z directions, respectively.
T K E = 1 2 u ' 2 + v ' 2 + w ' 2
Figure 9 illustrates the volumetric distribution of turbulent kinetic energy for both single and double injections. In the case of double injection at 0.1 LPM, the value registered is a hundred times lower than the turbulent kinetic energy observed with cases 2–8. If the same color bar scale of cases 2–8, 0 to 0.3 m2/s2, is applied on condition 1, the depiction of the turbulent kinetic energy volumetric flow would have appeared uniformly blue, signifying minimal turbulence under condition 1. Conversely, for a single injection at 0.1 LPM, a distant area of turbulence is evident, presenting a notable contrast. Observable in both single and double injections, an increase in the gas rate corresponds to a considerable escalation in turbulence, primarily concentrated within the uppermost portion of the flow domain which is consistent with other studies on the gas stirred steel refining ladle [16,23,24]. However, in the case of double injection, the turbulence exhibits greater turbulence strength and is more consistently concentrated throughout as more momentum is added to the flow, comparing to single gas injection. This observation aligns with the findings of with many other studies [15,25,26] that demonstrated the outward dispersion of turbulence from the plume region near the top.

4. Summary and Discussion

Through the analysis of the velocity field within the volumetric flow of the water ladle model using mean velocity magnitude (as discussed in Section 3.1), streamlines (as outlined in Section 3.2), and turbulent kinetic energy (as outlined in 
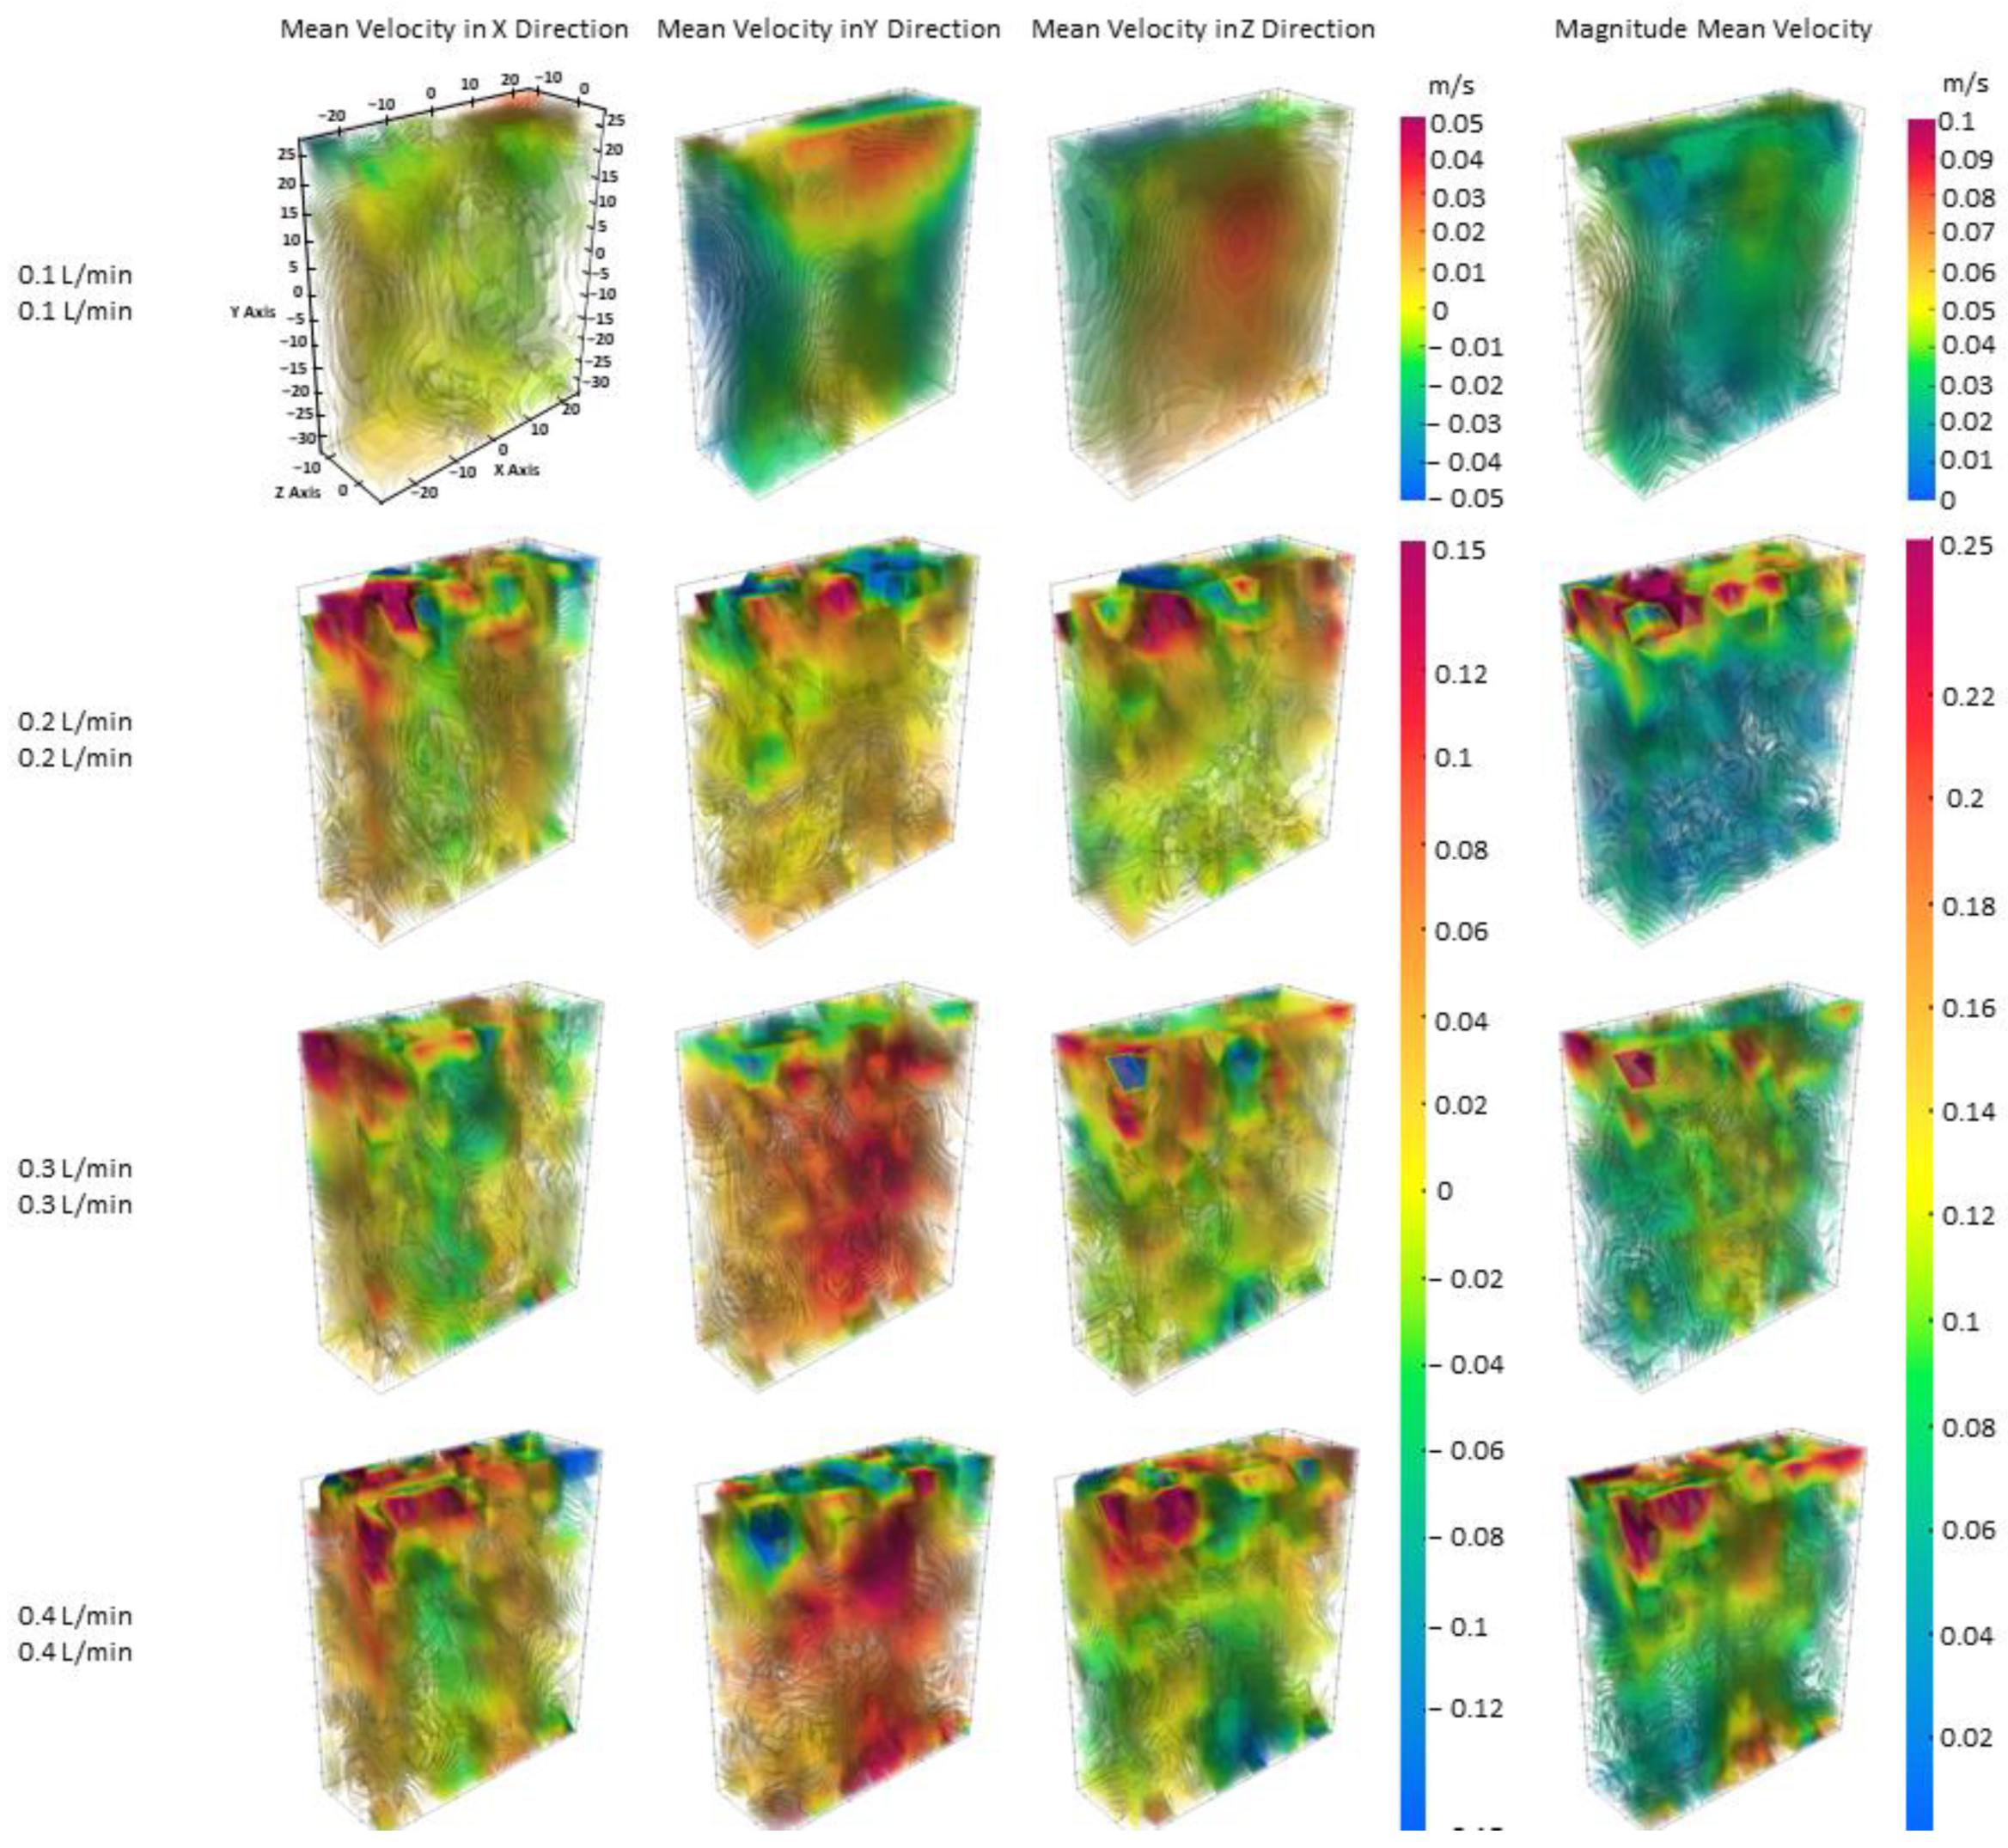
Section 3.3), a consistent trend has emerged and can be confirmed across multiple figures. In the context of double gas injection, a clear flow trend emerges as the gas injection rate increases. This flow trend is characterized by the extension of high velocity concentration from the top to the bottom in the vertical direction and higher fluid velocity magnitudes throughout the entire volumetric region. Particularly, in considering the vertical velocity and velocity magnitude, this trend is more prominent, suggesting the uneven fluid motion at the top under the stirring of gas injections. This has exceptional importance as critical processes, such as desulfurization, takes place at the interface between the molten steel and slag. Furthermore, when the flow rate is increased from 0.1 to 0.2 L per minute, the flow field shifts from an organized and structured mean velocity field pattern to a disorganized one. This transition is clearly illustrated in the volumetric distribution of vertical velocity plot in the Figure 2. As the flow rate continues to rise, the disorderly flow pattern persists, accompanied by a notable elevation in velocity magnitude across flow region. This progression of irregular and asymmetrical flow patterns with increasing gas flow rates is further underscored by a particularly vivid visual representation of 
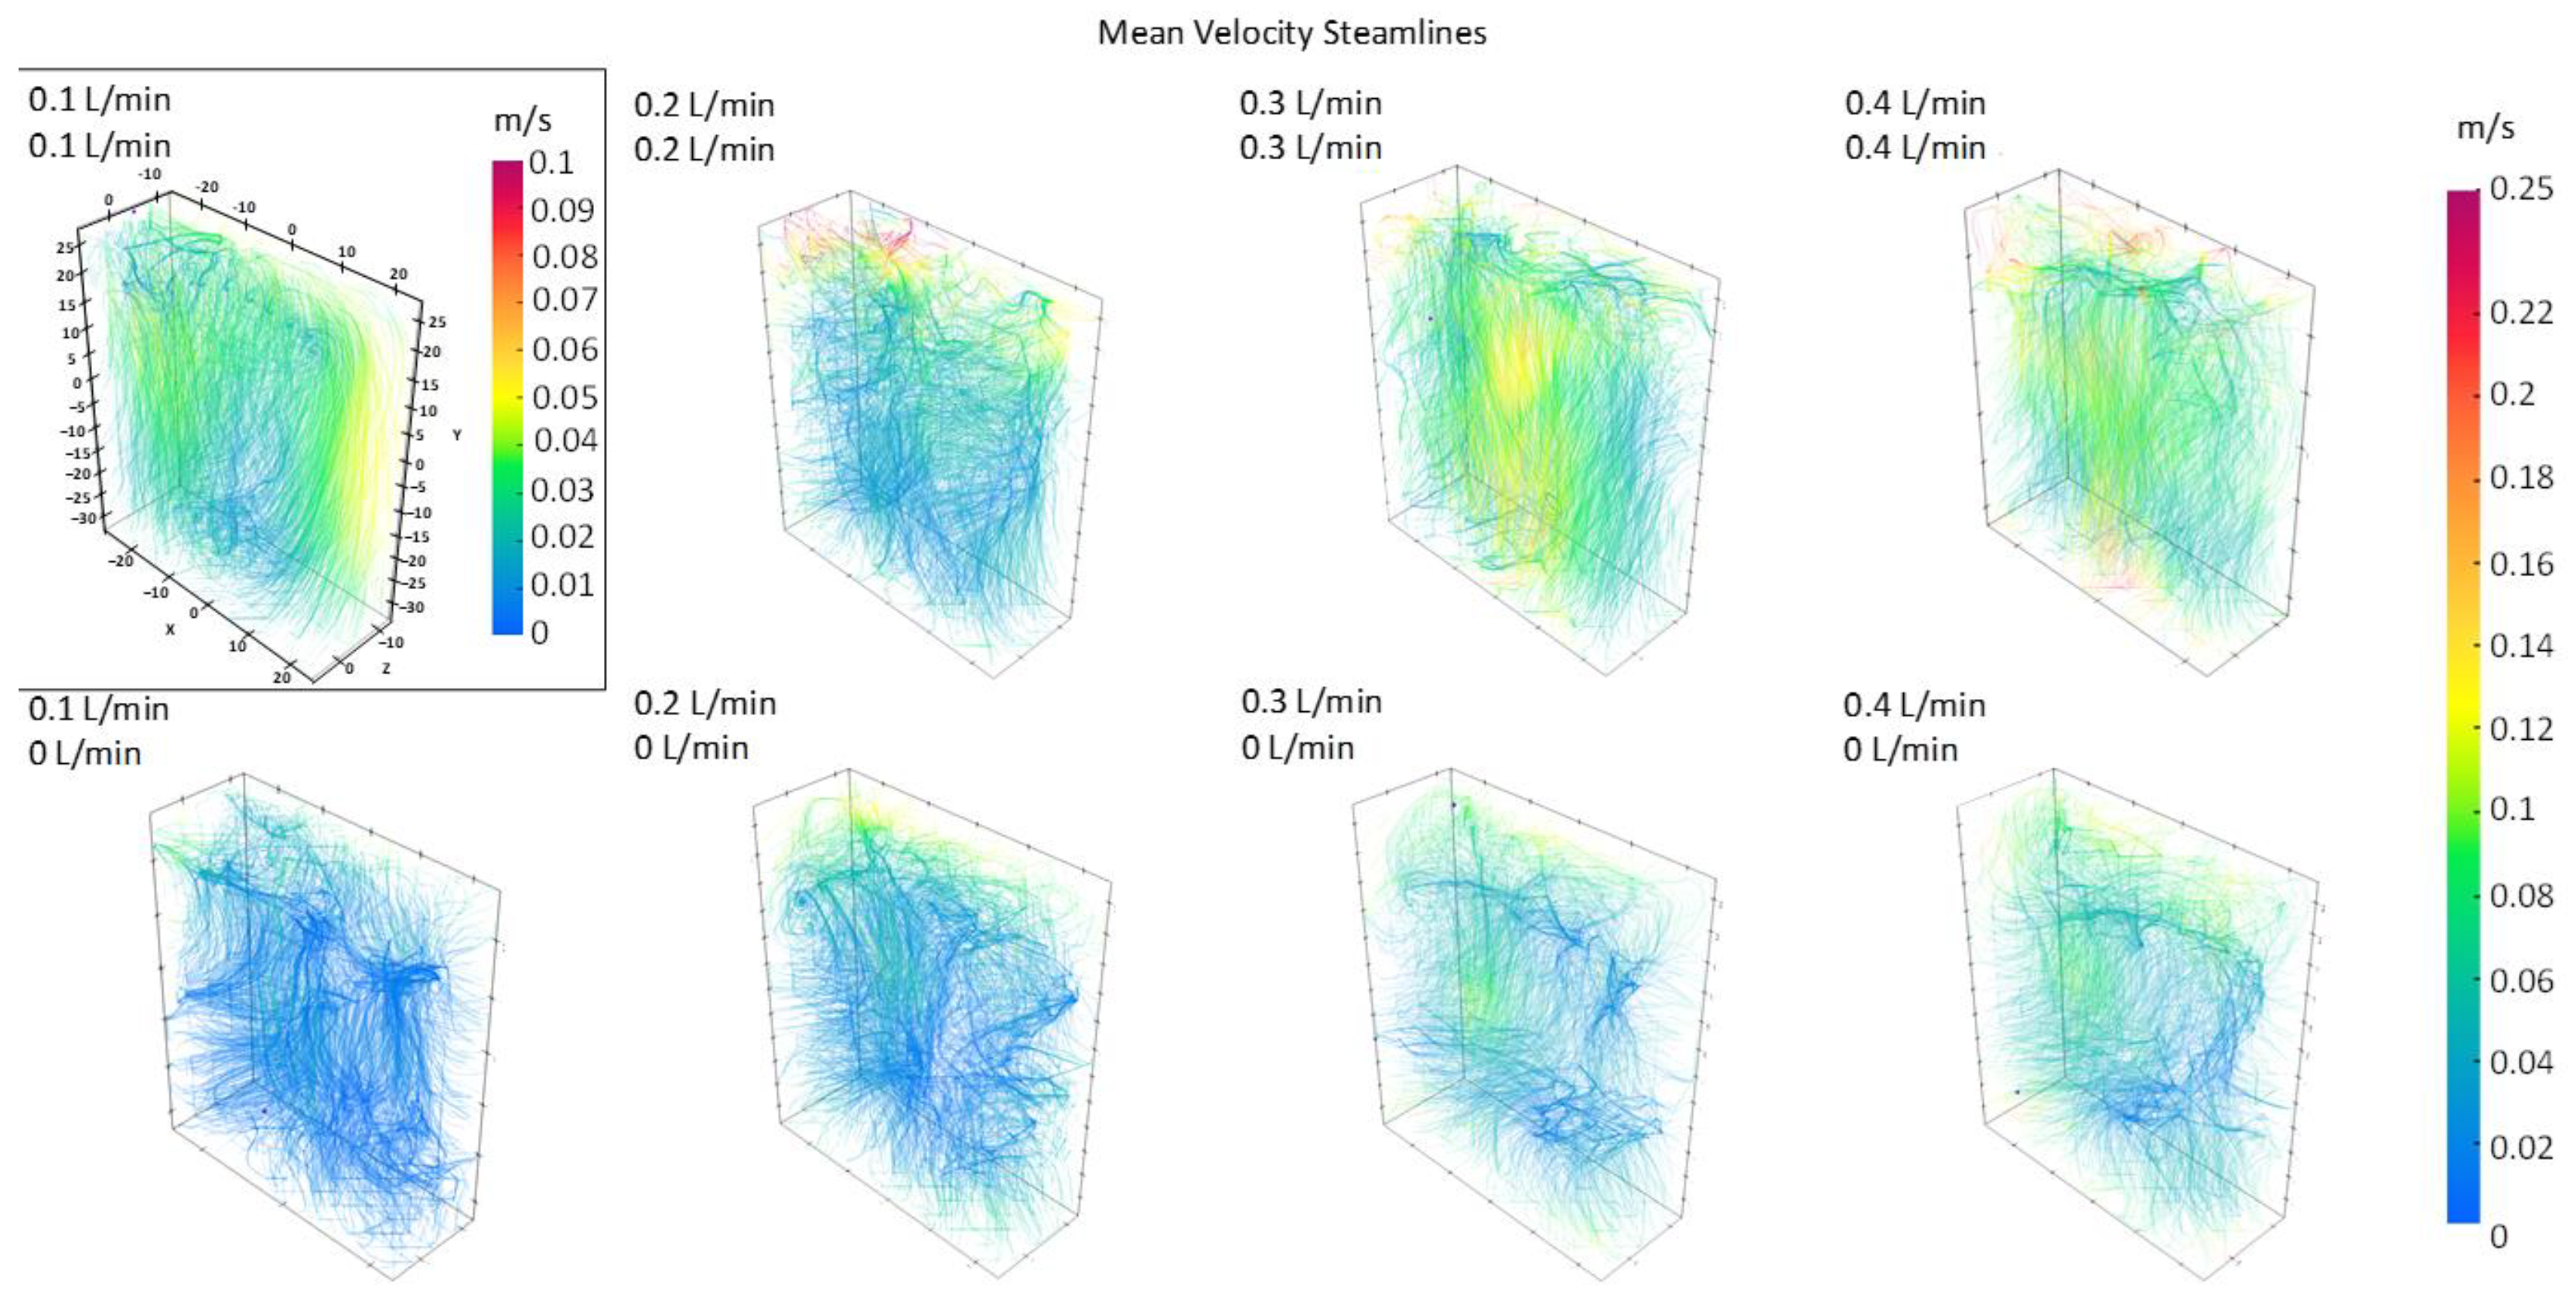
Figure 4 of the mean 3D streamline plots.
With the gas injection flow rate elevated from 0.1 to 0.2 L per minute, the previously symmetrical, organized, and predominantly vertical streamlines evolve into irregular and predominantly horizontal flow pattern. While the effect is less pronounced, another transition occurs as the flow rate is further increased to 0.3 L per minute. This shift is evident in the changing orientations of the streamlines, which regain a more vertical alignment. Upon examination of the mean velocity streamlines at various planes, additional confirmation of the observed trends is confirmed in Figure 5 and Figure 6. 
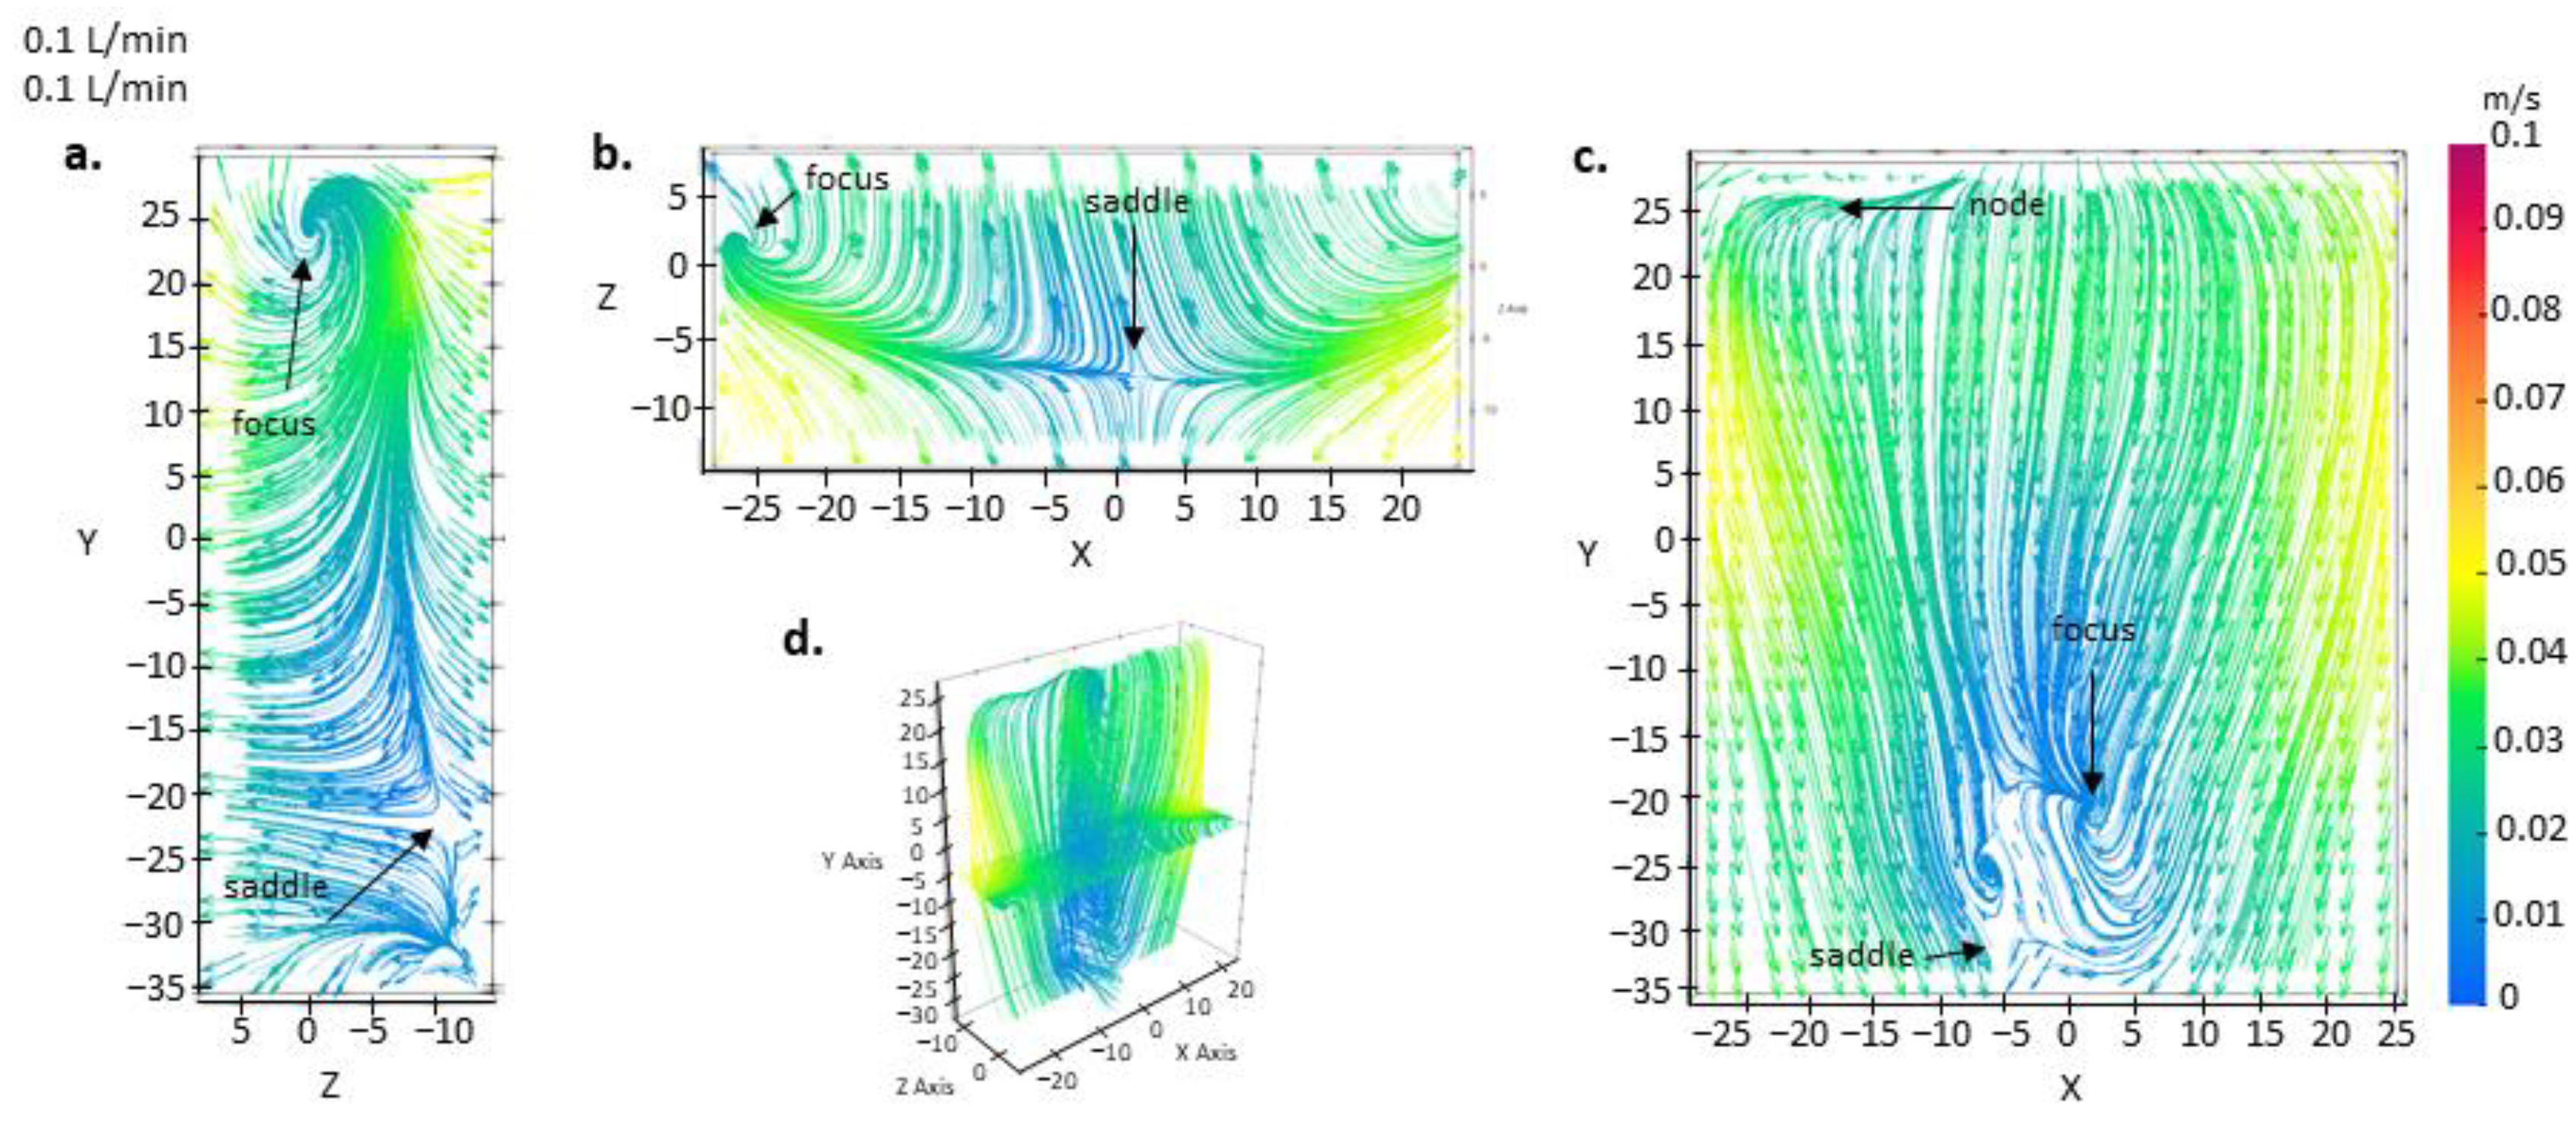
Figure 5 solidifies the depiction of a highly organized and structured flow pattern at the low double gas injection rate of 0.1 L per minute. Intriguingly, it becomes apparent that despite gas injection aiming to introduce upward momentum, downward flow dominates the measured flow field at the low gas injection rate of 0.1 L per minute. A focused analysis of the streamlines and mean velocity across stream-slices reveals the concentration of low velocity around the focal point on frontal plane (
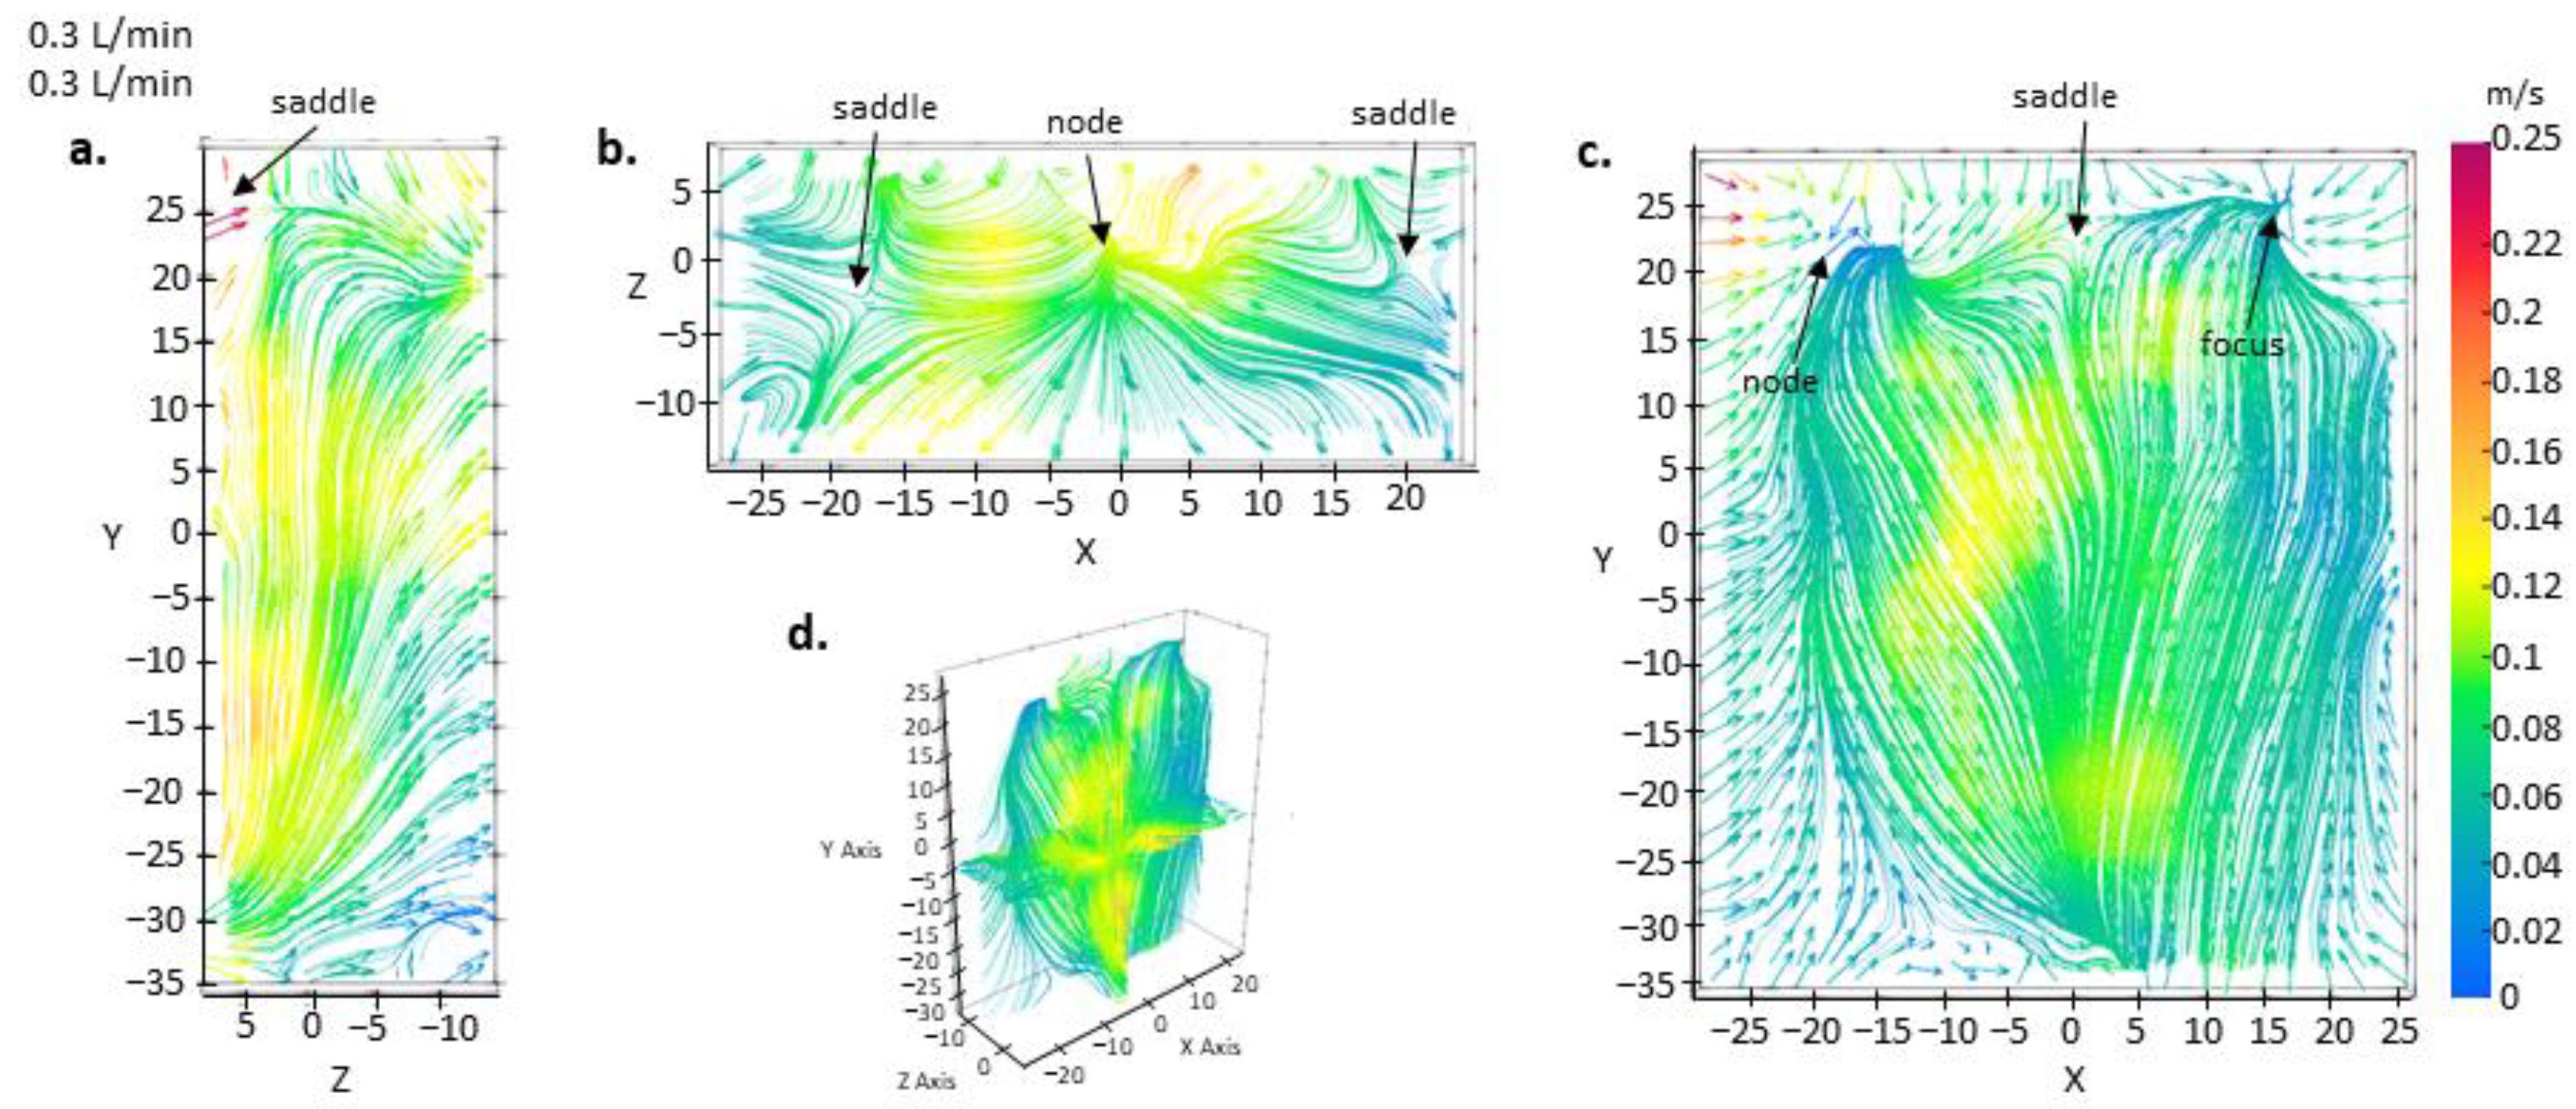
Figure 5c). The presence of this low velocity spot in the mean velocity field is unwanted, as it leads to fluid accumulation, hindering the efficient fluid mixing process. Raising the gas flow rate to 0.3 L per minute, the dominant flow momentum alters from downward to upward while exhibiting reduced outward curvature (Figure 6). Furthermore, high velocity concentrations become more prevalent across all planes. These trends suggest that higher gas flow rates could be advantageous in attaining the desired flow uniformity and mitigating the accumulation of stagnant fluid.
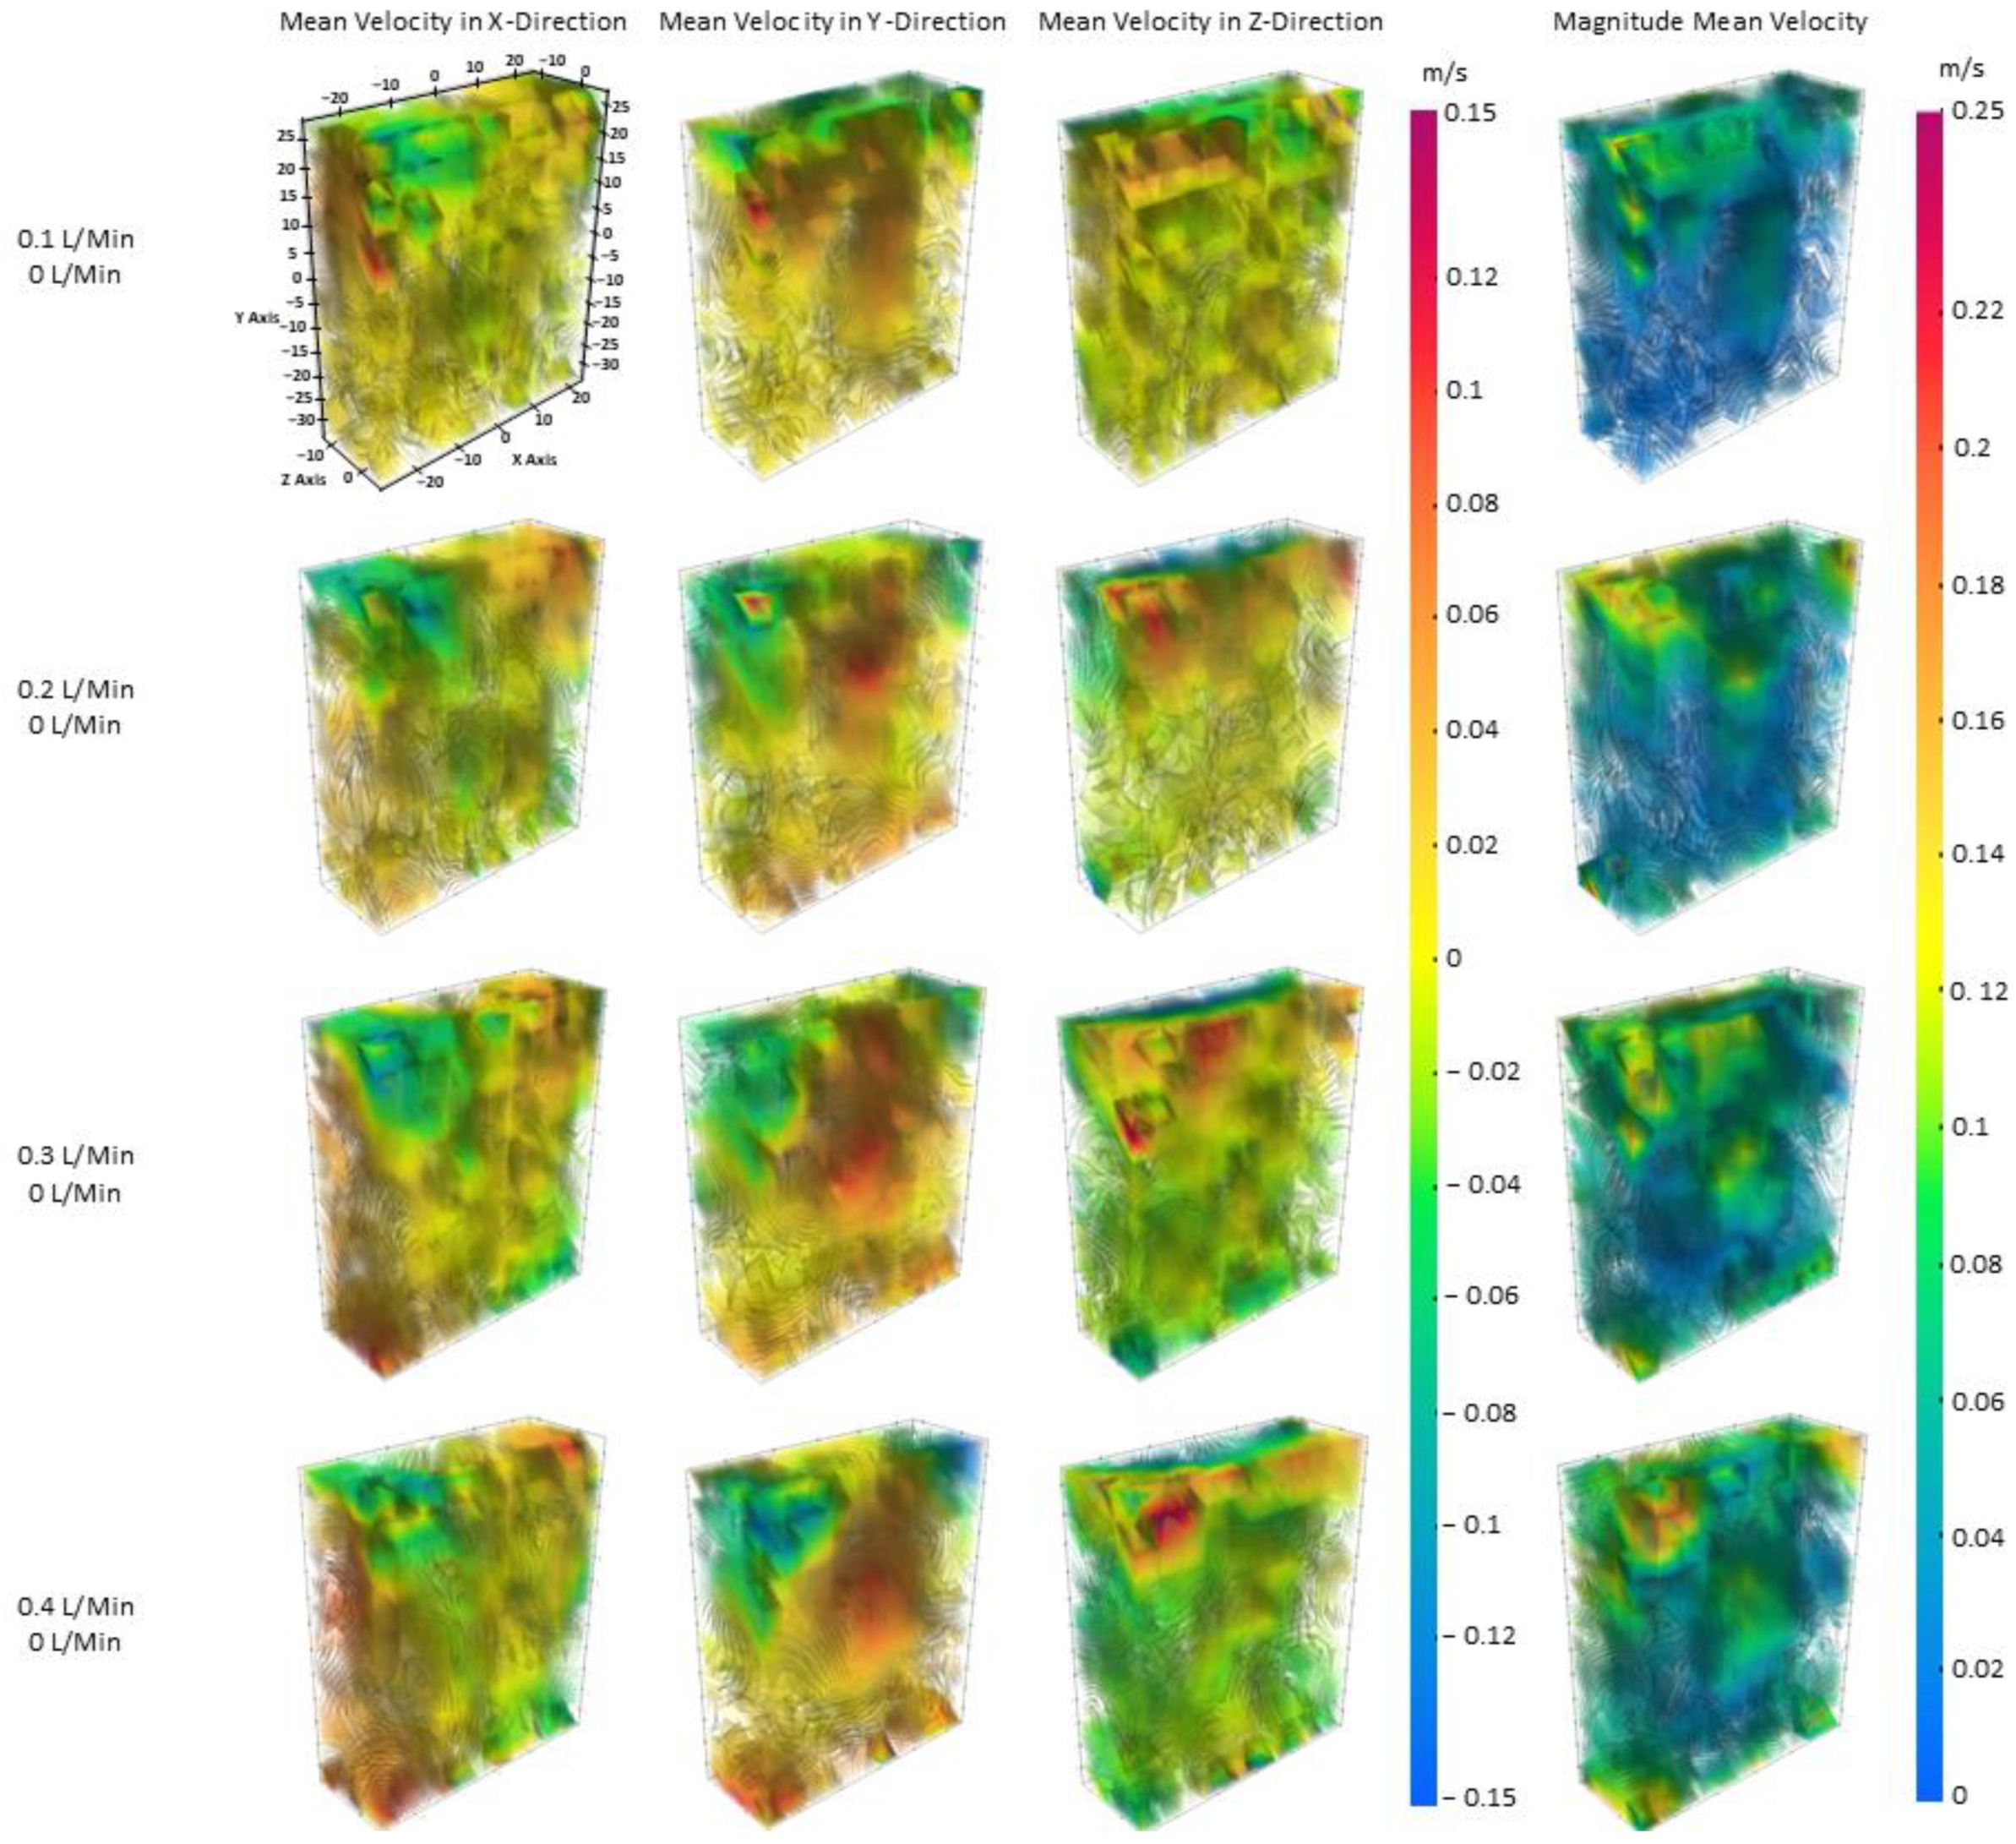
For single gas injection in Figure 3, however, increasing the gas flow rate does not introduce changes in location of contour concentration. Instead, it augments overall magnitude of velocity while maintaining a consistent contour pattern. As flow rate increases, the contour patterns of high velocity regions become sharper and more pronounced, suggesting the mean velocity field becomes more concentrated. Additionally, in Figure 4, streamlines under single gas injection consistently lack orderly structure across all flow rates. They display a disorganized and irregular flow pattern marked by random flow directions and clusters of streamline concentration. This observation is further verified through the examination of the 2D mean velocity streamlines plots in Figure 7 and Figure 8. 
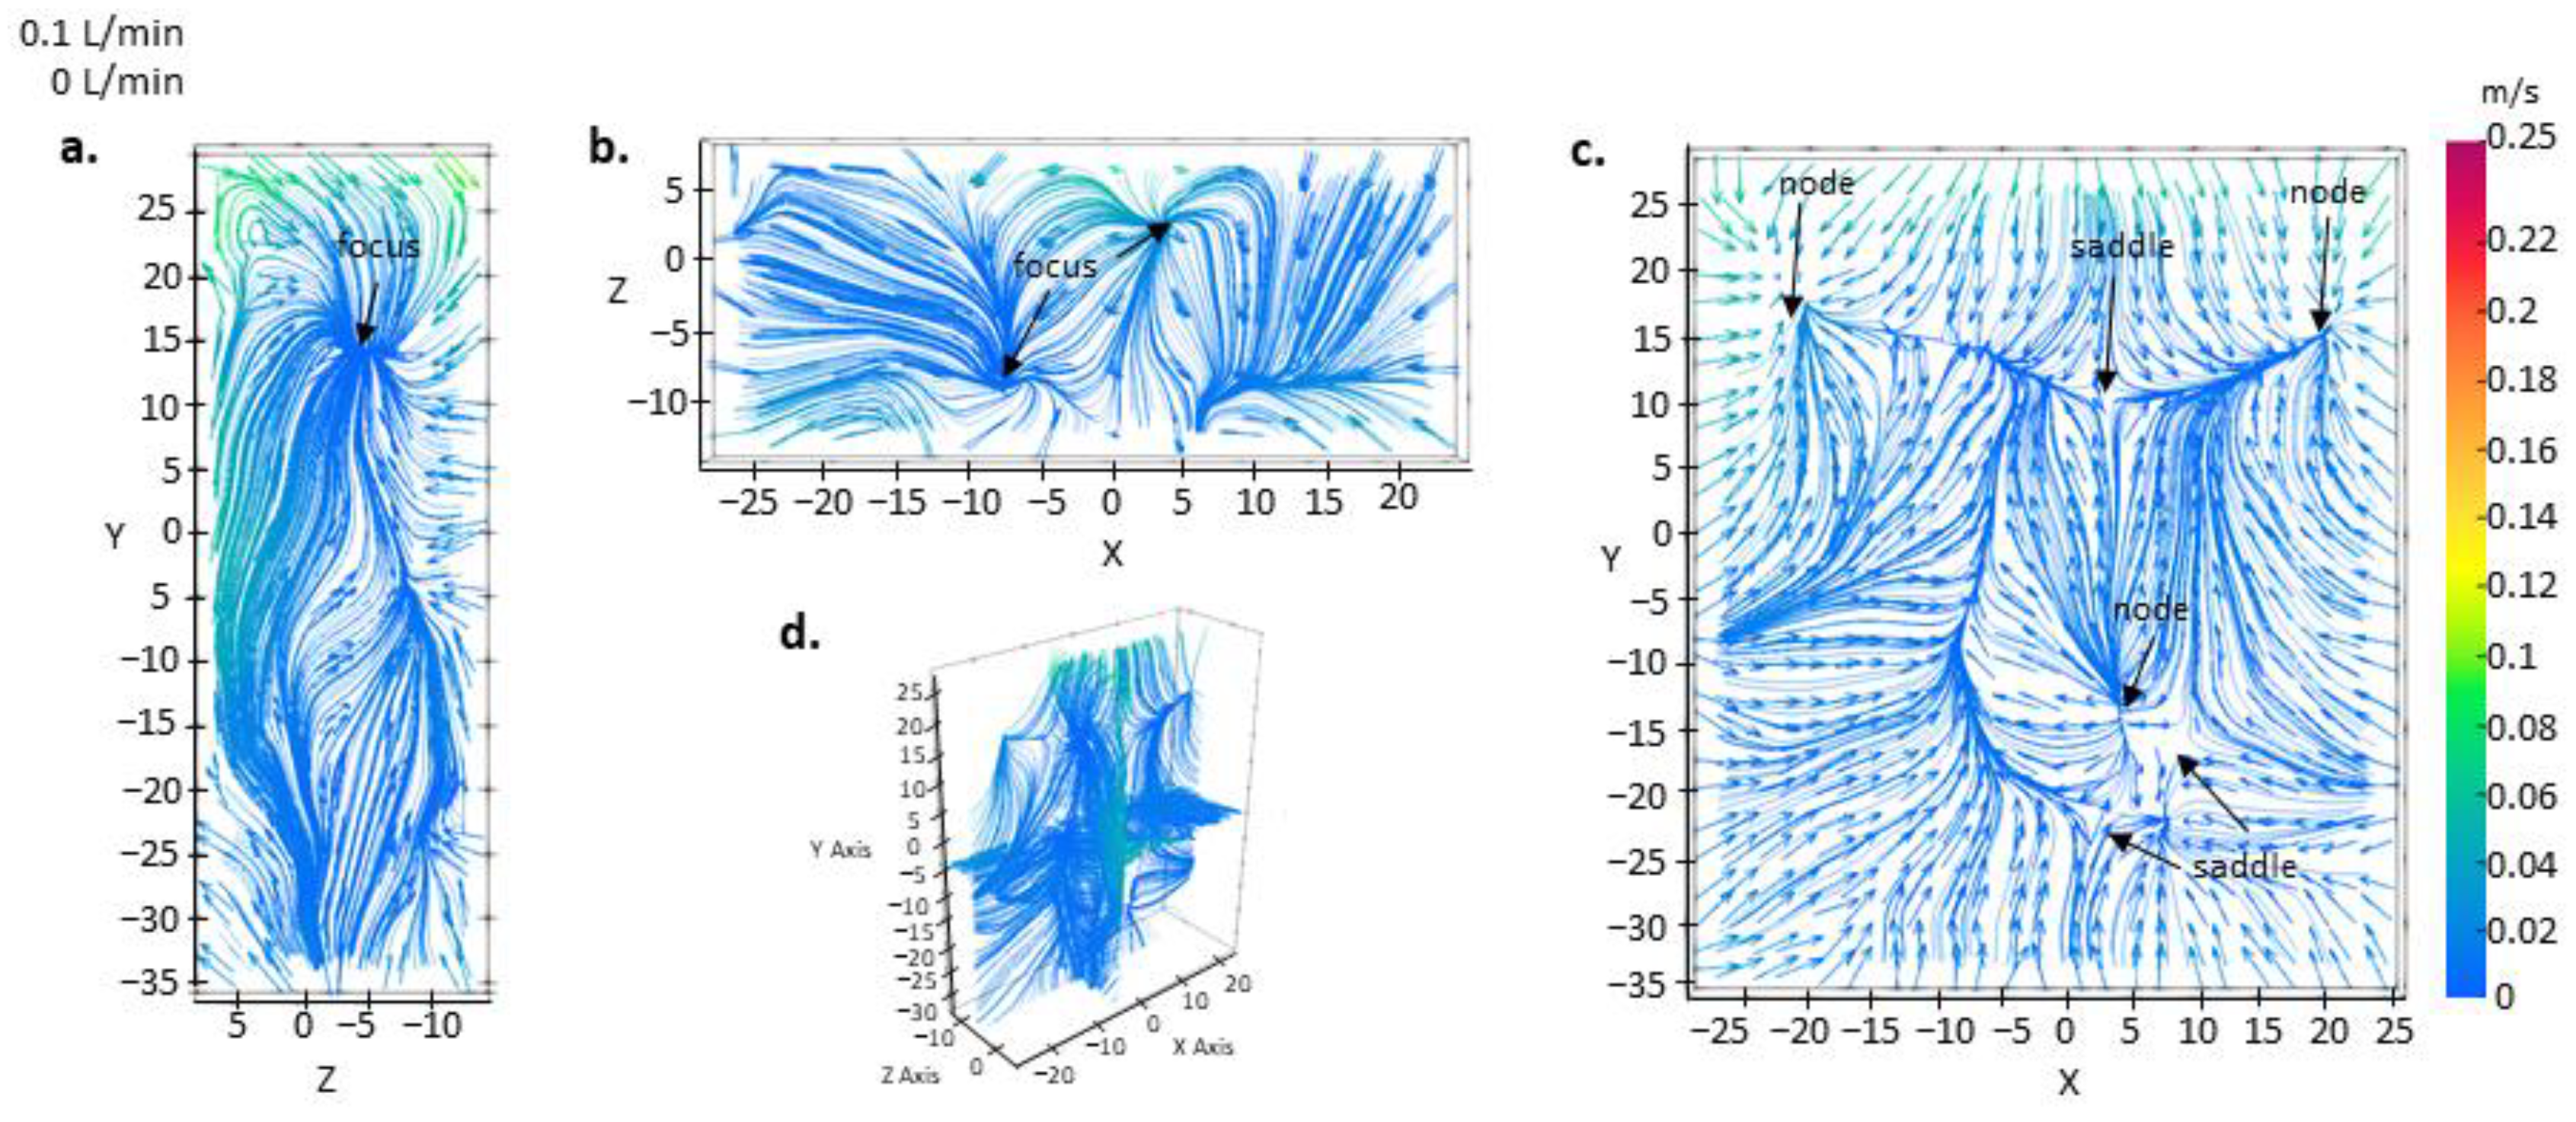
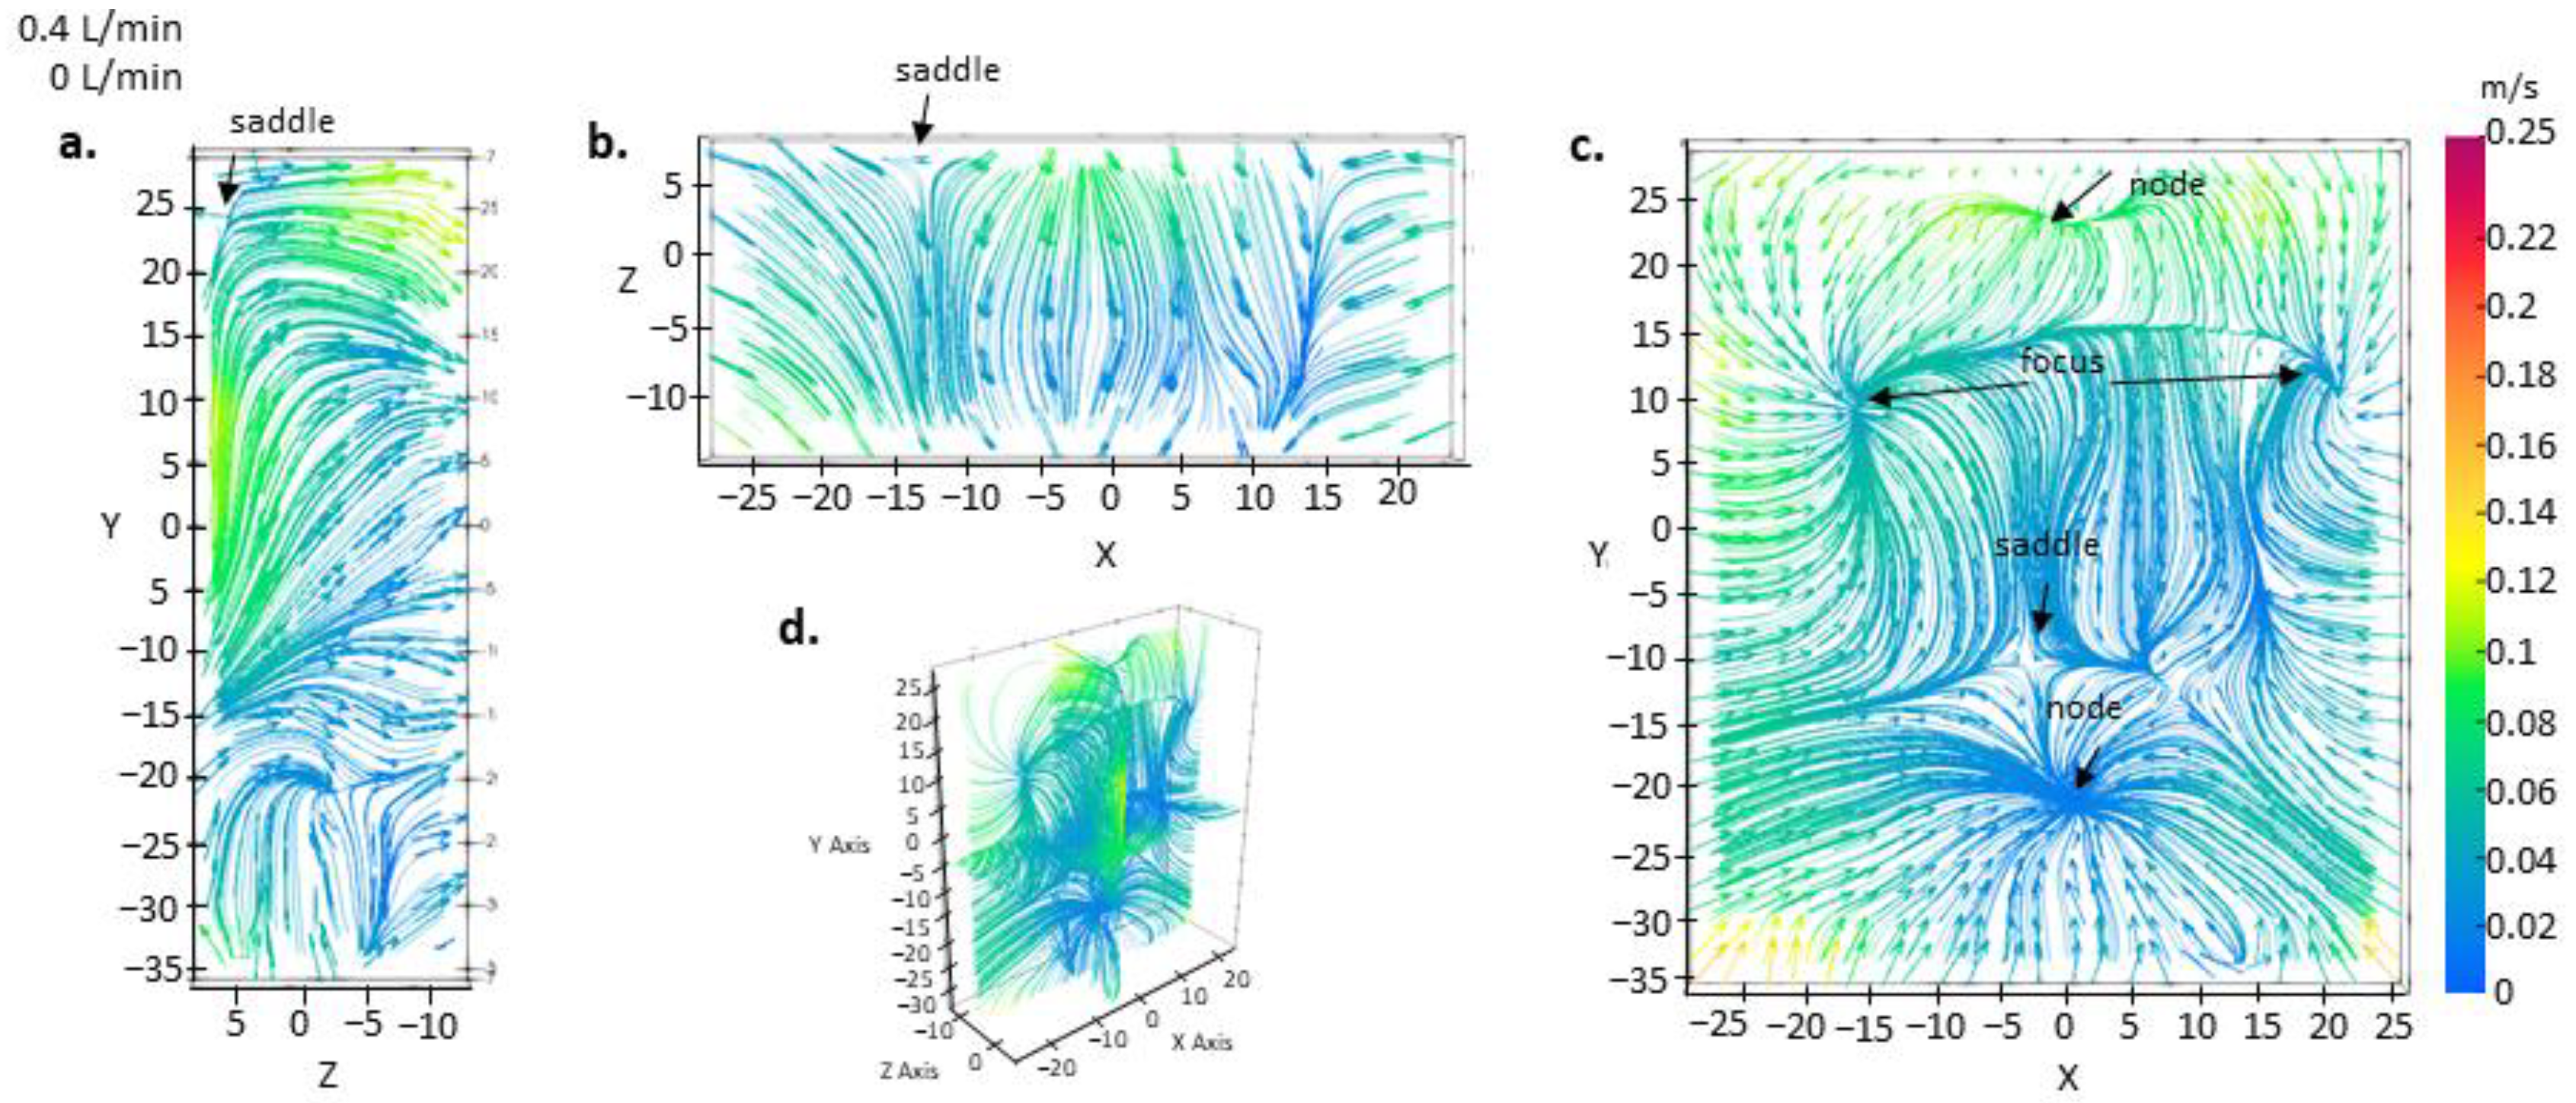
Figure 7 confirms the presence of a disorganized flow pattern, lacking a dominant flow momentum direction. This complexity could be attributed to the existence of multiple nodal, focal, and saddle points. Moreover, the flow field is primarily characterized by low velocity concentration, indicating the potential for stationary fluid within the volume under single gas injection with low flow rate. With the gas flow rate increased to 0.4 L per minute, as demonstrated in Figure 8, the flow maintains its disrupted nature without a prevailing momentum direction. However, the concentration of high velocity becomes more intense and extended, encompassing the outer boundaries and enhancing fluid bulk motion. By contrasting the effects of double and single gas injections, distinct flow differences become evident. Figure 4 illuminates the evolution of the streamlines for double and single gas injections.
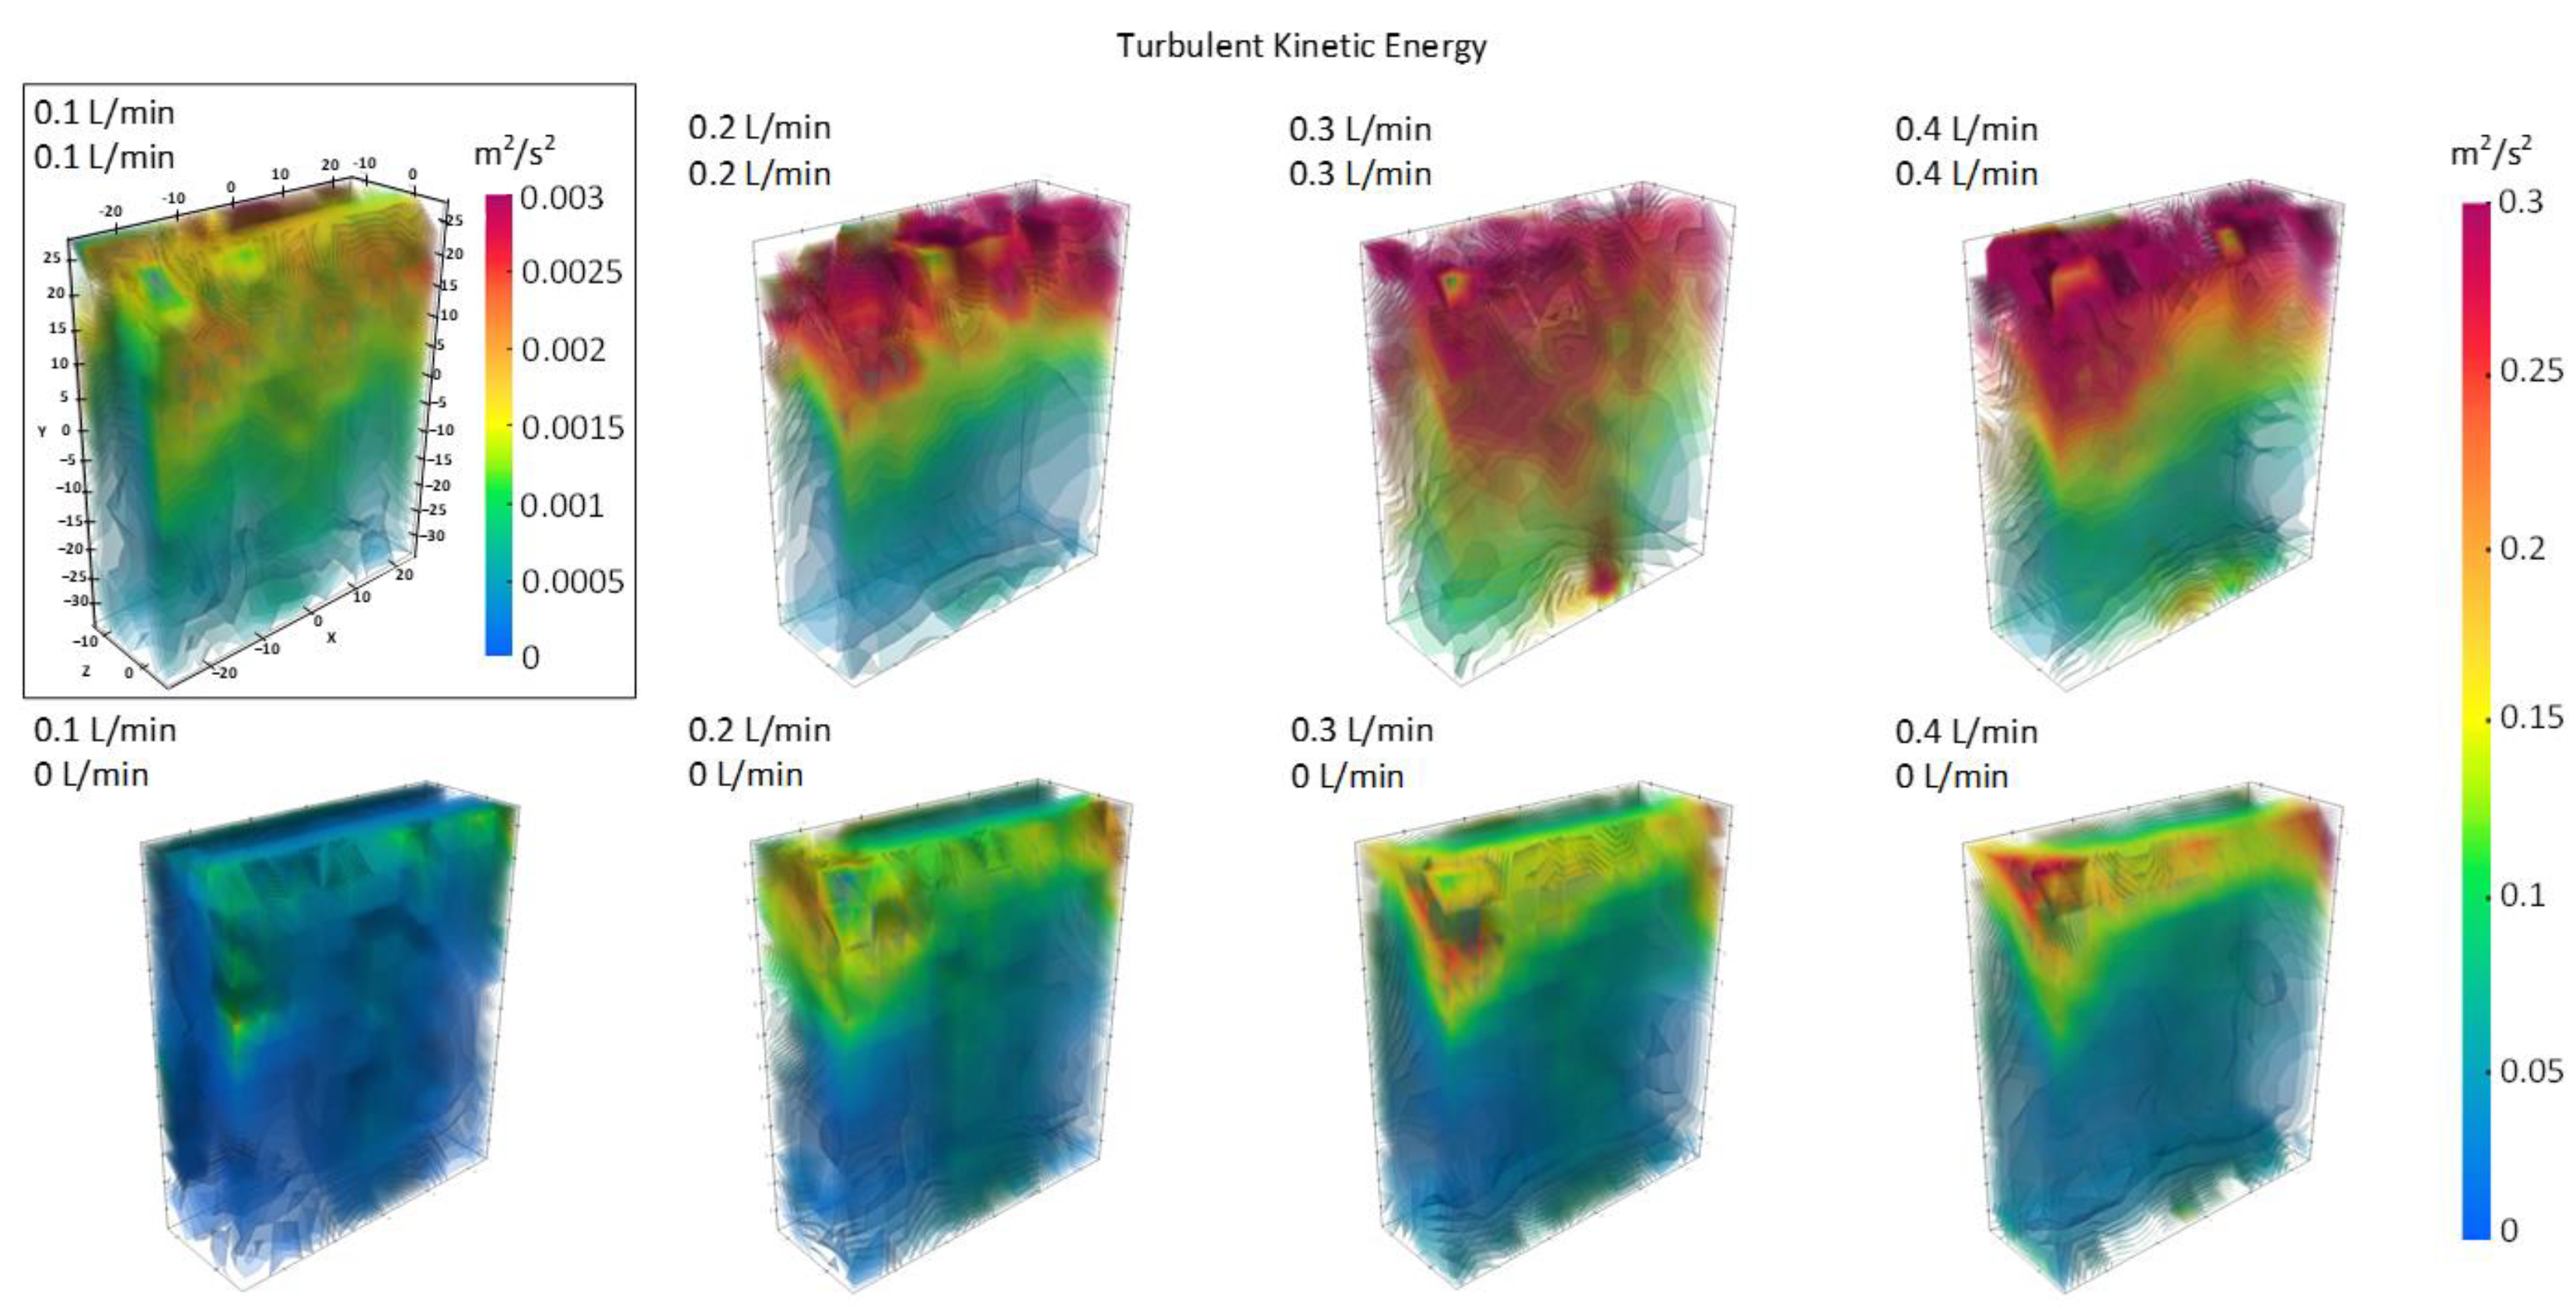
As the flow rate increases, double gas injections tend to align the streamlines more within the vertical orientation, whereas single gas injections continue to exhibit fluid motion in multiple directions. Additionally, single gas injections manifest more concentrated streamline groups, while double gas injections maintain a more uniform distribution throughout the region. The volumetric contour plots of turbulent kinetic energy further support our observation from the mean velocity field plots. At condition 1, with double gas injection at a low flow rate of 0.1 L per minute, the turbulent kinetic energy distribution is significantly low at the range of 0~0.003 m2/s2 while the turbulent kinetic energy plot for other conditions rise to much higher value in the range of 0~0.3 m2/s2 with higher TKE value distribution in other double gas injection cases and lower TKE value distribution in single gas injection cases, implying a fundamental flow behavior difference between the condition 1 and other conditions which can be correlated to the laminar and turbulent flow. With double gas injections at low flow rate, the fluid inside the cylindrical container is stirred but still able to maintain at laminar flow regime. However, at higher flow rate or single gas injection, the fluid inside the container is turned into turbulent when more momentum and asymmetry are added to the flow.
Therefore, to achieve the homogenization of the molten steel inside a real gas stirred steel refining ladle, a high flow rate and single (asymmetrical) gas injection should be implemented to introduce desired turbulent flow inside the ladle. In gas stirred refining ladles, the process of injected argon bubbles rising stirs the molten steel, promoting uniform composition and temperature, reducing segregation, and facilitating the removal of inclusions. In essence, ladle argon blowing serves to clean the molten steel, decrease hydrogen, oxygen, and nitrogen levels, enhance temperature and composition uniformity. In this study, the implementation of advanced Particle-Tracking-Velocimetry systems, particularly the Shake-the-Box method, on a cylindrical water ladle model, provided great insights into the three-dimensional flow field, illuminating the nuances of gas stirring, crucial for achieving desired steel quality.

Author Contributions

Y.J.-C. analyzed the data and wrote the manuscript. X.G. and Y.L. conducted the experiments. C.Z. and Y.L. conceptualize and supervise the work. All authors have read and agreed to the published version of the manuscript.

Funding

This work was supported in part by the National Science Foundation through its MRI program (CMMI-1919726) and GOALI program (CMMI-2113967). Support from all members of the Steel Manufacturing Simulation and Visualization Consortium (SMSVC), the SMSVC Ladle Project Technical Committee members, and Nucor Steel and the permission to publish this work are greatly acknowledged.

Data Availability Statement

The experimental data is available upon request.

Conflicts of Interest

The authors declare no conflict of interest.

References

  1. Fruehan, R. The Making, Shaping, and Treating of Steel, 11th ed.; The AISE Steel Foundation: Pittsburgh, PA, USA, 1998. [Google Scholar]
  2. Mishra, B. Steelmaking practices and their influence on properties. In Metals Handbook: Desk Edition; ASM International: Almere, The Netherlands, 1998; pp. 174–202. [Google Scholar]
  3. Duan, H.; Zhang, L.; Thomas, B.; Conejo, A. Fluid flow, Dissolution, and Mixing Phenomena in Argon-Stirred Steel Ladles. Metall. Mater. Trans. B 2018, 49, 2722–2743. [Google Scholar] [CrossRef]
  4. Mazumdar, D.; Guthrie, R. The physical and mathematical modelling of gas stirred ladle systems. ISIJ Int. 1995, 35, 1–20. [Google Scholar] [CrossRef]
  5. Szekely, J.; Asai, S. The general mathematical statement of turbulent recirculatory flows. Trans. ISIJ 1975, 15, 270–275. [Google Scholar] [CrossRef]
  6. Roy, T.D.; Majumdar, A.K.; Spalding, D.B. Numerical prediction of recirculation flows with free convection encountered in gas agitated reactors. Appl. Math. Model. 1978, 2, 146–150. [Google Scholar]
  7. Johansen, S.T.; Robertson, D.G.C.; Woje, K.; Engh, T. Fluid dynamics in bubble stirred ladles: Part I. experiments. Metall. Trans. B 1988, 19, 745–754. [Google Scholar] [CrossRef]
  8. Peranandhanthan, M.; Mazumdar, D. Modeling of slag eye area in argon stirred ladles. ISIJ Int. 2010, 50, 1622–1631. [Google Scholar] [CrossRef]
  9. Mazumdar, D.; Roderick, G. Modeling energy dissipation in slag-covered steel baths in steelmaking ladles. Metall. Mater. Trans. B 2010, 41, 976–989. [Google Scholar] [CrossRef]
  10. Nunes, R.; Pereira, J.; Vilela, A.; Der Laan, F. Visualisation and analysis of the fluid flow structure inside an elliptical steelmaking ladle through image processing techniques. J. Eng. Sci. Technol. 2007, 2, 139–150. [Google Scholar]
  11. Li, L.; Liu, Z.; Li, B.; Matsuura, H.; Tsukihashi, F. Water model and CFD-PBM coupled model of gas-liquid-slag three-phase flow in ladle metallurgy. ISIJ Int. 2015, 55, 1337–1346. [Google Scholar] [CrossRef]
  12. Vazquez, A.; Sanchez, R.; Salinas-Rodriguez, E.; Soria, A. A look at three measurement techniques for bubble size determination. Exp. Therm. Fluid Sci. 2005, 30, 49–57. [Google Scholar] [CrossRef]
  13. Aoki, J.; Thomas, B.; Peter, J.; Peaslee, K. Experimental and theoretical investigation of mixing in a bottom gas-stirred ladle. AISTech Iron Steel Technol. Conf. Proc. 2004, 1, 1045–1056. [Google Scholar]
  14. Fukuji, Y.; Mori, Y.; Fujita, S. Sizes and Size Distributions of Bubbles in a Bubble Column. Chem. Eng. Jpn. 2006, 12, 5–9. [Google Scholar]
  15. Gajjar, P.; Haas, T.; Owusu, K.; Eickhoff, M.; Kowitwarangkul, P.; Pfeifer, H. Physical study of the impact of injector design on mixing, convection, and turbulence in ladle metallurgy. Eng. Sci. Technol. Int. J. 2019, 22, 538–547. [Google Scholar] [CrossRef]
  16. Owusu, K.; Haas, T.; Gajjar, P.; Eickhoff, M.; Kowitwarangkul, P.; Pfeifer, H. Interaction of injector design, bubble size, flow structure, and turbulence in ladle metallurgy. Steel Res. Int. 2019, 90, 1800346. [Google Scholar] [CrossRef]
  17. Conejo, A. Fundamentals of Dimensional Analysis, Theory and Applications in Metallurgy; Springer Nature: Singapore, 2021. [Google Scholar]
  18. Liu, W.; Lee, J.; Silaen, A.; Zhou, C. Argon bubble coalescence and breakup in a steel ladle with bottom plugs. Steel Res. Int. 2019, 90, 1800396. [Google Scholar] [CrossRef]
  19. Bai, K.; Katz, J. On the refractive index of sodium iodide solutions for index matching in PIV. Exp. Fluids 2014, 55, 1704. [Google Scholar] [CrossRef]
  20. Schanz, D.; Gesemann, S.; Schröder, A. Shake-the-box: Lagrangian particle tracking at high particle image densities. Exp. Fluids 2016, 57, 70. [Google Scholar] [CrossRef]
  21. Tobak, M.; Peake, D.J. Topology of three-dimensional separated flows. Annu. Rev. Fluid Mech. 1982, 14, 61–85. [Google Scholar] [CrossRef]
  22. Pope, S. Turbulent Flows, 1st ed.; Cambridge University Press: Cambridge, UK, 2000. [Google Scholar]
  23. Jardón-Pérez, L.; Gonalez-Rivera, C.; Trapaga-Martiez, G.; Amaro-Villeda, A.; Ramirez-Argaez, M. Experimental study of mass transfer mechanisms for solute mixing in a gas-stirred ladle using the particle image velocimetry and planar laser-induced fluorescence techniques. Steel Res. Int. 2021, 92, 2100241. [Google Scholar] [CrossRef]
  24. Ramírez-Argáez, M.; Dutta, A.; Amaro-Villeda, A.; Gonzalez-Rivera, C.; Conejo, A. A novel multiphase methodology simulating three phase flows in a steel ladle. Processes 2019, 7, 175. [Google Scholar] [CrossRef]
  25. Jardón-Pérez, L.; Amaro-Villeda, A.; Gonzalez-Rivera, C.; Trapaga, G.; Conejo, A.; Ramirez-Argaez, M. Introducing the Planar Laser-Induced Fluorescence technique (PLIF) to measure mixing time in gas-stirred ladles. Metall. Mater. Trans. B 2019, 50, 2121–2133. [Google Scholar] [CrossRef]
  26. Jardón-Pérez, L.; Gonzalez-Morales, D.; Trapaga, G.; Gonzalez-Rivera, C.; Ramirez-Argaez, M. Effect of differentiated injection ratio, gas flow rate, and slag thickness on mixing time and open eye area in gas-stirred ladle assisted by physical modeling. Metals 2019, 9, 555. [Google Scholar] [CrossRef]
Figure 1. (a) Top view sketch of the setup. (b) Setup. (c) Measurement Volume.
Fluids 09 00011 g001
Figure 2. Mean velocity field in X, Y, Z directions with double gas injections.
Fluids 09 00011 g002
Figure 3. Mean velocity field in X, Y, Z directions with single gas injections.
Fluids 09 00011 g003
Figure 4. 3D streamlines for magnitude mean velocity field.
Fluids 09 00011 g004
Figure 5. Streamlines and velocity magnitude on different planes with double gas injection at 0.1 L/Min. (a) streamline plot on X = −5 mm plane. (b) streamline plot on Y = −5 mm plane. (c) streamline plot on Z = −5 mm plane.
Fluids 09 00011 g005
Figure 6. Streamlines and velocity magnitude on different planes with double gas injection at 0.3 L/Min. (a) streamline plot on X = −5 mm plane. (b) streamline plot on Y = −5 mm plane. (c) streamline plot on Z = −5 mm plane.
Fluids 09 00011 g006
Figure 7. Streamlines and velocity magnitude on different planes with single gas injection at 0.1 L/Min. (a) streamline plot on X = −5 mm plane. (b) streamline plot on Y = −5 mm plane. (c) streamline plot on Z = −5 mm plane.
Fluids 09 00011 g007
Figure 8. Streamlines and velocity magnitude on different planes with single gas injection at 0.4 L/Min. (a) streamline plot on X = −5 mm plane. (b) streamline plot on Y = −5 mm plane. (c) streamline plot on Z = −5 mm plane.
Fluids 09 00011 g008
Figure 9. Turbulent kinetic energy for single and double injections.
Fluids 09 00011 g009
Table 1. Parameter of prototype and downscaled water ladle.
Prototype—Steel Ladle
Ladle Diameter2.5 m
Molten steel height3 m
Molten steel density6795 kg/m3
Molten steel dynamic viscosity0.006 pa·s [18]
Surface tension—molten steel1.82 n/m [18]
Flow rateReynolds numberFroude number
206.97 NL/min2,775,0000.0227
413.95 NL/min3,496,0000.036
620.92 NL/min4,002,0000.0471
827.90 NL/min4,405,0000.0571
Model—Water Ladle
Tank Diameter0.070 m (2.75 in)
NaI solution height0.084 m (3.30 in)
NaI solution density1793 kg/m3 [19]
Solution dynamic viscosity0.002 pa.s [19]
Surface tension—NaI solution0.073 n/m [18]
Flow rate (20 °C)Reynolds numberFroude number
0.10 L/min12,0000.0232
0.20 L/min15,0000.0368
0.30 L/min17,0000.0483
0.40 L/min18,0000.0585
Table 2. Eight Test Conditions of gas injection flow rate in liter per minute.
Condition12345678
Plug 10.10.20.30.40.10.20.30.4
Plug 20.10.20.30.40000
Disclaimer/Publisher’s Note: The statements, opinions and data contained in all publications are solely those of the individual author(s) and contributor(s) and not of MDPI and/or the editor(s). MDPI and/or the editor(s) disclaim responsibility for any injury to people or property resulting from any ideas, methods, instructions or products referred to in the content.

