Article

Thermal Transpiration Flow: Molecular Dynamics Study from Dense to Dilute Gas

1
Department of Micro-Nano Mechanical Science and Engineering, Nagoya University, Furo-cho, Chikusa, Nagoya 464-8603, Aichi, Japan
2
Institute of Fluid Science, Tohoku University, 2-1-1 Katahira, Aoba, Sendai 980-8577, Miyagi, Japan
*
Author to whom correspondence should be addressed.
Fluids 2024, 9(1), 12; https://doi.org/10.3390/fluids9010012
Submission received: 27 November 2023 / Revised: 26 December 2023 / Accepted: 28 December 2023 / Published: 30 December 2023
(This article belongs to the Special Issue Rarefied Gas Flows: From Micro-Nano Scale to Hypersonic Regime)

Abstract

:
Thermal transpiration flow, a flow from cold to hot, driven by a temperature gradient along a wall under a high Knudsen number condition, was studied using the molecular dynamics method with a two-dimensional channel consisting of infinite parallel plates with nanoscale clearance based on our previous study. To accelerate the numerical analysis, a dense gas was employed in our previous study. In this study, the influence of the number density of gas was investigated by varying the height of the channel while keeping the number of molecules to achieve the flow ranging from dense to dilute gas while maintaining a constant Knudsen number. From the flow velocity profile compared to the number density profile, the thermal transpiration flow was observed for all number density conditions from dense to dilute gas. A similar flow structure was exhibited regardless of the number density. Thus, the numerical analysis in a dense gas condition is considered to be valid and useful for analyzing the thermal transpiration flow.

1. Introduction

The development of micro- and nanotechnologies has enabled an increased interest in small-scale gas transfer. A flow with such a small flow field results in a high Knudsen number, which is defined as the ratio of the mean free path of gas molecules to the characteristic length of the field. In high-Knudsen-number flows, several peculiar phenomena are known to appear. The thermal transpiration flow [1,2,3] is a typical example of such phenomena. It is a flow induced from the cold to the hot side by a temperature gradient along a wall. As an example of application, a motionless pump, called the Knudsen pump [3,4], was proposed. Because this pump utilizes the thermal transpiration flow, it requires only a temperature gradient, and it works without any mechanical moving parts. This characteristic is suitable for the miniaturization of a pump, and it is expected as a promising candidate for driving a flow in micro- and nanodevices [5,6,7]. This pump has been further developed for applications in gas chromatography [8], gas separation [9], and heat pumps [10].
Along with the development of gas transport applications, many studies have been carried out for the better understanding of the fundamental characteristics of the thermal transpiration flow [3]. The pressure difference or the pressure ratio of the final equilibrium state [11,12,13] and the mass flow rate [12,13,14,15] were experimentally measured and discussed. These characteristics were also evaluated numerically [16,17,18,19,20,21,22]. These studies focused on macroscopic overall properties useful for applications, and longitudinal profiles were mainly studied. However, it is still interesting to study the thermal transpiration flow from a microscopic perspective based on molecular motions. Because of rarefied gas flows, the direct simulation Monte Carlo (DSMC) method is one of the promising approaches. The velocity profile across a channel using the DSMC method was reported, but via a study on the thermal creep effect in a Poiseuille flow [23]. It is particularly interesting to study molecular behavior near a wall in the direction perpendicular to a wall surface across a channel, because the flow is induced via the gas–surface interaction.
In our previous study [24], the relationship between the velocity field and number density distribution across a nanochannel cross-section in the thermal transpiration flow was investigated using a molecular dynamics (MD) simulation. Solid atoms comprising the wall were explicitly considered to investigate the role of the gas–surface interaction on the flow, and it was revealed that gas molecules in the adsorption layers play a significant role in inducing the flow. However, to obtain a profile of dilute gas with low noise and high spatial resolution, the computational cost would become too high using the MD method. To accelerate the numerical analysis with a moderate computational cost, the simulation was under the high-Knudsen-number condition but with a dense gas, where the mean molecular spacing was not significantly larger than the molecular diameter. Normally, the thermal transpiration flows are studied based on rarefied gas dynamics, where a dilute gas is considered. Because molecules experience multiple and repeated collisions in a dense gas due to small molecular spacing, the transfer of molecular properties by collisions is closer to that in a liquid than to that in a dilute gas [25]. The flow structure near the wall might be affected by the number density of the flow, i.e., a dilute or dense gas. This may have a large effect on the mechanism of the thermal transpiration flow, and study on the effect of number density is required. Moreover, liquid transport by the thermal transpiration phenomenon was discussed using a MD simulation [26], where the mechanism was different from that in a rarefied dilute gas. It was not clear whether the findings in our previous study could be applicable to the thermal transpiration flows in rarefied gas dynamics.
Thus, in this study, we aimed to explore the effect of density on the flow structure of the thermal transpiration flow by altering the flow state from dense to dilute gas. Considering the computational cost, the number of molecules and the Knudsen number were kept the same, and only the density was varied by changing the height of the simulated nanochannel.

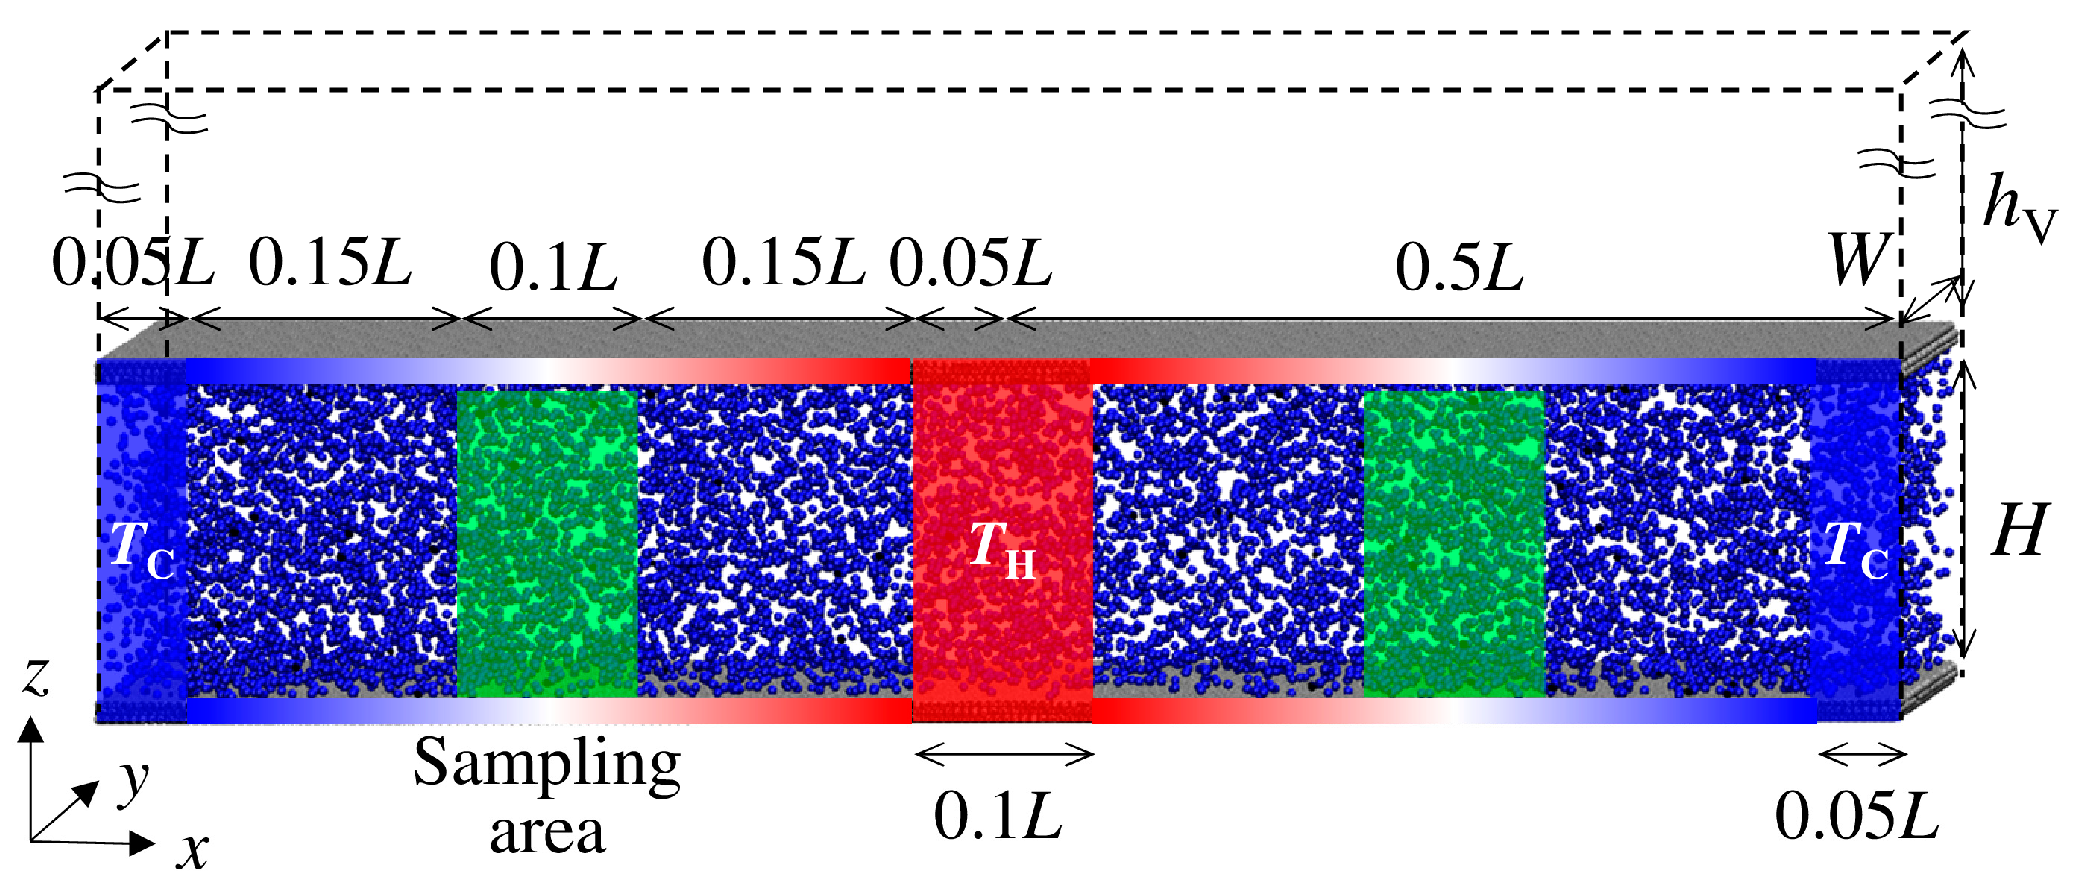
2. Numerical Methods

Following our earlier study [24], the thermal transpiration flow was numerically studied using the classical MD method. The flow was induced in a two-dimensional channel between infinite parallel plates with nanometer-scale clearance, with a temperature gradient along the channel longitudinal x-direction applied to the channel wall.
The schematic of the computational cell is shown in Figure 1, which was visualized using Visual Molecular Dynamics (ver. 1.9.3) [27]. Periodic boundary conditions were applied in all x-, y-, and z-directions. Thus, the temperature condition was periodically set in the x-direction, with cold at both ends of the simulation domain and hot at the center. A vacuum layer was prepared outside of the channel to prevent interaction through the periodic boundary condition in the z-direction. The solid atoms of the channel walls were explicitly considered. All interactions between gas and solid atoms were modeled with the Lennard–Jones (12-6) potential.
The Knudsen number was evaluated to check the flow regime because the thermal transpiration flow is induced under rarefied gas conditions. The Knudsen number is defined as the ratio of the mean free path of gas molecules to the characteristic length of the system. The mean free path was approximated as
λ L W H 2 N π σ 2 ,
where the channel volume was calculated by its geometrical configuration with the length L, the width W, and the height H without considering the excluded volume by the wall atoms, N is the number of gas molecules, and the molecular diameter of gas molecules was approximated by the Lennard–Jones potential parameter. The characteristic length is the height of the nanochannel H in this simulated domain. Thus, the Knudsen number Kn was calculated as
K n = λ H L W 2 N π σ 2 .
It is interesting to note that Kn does not depend on H, whereas it is inversely proportional to N. Thus, the number density could be changed without changing Kn.
Another important condition is gas density, which affects collisions between gas molecules. It was evaluated by comparing the mean molecular spacing with the diameter of gas molecules [28]. The mean molecular spacing δ is determined by the number density n as δ = 1 / n 3 , where n = N / L W H . The molecular diameter could be approximated by the Lennard–Jones potential parameter σ.
In this study, the effect of gas density was explored by changing the ratio of δ / σ . From these relations, the variation in gas density while maintaining Kn could be achieved by changing H, despite maintaining N so as not to change the computational cost.
The peachgk_md (v.2.141) in-house simulation package [29], which was validated using the LAMMPS package [30], with several additional procedures for simulating the thermal transpiration flow was employed [24]. Argon molecules were adopted as a test fluid flow via a channel between infinite platinum (111) surfaces. The solid atoms of the channel walls were explicitly considered. The Lennard–Jones (12-6) potential was applied between the atoms with the parameters σ = 0.247 nm and ε = 31.36 kJ/mol for Pt–Pt interaction, σ = 0.340 nm and ε = 0.996 kJ/mol for Ar–Ar interaction, and σ = 0.294 nm and ε = 0.658 kJ/mol for Ar–Pt interaction [31]. The masses of the Ar and Pt atoms were m = 39.95 and 195.1 amu, respectively. The number of gas atoms was N = 18,275. The length and the width of the channel were L = 55.4 nm and W = 50.4 nm, respectively. The channel wall was comprised of three layers of 42,000 solid atoms per layer. A vacuum layer to avoid the interaction through the periodic boundary condition in z-direction was hv = 10 nm. The channel height H, the clearance between the innermost atomic layer of the channel walls, was enlarged from H = 3 nm in our previous study to H = 10, 50, and 100 nm, to increase from δ = 0.77 nm to δ = 1.15, 1.97, and 2.48 nm. The mean molecular spacing is proportional to the cubic root of the channel height. Thus, the ratio indicating gas density δ/σ = 2.26 was increased up to δ/σ = 3.38, 5.79, and 7.29, from a dense to dilute gas, whereas the Knudsen number Kn = 0.30 was independent of the channel height H for all cases.
A schematic of the temperature-controlled regions is also shown in Figure 1. To achieve the temperature gradient along the x-direction, both ends with a length of 0.05 L were set to TC = 250 K as the cold part, and the center with a length of 0.1 L was set to TH = 350 K as the hot part, where Langevin thermostats were applied for both parts during the simulation time. To capture the flow structure from random thermal motions of gas molecules, quite a large temperature gradient was applied. The temperature of the channel wall between the cold and the hot part with a length of 0.4 L was also controlled to achieve the temperature gradient. The channel walls had three layers: the outermost fixed layer, the middle temperature-controlled layer, and the innermost free-moving layer. The temperature of the middle layer was controlled based on its position by linearly interpolating between the cold and hot parts. To analyze the thermal transpiration flow field, data were sampled in the sampling area established at the center of each region with a temperature gradient, i.e., the 1/4 L and 3/4 L points from the left end, with a length of 0.1 L. The results were obtained from the right sampling area. The data from the left sampling area were reversed and evaluated together with the data from the right area to increase the number of samples because the temperature and the flow fields were symmetrical in the x-direction.
The velocity Verlet algorithm was used with a time step of 1 fs. Because the number density decreases with increasing channel height, the number of total time steps was set in proportion to the channel height to ensure similar sampling conditions for different channel heights. The simulations were run for 2, 10, 20 × 106 steps, i.e., 2, 10, and 20 ns, for H = 10, 50, and 100 nm, with the final half of the interval sampled to evaluate the steady state accounting for the variation in bulk number density. Because the sample size is less than that in our previous work (H = 3 nm, 10 ns) and the bulk properties would suffer from statistical noise, this study concentrates on the area near the wall surfaces, where thermal transpiration flow is induced. The initial positions of the gas molecules were dispersed randomly so that the number of gas molecules was inversely proportional to the temperature, depending on the wall temperature at its x-position using the rejection sampling method, to prevent the initial pressure distribution and to achieve faster convergence to the steady state.

3. Results and Discussion

3.1. Bulk Flow Velocity Profile

To overview the entire simulated flow field, the profiles of the x-component of the flow velocities, i.e., the mean velocities of gas molecules, of the sampling area across the channel in the height (z-) direction with different channel heights were compared. The profiles for H = 10, 50, and 100 nm with H = 3 nm, which was obtained in our previous study, are plotted with a normalized height z/H in Figure 2. Because of the variations in the channel height, the z-axis is normalized by the height H to view the entire velocity profile across the channel. Because the size of the area near the wall varies with the channel height H, we focus here only on the entire profile, not including the area near the walls. Although the sampling time was considerably long, the sample size was still small for the dilute conditions, showing quite large scattering of the velocity profiles. The black line of H = 3 nm indicates a feature of the Poiseuille flow, and the lines of larger H appear to be scattered around that line. With an increase in the number of samples by increasing the number of molecules by expanding the channel width and/or by elongating the sampling time, these lines are expected to converge on the lines similar to that of H = 3 nm.

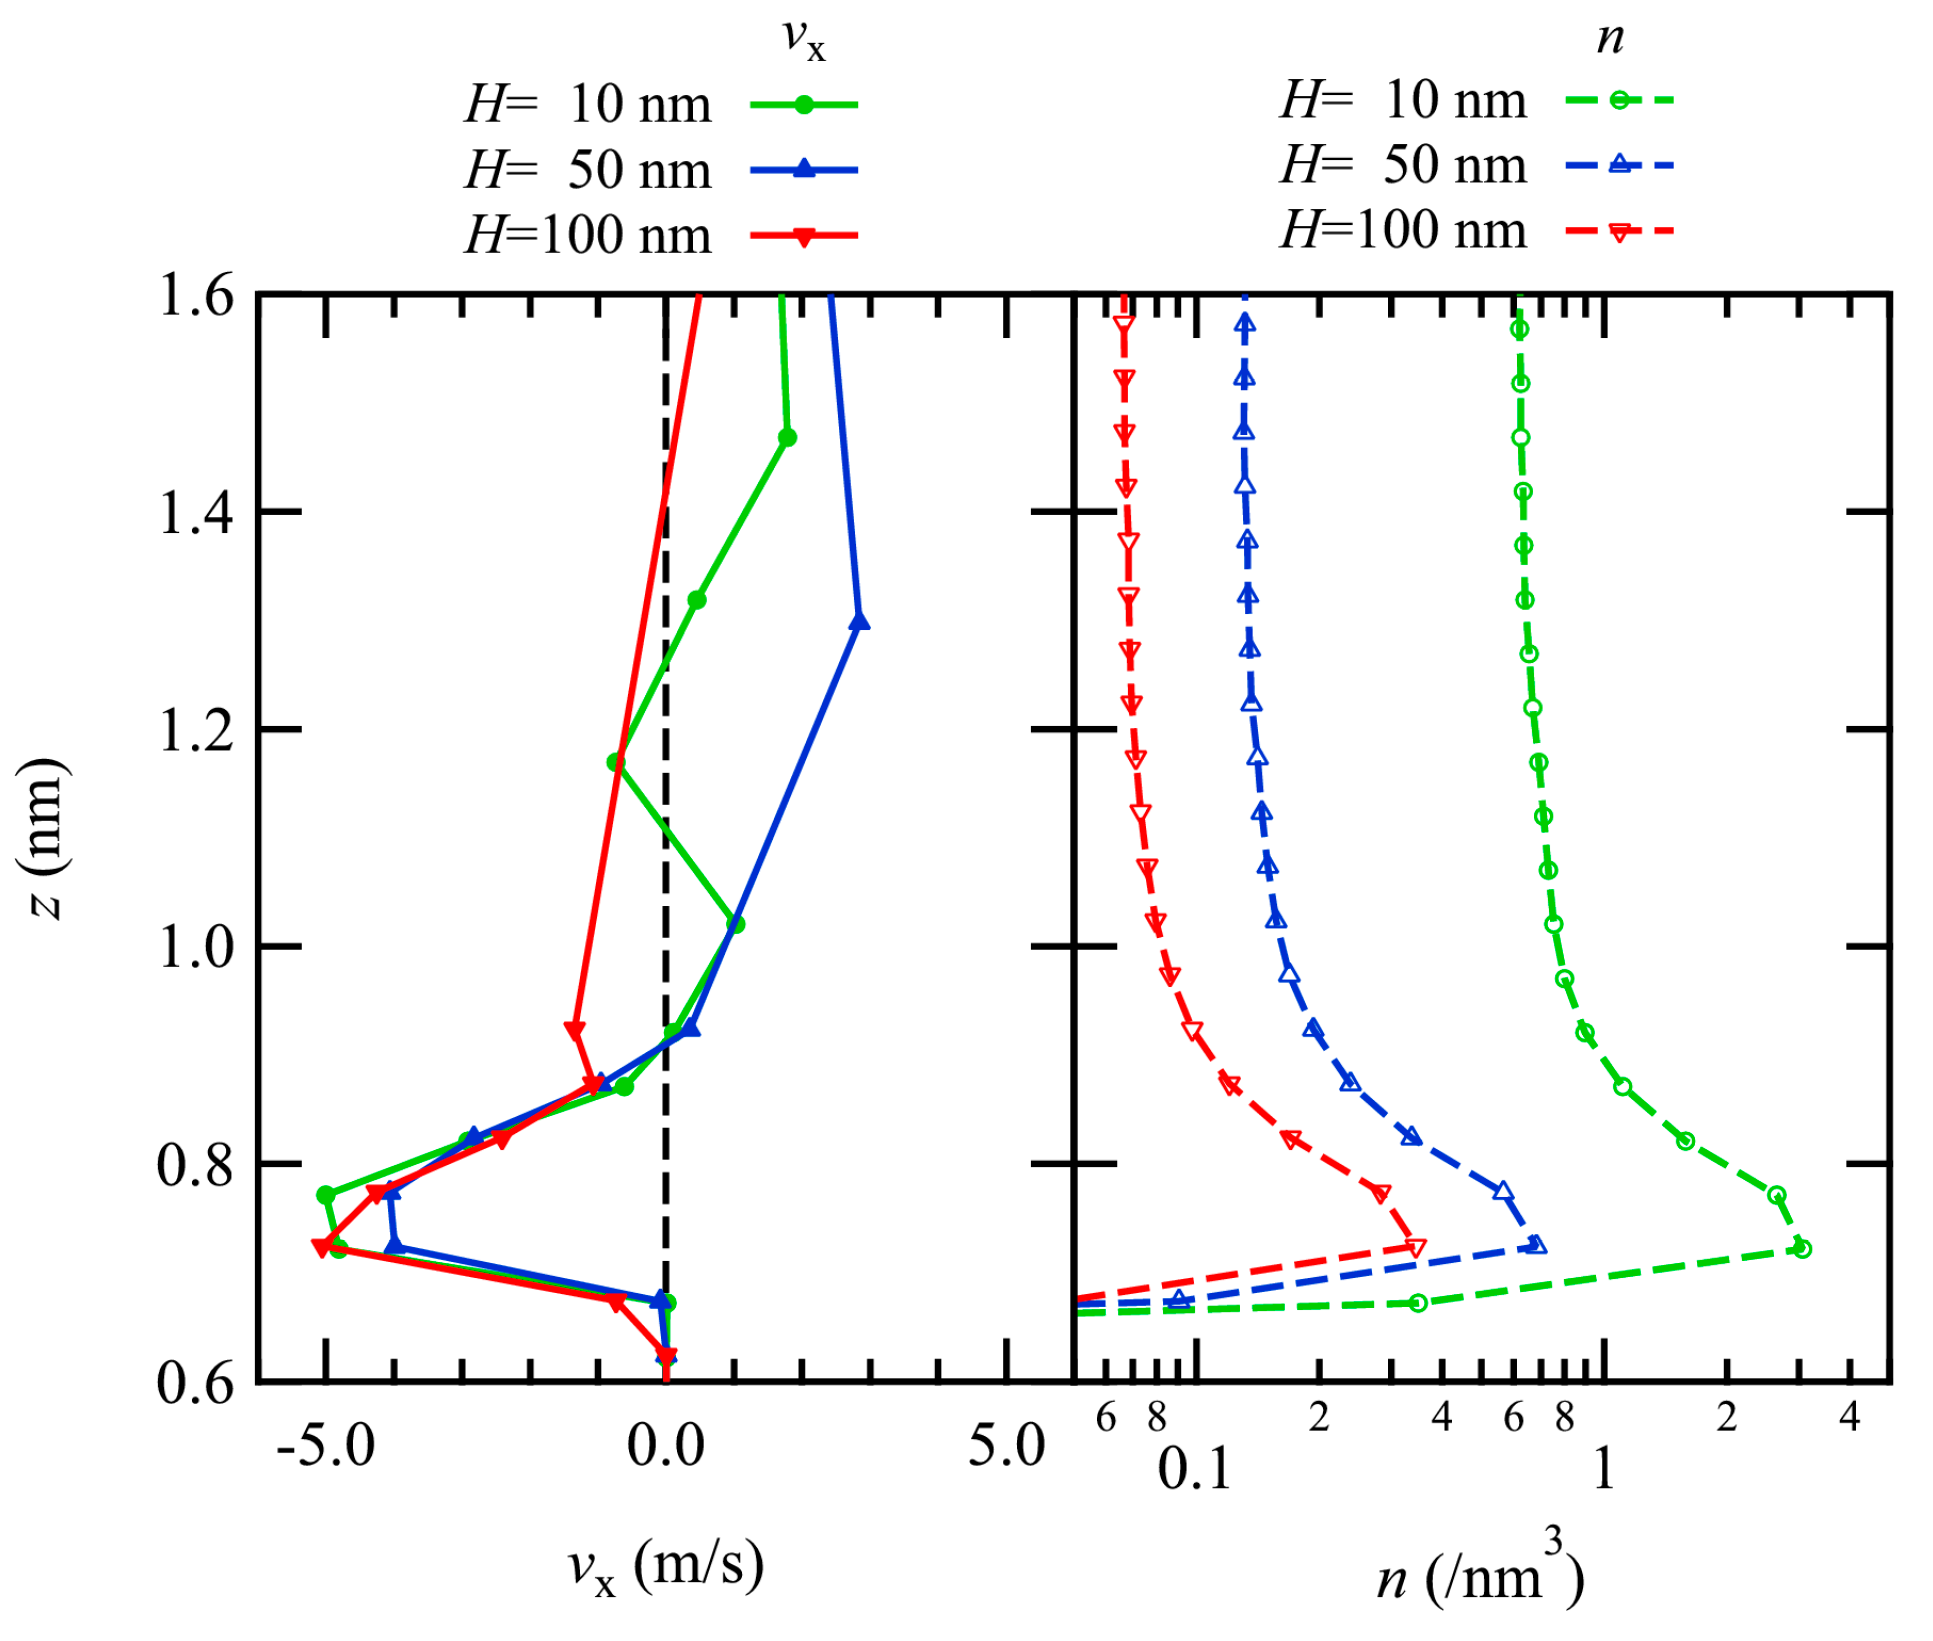
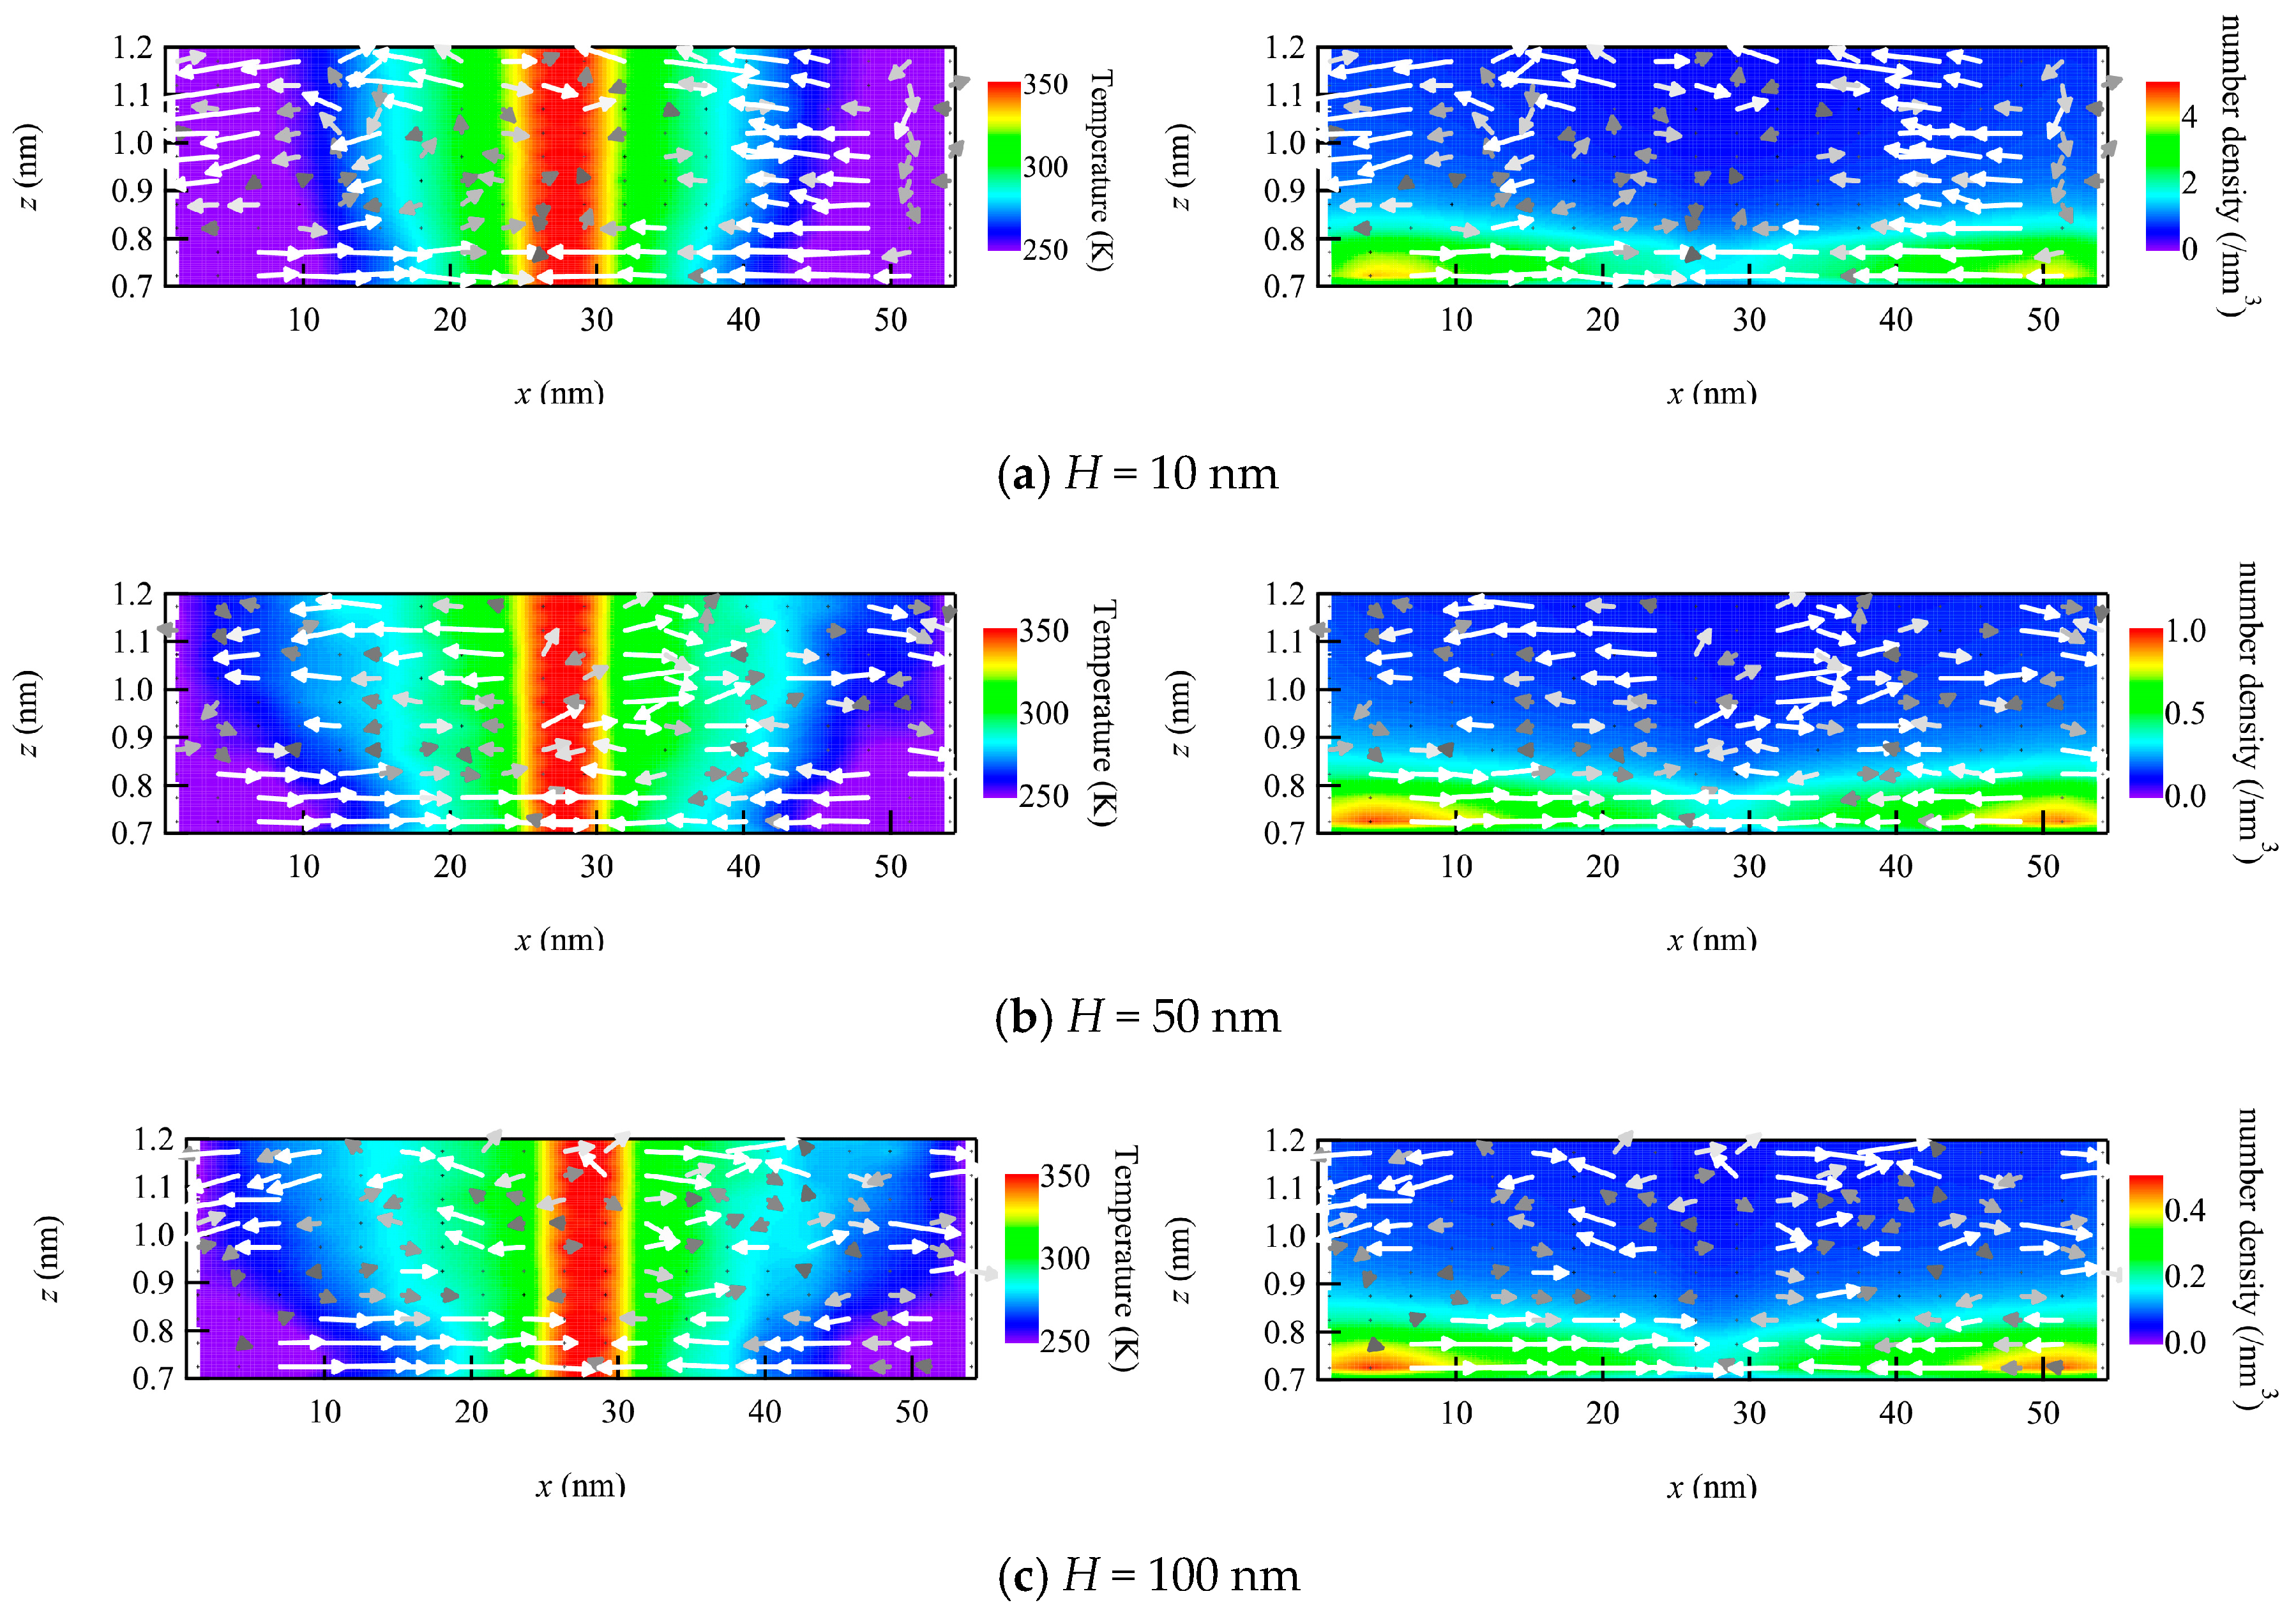
3.2. Profiles near the Wall

The thermal transpiration flow is induced by gas–surface interactions, and thus, the profiles near the channel wall were examined. In Figure 3, the profiles of the x-component of the flow velocity are plotted with the number density profiles just above the bottom channel wall.
The flow velocity profiles show that large negative values appear just above the wall, and with increasing z away from the wall surface, there is a tendency to have a flow in the positive x-direction, which is considered to be the Poiseuille flow in the bulk region as observed in the previous section. Although the number density varies with varying the channel height, the profiles of regions with negative flow velocities are almost identical in both the size and the position in the z-direction for all results regardless of the number density, i.e., dense or dilute gas. This negative flow velocity corresponds to the thermal transpiration flow, which is induced from the cold part at the right end of the channel to the hot part at the center.
The number density profiles show similar tendencies among the three number density conditions, and the sizes of the number density are almost inversely proportional to the number density. There are peaks just above the wall surface (z~0.7–0.8 nm) for all conditions, indicating the presence of an adsorption layer from the dense to the dilute gas conditions. On the other hand, these profiles exhibit a single peak and are different from the previously studied dense gas condition (H = 3 nm), where the second peak was observed. This would be due to lower number density compared with the previous result with the dense gas condition. This oscillatory behavior was also observed in the liquid thermal transpiration flow in nanotubes [25]. This layer is considered to be formed by a potential well of the gas–surface interaction. Because gas flow is considered in this study, the number density even with dense gas is quite smaller than that of the liquid flow, resulting in a single peak.
Comparing the flow velocity and the number density profiles, negative flow velocity appears at the height corresponding to the adsorption layer. This result coincides with the previous study [24] convincingly demonstrating that thermal transpiration flow is induced at the height of the adsorption layer.
To check the structure of the flow field near the wall, the velocity vector maps in the xz-plane are plotted with temperature and number density fields (Figure 4). The temperature field is almost one-dimensional, or in other words, it varies only in the x-direction and just weakly distributes in the z-direction. By increasing x, the temperature varies from low at the left end to high at the center and low again at the right end. On the other hand, the number density also exhibits a nearly one-dimensional distribution, but it varies in the z-direction, with higher values near the wall and lower in the bulk. The flow velocity vectors are mostly directed horizontally over the entire plotted region. The vectors in the bulk region at z > 0.8 nm are scattered due to the small sampling sizes, but there is a tendency to flow from the hot center part to the cold parts at both ends. Meanwhile, the velocity vectors inside the adsorption layer at 0.7 nm < z < 0.8 nm (see also Figure 2) demonstrate the horizontal flow toward the center region, i.e., from the cold to the hot part. Since the number density is relatively high in the adsorption layer, the vectors are well aligned with each other compared to vectors in the bulk. This flow is considered to be the thermal transpiration flow, and it appears regardless of the number density, i.e., from dense to dilute gas. It is important to note that these are high-Knudsen-number flows, although the number densities are different.
If we focus on the adsorption layer, where the thermal transpiration flow is induced, there is a slight gradient number density in the x-direction along the wall, where the number density of the cold part is slightly higher than that of the hot part. This is because molecules are likely to adsorb onto colder surfaces. In Figure 4, the color range of the number density map is set to be inversely proportional to the channel height. This gradient in the adsorption layer was analyzed to be greater than the inverse of the temperature gradient, which was also supported by the non-uniform distribution of the product of n and T. A similar pressure gradient in the longitudinal direction was observed in the liquid thermal transpiration flow, which was considered to be the main source of the phenomenon [25]. However, in contrast to the liquid case, it is difficult to consider the thermal transpiration flow of the gas phase as driven by this gradient. This is because the flow velocities of the thermal transpiration flow in Figure 3 are quantitatively almost identical to each other, even though the absolute gradient of the number density is different among the three conditions, i.e., dilute to dense gas. Thus, the longitudinal gradient in the adsorption layer may slightly affect the thermal transpiration flow, but the main mechanism is considered to be the same with rarefied gas flows.

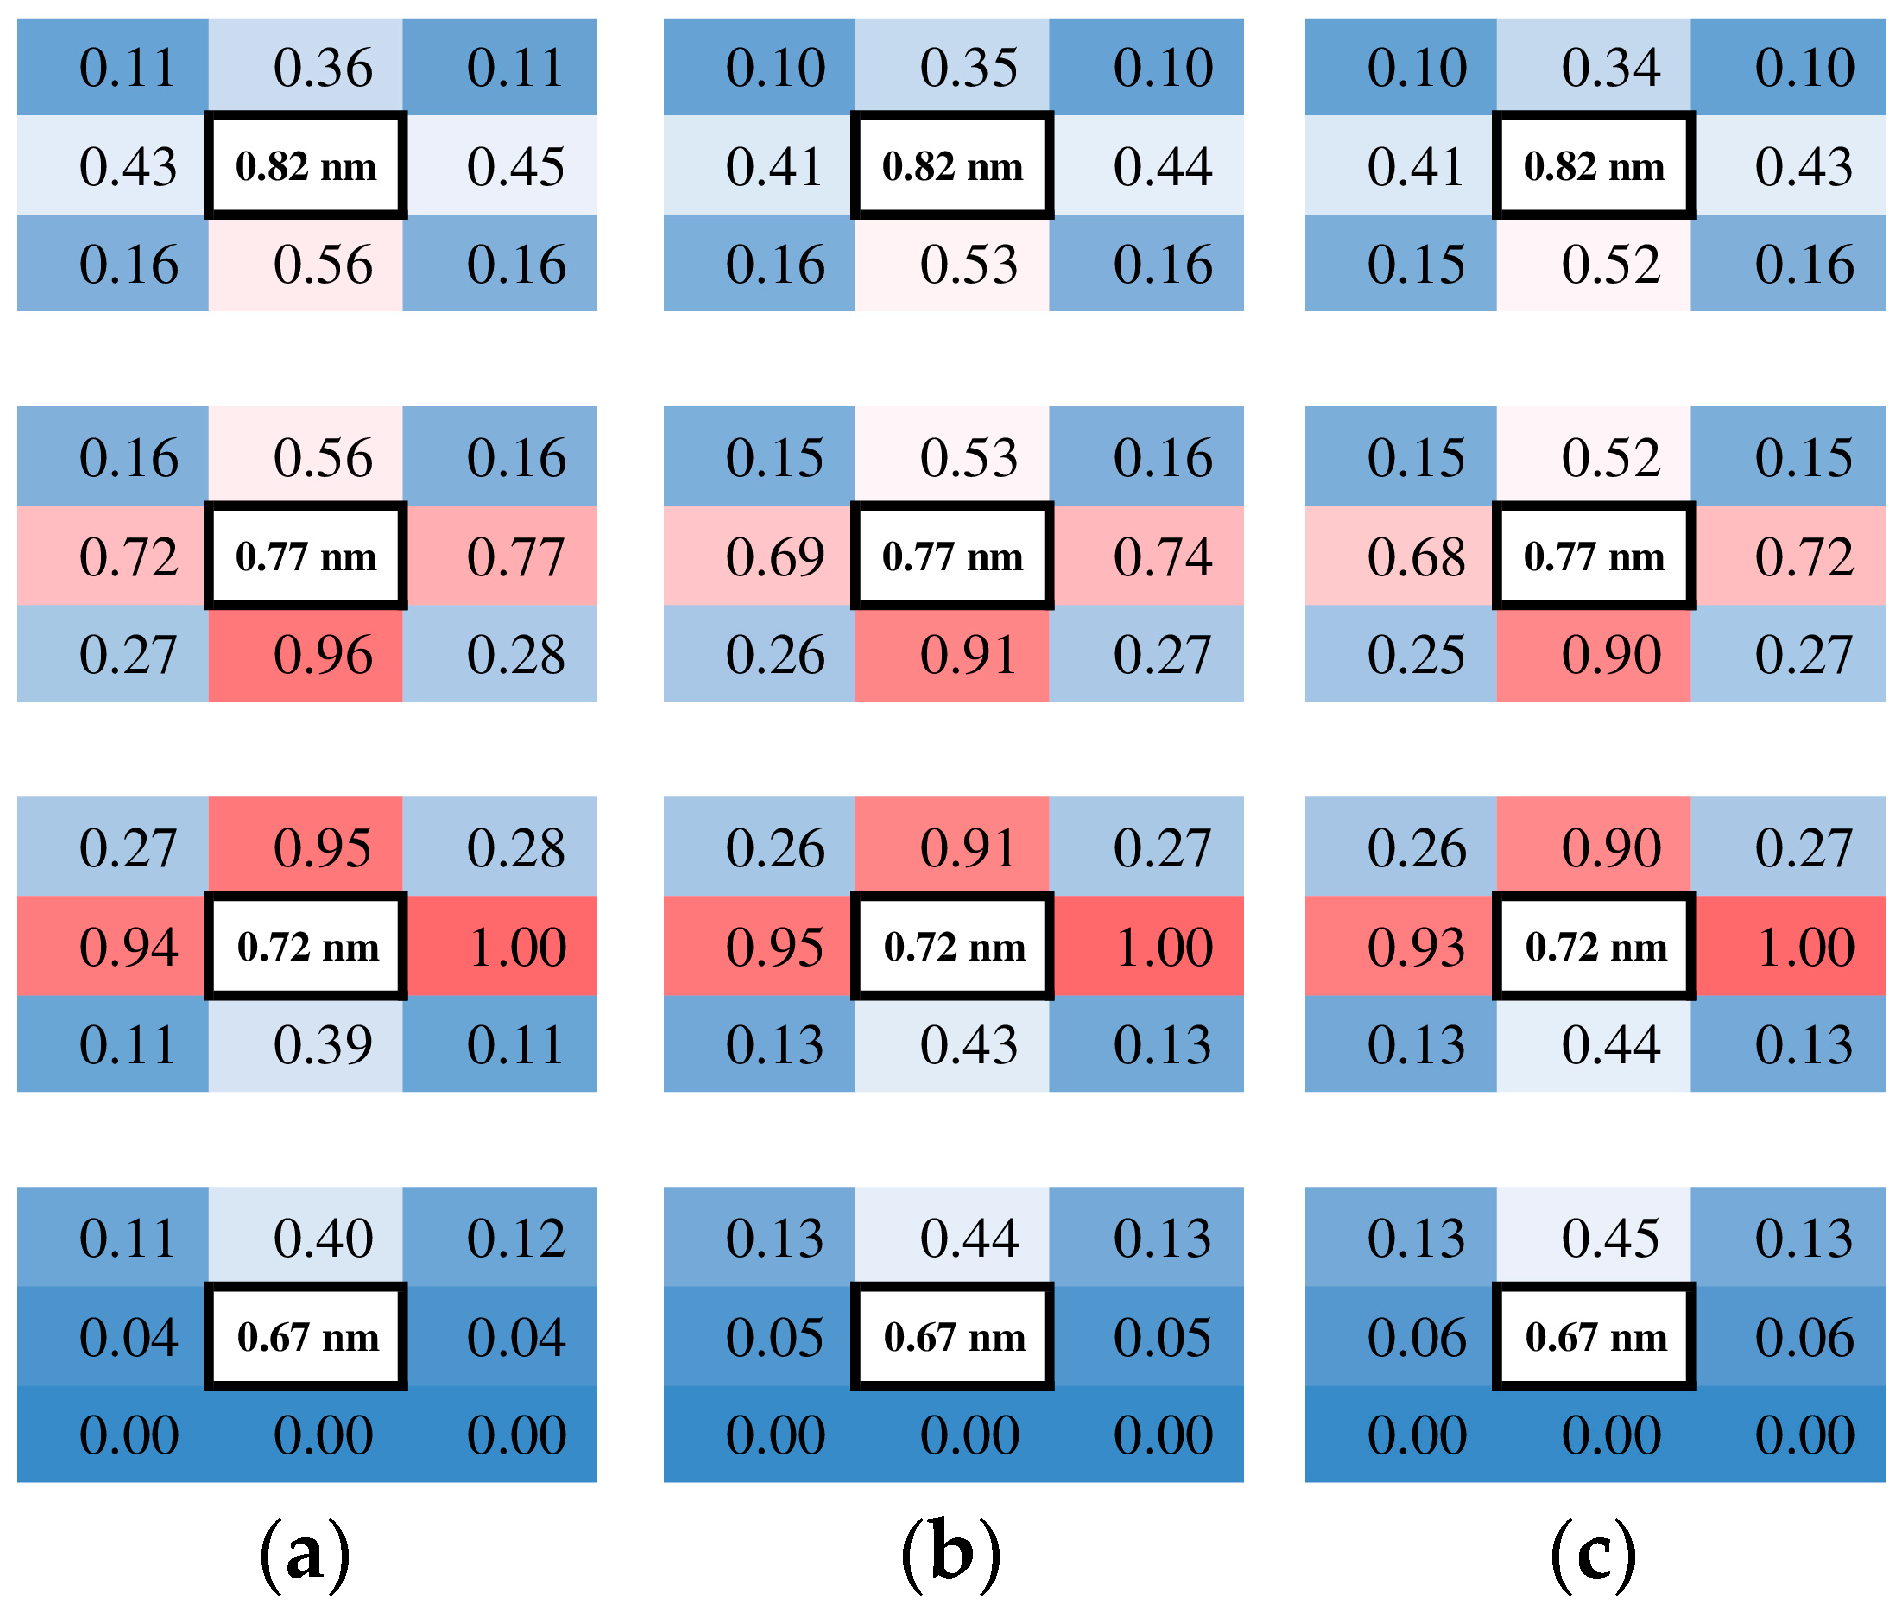
3.3. Molecular Motions near the Wall

To determine the nature of the adsorption layer, the trajectories of the molecules were examined in the layer. Since the flow was two-dimensional, the simulated domain of the xz-plane was partitioned into cells with a dimension of 0.5 × 0.5 nm2. The molecular migrations in the flow field were analyzed by counting the number of molecules that migrated from a certain cell into adjacent cells laying in eight directions after 100 steps, i.e., 0.1 ps. The number of molecules was sampled at the cells in the left sampling area at four heights in the z-direction: just above the wall, two heights in the adsorption layer, and one adjacent cell in the bulk. In Figure 5, the number of molecules migrated from a certain cell to its neighbors for three different number density conditions are shown with normalizing by the maximum of all 32 points, eight orientations at four heights, and with displaying with gradation colors.
Considering that the diagonal cells have smaller contact surfaces than the vertical and horizontal cells due to their square shape, it is reasonable to show that the relative counts of migrated molecules are smaller in the diagonal directions. In the bulk (z = 0.82 nm), molecules are migrating almost randomly in all directions, with a slightly large flux to the adjacent adsorption layer. Inside the adsorption layers (z = 0.72 and 0.77 nm), molecules migrate mainly inside the layer, while one part moves into the bulk. It implies that molecules in the adsorption layer are bouncing around in the area influenced by the attractive potential well of the wall atoms rather than sticking to the surface. This applies to any number density condition in this study from dense to dilute gas. The fluxes look balanced in the horizontal x-direction, and a minor difference was observed where the flux to the right is larger than that to the left. This difference in the flux corresponds to a macroscopic flow, which is an average of molecular motions. Remembering that they were sampled in the left sampling area, the flow towards the right corresponds to that from cold to hot, indicating the thermal transpiration flow. The relative sizes of the fluxes in Figure 5 are similar among three conditions, indicating that the similar velocity profiles are based on similar flow structures.
In this study, atomically flat crystal surfaces were employed as channel walls, which normally exhibit small accommodation of gas molecules to the surface. However, the adsorption layer was formed and there would be an efficient interaction between gas molecules and surface atoms, which is suggested by Figure 5. As a result, the thermal transpiration flow is considered to appear clearly in the flow field in Figure 4.
The results are similar for three different number density conditions, indicating the flow structure is hardly dependent on whether the flow is dense or dilute gas among these numerical analyses. Thus, the results obtained in the previous study with dense gas are considered to be valid even for dilute gas.

4. Conclusions

The thermal transpiration flow through a channel between two infinite parallel plates with nanometer-scale clearance was studied using the MD method. The solid atoms of the channel walls were explicitly simulated. To investigate the effect of the number density on the thermal transpiration flow, the condition was varied from dense to dilute gas. The number density was varied with keeping the number of simulated molecules by changing the channel height to keep the Knudsen number constant.
The flow velocity and number density profiles exhibit the Poiseuille flow in the bulk and the thermal transpiration flow near the channel wall from cold to hot parts regardless of the number density conditions, from dense to dilute gas. From the number density profiles, there is an adsorption layer just above the wall, whose position is the same for all the number density conditions. The thermal transpiration flow is observed at this adsorption layer, and three different number density conditions exhibit almost the same velocity profiles. The relative number flux of molecules moving in each direction in the adsorption layer indicates that the gas molecules are bouncing around rather than sticking to the wall. From these results, an efficient interaction between gas and surface occurs in the adsorption layer, showing a good convergence of the thermal transpiration flow in the adsorption layer even with dilute gas. There is a longitudinal gradient of the number density similarly to the liquid case, but it is not considered to be the main mechanism of the thermal transpiration flow in contrast to the liquid case. The similar flow structures were obtained from dilute to dense gas. This result suggests that MD studies on the thermal transpiration flow can be accomplished at a relatively low computational cost by using a dense gas. Further analyses on the thermal transpiration flow based on MD simulations are expected.

Author Contributions

Conceptualization, H.Y. and G.K.; methodology, G.K. and H.Y.; software, G.K.; validation, H.Y.; formal analysis, H.Y. and G.K.; data curation, H.Y.; writing—original draft preparation, H.Y.; writing—review and editing, H.Y. and G.K.; visualization, H.Y.; project administration, H.Y.; funding acquisition, H.Y. and G.K. All authors have read and agreed to the published version of the manuscript.

Funding

This research was partially supported by Tohoku University, the Collaborative Research Project of the Institute of Fluid Science (CL21APR21, CL23APR22).

Data Availability Statement

The data that support the findings of this study are available from the corresponding author upon reasonable request.

Acknowledgments

Numerical simulations were performed on the SGI Altix UV1000 and UV2000 and the Supercomputer system “AFI-NITY” at the Advanced Fluid Information Research Center, Institute of Fluid Science, Tohoku University.

Conflicts of Interest

The authors declare no conflicts of interest.

References

  1. Sone, Y. Molecular Gas Dynamics: Theory, Techniques, and Applications; Birkhäuser: Boston, MA, USA, 2007. [Google Scholar]
  2. Sharipov, F. Rarefied Gas Dynamics: Fundamentals for Research and Practice; Wiley-VCH: Weinheim, Germany, 2016. [Google Scholar]
  3. Akhlaghi, H.; Roohi, E.; Stefanov, S. A comprehensive review on micro- and nano-scale gas flow effects: Slip-jump phenomena, Knudsen paradox, thermally-driven flows, and Knudsen pumps. Phys. Rep. 2023, 997, 1–60. [Google Scholar] [CrossRef]
  4. Wang, X.; Su, T.; Zhang, W.; Zhang, S. Knudsen pumps: A review. Microsyst. Nanoeng. 2020, 26, 2–28. [Google Scholar] [CrossRef]
  5. Vargo, S.E.; Muntz, E.P. Initial results from the first MEMS fabricated thermal transpiration-driven vacuum pump. AIP Conf. Proc. 2001, 585, 502–509. [Google Scholar] [CrossRef]
  6. McNamara, S.; Gianchandani, Y.B. On-chip vacuum generated by a micromachined Knudsen pump. J. MEMS 2005, 14, 741–746. [Google Scholar] [CrossRef]
  7. An, S.; Gupta, N.K.; Gianchandani, Y.B. A Si-micromachined 162-stage two-part knudsen pump for on-chip vacuum. J. MEMS 2014, 23, 406–416. [Google Scholar] [CrossRef]
  8. Liu, J.; Gupta, N.K.; Wise, K.D.; Gianchandani, Y.B.; Fan, X. Demonstration of motionless Knudsen pump based micro-gas chromatography featuring micro-fabricated columns and on-column detectors. Lab Chip 2011, 11, 3487–3492. [Google Scholar] [CrossRef] [PubMed]
  9. Nakaye, S.; Sugimoto, H. Demonstration of a gas separator composed of Knudsen pumps. Vacuum 2016, 125, 154–164. [Google Scholar] [CrossRef]
  10. Kugimoto, K.; Hirota, Y.; Yamauchi, T.; Yamaguchi, H.; Niimi, T. Design and demonstration of Knudsen heat pump without moving parts free from electricity. Appl. Energy 2019, 250, 1260–1269. [Google Scholar] [CrossRef]
  11. Porodnov, B.T.; Kulev, A.N.; Tuchevetov, F.T. Thermal transpiration in a circular capillary with a small temperature difference. J. Fluid Mech. 1978, 88, 609–622. [Google Scholar] [CrossRef]
  12. Rojas-Cárdenas, M.; Graur, I.; Perrier, P.; Méolans, J.G. Thermal transpiration flow: A circular cross-section microtube submitted to a temperature gradient. Phys. Fluids 2011, 23, 031702. [Google Scholar] [CrossRef]
  13. Yamaguchi, H.; Rojas-Cárdenas, M.; Perrier, P.; Graur, I.; Niimi, T. Thermal transpiration flow through a single rectangular channel. J. Fluid Mech. 2014, 744, 169–182. [Google Scholar] [CrossRef]
  14. Rojas-Cárdenas, M.; Graur, I.; Perrier, P.; Méolans, J.G. Time-dependent experimental analysis of a thermal transpiration rarefied gas flow. Phys. Fluids 2013, 25, 072001. [Google Scholar] [CrossRef]
  15. Yamaguchi, H.; Perrier, P.; Ho, M.T.; Méolans, J.G.; Niimi, T.; Graur, I. Mass flow rate measurement of thermal creep flow from transitional to slip flow regime. J. Fluid Mech. 2016, 795, 690–707. [Google Scholar] [CrossRef]
  16. Sharipov, F.; Seleznev, V. Data on Internal Rarefied Gas Flows. J. Phys. Chem. Ref. Data 1998, 27, 657–706. [Google Scholar] [CrossRef]
  17. Sharipov, F.; Bertoldo, G. Poiseuille flow and thermal creep based on the Boltzmann equation with the Lennard-Jones potential over a wide range of the Knudsen number. Phys. Fluids 2009, 21, 067101. [Google Scholar] [CrossRef]
  18. Babac, G.; Dongari, N.; Zhang, Y.; Reese, J.M. Thermal transpiration of nanoscale gas flow. AIP Conf. Proc. 2012, 1501, 946–953. [Google Scholar] [CrossRef]
  19. Francis, J.T.; Sathian, S.P. Thermal transpiration: A molecular dynamics study. AIP Conf. Proc. 2014, 1628, 901–908. [Google Scholar] [CrossRef]
  20. Akhlaghi, H.; Roohi, E. Mass flow rate prediction of pressure-temperature-driven gas flows through micro/nanoscale channels. Contin. Mech. Thermodyn. 2014, 26, 67–78. [Google Scholar] [CrossRef]
  21. Lockerby, D.A.; Patronis, A.; Borg, M.K.; Reese, J.M. Asynchronous coupling of hybrid models for efficient simulation of multiscale systems. J. Comput. Phys. 2015, 284, 261–272. [Google Scholar] [CrossRef]
  22. Wang, P.; Su, W.; Wu, L. Thermal transpiration in molecular gas. Phys. Fluids 2020, 32, 082005. [Google Scholar] [CrossRef]
  23. Akhlaghi, H.; Balaj, M.; Roohi, E. Hydrodynamic behaviour of micro/nanoscale Poiseuille flow under thermal creep condition. Appl. Phys. Lett. 2013, 103, 073108. [Google Scholar] [CrossRef]
  24. Yamaguchi, H.; Kikugawa, G. Molecular dynamics study on flow structure inside a thermal transpiration flow field. Phys. Fluids 2021, 33, 012005. [Google Scholar] [CrossRef]
  25. Chapman, S.; Cowling, T.G. The Mathematical Theory of Non-Uniform Gases; Cambridge University Press: London, UK, 1970. [Google Scholar]
  26. Sahebi, M.; Azimian, A.R. A molecular dynamics study about the mechanisms of liquid thermal transpiration flow in nanotubes. Int. J. Therm. Sci. 2019, 136, 9–14. [Google Scholar] [CrossRef]
  27. Humphrey, T.; Dalke, A.; Schulten, K. VMD: Visual molecular dynamics. J. Mol. Graphics Modell. 1996, 14, 33–38. [Google Scholar] [CrossRef]
  28. Bird, G. Molecular Gas Dynamics and the Direct Simulation of Gas Flows; Clarendon Press: Oxford, UK, 1994. [Google Scholar]
  29. Kikugawa, G.; Ando, S.; Suzuki, J.; Naruke, Y.; Nakano, T.; Ohara, T. Effect of the computational domain size and shape on the self-diffusion coefficient in a Lennard-Jones liquid. J. Chem. Phys. 2015, 142, 024503. [Google Scholar] [CrossRef]
  30. Plimpton, S. Fast Parallel Algorithms for Short-Range Molecular Dynamics. J. Comput. Phys. 1995, 117, 1–19. [Google Scholar] [CrossRef]
  31. Prabha, S.K.; Sathian, S.P. Molecular-dynamics study of Poiseuille flow in a nanochannel and calculation of energy and momentum accommodation coefficients. Phys. Rev. E 2012, 85, 041201. [Google Scholar] [CrossRef]
Figure 1. A schematic of the simulated domain is described. The temperature in the blue parts at both ends is low, while the temperature in the red part is high. The temperature of the wall is controlled based on the position by linearly interpolating between the cold and hot parts. The data are sampled in the green part at the middle of the blue and red parts.
Fluids 09 00012 g001
Figure 2. Profiles of the x-component of velocity across the channel are plotted with a normalized height z/H to capture bulk trends. The results of H = 10, 50, and 100 nm are plotted in green, blue, and red and compared with the results of H = 3 nm, shown in black.
Fluids 09 00012 g002
Figure 3. Profiles of the x-component of velocity (left) with the number density on a log scale (right) in the vicinity of the lower channel wall are plotted. The results of H = 10, 50, and 100 nm are plotted in green, blue, and red.
Fluids 09 00012 g003
Figure 4. Velocity vector maps with temperature map (left) and number density map (right) in the vicinity of the wall plotted to compare different number density conditions using the channel heights H of (a) 10, (b) 50, and (c) 100 nm.
Fluids 09 00012 g004
Figure 5. Relative numbers of molecules moving in each direction at four heights in the z direction just above the wall sampled in the left sampling area. The background color of the cells is a gradation such that 0 (blue), 0.5 (white), and 1 (red). (a) H = 10 nm; (b) H = 50 nm; (c) H = 100 nm.
Fluids 09 00012 g005
Disclaimer/Publisher’s Note: The statements, opinions and data contained in all publications are solely those of the individual author(s) and contributor(s) and not of MDPI and/or the editor(s). MDPI and/or the editor(s) disclaim responsibility for any injury to people or property resulting from any ideas, methods, instructions or products referred to in the content.

