Abstract
Bubble columns (BCs) are widely used in the chemical industry. In many industrial applications, these important gas-liquid contactors operate in a churn-turbulent flow regime. In principle, it is essential to determine the operating conditions in every BC reactor, in which local isotropic turbulence is established. In this work, it was demonstrated that several different parameters (Kolmogorov entropy, correlation dimension and novel hybrid index) follow a monotonic decreasing trend. This finding could be explained by the constantly increasing coalesced bubble size, which brings more order into the gas-liquid system and thus any entropic or chaotic parameter should decrease with the increase in the superficial gas velocity Ug. The profiles of the new parameters in various gas-liquid systems were studied. They were extracted from different pressure signals (gauge or absolute). In this research, BCs of different diameter and equipped with different gas distributors were used. It was demonstrated that the studied parameters could be successfully correlated with the length scale of the micro eddies and thus the Ug range of applicability of the local isotropic turbulence theory under various operating conditions was indirectly determined. The overall gas holdup profiles were analyzed and, based on the exponent of the Ug value, it was found that in the aqueous solutions of alcohols studied, the conditions in the bubble bed (BB) are homogeneous, whereas in the air-tap water system aerated in different BCs, the conditions in the BB are heterogeneous. This result implies that the local isotropic turbulence conditions predominate mainly around the corresponding measurement positions.
1. Introduction
Bubble columns (BCs) are simple but very effective gas-liquid contactors. They are frequently used in both the chemical and petrochemical industries since they provide excellent mass and heat transfer characteristics. BCs are also used in modern applications such as the aeration of organic organisms in bioreactors, indirect liquefaction of coal slurries to produce synthetic fuels via Fischer–Tropsch synthesis, and gasification of solvents for chemical reactions. In many cases, the turbulence improves the main characteristics of the BC’s performance. In a buoyancy driven BC, bubble-induced turbulence produces a well-mixed gas-liquid dispersion.
These gas-liquid reactors exhibit excellent hydrodynamics due to their capability to operate in different flow regimes (FRs) with varying turbulence intensity. Most of the conditions in the BC operation are inherently turbulent due to the high Reynolds numbers. The presence of bubbles modifies the liquid turbulence characteristics such as turbulence intensity or turbulent kinetic energy and the associated eddy length and time scales. The resulting turbulence due to liquid and gas phase interactions is quite effective in controlling the BC’s performance. The control could be in terms of increasing the mixing at both the macro and micro scales involving both axial and radial dispersion and interphase mass and heat transfer processes. The turbulence can be produced by means of both wake formation and vortex shedding. Such a flow disturbance enhances the turbulence. Simultaneous velocity measurements of both liquid and gas phases, along with an instantaneous bubble size and its distribution estimation, are required in order to capture the chaotic nature of the turbulent bubbly flows.
Usually, the gas-liquid dispersion is unstable and this generates liquid circulation. Although there are three main FRs, from an industrial viewpoint, the most important is the heterogeneous (churn-turbulent) FR. It is characterized by bubble coalescence, vigorous mixing, wide bubble size distribution, parabolic profiles of both gas holdup and liquid velocity, etc. Multiple circulation cells [1] or liquid macro-circulation [2] are frequently observed in this FR. In addition, the bubble-induced turbulence in this FR is significantly enhanced. It is noteworthy that the time-averaged radial liquid velocity and gas holdup profiles are not uniform in the heterogeneous FR. Both parameters observe a well-pronounced maximum near the column’s center. The negative value of the liquid velocity near the wall implies the occurrence of liquid recirculation, which is typical for the heterogeneous FR. According to Sathe et al. [3], the onset of the heterogeneous FR occurs at 0.05 m/s in the case of very uniform gas distribution, a column diameter larger than 0.15 m and a high aspect ratio, enabling a fully developed velocity profile.
The rise of gas bubbles is hindered by the increase in liquid turbulence [3]. In principle, the turbulence in BCs can be subdivided into bubble-induced turbulence and turbulence due to macro-circulation in the bubble bed (BB). In the first case, the motion of bubbles generates turbulence in the surrounding liquid and the turbulent kinetic energy is generated by the wakes behind the bubbles [3]. According to Sathe et al. [3], the small-scale turbulence is generated from both the bubble wakes and the fluctuating bubble velocities. On the other hand, the large-scale turbulence is generated by multiple circulation cells [1] in the BB, which occur due to the non-uniform distribution of gas holdup. Both the gas distributor’s (GD) design and the column’s diameter affect the shape, size and energy of large-scale circulations [3]. The bubble-induced turbulence is affected by the bubble size distribution and the important phenomena of bubble coalescence and break-up. On the other hand, it affects the rise velocities of bubbles and the rate of turbulence generation [3]. There is a large variation in the length scale of the turbulence in BCs. The bubble-induced turbulence is characterized by a wide range of length scales of turbulence generation. In the inertial subrange, turbulence is generated via the shedding of vortices from bubble wake and small-scale bubble velocity fluctuations. Usually, the turbulence is generated not only from the bubble wakes but also from the motion of bubble clusters [3].
The nature of the bubble trajectories depends on the superficial gas velocity Ug, orifice diameter (of the GD), hydrostatic head of liquid, column’s aspect ratio and the physicochemical properties of the phases [3]. In the heterogeneous FR, there is an upflow in the BB core and a downflow in the BB annulus. This flow pattern causes liquid circulation, which, in turn, implies heterogeneity. Sathe et al. [3] argue that the bubble-induced turbulence strongly affects the bubble characteristics and thus the turbulence. Sathe et al. [3] have reached the interesting conclusion that there is a hindrance of the bubble rise velocity due to the turbulence. In addition, the authors have defined a “pseudo turbulence”, which is formed by the interaction between the sinuous trajectories of bubbles. Sathe et al. [3] argue that the structure of the small-scale turbulence generated by the bubbles is independent of the GD design. Vieira et al. [4] have observed a rotational flow pattern in the middle of BB. This phenomenon was more pronounced in the lower zone of the BB.
In the literature hitherto, only the behavior of the classical parameters (bubble diameter, gas holdup, gas-liquid interfacial area, gas and liquid dispersion coefficients, volumetric liquid-phase mass transfer coefficients, heat transfer coefficients, etc.) has been exhaustively studied. In the past two decades, new entropic parameters (Kolmogorov entropy, information entropy, reconstruction entropy, modified Shannon entropy, etc.) have been introduced [5]. However, their behavior under different operating conditions and especially their radial profiles have not been completely studied. Most of these parameters have been extracted from only one signal type (usually pressure). In this work, the behavior of these new parameters as a function of Ug will be studied. Based on the monotonously decreasing entropic profiles predominant in the churn-turbulent FR, important conclusions will be drawn. In principle, another FR identifier is also available. It is a new statistical parameter developed by Nedeltchev et al. [6]. However, its behavior will not be discussed in the present work since it is not sensitive to the local isotropic turbulence conditions.
By means of different chaotic invariants and a novel hybrid index, the turbulence (coherent structures) in the BB will be characterized. In the heterogeneous FR, the turbulence is associated with different vortical structures. In addition, different coherent structures [7] are formed. More information about the vortex–bubble interaction in the whole range of bubble sizes should be obtained by means of new and varied experimental data. Additional fundamental information about the turbulent flow structures is needed in the BC literature. One of the methods used to characterize the liquid turbulence is the calculation of its energy spectrum from the velocity field obtained from particle image velocimetry with fast Fourier transformation. In principle, the methods of spectral analysis are discussed in full detail in the works of Risso [8], Roghair et al. [9], Mezui et al. [10], etc. When the spectra of the pressure fluctuations are plotted as a function of the reciprocal of the wavelength, a subrange with a slope of −5/3 is observed, which is a signature of a classical turbulent inertial subrange. Some researchers calculate the power spectral density function and they study its variation versus frequency. In this work, however, the liquid turbulence will be characterized by means of reliable chaotic parameters such as Kolmogorov entropy (KE) and correlation dimension (CD), as well as the novel hybrid index (NHI).
1.1. Main Parameters for Turbulence Analysis in This Work
Kolmogorov entropy (KE) is a part of the nonlinear chaos theory. This parameter can be applied to any important signal recorded in a BC since this gas-liquid reactor can be considered a chaotic system. The KE values can provide important insights into the complex BC hydrodynamics. The chaotic system is sensitive to small changes in the initial conditions and it is thus characterized by a limited predictability. The signal is reconstructed in the phase space and the chaotic system is represented by a so-called strange attractor. The attractor is not finite and the system never returns to the same state. Van den Bleek and Schouten [11] have developed a reliable technique for an attractor’s reconstruction.
The KE quantifies the degree of unpredictability of the system. It characterizes the rate of information loss of the system and thus it accounts for the accuracy of the initial conditions that is required to predict the evolution of the system over a given time interval [11]. When the KE value is positive (and not infinite), the system is considered chaotic. The KE value depends on the sampling frequency and a parameter that characterizes the average number of steps it takes for an arbitrary pair of state vectors to exponentially deviate in phase space. The deviation is estimated on the basis of the maximum norm definition and selection of a proper cut-off length [12]. The KE value is large for very irregular dynamic behavior, small in the case of periodic-like behavior, and zero in the case of completely periodic systems. Usually, the KE parameter is applied for FR identification since it is sensitive enough for the changes in the operating conditions. Some sudden and dramatic changes in the nonlinear system may give rise to the complex behavior called chaos. The time-dependent behavior of the BC is described as chaotic when the behavior is aperiodic and is apparently random.
The correlation dimension (CD) is calculated from the correlation integral [13]. The latter counts the number of pairs of points on the attractor whose distance is smaller than the cut-off length. It scales following a power law. The first step in the calculation of the correlation integral is the reconstruction of the attractor in the state space. Different interpoint distances are tested and, based on them, the correlation integral and thus CD are estimated.
The novel hybrid index (NHI) is a new dimensionless parameter capable of identifying the main transition velocities in the BC operation. Except for the gas maldistribution zone, in the other main FRs, the NHI values vary in the range from 0 to 1. The NHI algorithm [14] is a mixture between statistics (average absolute deviation (AAD)) and the information entropy theory. Based on this reliable theory, the information amount (IA) is calculated.
As a first step, in this work, the important pressure signal consisting of 10,000 points was divided into 10 intervals and then the local AAD in each interval was calculated. AAD is a robust statistical estimator of the data’s width around the mean. It is the sum of all absolute differences |xj − xmean| divided by the total number of points in the time series. x corresponds to a single value in the pressure signal, whereas xmean corresponds to the mean of all pressure values (10,000 points).
The probability Pi of having such a data sequence yielding a particular AAD in each interval was calculated as a ratio of the AAD in that period divided by the sum of all AAD values:
The information amount IAi in each interval was calculated as follows:
IAi = − log (Pi)
The new hybrid index (NHI) represents the following ratio:
At low Ug values, the NHI is much higher than 1. This is typical for a gas maldistribution state. However, at Ug values beyond 0.025 m/s, it varies between 0 and 1. The NHI value characterizes the statistical non-uniformity in the measured signal. At the main regime transition velocity, the signals are usually better ordered, i.e., statistically more uniform [5].
1.2. Theory of Local Isotropic Turbulence
According to this important theory, the large macro-scale eddies contain the major part of the energy but they contribute to small extent to viscous energy dissipation [15]. The primary eddies are unstable and disintegrate into smaller eddies until all their energy is dissipated by viscous flow. However, the motion of the highly energetic large eddies generates micro-scale eddies by means of which the energy is dissipated by viscous forces. The hydrodynamic properties of the small eddies are determined by the local energy dissipation per unit mass of fluid. In the case of high Reynolds number, the energy dissipation by the micro-scale eddies is locally isotropic. In the model of Deckwer [15], the energy dissipation is mainly governed by viscous forces. The velocity scale of the micro-scale eddies is proportional to the kinematic viscosity and the energy dissipation rate per unit mass, VS = (νϵ)0.25, whereas the length scale (LS) of the micro-scale eddies is proportional to (ν3/ϵ)0.25. Both VS and LS are key characteristics of the micro-scale eddies. It is noteworthy that Rice [16] postulated that one of the substantial prerequisites for the local isotropic turbulence is that the turbulent parameter LS should be equivalent to the mean bubble diameter. According to the author, this is especially valid for truly vertical BCs with high-quality GDs. Another approach to identify the local isotropic turbulence conditions is to check whether the turbulent kinetic energy follows Kolmogorov’s universal slope of −5/3 in the inertial subrange. Usually, grids are known to produce ideal homogeneous and isotropic turbulence conditions. It is noteworthy that the local isotropic turbulence theory has been employed for deriving correlations for the prediction of the Sauter-mean bubble diameter and specific interfacial area [17] as well as liquid-phase axial dispersion coefficient and volumetric liquid-phase mass transfer coefficient [18].
The main objective of this work is to identify the conditions for applicability of the local isotropic turbulence theory based on the above-described reliable parameters (KE, CD and NHI). The ranges of the superficial gas velocities Ug and Reynolds numbers Re for every investigated case will be specified. The gas holdup profiles will be studied in order to determine the global degree of turbulence in the BB.
2. Experimental Setups and Conditions
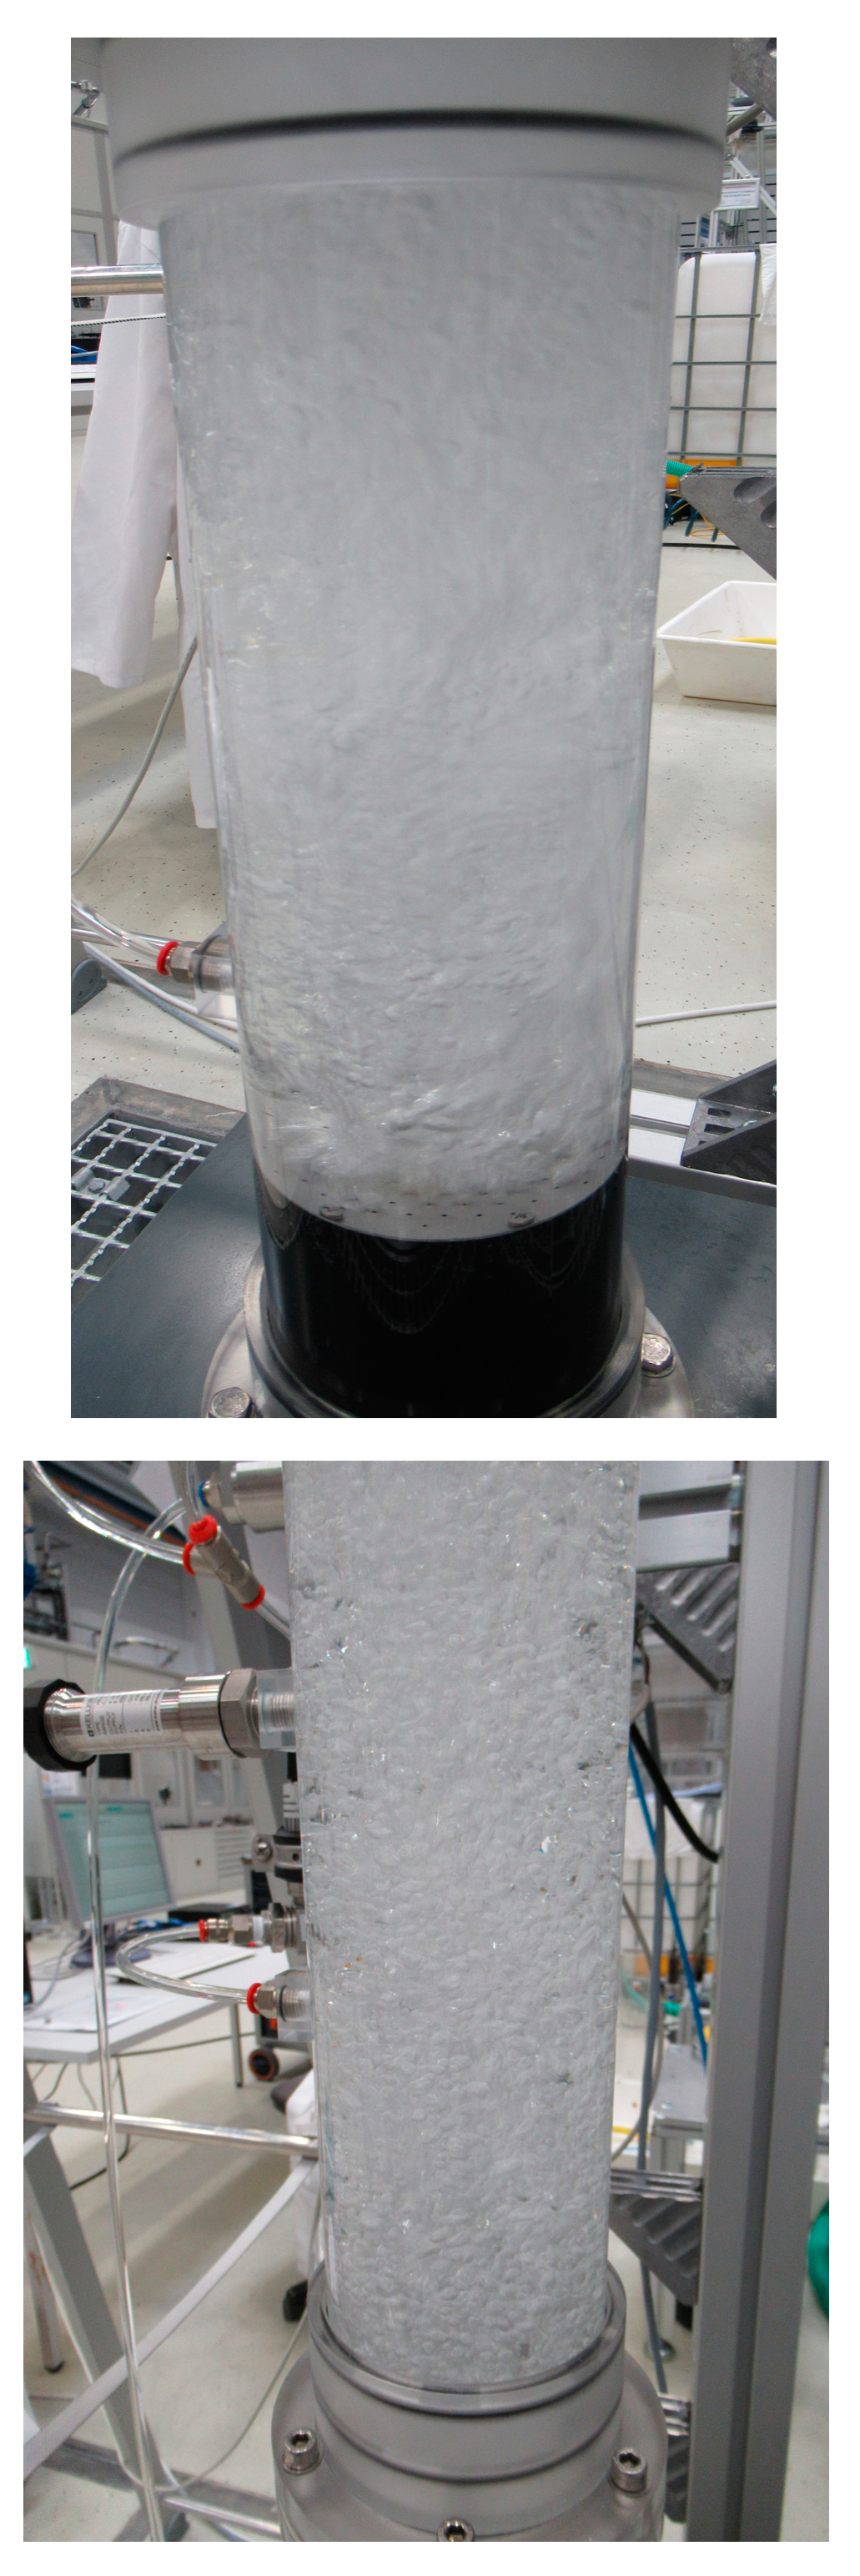
The time-dependent pressure measurements (10,000 points) in a BC (0.1 m in ID) operated with the systems’ air and aqueous solutions of alcohols (1-butanol, the NHI profile has been extracted, or 3-hexanol, 0.5 vol. %) have been recorded by means of a gauge pressure (GP) sensor (pressure transmitter PR-33X, Keller AG, Winterthur, Switzerland). It was installed at an axial position z of 0.65 m above the GD (perforated plate, 96 orifices × ∅ 1.0 mm). The GP transducer was flush mounted with the wall and strategically positioned in the fully developed region of the BB, in which a well-established flow structure (pattern) was observed. These GP fluctuations were further treated using the NHI algorithm [14]. Figure 1 shows the performance of both the lower and upper sections (the position of the sensor can be seen on the left upper side) of the BC (0.1 m in ID) operated with an aqueous solution of 3-hexanol (0.5 vol. %).

Figure 1.
Performance of the lower section (see the top figure) and upper section (see the bottom figure) of a BC (0.1 m in ID) operated with an aqueous solution of 3-hexanol (0.5 vol. %) at ambient conditions. The photos were shot at different Ug values.
In addition, the absolute pressure (AP) measurements (64,000 points) have been recorded in an air-tap water BC (0.19 m, 0.38 and 0.8 m in ID) equipped with a porous-plate GD. The exact axial positions are as follows: in the smallest column, z = 1.92 m; in the middle column, z = 0.9 m; and in the large column, z = 1.34 m. In principle, the pressure transducers have always been installed in the fully developed region of the BB, i.e., much higher than the entrance (equilibrium) zone. The AP piezo-electric transducer (type 7261, Kiestler GmbH, Switzerland) was equipped with an analog low-pass filter (20 Hz). In order to measure the AP fluctuations in the center of the BB, a small tube was attached to the pressure transducer.
3. Results
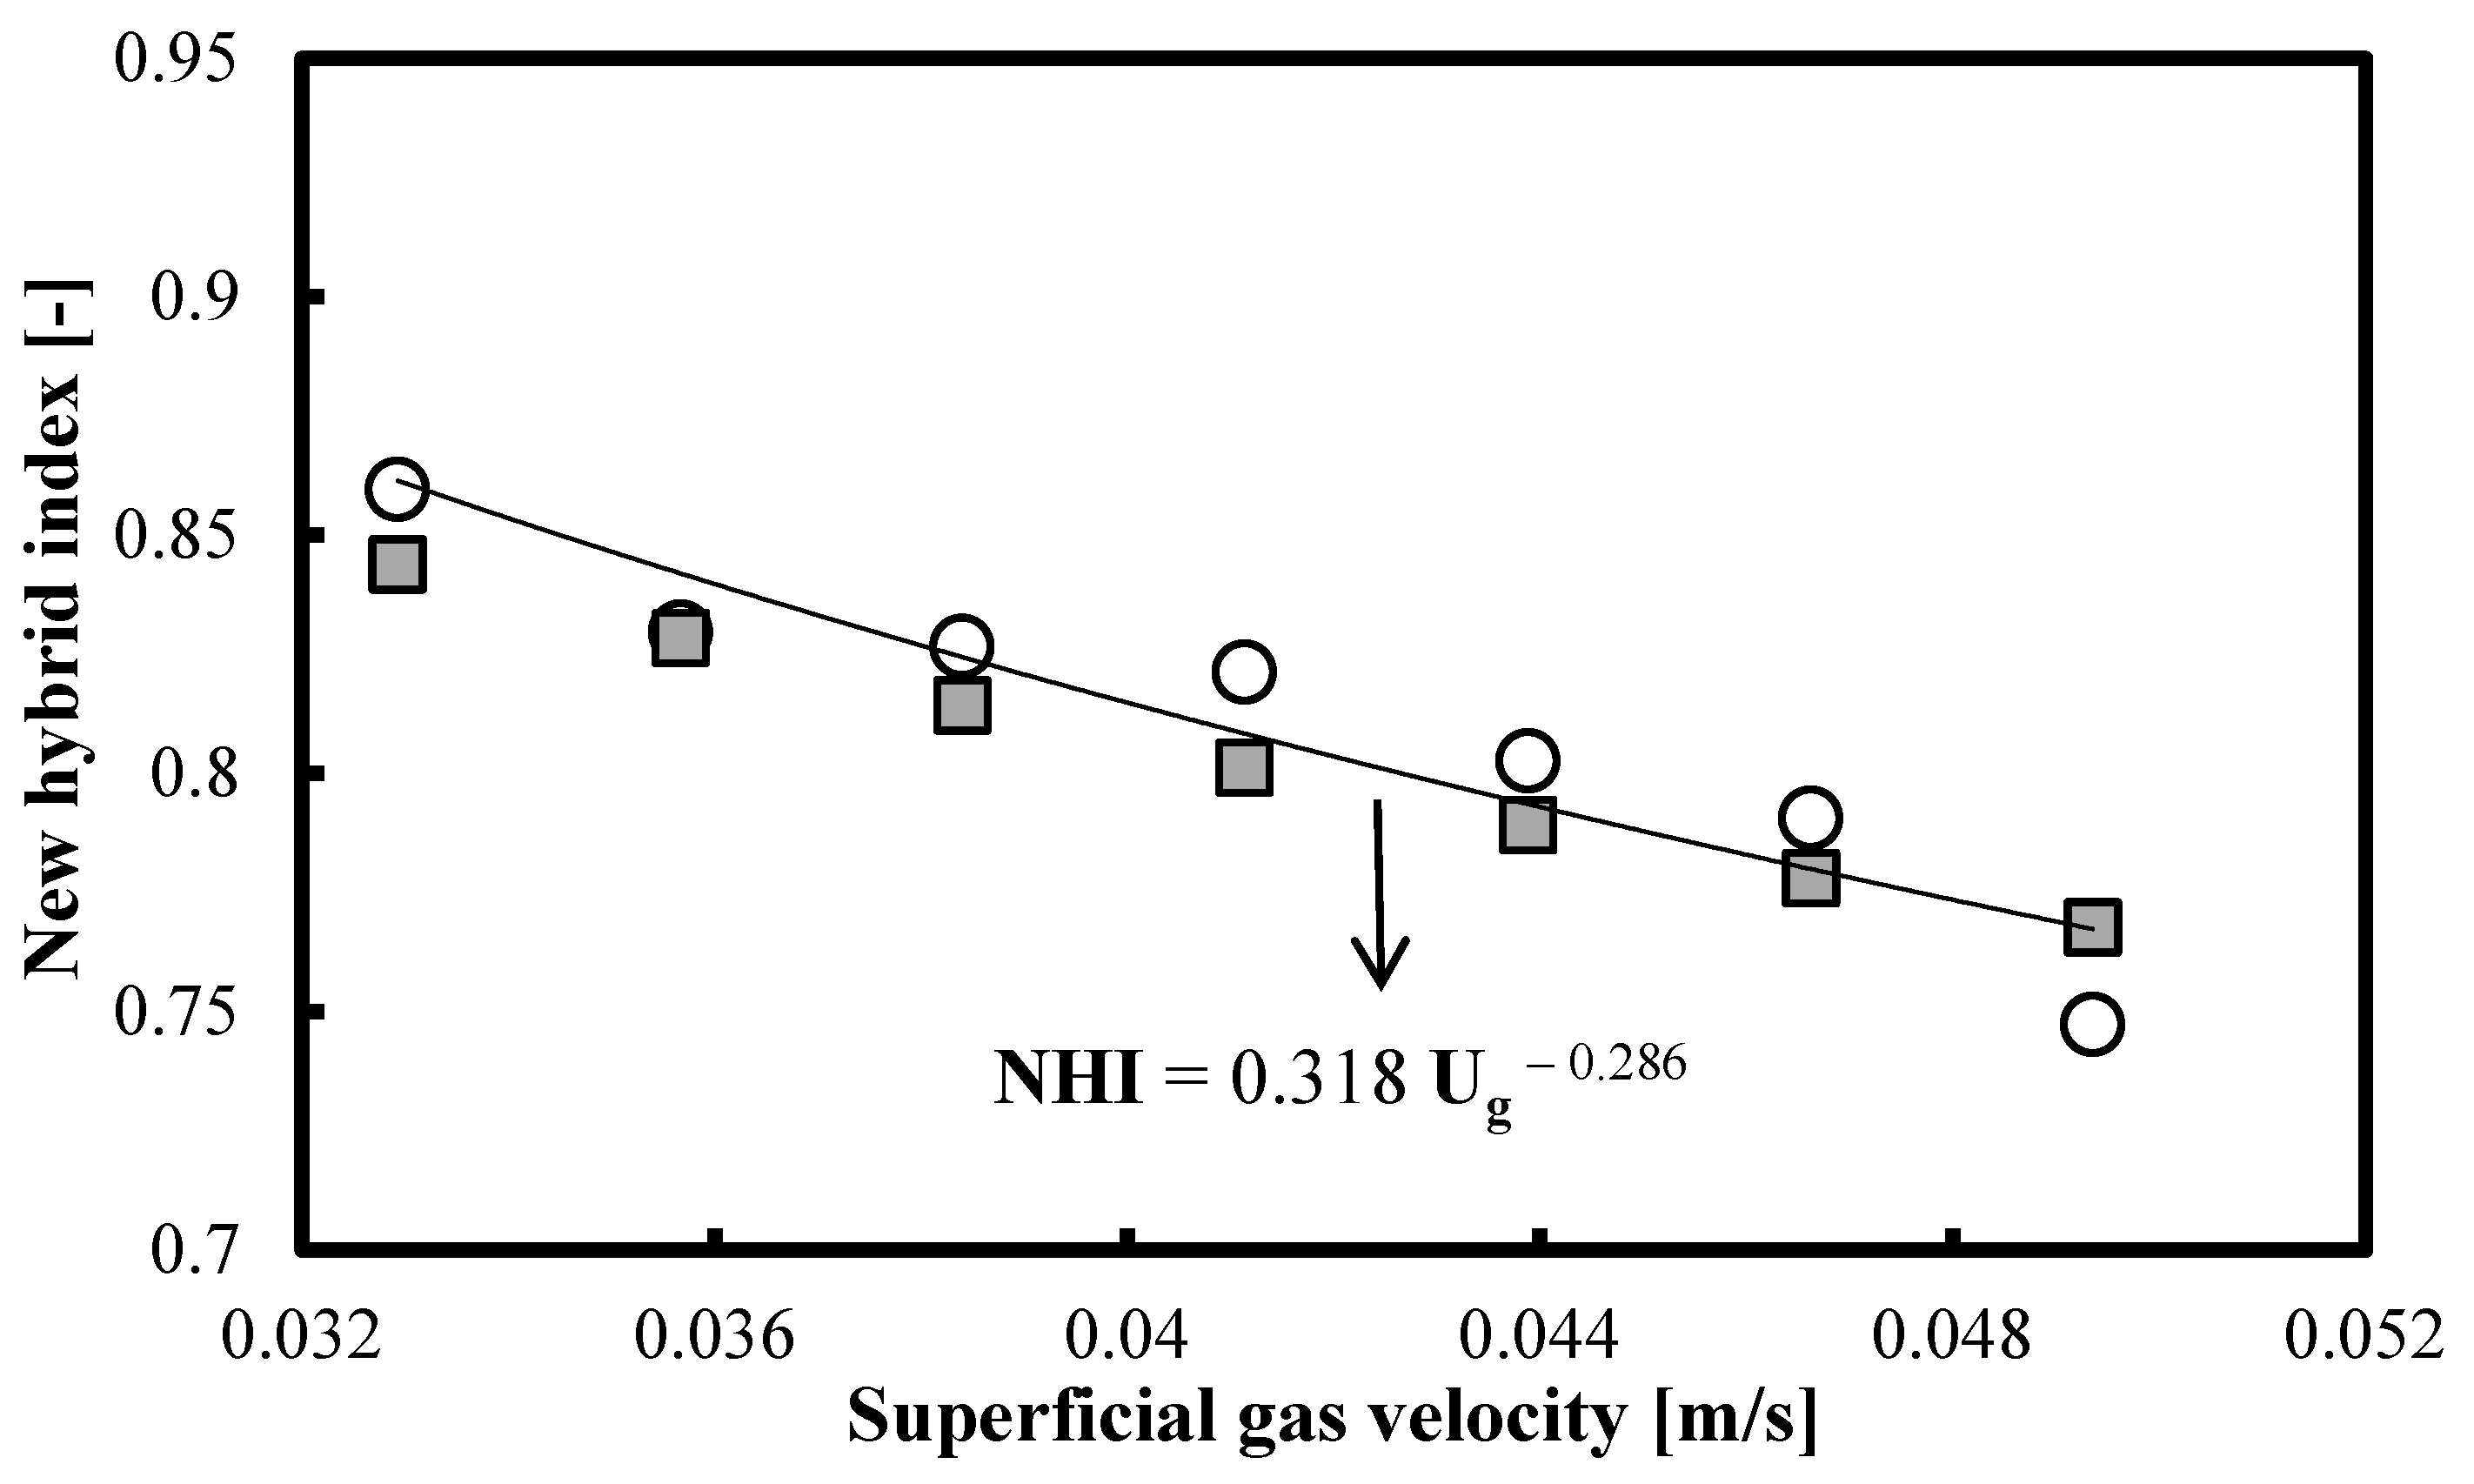
Figure 2 shows that the experimental NHI profile (see the open circles) in the homogeneous FR of a narrow BC (0.1 m in ID) equipped with a perforated-plate GD (96 orifices × ∅ 1 mm) and operated with an air–deionized water-1-butanol system (0.5 vol. %) exhibits a monotonic decrease. The NHI profile has been extracted from GP fluctuations recorded at an axial position of z = 0.65 m. The power law fit (see the black trendline in Figure 2) shows that the exponent of Ug is−0.286. The R2 value is 0.875. This exponent is close to the dependence of the LS of micro eddies on Ug. According to Deckwer [15], the exponent is−0.25. The grey squares in Figure 2 correspond to the fit NHI = 22 901.701(LS). The average relative error (ARE) is 1.89%, whereas the maximum relative error (MRE) is 2.73%. The small differences between the experimental NHI values (open circles) and the predicted ones (grey squares) imply that in the Ug range from 0.033 m/s to 0.049 m/s, the local isotropic turbulence conditions prevail (especially around the measurement position). This Ug range corresponds to Reynolds numbers Re that range from 3254.569 to 5321.386.
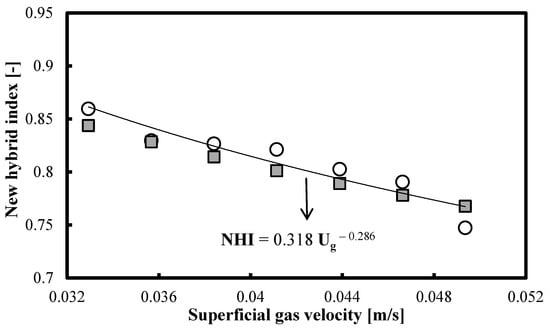
Figure 2.
Monotonic decrease in NHI parameter as a function of Ug in a homogeneous BC (0.1 m in ID) operated with an air–aqueous 1-butanol system (0.5 vol. %) at ambient conditions. Open circles correspond to experimental values.
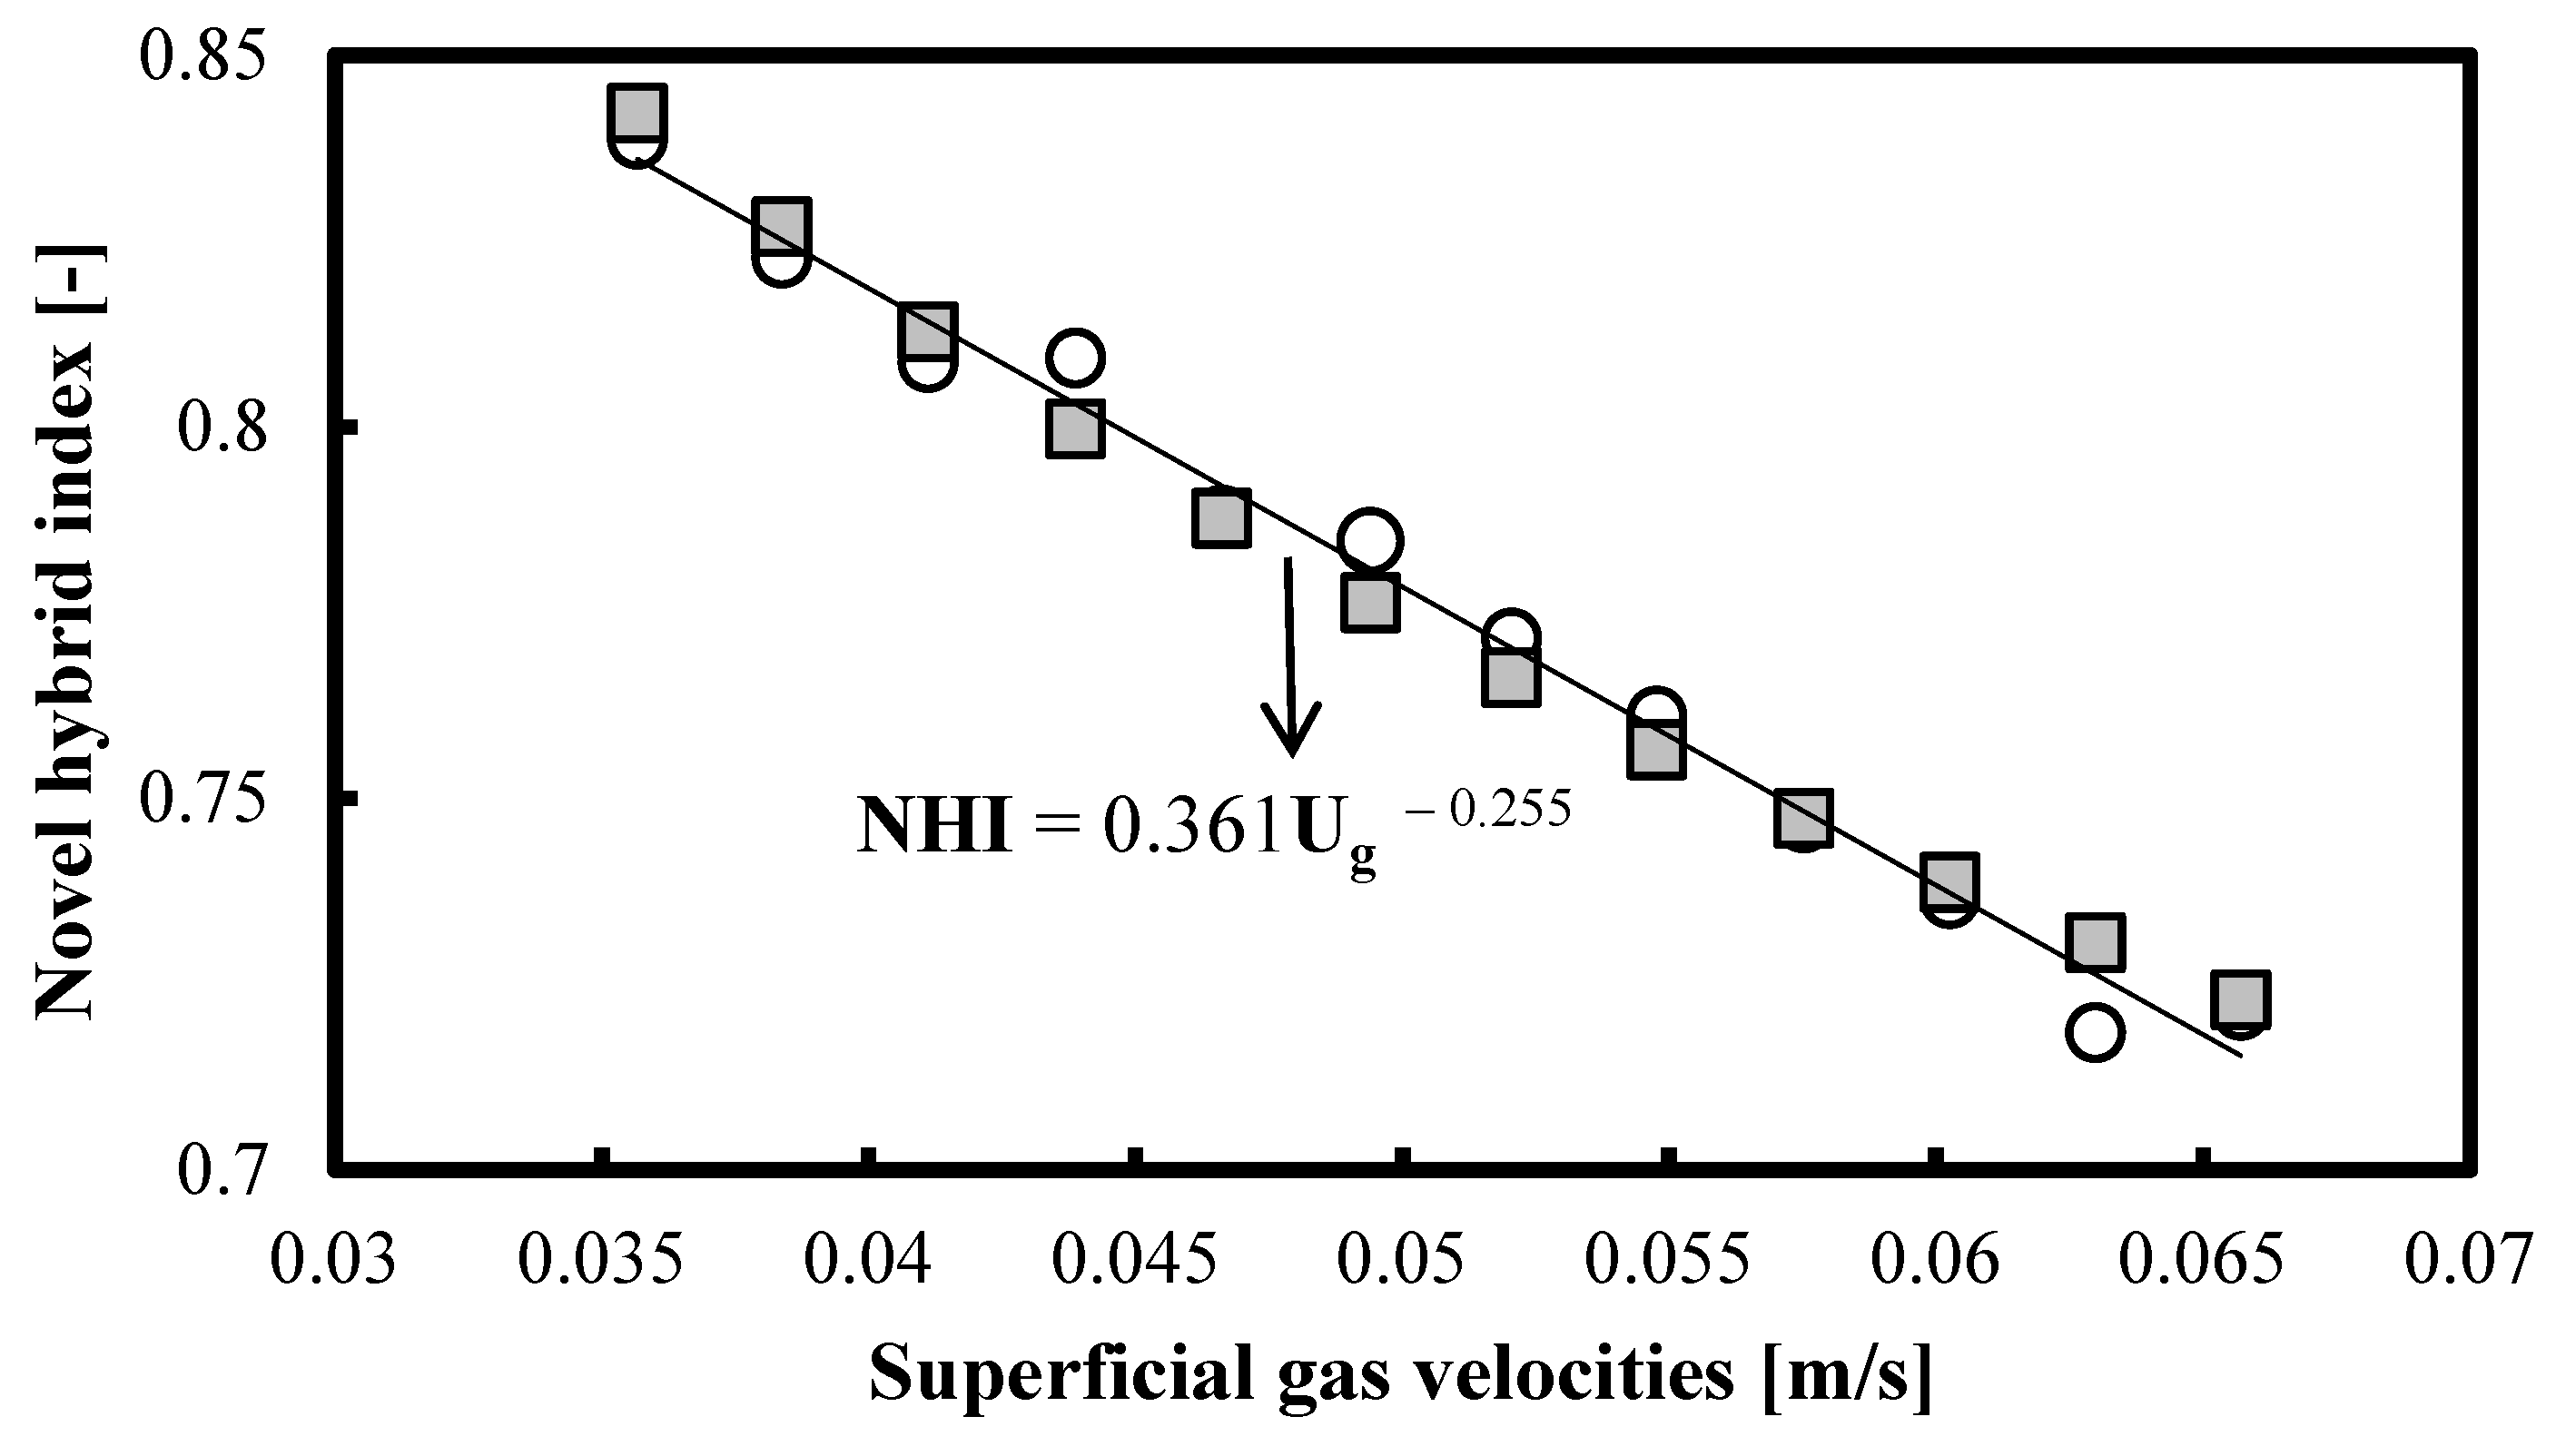
Figure 3 shows that the experimental NHI profile (see the open circles) in the homogeneous FR of a narrow BC (0.1 m in ID) equipped with a perforated-plate GD (96 orifices × ∅ 1 mm) and operated with an air–aqueous 3-hexanol system (0.5 vol. %) exhibits a monotonic decrease. Again, the NHI profile has been extracted from GP fluctuations recorded at an axial position of z = 0.65 m. The power law fit (see the black trendline in Figure 3) shows that the exponent of Ug is−0.255. The R2 value is 0.988. This exponent is close to the dependence of the LS of micro eddies on Ug. According to Deckwer [15], the exponent is−0.25. The grey squares in Figure 3 correspond to the fit NHI = 22 877 (LS). The ARE is 0.61%, whereas the MRE is 1.68%. The small differences between the experimental NHI values (open circles) and the predicted ones (grey squares) imply that in the Ug range from 0.036 m/s to 0.066 m/s, the local isotropic turbulence conditions prevail (especially around the measurement position). This Ug range corresponds to a Re range from 4133.410 to 7614.659.

Figure 3.
Monotonic decrease in NHI parameter as a function of Ug in a homogeneous BC (0.1 m in ID) operated with an air–aqueous 3-hexanol system (0.5 vol. %) at ambient conditions. Open circles correspond to experimental values.
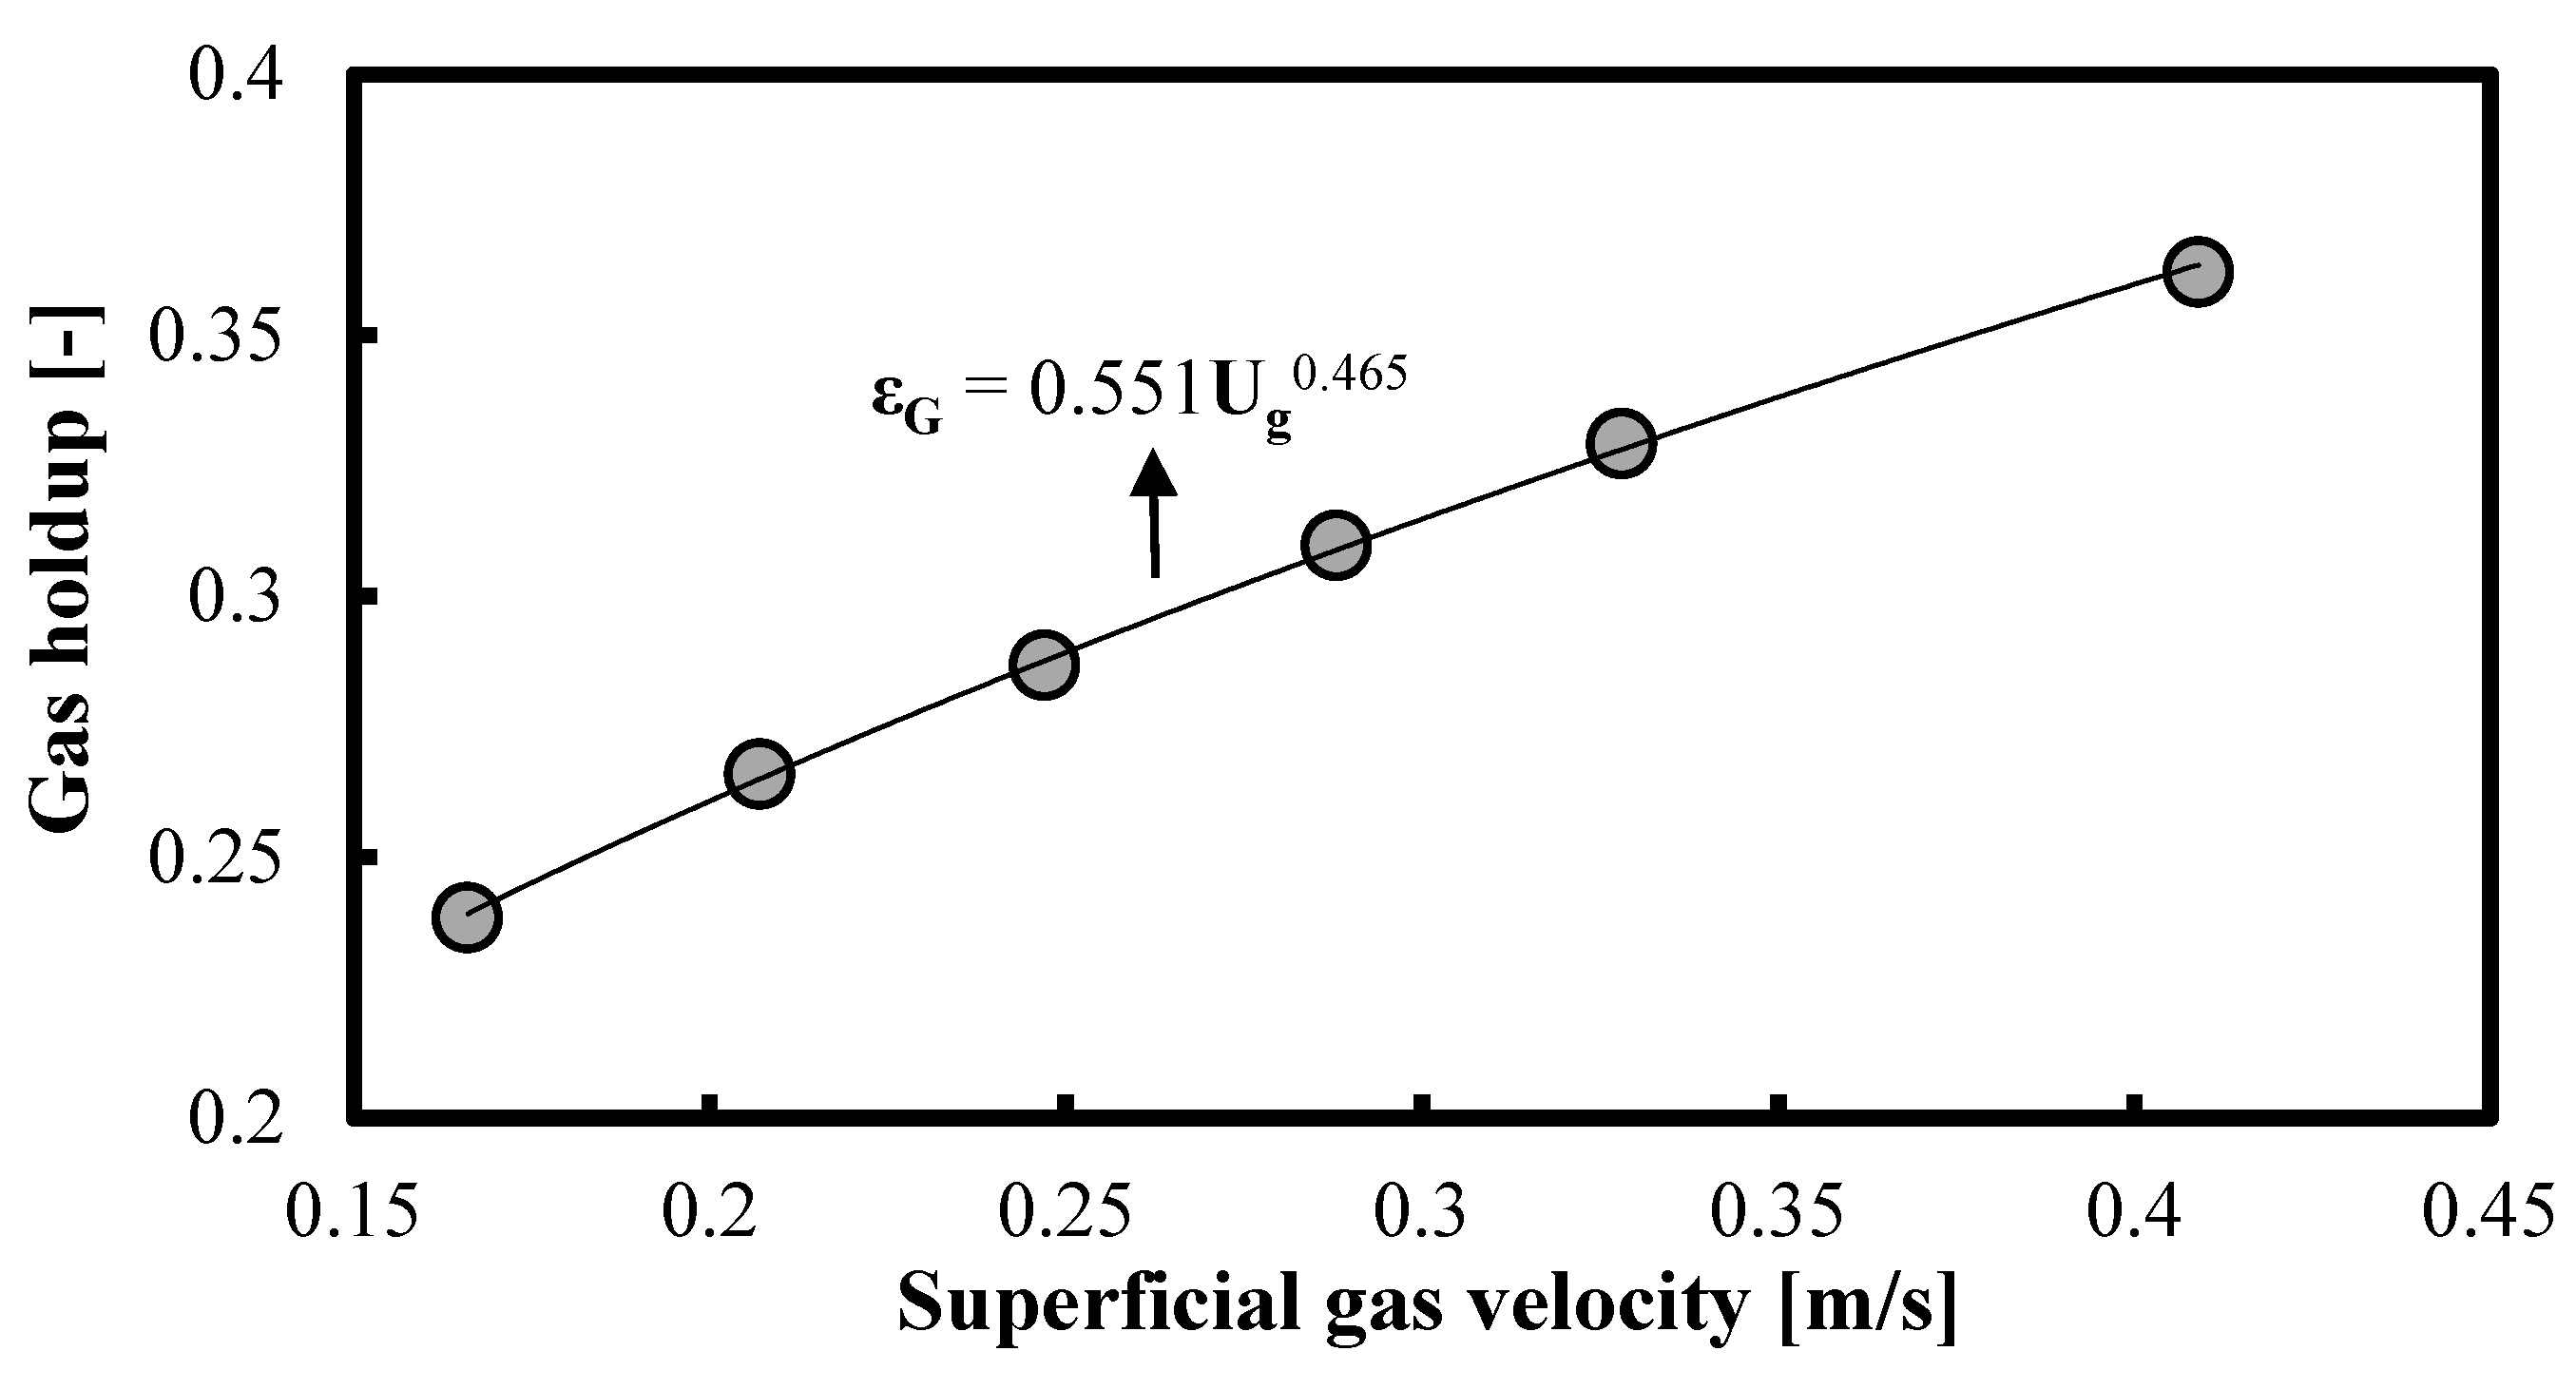
In Figure 4, it is shown that the Kolmogorov entropy (KE) profile (see the open circles) in the heterogeneous BC (0.19 m in ID) equipped with a porous-plate GD follows a monotonic decrease. It can be correlated with the superficial gas velocity Ug raised to the power of −0.5 (see the black line). The R2 value is 0.979. The KE profile has been extracted from AP fluctuations recorded at z = 1.92 m. The result in Figure 4 implies that in the selected Ug range, the KE profile can be correlated with the squared LS of micro eddies. The grey squares correspond to the following correlation: KE = 1.59 × 10¹⁰ (LS)2. The ARE is 1.79%, whereas the MRE is 2.43%. The relationship between KE and LS should be considered proof of the existence of local isotropic turbulence (especially around the measurement position) in the Ug range from 0.166 m/s to 0.409 m/s, respectively. This Ug range corresponds to Re values from 31,501.986 to 77,466.283, i.e., highly turbulent conditions.
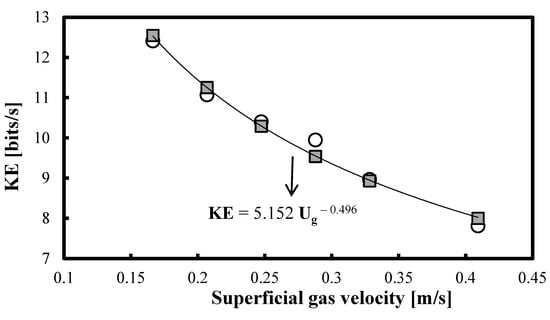
Figure 4.
Monotonic decrease in KE as a function of Ug in a heterogeneous BC (0.19 m in ID) operated with an air-tap water system at ambient conditions. Open circles correspond to experimental values.
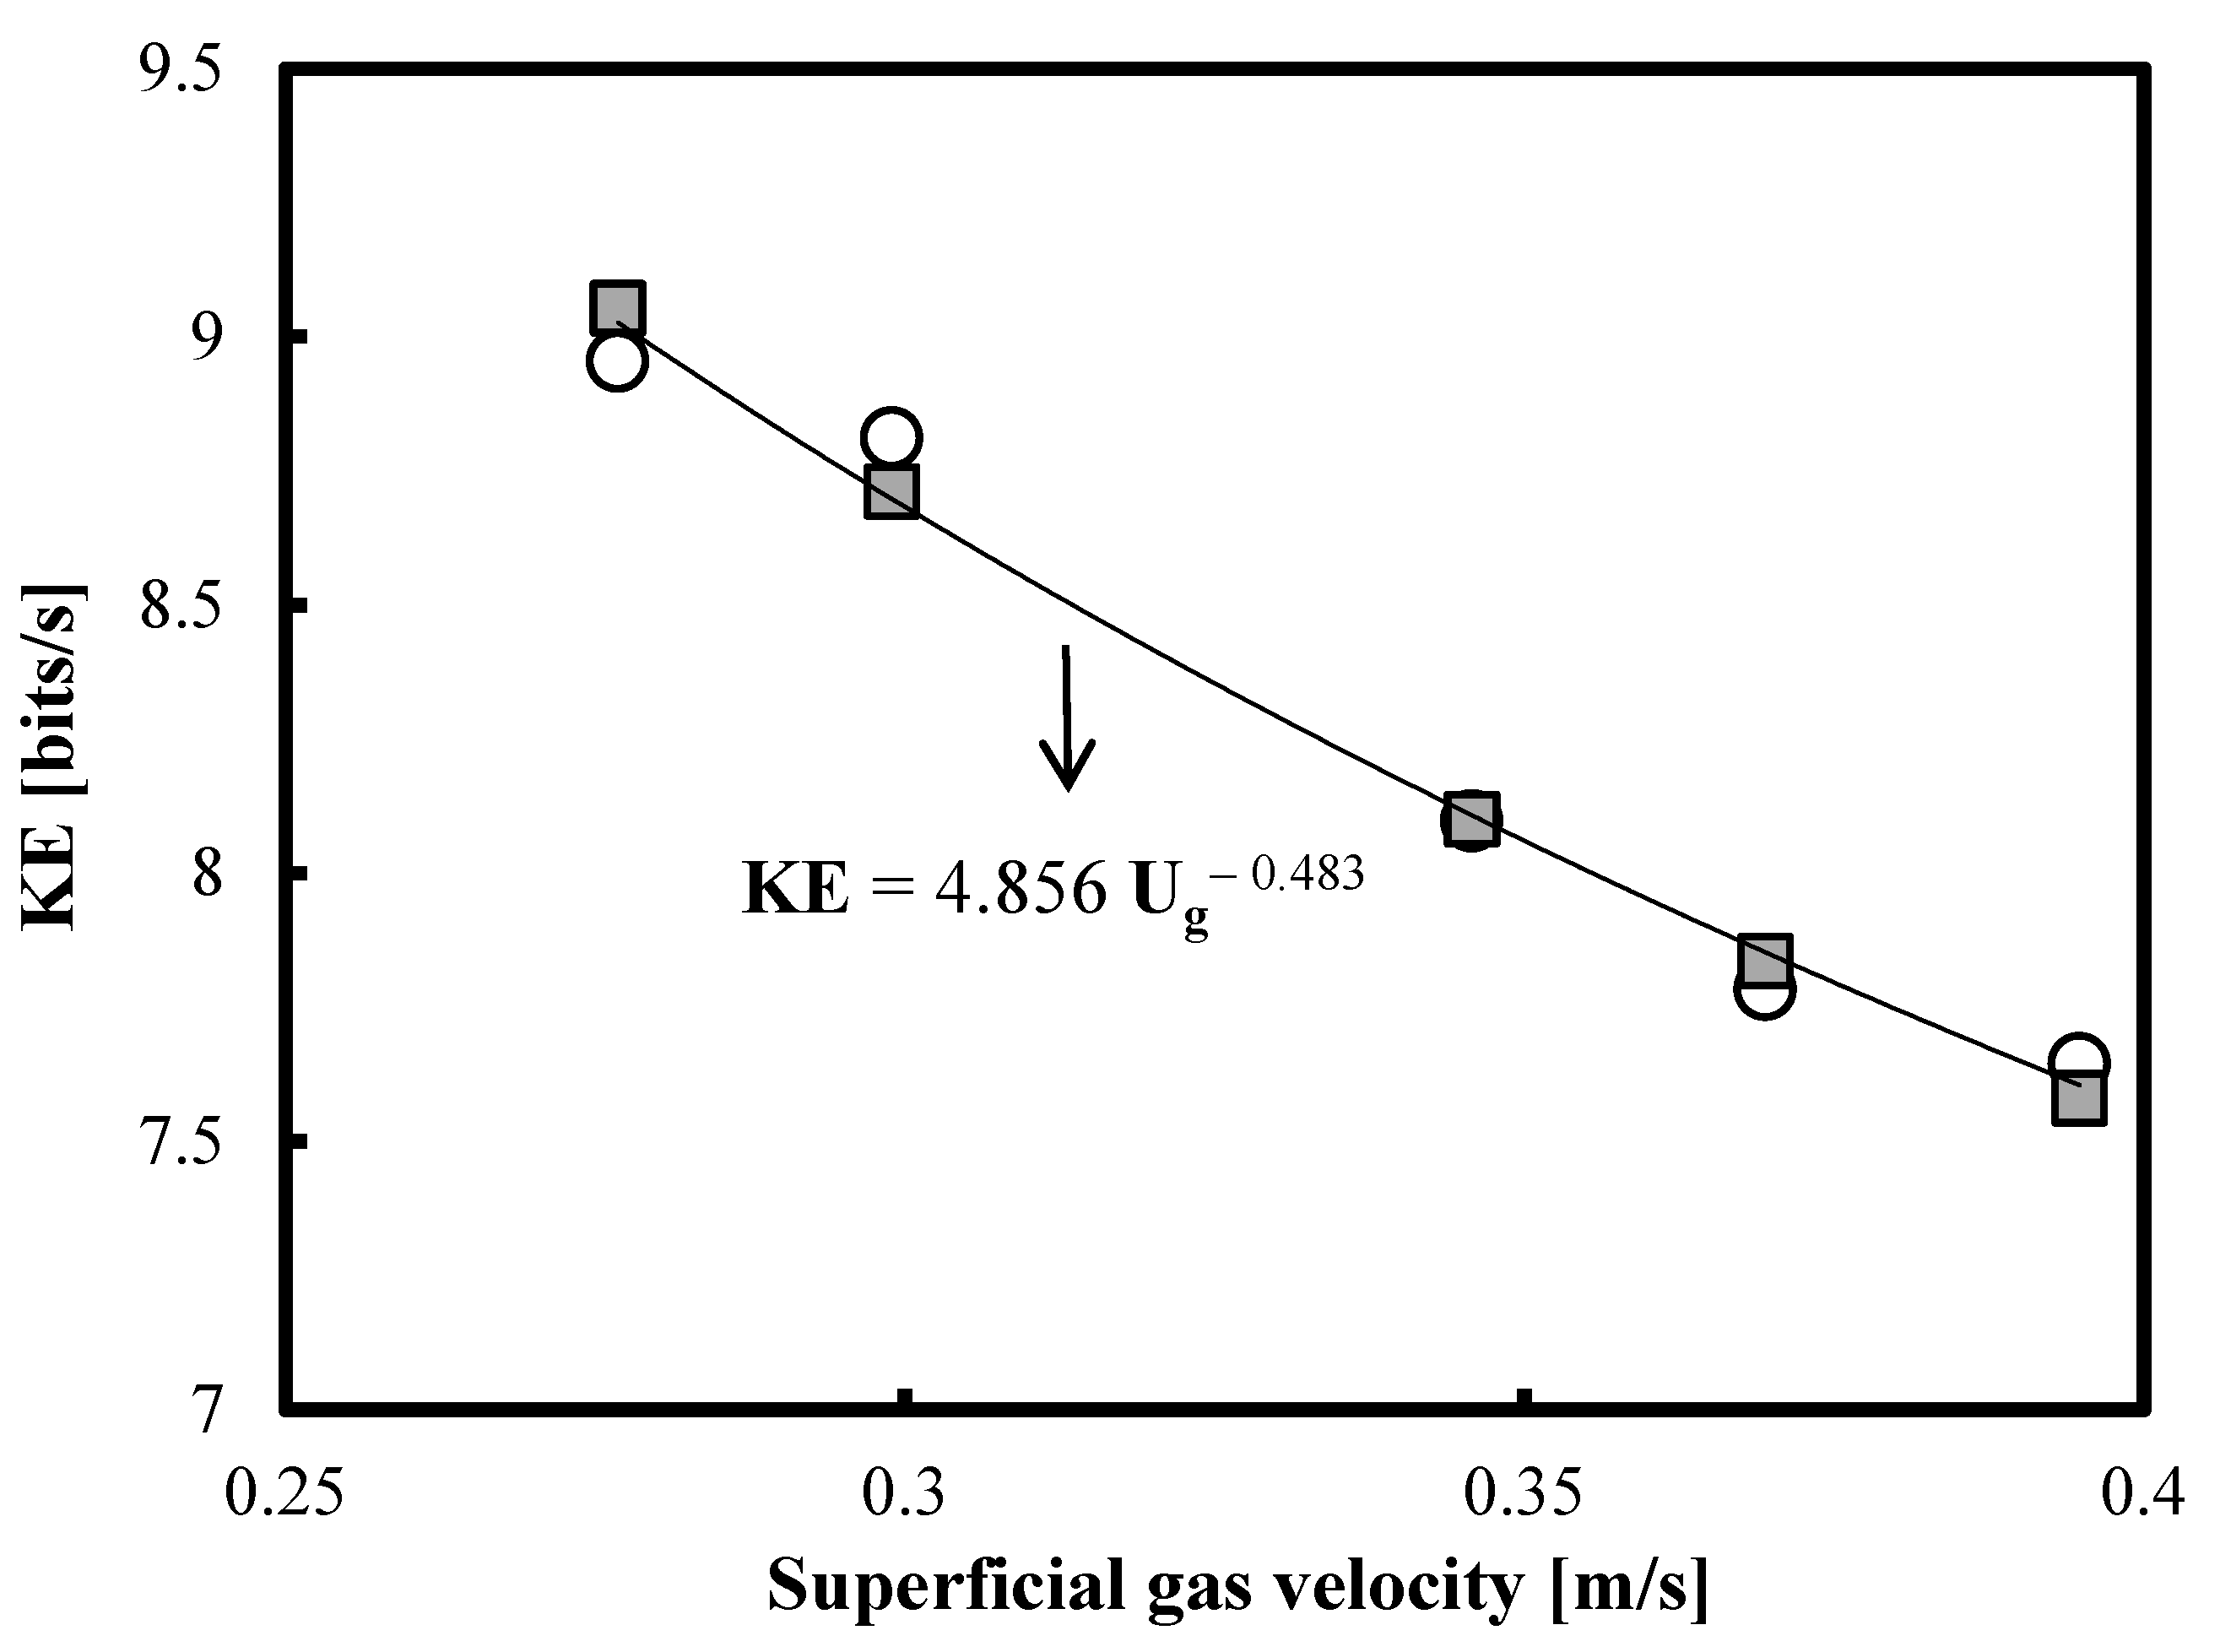
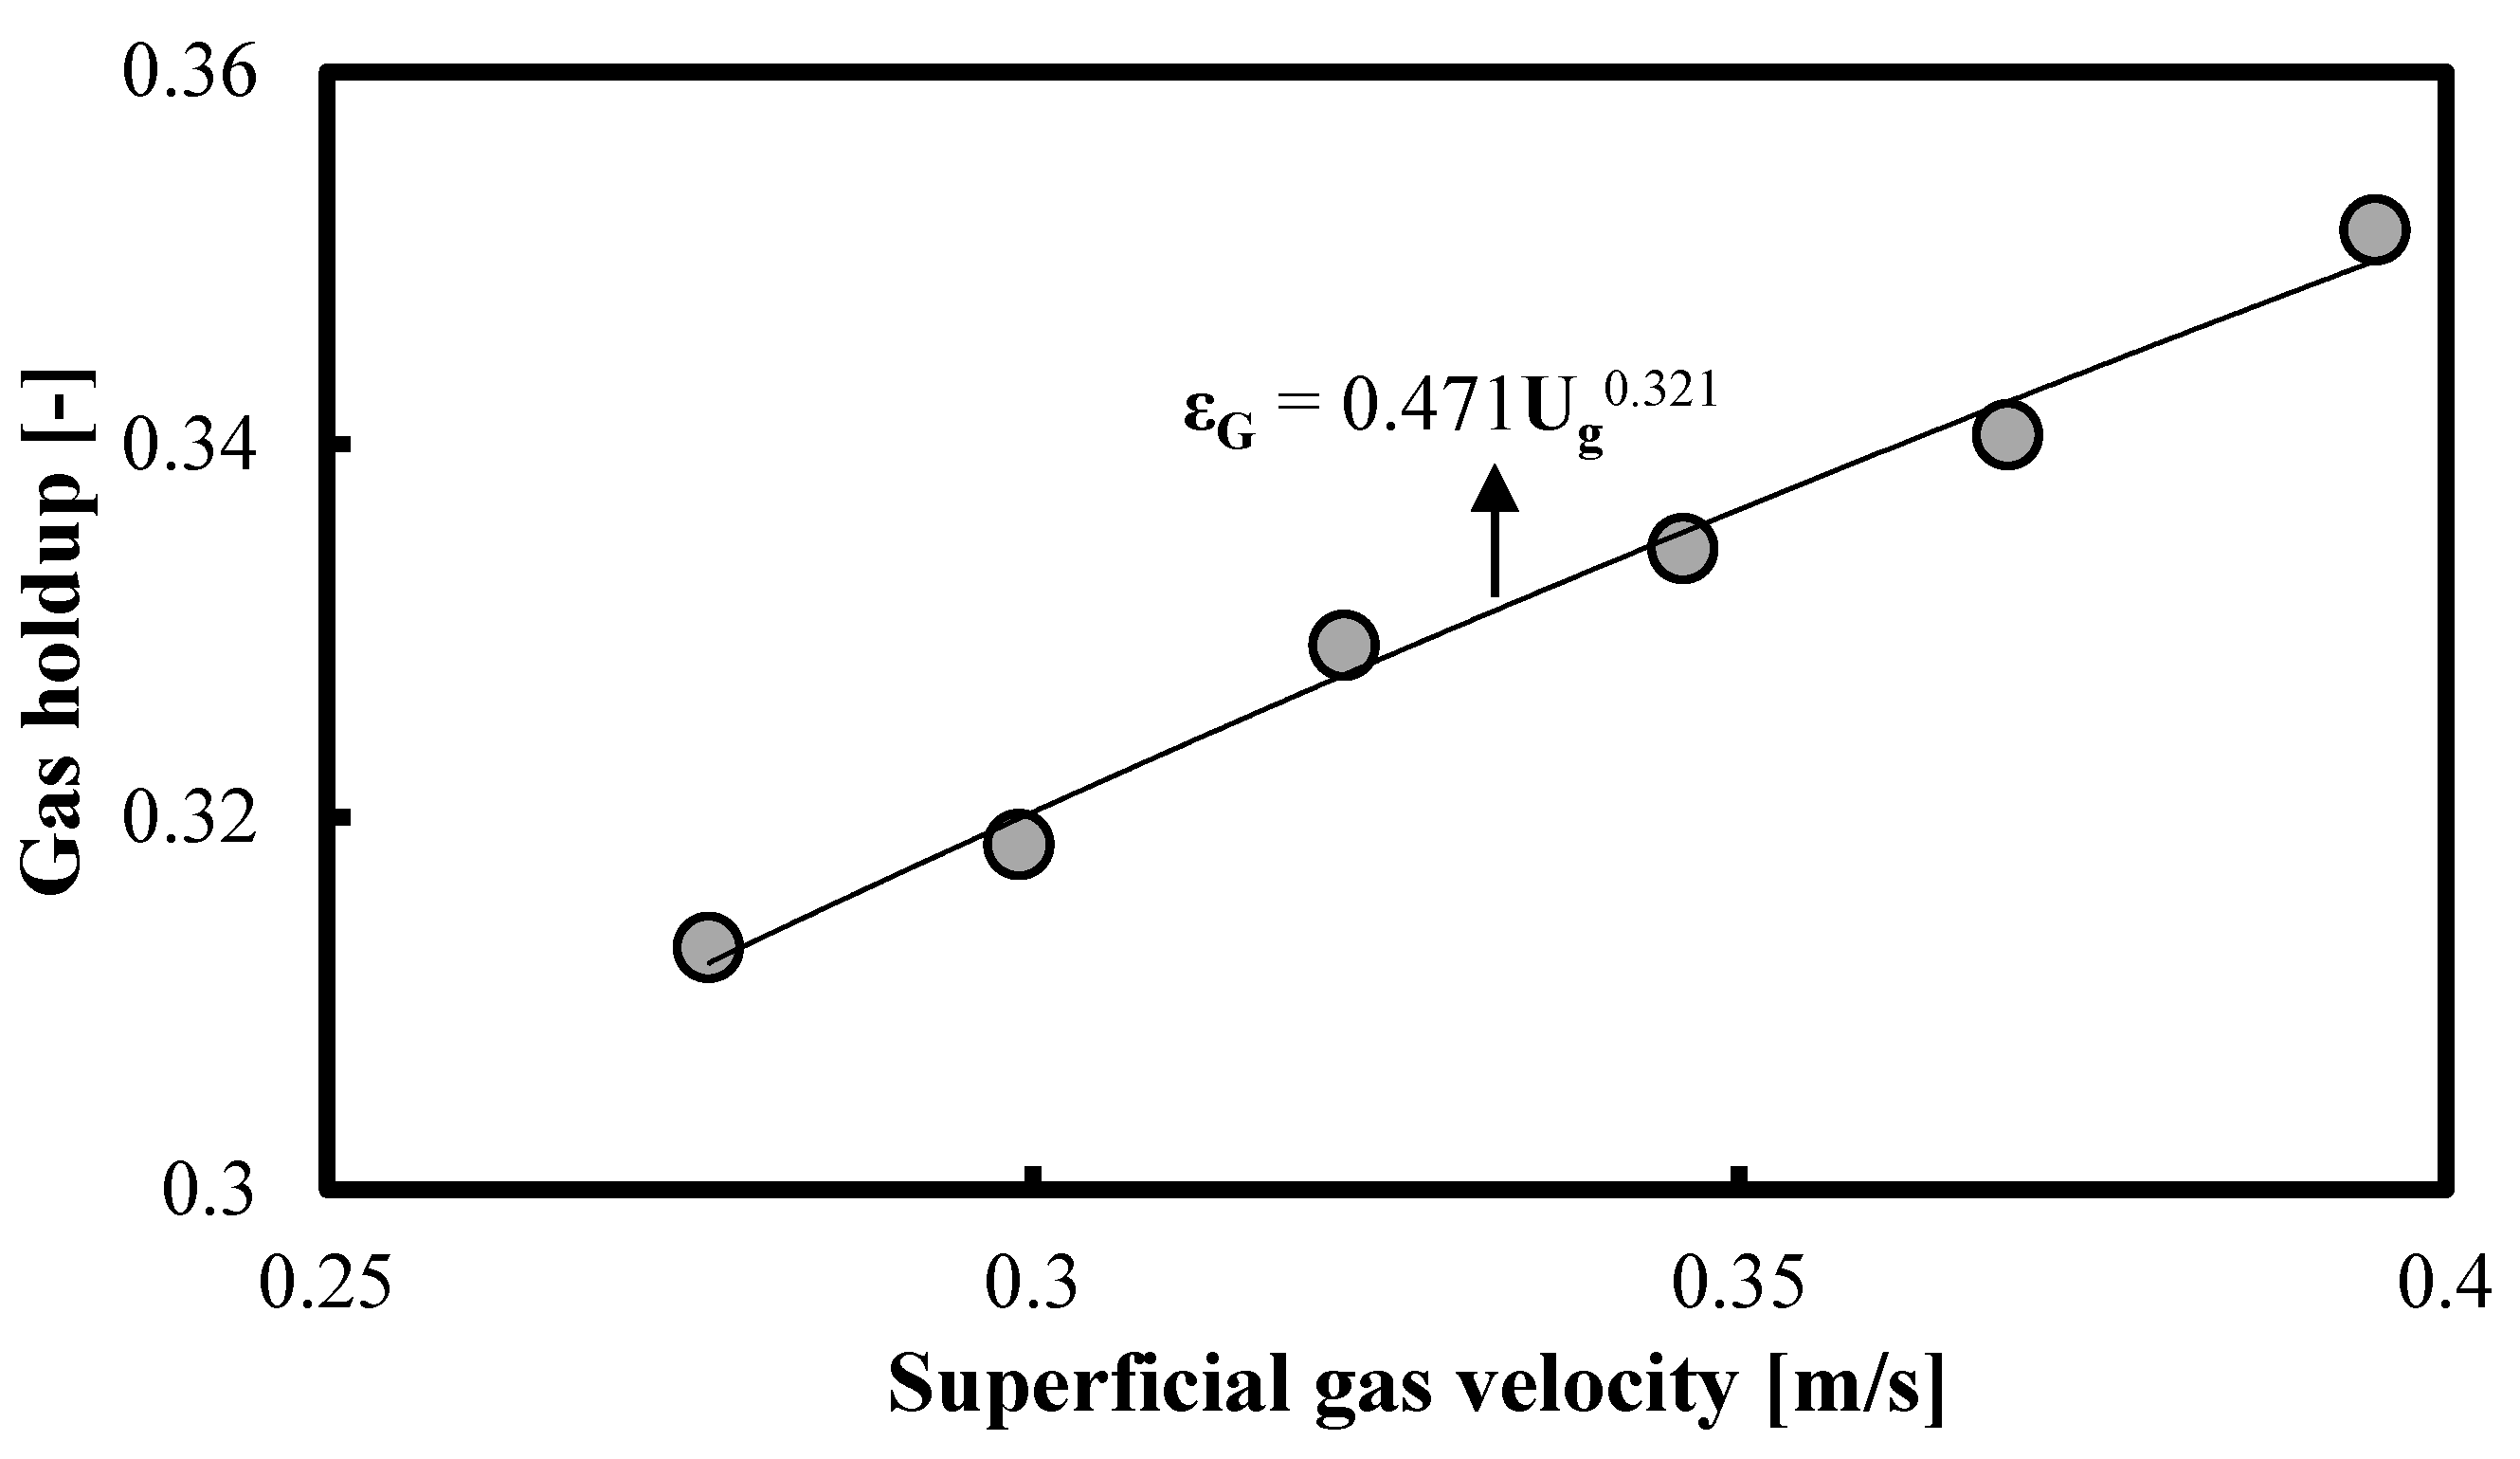
In the case of a two-times-bigger BC (0.38 m in ID) operated in the heterogeneous FR, the KE profile (see the open circles in Figure 5) recorded at z = 0.9 m follows a monotonic decrease again. The correlation in Figure 5 shows that KE is a function of Ug to the power of −0.48 (the black trendline shows the predictions). The R2 value is 0.983. Based on the work of Deckwer [15], this correlation can be reformulated as a dependence (see the grey squares in Figure 5) between KE and LS: KE = 1.48 × 10¹⁰ (LS)2. The ARE is 0.76%, whereas the MRE is 1.12%. This result implies that in the Ug range from 0.277 m/s to 0.395 m/s, the local isotropic turbulence conditions prevail (especially around the measurement position). This Ug range corresponds to Re values from 104,813.137 to 149,487.427, i.e., highly turbulent conditions.

Figure 5.
Monotonic decrease in KE as a function of Ug in a heterogeneous BC (0.38 m in ID) operated with an air-tap water system at ambient conditions. Open circles correspond to experimental values.
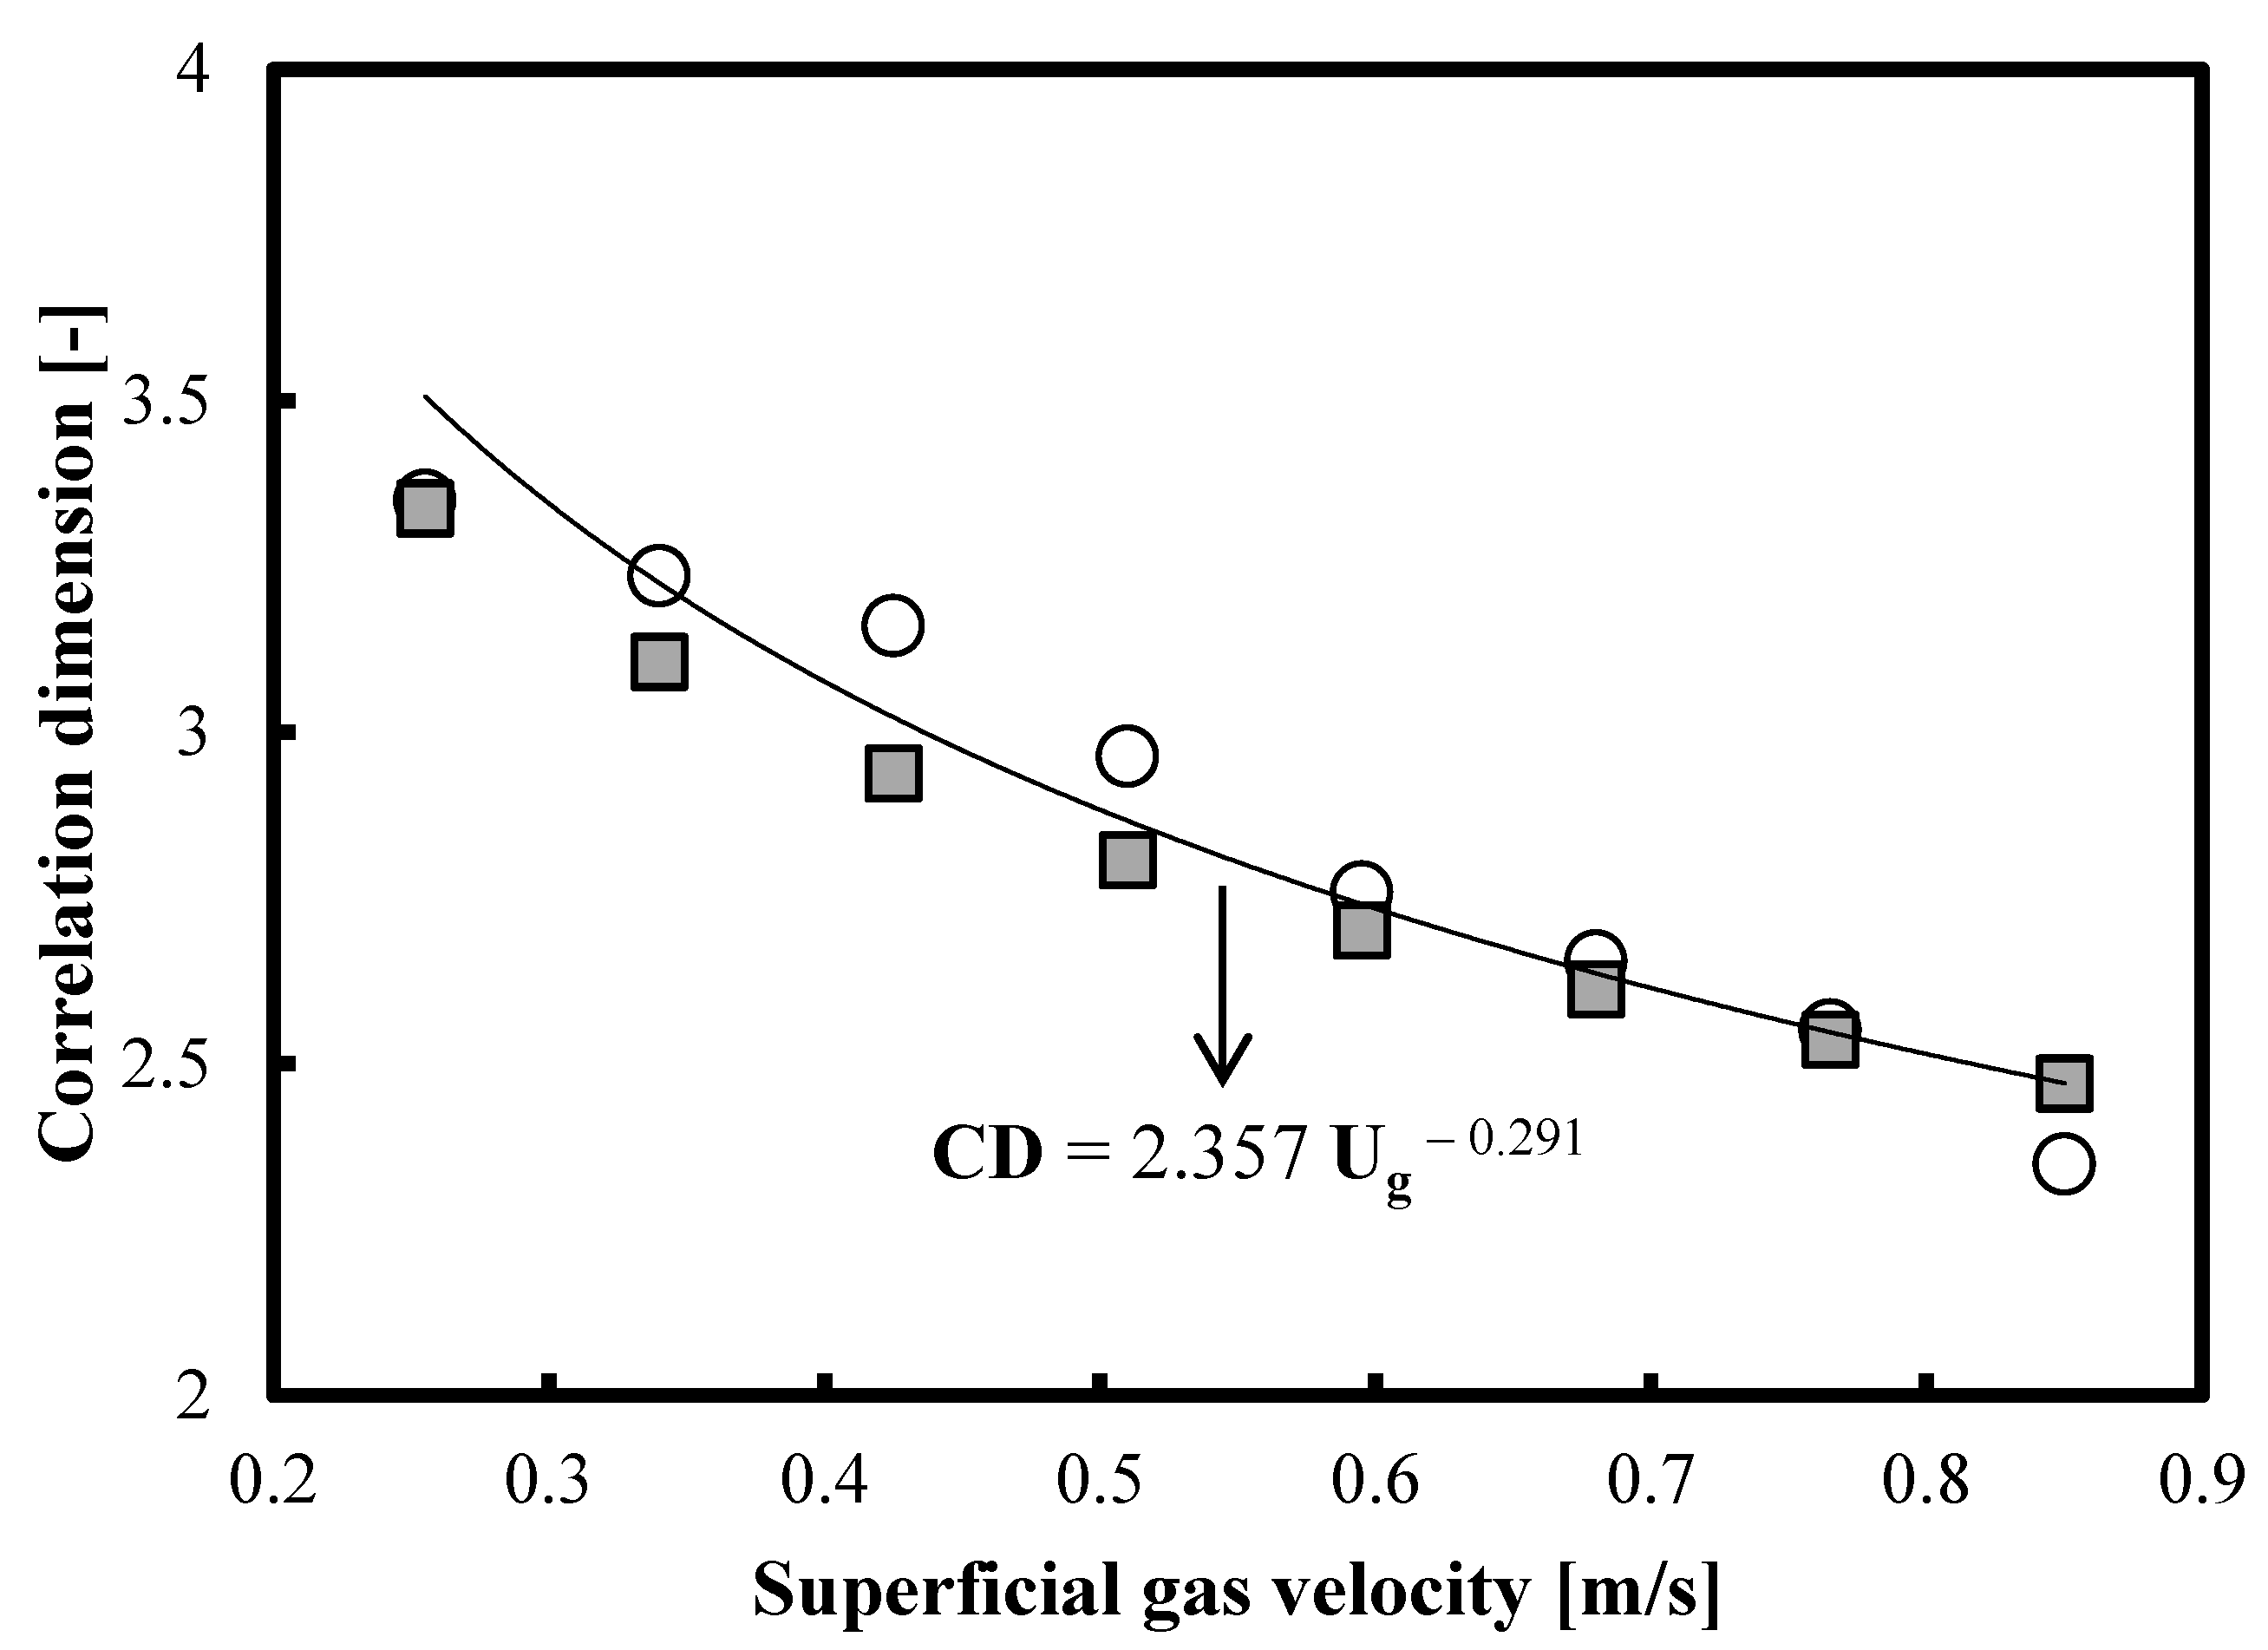
Figure 6 shows that in the case of a much bigger BC (0.80 m in ID) operated in the heterogeneous FR, the experimental correlation dimension (CD) profile (see the open circles) recorded at z = 1.34 m decreases monotonically. It is a function of Ug to the power of −0.29. The R2 value is 0.929. This result is very close to the dependence of LS on Ug; thus, the CD can be correlated with LS as follows: CD = 132 408, 145 LS. The ARE is 3.27%, whereas the MRE is 7.05%. The grey squares in Figure 6 illustrate the predictions of this correlation. This empirical result implies that in the Ug range from 0.255 m/s to 0.85 m/s, the local isotropic turbulence conditions prevail (especially around the measurement position). This is a very broad range of Ug values. It corresponds to Re values from 135,511.182 to 677,555.911, i.e., highly turbulent conditions.
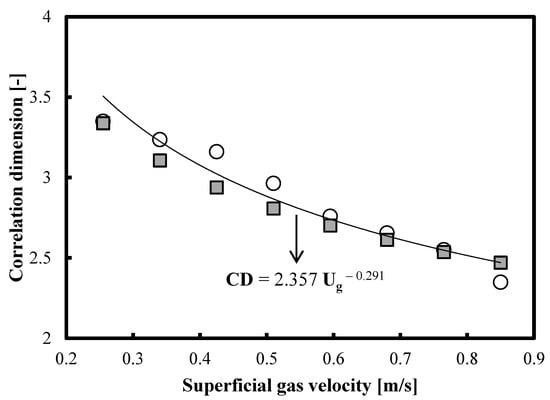
Figure 6.
Monotonic decrease in CD as a function of Ug in a heterogeneous BC (0.80 m in ID) operated with an air-tap water system at ambient conditions. Open circles correspond to experimental values.
In Table 1 are summarized the Ug ranges of the local isotropic turbulence conditions in various gas-liquid systems and BCs. Except for the systems’ air–aqueous solutions of 1-butanol (0.5 vol. %) and 3-hexanol (0.5 vol. %), the other Ug ranges fall in the fully developed heterogeneous FR.

Table 1.
List of the identified local isotropic turbulence conditions.
Analysis of Gas Holdups
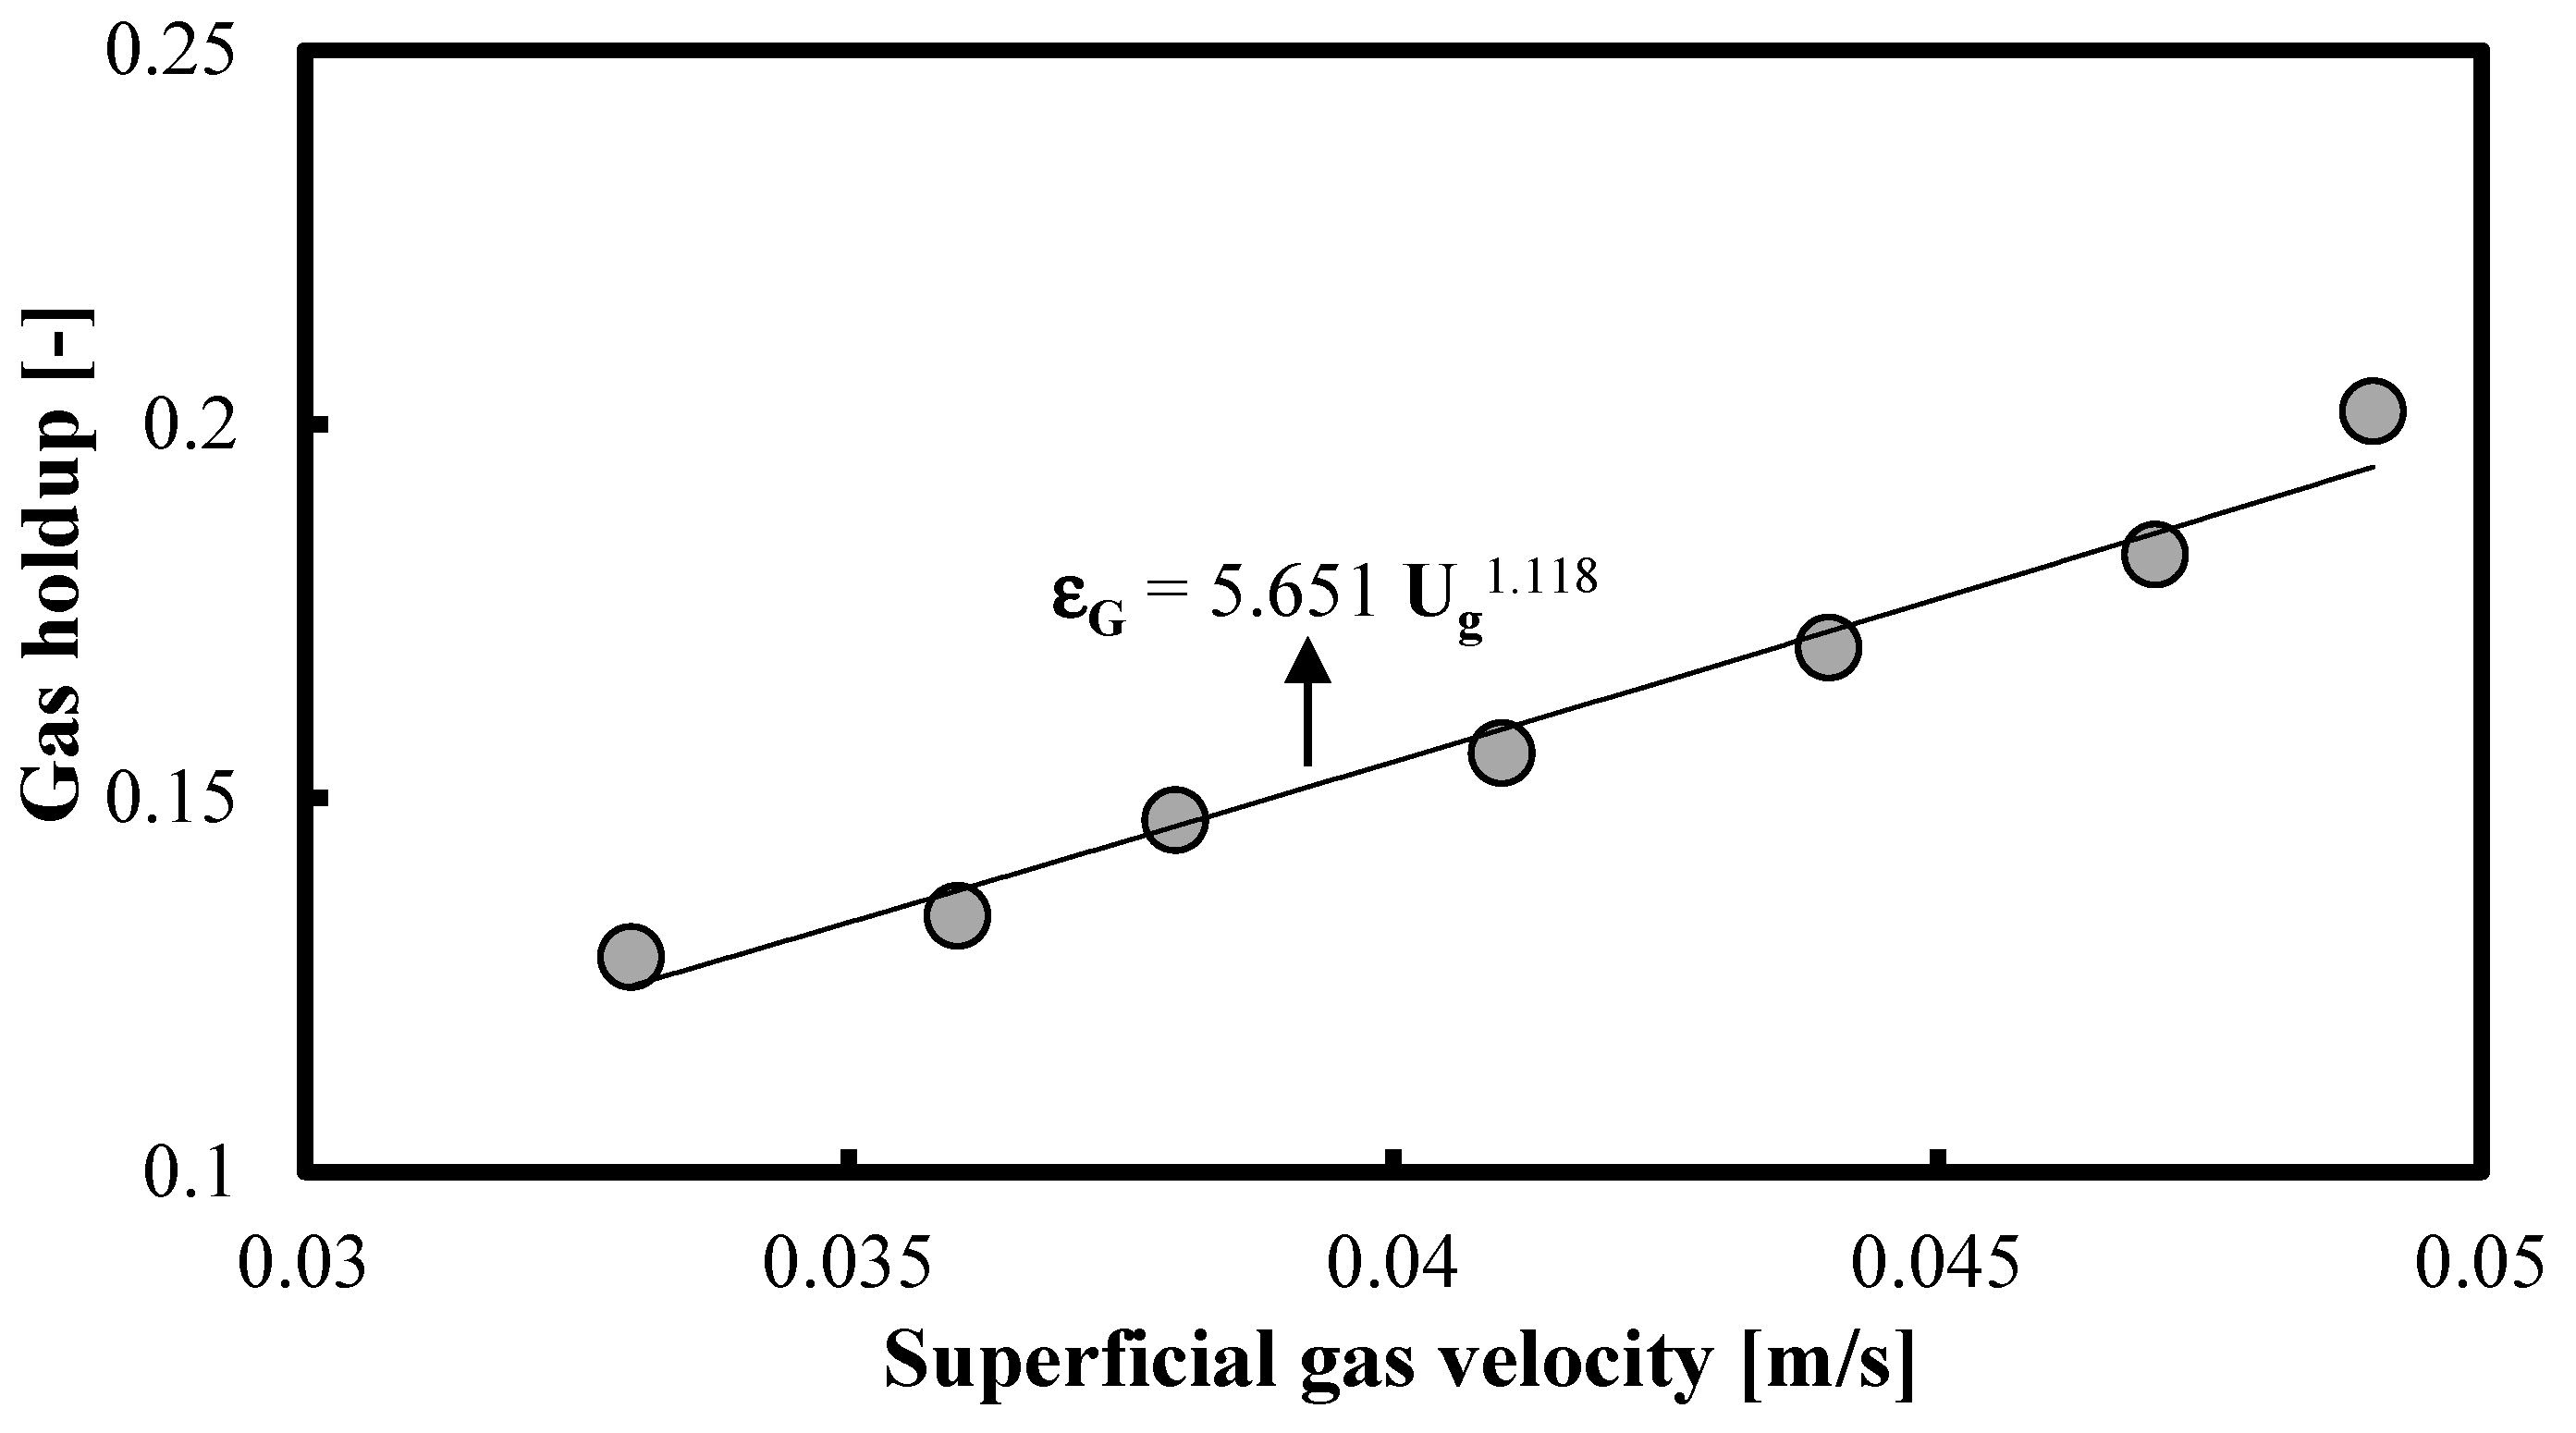
In this section, it will be shown that the overall gas holdups in the aqueous alcohol solutions belong to the homogeneous FR, whereas the overall gas holdups in the tap water in different BCs fall in the heterogeneous FR. Figure 7 shows that the overall gas holdup values in the aqueous solution of 1-butanol (0.5 vol. %) increase monotonically and the exponent of the Ug value is equal to 1.118. According to Shah et al. [17], this value of the exponent (i.e., higher than 1.0) corresponds to the homogeneous FR. So, the local isotropic turbulence conditions are identified only at an axial position of 0.65 m (see Figure 2), but the whole BB operates in the homogeneous FR.
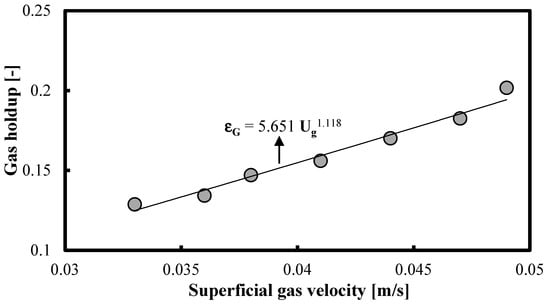
Figure 7.
Gas holdup profile in a homogeneous BC (0.1 m in ID) operated with an air–aqueous 1-butanol system (0.5 vol. %) at ambient conditions.
The same is found in the situation with the aqueous solution of 3-hexanol (0.5 vol. %). Figure 8 reveals that the exponent of the Ug value is equal to 1.915, i.e., these overall gas holdup values correspond to homogeneous conditions in the BB. The local isotropic turbulence conditions (see Figure 3) exist only around the position of the GP sensor. However, in the case of the air-tap water system aerated in larger BCs, the gas holdup profiles (see Figure 9, Figure 10 and Figure 11) imply that they belong to the heterogeneous FR, i.e., they correspond to highly turbulent conditions. In all three cases, the exponent of the Ug value is much lower than 1.0, which, according to Shah et al. [17], is an indication of heterogeneous conditions.
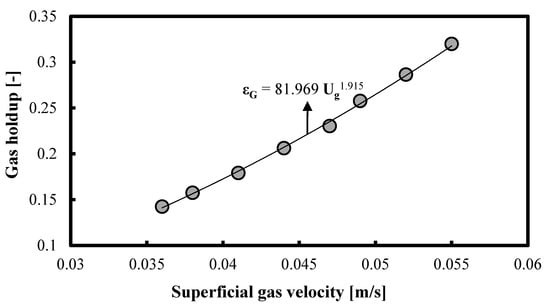
Figure 8.
Gas holdup profile in a homogeneous BC (0.1 m in ID) operated with an air–aqueous 3-hexanol system (0.5 vol. %) at ambient conditions.

Figure 9.
Gas holdup profile in a heterogeneous BC (0.19 m in ID) operated with an air-tap water system at ambient conditions.

Figure 10.
Gas holdup profile in a heterogeneous BC (0.38 m in ID) operated with an air-tap water system at ambient conditions.
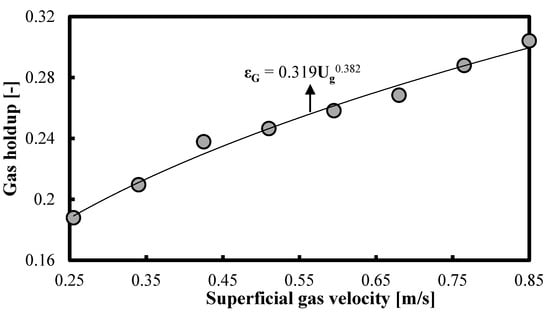
Figure 11.
Gas holdup profile in a heterogeneous BC (0.80 m in ID) operated with an air-tap water system at ambient conditions.
4. Conclusions
This work deals with the identification of the local isotropic turbulence conditions in various BCs operated with air-tap water and aqueous alcohol solutions. For this purpose, different parameters (novel hybrid index (NHI), Kolmogorov entropy (KE) and correlation dimension (CD)) have been used. It has been demonstrated that these parameters exhibit a monotonically decreasing trend, which is proportional to the Ug value to the power of −0.25. The latter is typical for the length scale (LS) of the micro eddies, which determine the local isotropic turbulence conditions. Potential correlations between the new parameters and LS in every case are presented. The indirect proof (based on several reliable parameters) for the existence of micro eddies with such characteristics implies that the conditions for the local isotropic turbulence (around the measurement position) are met.
The overall gas holdup profiles show that in the case of air-tap water system aerated in larger BCs (0.19–0.8 m in ID), the BB operates in the fully developed heterogeneous FR, i.e., under highly turbulent conditions. In the case of aqueous solutions of alcohols (1-butanol, 0.5 vol. % or 3-hexanol, 0.5 vol. %), the overall gas holdups fall in the homogeneous FR. The corresponding Ug and Re ranges for the occurrence of the local isotropic turbulence conditions are clearly specified.
Funding
This research was funded by the Alexander von Humboldt Foundation (Germany) (Project: Ref 3.4-1117626-POL-IP) and NUFFIC (The Netherlands).
Data Availability Statement
The raw data can be obtained directly from the author.
Conflicts of Interest
The author declares no conflict of interest.
Nomenclature
| AAD | average absolute deviation (mbars) |
| ARE | average relative error (%) |
| CD | correlation dimension (-) |
| IA | information amount (bits) |
| KE | Kolmogorov entropy (bits/s) |
| LS | length scale of micro eddies (m) |
| MRE | maximum relative error (%) |
| NHI | novel hybrid index (-) |
| N | total number of intervals (-) |
| P | probability (-) |
| Re | Reynolds number (-) |
| Ug | superficial gas velocity (m/s) |
| VS | velocity scale of micro eddies (m/s) |
| x | single point in the time series (mbar) |
| xmean | mean value of the time series (mbar) |
| z | axial position (m) |
| Subscripts | |
| i | number of preselected intervals in time series |
| j | number of corresponding points in time series |
| Greek symbols | |
| εG | gas holdupZx (-) |
| ϵ | energy dissipation rate (m2/s3) |
| ν | kinematic viscosity (m2/s) |
| Abbreviations | |
| AP | absolute pressure |
| BB | bubble bed |
| BC | bubble column |
| FR | flow regime |
| GD | gas distributor |
| GP | gauge pressure |
| ID | inner diameter |
References
- Joshi, J.B.; Sharma, M.M. Mass transfer characteristics of horizontal sparged contactors. Trans. Inst. Chem. Eng. 1976, 54, 42–53. [Google Scholar]
- Drahoš, J.; Zahradník, J.; Puncochar, M.; Fialová, M.; Bradka, F. Effect of operating conditions on the characteristics of pressure fluctuations in a bubble column. Chem. Eng. Proc. 1991, 29, 107–115. [Google Scholar] [CrossRef]
- Sathe, M.; Joshi, J.; Evans, G. Characterization of turbulence in rectangular bubble column. Chem. Eng. Sci. 2013, 100, 52–68. [Google Scholar] [CrossRef]
- Vieira, C.B.; Litrico, G.; Askari, E.; Lemieux, G.; Proulx, P. Hydrodynamics of bubble columns: Turbulence and population balance model. ChemEngineering 2018, 2, 12. [Google Scholar] [CrossRef]
- Nedeltchev, S. New methods for flow regime identification in bubble columns and fluidized beds. Chem. Eng. Sci. 2015, 137, 436–446. [Google Scholar] [CrossRef]
- Nedeltchev, S.; Rabha, S.; Hampel, U.; Schubert, M. A new statistical parameter for identifying the main transition velocities in bubble columns. Chem. Eng. Technol. 2015, 38, 1940–1946. [Google Scholar] [CrossRef] [PubMed]
- Joshi, J.B.; Vitankar, V.S.; Kulkarni, A.A.; Dhotre, M.T.; Ekambara, K. Coherent flow structures in bubble column reactors. Chem. Eng. Sci. 2002, 57, 3157–3183. [Google Scholar] [CrossRef]
- Risso, F. Agitation, mixing and transfers induced by bubbles. Annu. Rev. Fluid Mech. 2018, 50, 25–48. [Google Scholar] [CrossRef]
- Roghair, I.; Martinez Mercado, J.; Van Sint Annaland, M.; Kuipers, H.; Sun, C.; Lohse, D. Energy spectra and bubble velocity distributions in pseudo-turbulence: Numerical simulations versus experiments. Int. J. Multiph. Flow 2011, 37, 1093–1098. [Google Scholar] [CrossRef]
- Mezui, Y.; Cartellier, A.; Obligado, M. An experimental study on the liquid phase properties of a bubble column operated in the homogeneous and in the heterogeneous regimes. Chem. Eng. Sci. 2023, 268, 118381. [Google Scholar] [CrossRef]
- Van den Bleek, C.M.; Schouten, J.C. Deterministic chaos: A new tool in fluidized bed design and operation. Chem. Eng. J. 1993, 53, 75–87. [Google Scholar] [CrossRef]
- Schouten, J.C.; Takens, F.; Van den Bleek, C.M. Maximum-likelihood estimation of the entropy of an attractor. Phys. Rev. E 1994, 49, 126–129. [Google Scholar] [CrossRef] [PubMed]
- Schouten, J.C.; Takens, F.; Van den Bleek, C.M. Estimation of the dimension of a noisy attractor. Phys. Rev. E 1994, 50, 1851–1861. [Google Scholar] [CrossRef] [PubMed]
- Nedeltchev, S.; Katerla, J.; Basiak, E. Novel hybrid methods for identifying the main transition velocities in various bubble columns. J. Chem. Eng. Jpn. 2022, 55, 201–216. [Google Scholar] [CrossRef]
- Deckwer, W.-D. On the mechanism of heat transfer in bubble column reactors. Chem. Eng. Sci. 1980, 35, 1341–1346. [Google Scholar] [CrossRef]
- Rice, R.G. Letter to the editor. AIChE J. 1989, 35, 695–696. [Google Scholar] [CrossRef]
- Shah, Y.T.; Kelkar, B.G.; Godbole, S.P.; Deckwer, W.-D. Design parameters estimations for bubble column reactors. AIChE J. 1982, 28, 353–379. [Google Scholar] [CrossRef]
- Deckwer, W.-D.; Schumpe, A. Improved tools for bubble column reactor design and scale-up. Chem. Eng. Sci. 1993, 48, 889–911. [Google Scholar] [CrossRef]


Disclaimer/Publisher’s Note: The statements, opinions and data contained in all publications are solely those of the individual author(s) and contributor(s) and not of MDPI and/or the editor(s). MDPI and/or the editor(s) disclaim responsibility for any injury to people or property resulting from any ideas, methods, instructions or products referred to in the content. |
© 2023 by the author. Licensee MDPI, Basel, Switzerland. This article is an open access article distributed under the terms and conditions of the Creative Commons Attribution (CC BY) license (https://creativecommons.org/licenses/by/4.0/).