1. Introduction
Since the 1950s, people have observed the effects of climate change. With the development of science and technology, the use of fossil fuels has rapidly trended upward [
1]. A large number of greenhouse gases are emitted into the atmosphere. This phenomenon makes the content of greenhouse gases in the atmosphere increase rapidly, causing global climate and ecological changes. In 2022, the Sixth Assessment Report (AR6) of the Intergovernmental Panel on Climate Change (IPCC) [
1] demonstrated that human activities had caused the global climate to rise by 1 degree Celsius in the past 150 years [
2]. The ocean plays a dominant role in climate-energy reserves. More than
of the net energy increased by global warming is stored in the ocean [
3], and the increased heat causes the seawater to undergo thermal expansion. Combined with the action of land glaciers melting, the rate of sea level rise increases. Sea level changes have a profound impact on coastal areas. In some low-lying areas near the coastlines, changes in sea level threaten human activities and development.
Representative concentration pathway (RCP) is a series of integrated emission scenarios to predict climate change under human activities in the near future [
1]. Meanwhile, it describes greenhouse gas, aerosol emissions, and main-component contents of the atmosphere [
1]. It is an important parameter to study when predicting severe change in the population, the social economy, and future science and land use. The well-known RCPs consist of one high-emission scenario, RCP8.5, two medium emission scenarios, RCP6.0 and RCP4.5, and one low-emission scenario, RCP2.6. RCP8.5, the baseline scenario in the absence of any climate change policy intervention, describes the largest temperature rise, followed by RCP6.0 and RCP4.5. RCP2.6 is a scenario with very low concentrations of greenhouse gases. In the RCP2.6 scenario, changes in energy use lead to significant reductions in greenhouse gas emissions globally. The Fifth Assessment Report also states the predictions on future sea level changes under different emission scenarios. From the year of 2081 to 2100, the global average sea level under RCP2.6 scenario rises by 0.26–0.55 m, the global average sea level under RCP4.5 scenario rises by 0.32–0.63 m, and the global average sea level under RCP8.5 scenario rises by 0.45–0.82 m [
1].
Therefore, sea level rise is an unignorable topic. Sea level rise has the potential to bring hazards to coastal defence structures, including dikes and dams. Several wave parameters influence the performance of coastal structures. For example, sea level rise increases the coastal water depth, which determines the still water level design for defence structure. In this case, some coastal defence structures that have been in operation for a long time may not work correctly under the new water depth. In addition, there is extensive evidence that shows a relation between sea level rise and wave-overtopping at the coast area. For example, T. Prime states that sea level rise motives wave-overtopping to have a bearing on the cost of coastal flood events [
4]. This thesis focuses on the study of the impact of sea level rise on wave-overtopping.
Wave-overtopping is a common phenomenon that happens when waves interact with coastal structures. When designing flood defence structures, overtopping is considered because it may cause instability and damage to the structures [
5]. The discharge of overtopping is an intuitive parameter to measure the degree of wave-overtopping and to determine the crest height of coastal structures. In the case of applying insufficient crest parameter to coastal structure design, the excessive overtop will cause serious impact on the top and rear side of the coastal structure. This design flaw may cause immeasurable loss of property and even loss of human life. Therefore, an accurate estimation of overtopping is of considerable significance to the design of coastal structures and the study of sea level rise effect at the coastal area.
Overtopping refers to water flowing over the top of a structure during the interaction of waves and structures [
5]. Studying the volume of overtopping and the interaction of waves with a structure can better help engineers design coastal buildings. At present, most of the research on wave-overtopping are based on laboratory physics models. Saville [
6] conducted small-scale laboratory experiments for regular wave-overtopping rates and run-up height. Based on the analysis of experiment data, he proposed an averaged overtopping volume formula, and his study enlightened later researchers. Iwagaki et al. [
7] proposed the influence of different water depths and different wave heights toward wave-overtopping. Weggel [
8] summarised the study of Saville and proposed new equations of wave-overtopping over single layer slope structure. Nowadays, empirical formulas of overtopping are popular for practical purposes. Owen [
9] proposed wave-overtopping formulas that overtopping discharge decreases exponentially as the structure crest increases. van der Meer et al. [
10] proposed average overtopping discharge and maximum overtopping discharge formulas based on a lot of experimental research work. His formulas continuously update in recent years and are widely applied around Europe [
5]. In the EurOtop Manual, an overtopping design manual based on European research, the general formulae for wave-overtopping discharges is shown below [
5].
As can be seen, the empirical formulas are experimentally based and are hardly applicable to a complex structure. The method by which to study the overtopping over intricate structure is mainly through physical experiments, and there are some attempts to combine numerical simulation methods with physical experiments. In addition, as seen from the general formula, structure crest is important factor that affects overtopping. Structure crest is affected by wave parameters and water depth. Rising sea levels by global warming must take into account the future design of coastal structures. EurOtop predicts a sea level rise of 0.2 m to more than 1.0 m in the coming century, and it prescribes related standards about sea level rise in overtopping design [
5]. A certain sea level rise level factors should be taken into account, but the range of factors can be differently prescribed by different countries. With regard to structures, various factors such as structural complexity may affect the differing sea level rise return period. A simple design structure, such as earthen dikes can be easily rebuilt to increase structure crest. Therefore a sea level rise with a 50-year return period for a relatively simple design is sufficient. Complex structures such as concrete breakwaters have a lack of flexibility and can hardly be rebuilt [
5]. Therefore a more extended return period of 100 years or more for sea level rise is required [
5].
With the increasing computational capability and improving methods, numerical models have been increasingly used to investigate overtopping phenomena. Navier–Stokes equation-based solvers are often used because these models revolve the most details of fluid flow, including viscosity, turbulence, and overturning breaking waves. Zou and Peng [
11] and Tofany et al. [
12] used a Reynolds-averaged Navier–Stokes (RANS) solver with a finite volume method (FVM) for free surface capturing to model wave-overtopping over breakwaters. Higuera et al. [
13] used a colume-averaged Reynolds-averaged Navier–Stokes (VARANS) method together with VOF in OpenFOAM to perform wave-overtopping simulations over porous structures. Chen et al. [
14] further investigated the influence of turbulence models in a similar numerical framework. Liu et al. [
15] and Huang and Lin [
16] used finite volume method (FVM)-based computational fluid dynamics (CFD) models to study overtopping over different structures. Latham et al. [
17] developed a finite-discrete element method (FEMDEM) for the study of the wave-overtopping effect on armour layers of a breakwater. As overtopping causes complex free surface phenomena and sometimes discontinuous flow, mesh-free particle-based methods such as smooth particle hydrodynamics (SPH) have been applied [
18,
19,
20,
21,
22]. However, one major drawback of the Navier–Stokes equation-based solver is the high demand for computational resources. A simulation of tens of seconds often takes hours or days on high-performance computing (HPC) infrastructure. In order to investigate a large number of scenarios with potentially long durations, faster alternatives are required.
As most overtopping takes place at coastal waters with relative shallow water conditions, depth-averaged shallow water equation (SWE)-based models are used. Hu et al. [
23] and Tuan and Oumeraci [
24] applied nonlinear shallow water equations (NLSW) models to resolve the nonlinearity during the overtopping process. Tonelli and Petti [
25] and McCabe et al. [
26] utilised Boussinesq-type models to simulate wave run-up and overtopping. However, in these models, the dynamic pressure is not well represented. In order to resolve the complex free surface flow during overtopping, nonhydrostatic models are required. For example, the open-source simulating waves till shore (SWASH) model was applied in several studies. SWASH requires only two or three layers in the vertical direction to represent strong nonlinear and dispersive waves at intermediate to deep water depth. Suzuki et al. [
27] has successfully simulated overtopping over smooth and non-permeable breakwaters by using SWASH. Zhang et al. [
28] further simulated wave-overtopping over a more complex structure of an Accropode armoured breakwater.
However, SWASH relied on the number of vertical layers to obtain good representation of nonlinear and dispersive wave properties; with each increase of the layers, the computational cost increase drastically. It was reported by Monteban [
29] that the simulation time using two layers is nearly 10 times that of a single layer. An alternative for intermediate water depth dispersive wave modeling is to assume a quadratic nonhydrostatic profile without the additional layers [
30]. Following this approach, REEF3D::SFLOW [
31] was developed as a part of the open-source hydrodynamic framework REEF3D [
32]. Though the model has shown great computational efficiency and accuracy for shallow to intermediate water waves, wave-structure interactions, and wave propagation on a large scale over varying bathymetry, it has not been applied to and validated for overtopping. The capability of the quadratic nonhydrostatic for overtopping application is unknown.
In addition, most previous studies have been focused on mildly sloping breakwaters. For many of these structures, there are existing empirical formulas and guidelines as design reference. However, new and complex designs, such as the double-dike structure reports by Mokos et al. [
33] don’t have benchmarks to evaluate and require thorough experimental and numerical assessment. The novel double-dike structure from Mokos et al. [
33] aimed to improve the ability to prevent flooding and had an extended vertical structure that created a drastic change in geometry, which caused challenges to the computational grid. The inclusion of a thin and extended structure is a challenge in the numerical model. The possibility of using the quadratic nonhydrostatic SWE model for the complex structure needs to be explored.
In this study, the SWE-based model REEF3D::SFLOW with a quadratic nonhydrostatic assumption is to be evaluated for its capability of predicting overtopping volumes over a complex structure for the first time. The nonhydrostatic SWE model has much improved computational efficiency and thus can be used for large coastal protection structures and a large number of different scenarios. The study will first validate the numerical model against an experiment for a sophisticated double-dike defence structure. Then the overtopping characteristics of the coastal protection structure will be examined under different climate-change-induced sea level rise (SLR) scenarios. The study provides a fast and validate model and approach for coastal structure adaptions and further designs in a changing climate.
3. Results
In the previous section, regular wave scenarios, breaking wave scenarios, and large-scale wave propagation over real topography are simulated to verify REEF3D::SFLOW feasibility. REEF3D::SFLOW can effectively simulate various characteristics of wave propagation near the shore, and the computed results can be used in scientific research and engineering projects. Nowadays, coastal projects are often complex in structure and many known semi-empirical formulas cannot be applied to complex structures. The main focus of this chapter is the application of REEF3D::SFLOW as a tool to investigate wave propagation on intricate structures, especially wave elevation and wave-overtopping. A case of simulating regular wave propagation on a complex coastal structure is studied in this chapter. The studied model is referred from Mokos et al. [
33], which concerns the simulation of wave-overtopping on a complex coastal structure by using SPH. In this chapter, a summary of the complex coastal structure elements is given, followed by the detailed simulation domain setup process. The simulation data is compared with experimental measurement to determine model validation. The measurements of the physical experiment are based on the figures of the Mokos et al. [
33] report. A Matlab GUI subroutine named Image2Data [
41] is used to obtain accurate physical experiment data from Mokos’ report [
33]. The free surface position at designed wave gauges and the overtopping volume are studied. Finally, this chapter simulates the effect of sea level rise on the overtopping discharge under different representative concentration pathway scenarios.
3.1. Experimental Setup
In this chapter, a complex double-dike defence structure is studied for the effect of sea level rise on wave-overtopping.
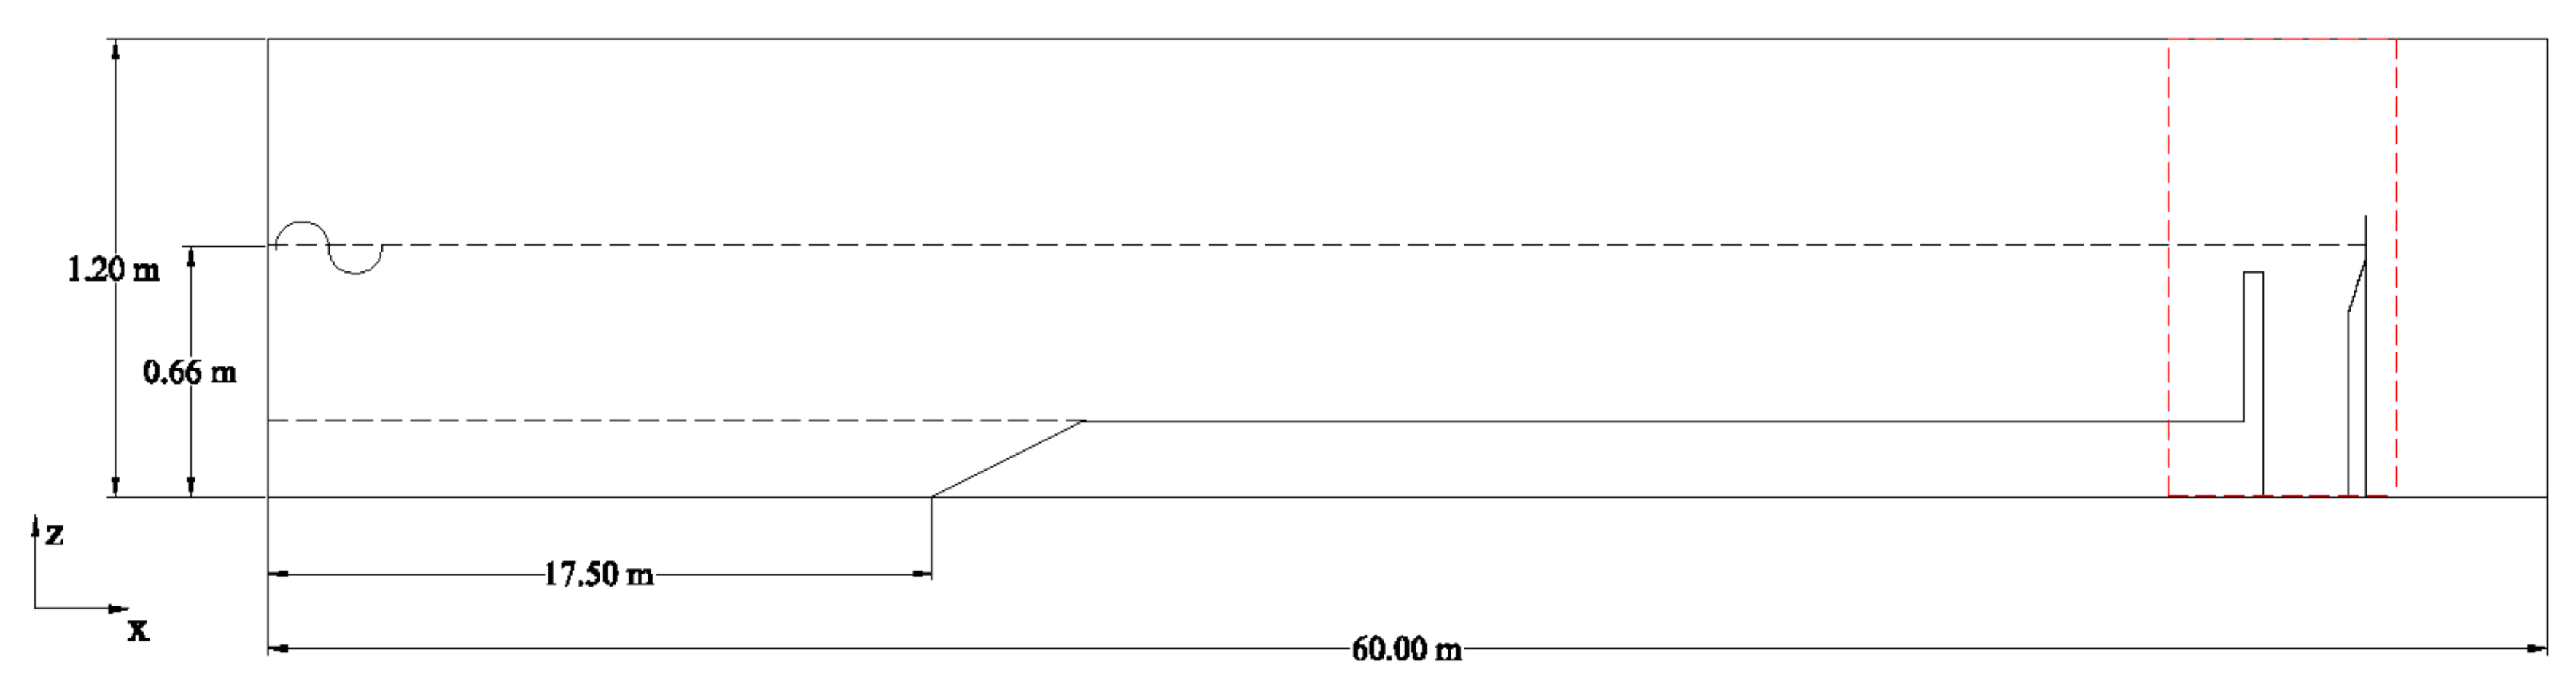
Figure 2 shows an overall sketch of a physical experimental setup in Mokos’s report. The physical wave tank has dimensions of 60 m in length, 1.5 m in width and 1.2 m in height. The static water depth inside the wave tank is 0.66 m. The first part of the water wave tank simulates a water channel of 52 m in length. A slope with the steepness of 0.05 is placed at a location 17.5 m away from the beginning of the channel. The slope levels up the channel bottom to 0.2 m at location 21.5 m away from beginning, and the channel bottom stays constant until it reaches the dike structure. The second part of the wave tank is a defence structure that consists of two dike elements. The details about two dike elements are shown in
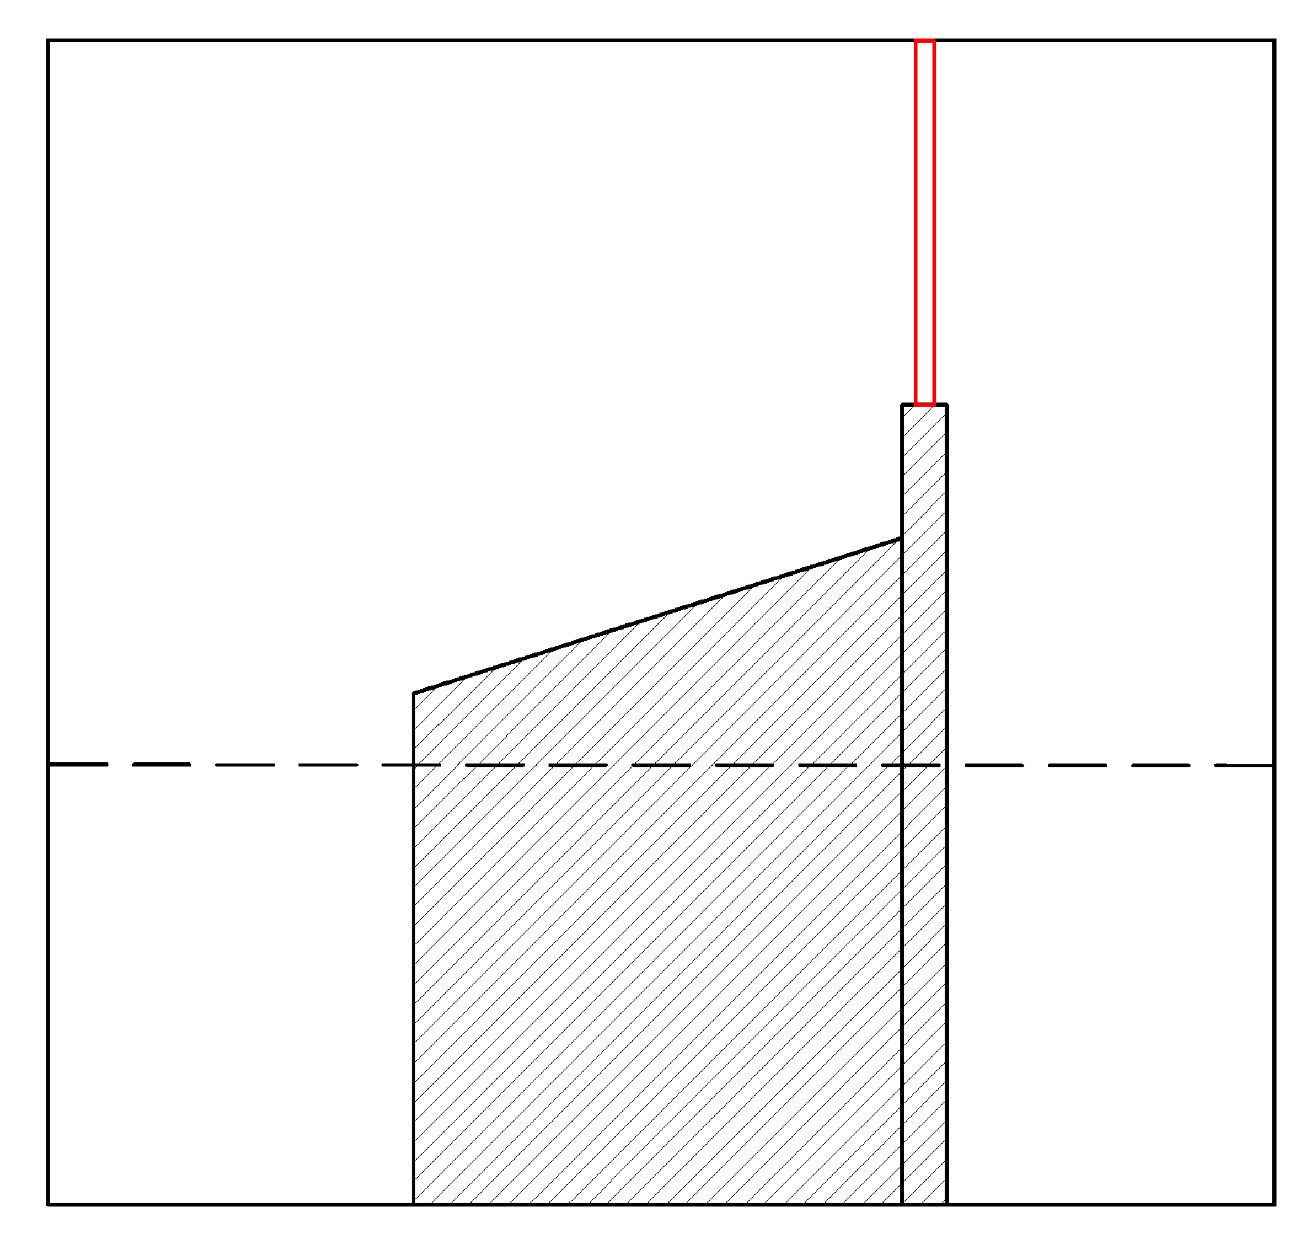
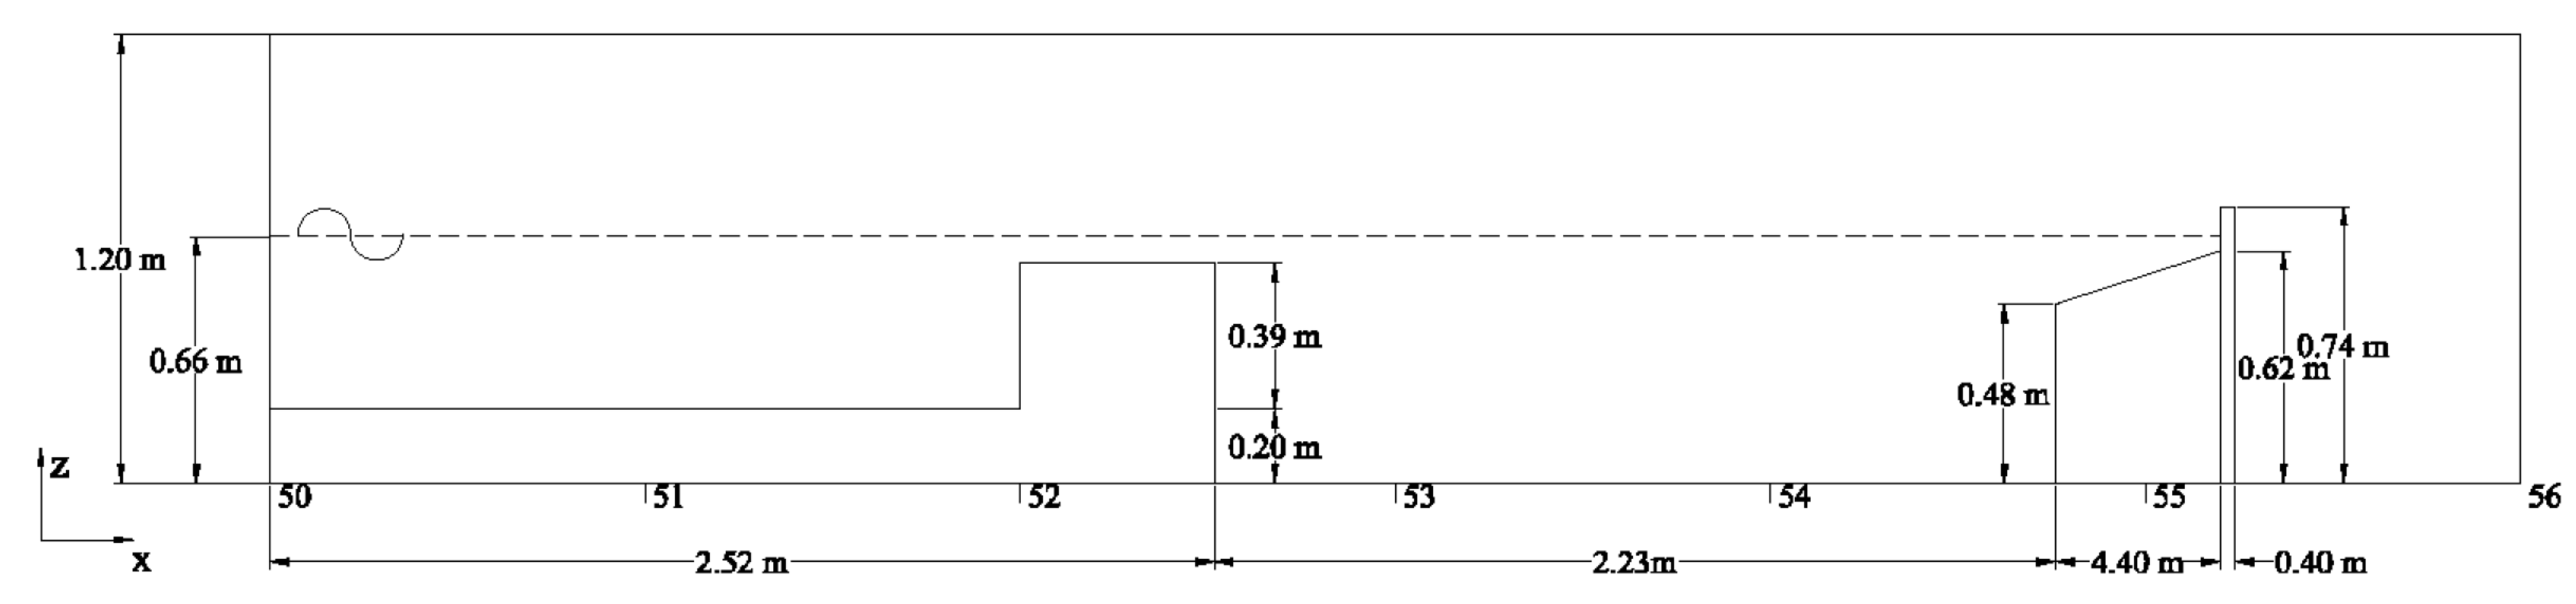
Figure 3. The first dike element is rectangular, 0.52 m in length and 0.59 m in height. The first dike is supposed to be submerged in order to simulate potential flooding conditions. The second dike element has a quadrangle shape with a slope on the top. The slope steepness is 0.015 and increases from 0.48 m to 0.62 m. The second dike is supposed to be submerged as well during the experiment. A wall with a width of 0.04 m and height of 0.74 m is placed right behind the second dike, followed by a water-gathering tank to measure the overtopping volume of the structure. The immersed wall stops water from running into the water tank before the wave generator starts. The generated wave has a wave period of 2 s and a wave height of 0.22 m. The wavelength calculated by wave dispersion relation is 3.941 m. Mokos et al. [
33] calculates the wave celerity for shallow water wave to be 2.54 m/s. The dimensions of the structures and the locations of the wave gauges in the physical experiment are summarised in
Table 1 and
Table 2.
3.2. Numerical Configuration
The two-dimensional numerical wave tank is adopted from Jin [
42], and is 16 m long, 1.5 m wide, and 1.2 m high, as shown in
Figure 4. For computation efficiency, the channel length of the physical experiment is shortened. The wave generates at a distance of two wavelengths (8 m) away from the first dike element. This distance enables the wave maker to generate stable waves before waves reach the operation zone where the dike elements are located. The slope that levels up the channel bottom by 0.2 m in the physical experiment is ignored in the numerical simulation. The channel bottom is at 0.2 m from the beginning of the numerical wave tank to simulate the last 8 m of the physical water channel. Therefore all structural elements are relocated to new positions in the simulation. The specific values of each element are shown in the
Table 3. The wave gauges locations are shown in the
Table 4.
The second-order Stokes wave theory is applied as the wave generation method. The designed wave height is 0.22 m, and the wave period is 2 s. At the initial condition, the water depth is 0.66 m over the whole wave tank domain. In order to limit effects by secondary reflection and transmitted waves from structure elements, wave generation and absorption methods are set as the relaxation method. A wave-generation zone of 4 m is set at the inlet of wave tank, and a wave dissipation zone of 4 m is set at the outlet of the wave tank. The main structural elements for dike system are located in the operation zone of numerical wave tank from 4 m to 12 m. The Courant–Friedrichs–Lewy number in this model is 0.3, set as same as applied in Mokos’ physical experiment [
33]. The total simulation time is 40 s. The first 15 s allows the wave to propagate to the dike structure. Within the next 5 s, the waves propagate over the complex structure and deform for the first time. In the remaining time, the system is gradually stable for data record and analysis.
There is a summary of the differences between the physical experiment setup and the numerical wave tank setup: 1. In the numerical simulation, with regard to simulation efficiency, the water channel is shortened to 8 m. According to Mokos’ calculations, the designed wavelength is 3.941 m [
33]. Therefore, the number of waves on the ignored wave channel (44 m) is a non-integer. This indicates there is a time difference when waves arrive at the water gauge location. The figures concerning Mokos’ experiment measurements in this chapter are all slightly adjusted in the timeline to compare with the simulation results:
- 1.
The channel slope design is removed in the simulation. Therefore, the measurement of wave elevation along the water channel may cause more nonlinearity due to channel slope in the physical experiment.
- 2.
In Mokos’ physics experiment [
33], waves are generated by piston wavemaker. In the numerical wave tank simulation, the second-order Stokes wave theory is applied as generated wave theory.
- 3.
At the initial position of Mokos’ physics experiment [
33], the overtopping collect tank behind the wall element is empty. In contrast, in the numerical simulation, the initial water depth is 0.66 m over the whole wave tank domain, including the domain behind the wall element.
3.3. Validation
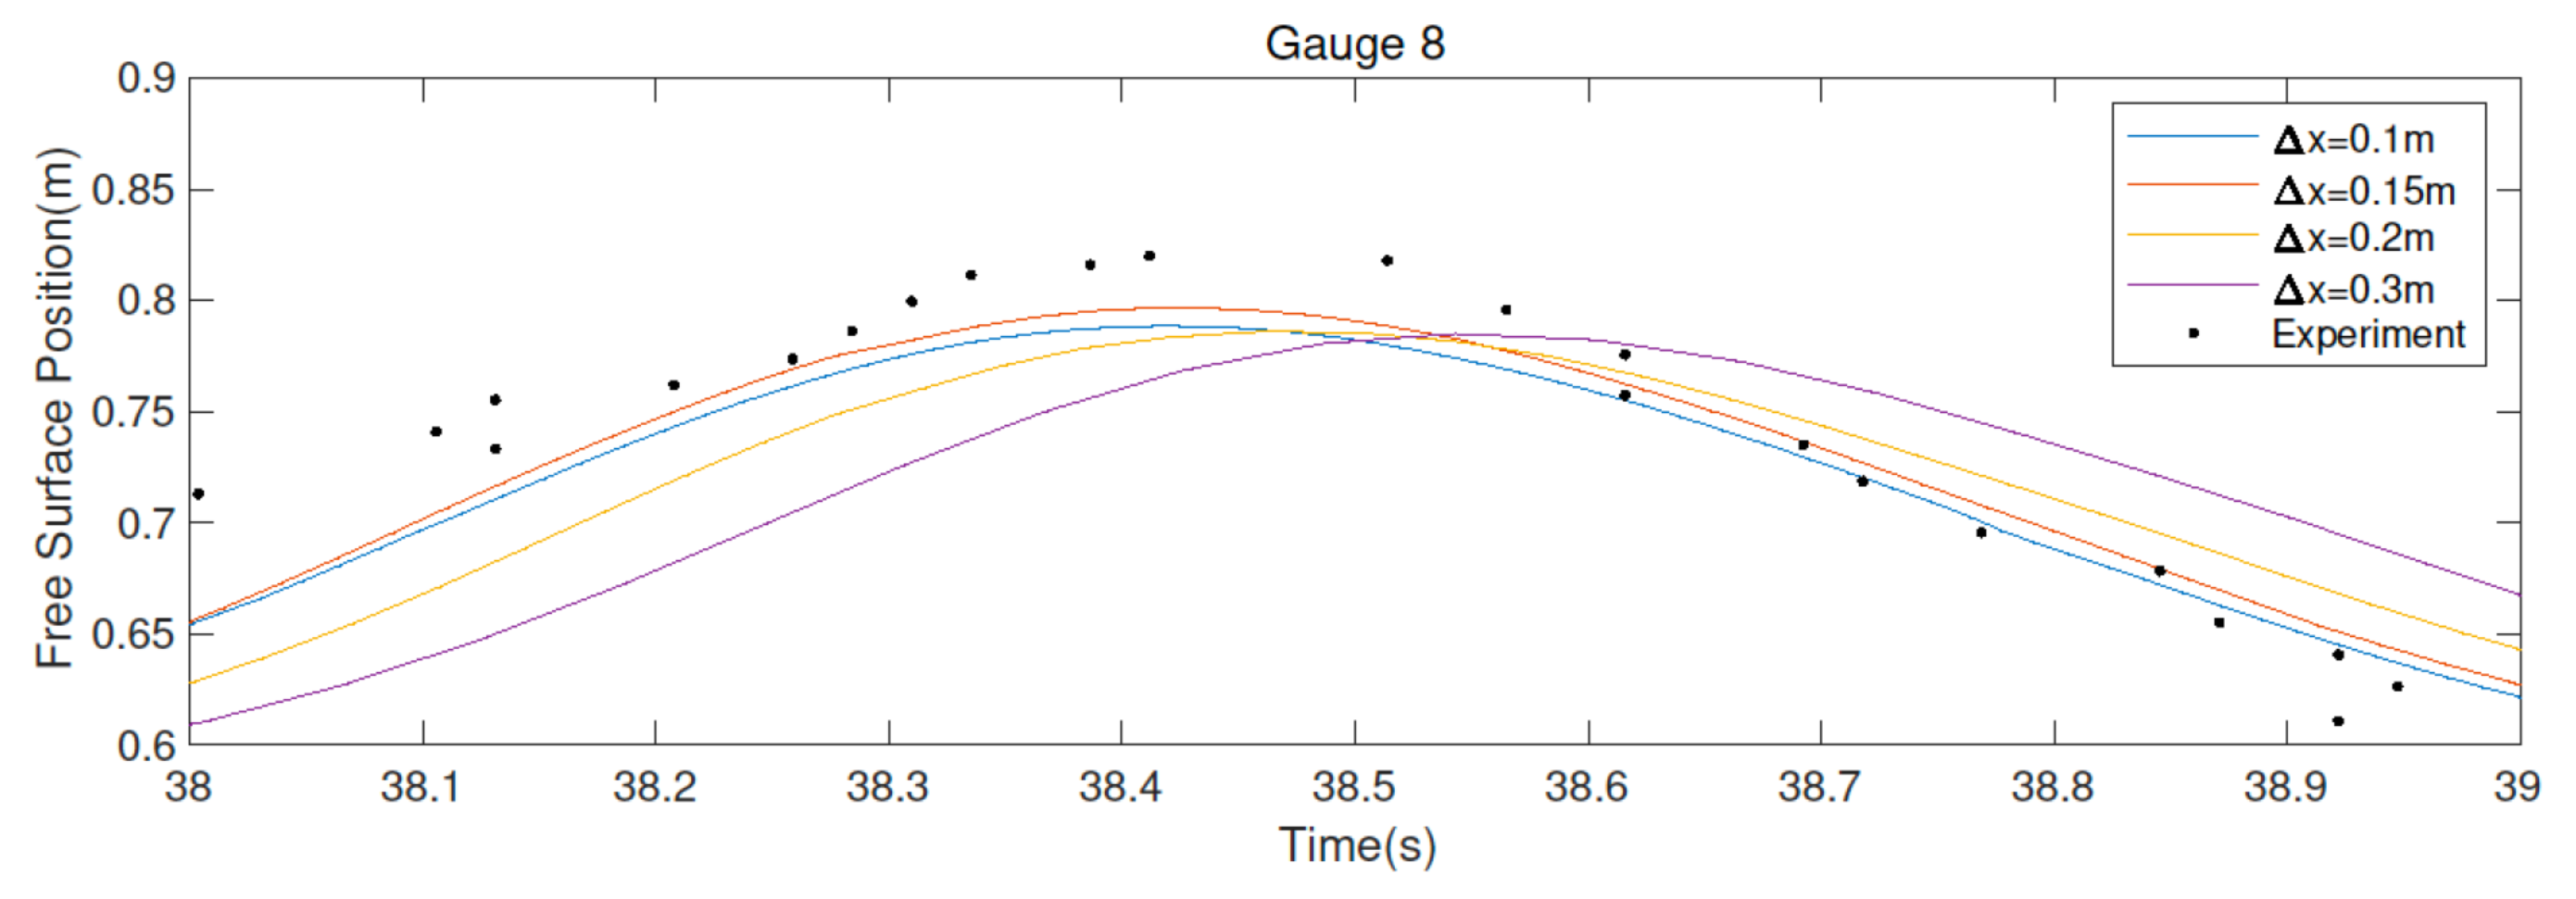
In order to verify whether the numerical water tank established by the above method is valid, the simulation results and experimental data are compared. The difference is observed to verify whether the degree of fitness meets the requirements. However, before comparison, the convergence of the cell needs further verification. The wave profile recorded by WG8 is selected because the wave is still stable before it interacts with the first dike element, as shown in
Figure 5. The time period is selected to be 38 s to 39 s because operation time is long enough to generate a stable wave profile. According to
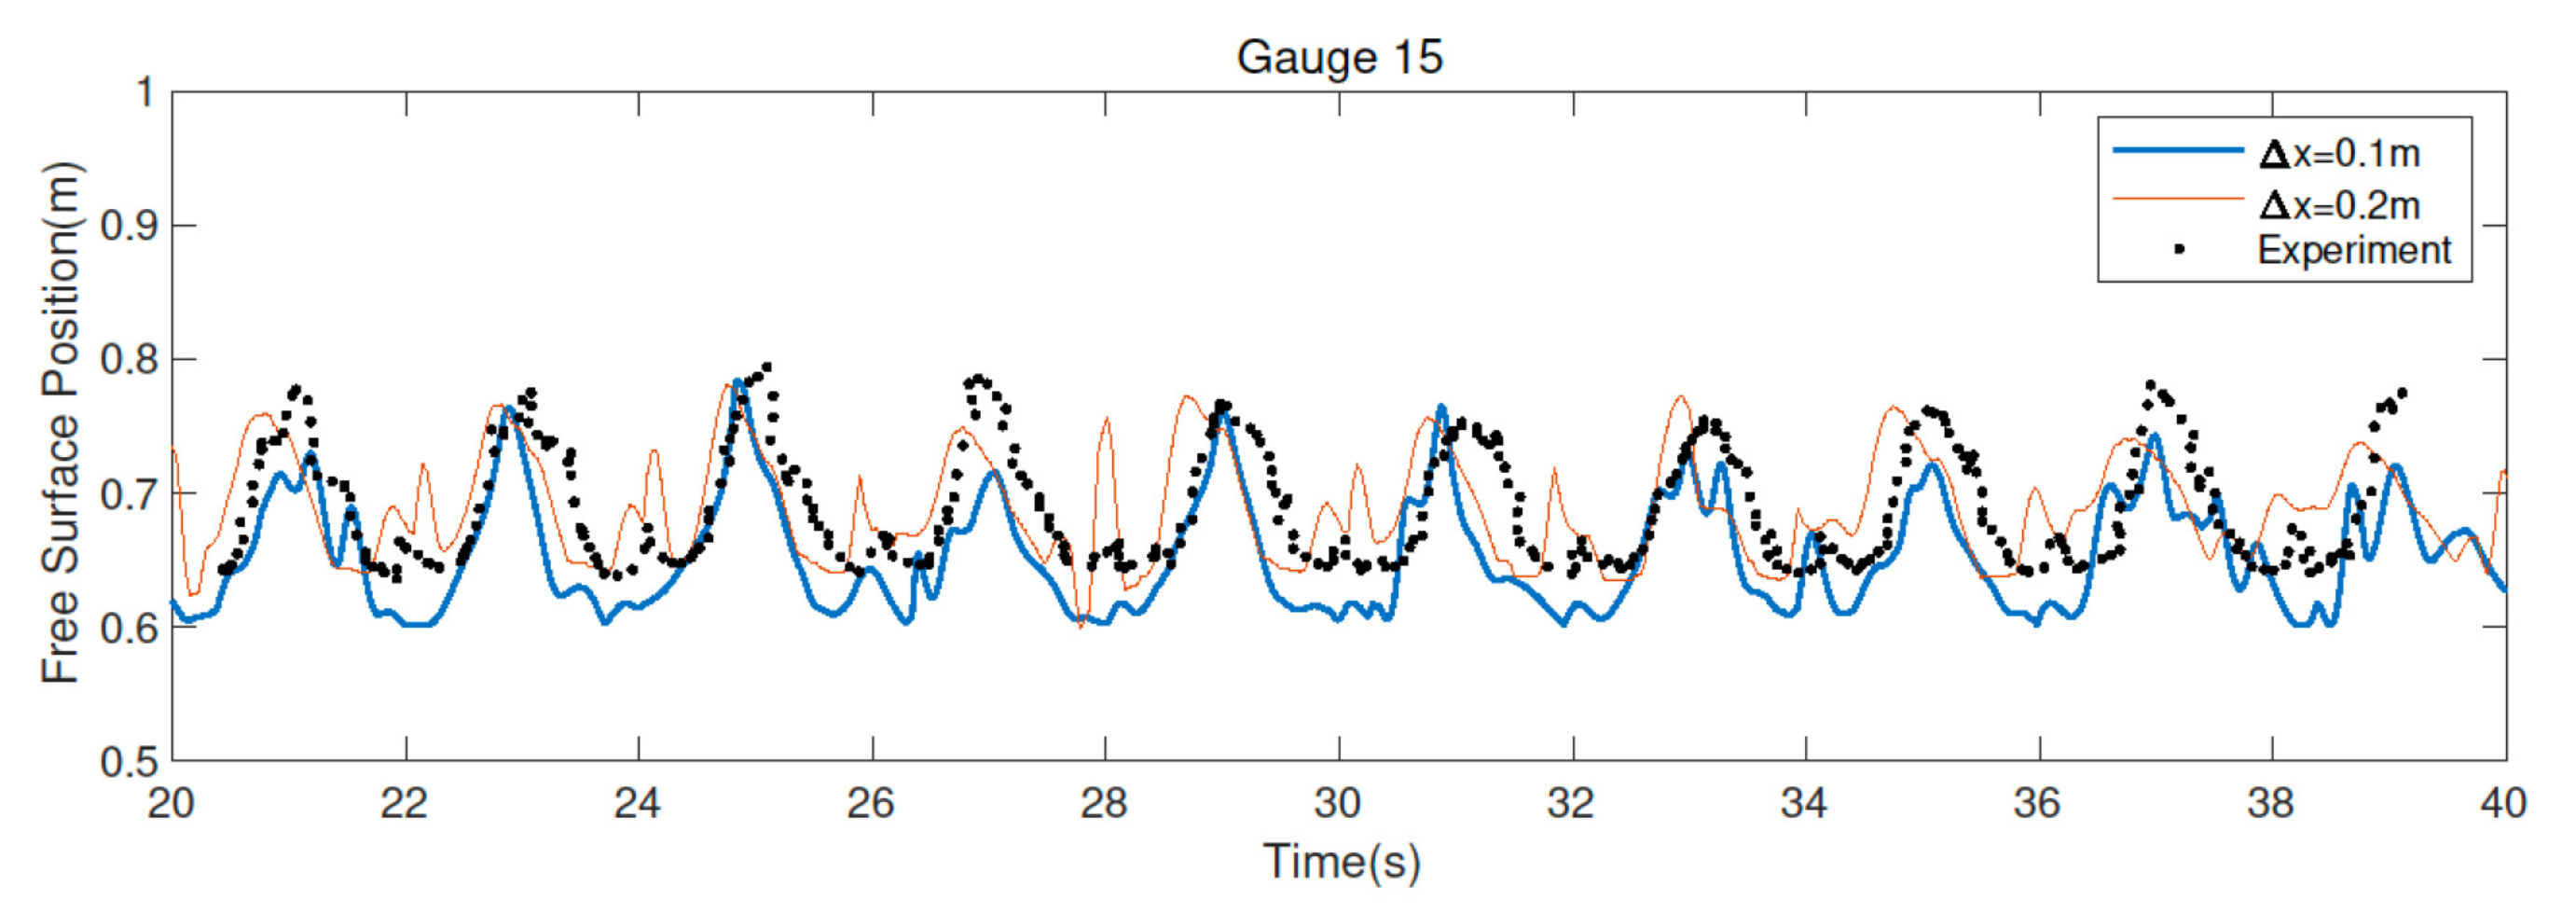
Figure 5, simulation of cell size 0.1, 0.15, 0.2, and 0.3 m are compared with the experiment measurements. As can be seen, the cell size of 0.1, 0.15, and 0.2 m have similar patterns as the experimental measurements; this therefore shows their convergency. The wave profile of cell size 0.1 m has little difference from the wave profile of cell size 0.15 m. However, the wave profile of cell size 0.3 m does not fit the experimental measurement sufficiently. Therefore, the cell size of 0.1 m and the cell size of 0.2 m are chosen in this model. By comparing the simulation results of two different cell sizes, the pattern of resolution on the simulation can also be analysed in this section. The surface elevations at WG15 using the two finest grids are also compared in
Figure 6. It is seen that emerging high frequency wave components are formed after the waves propagate over the first dike. There are visible differences in the wave trough for the principal wave and high-frequency waves. However, the wave crests are generally well captured when the fine grid is used.
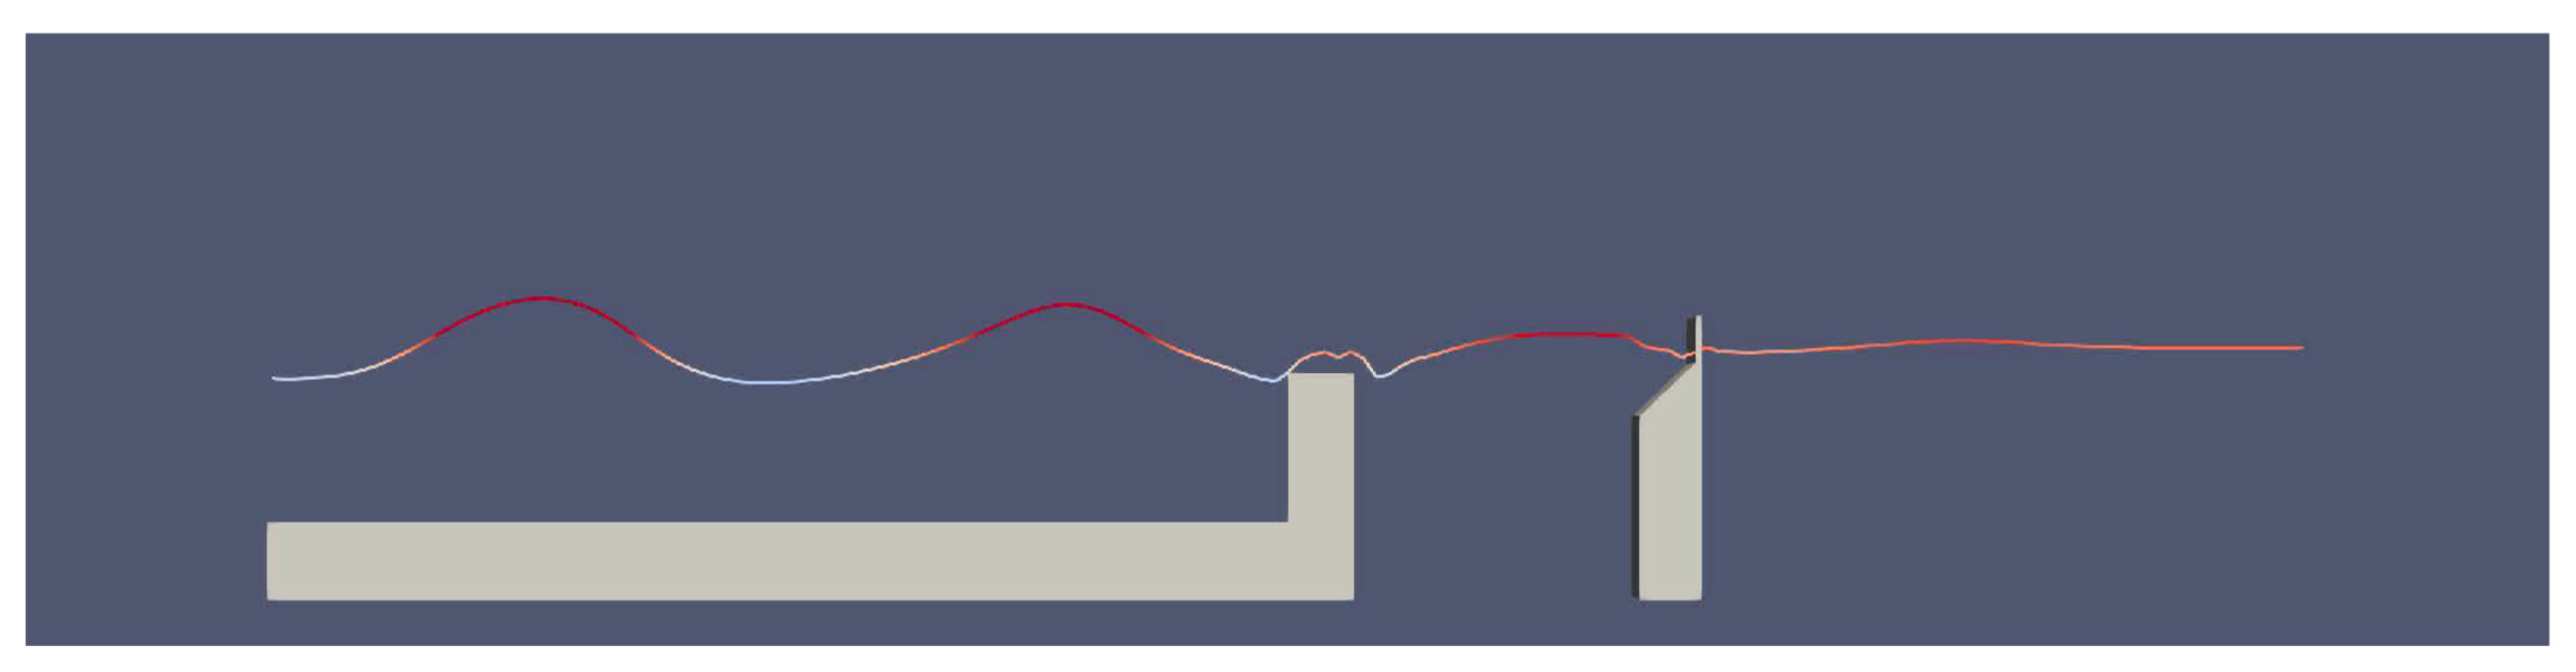
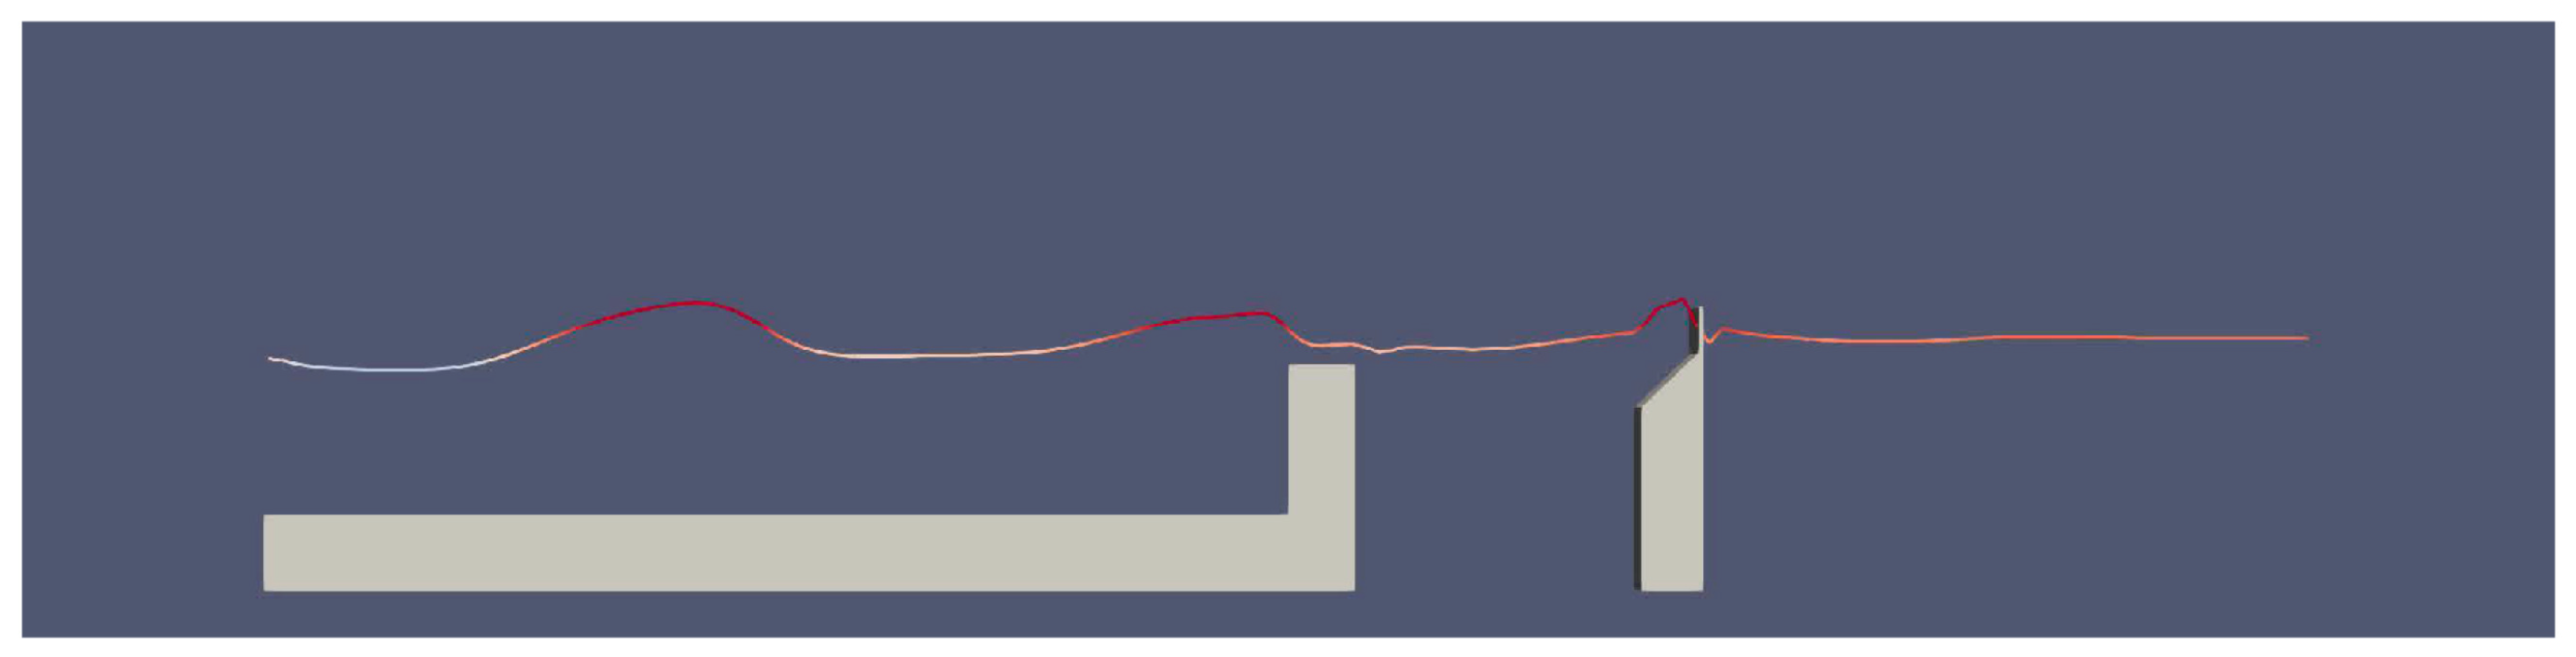
Figure 7 and
Figure 8 show the wave surface elevation near the structures at location
s and
s, where an exceeding wave crest over the structure crest is observed.
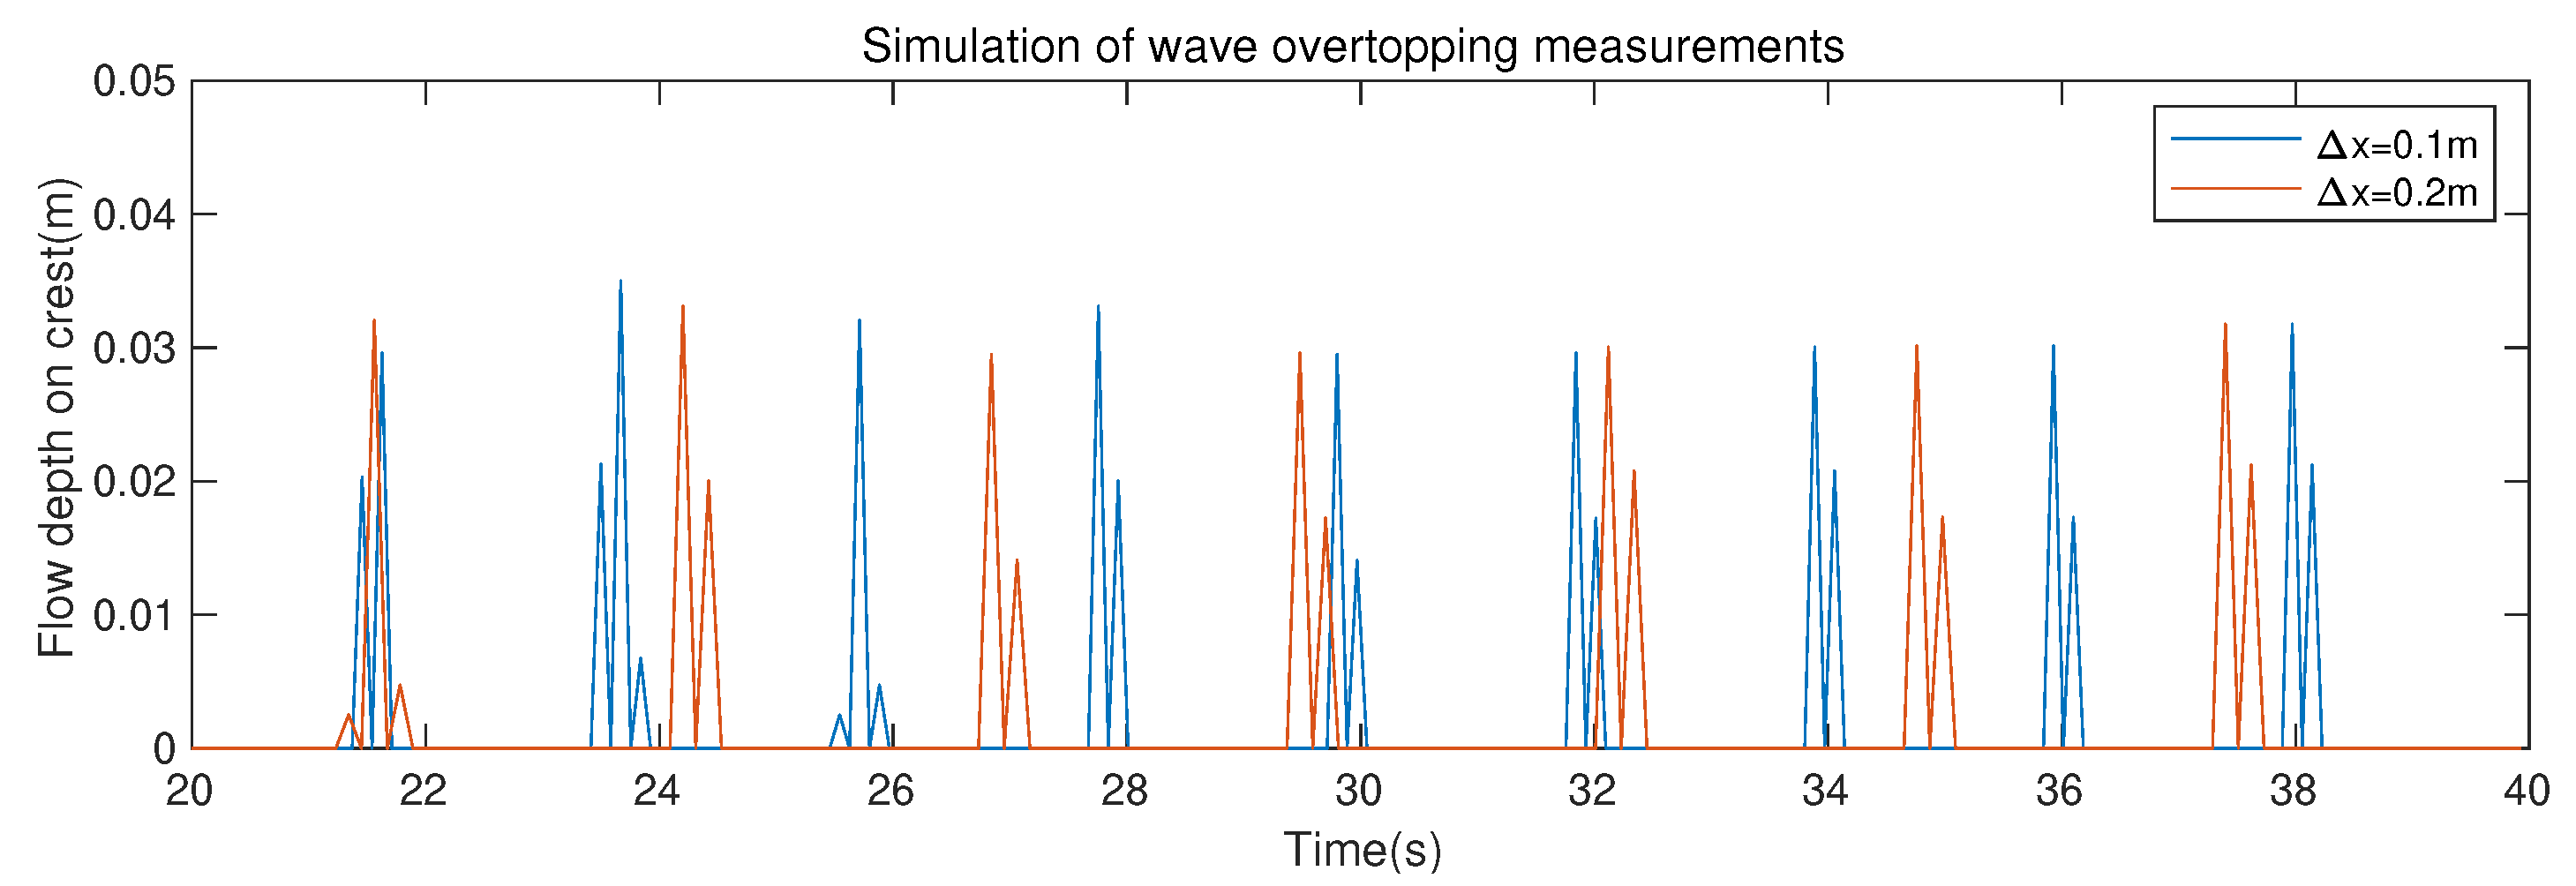
Figure 9 shows the exceeding wave elevation over the wall crest at location
m between
s and
s. On average, every 2 s, there is a wave with an elevation higher than the wall crest. For every wave-overtopping, the exceeding water elevation over the structure crest is different, which indicates that there is a certain randomness in the process of wave-overtopping. The average maximum of the excess water elevation is 0.03 m higher than the structure crest.
At each event when the wave crest exceeds the dike height, overtopping takes place. The exceeding water surface elevation over the structure crest during the investigated period is shown in
Figure 9. As a result, the accumulative overtopping volume increases incrementally rather than continously, as seen in
Figure 10.
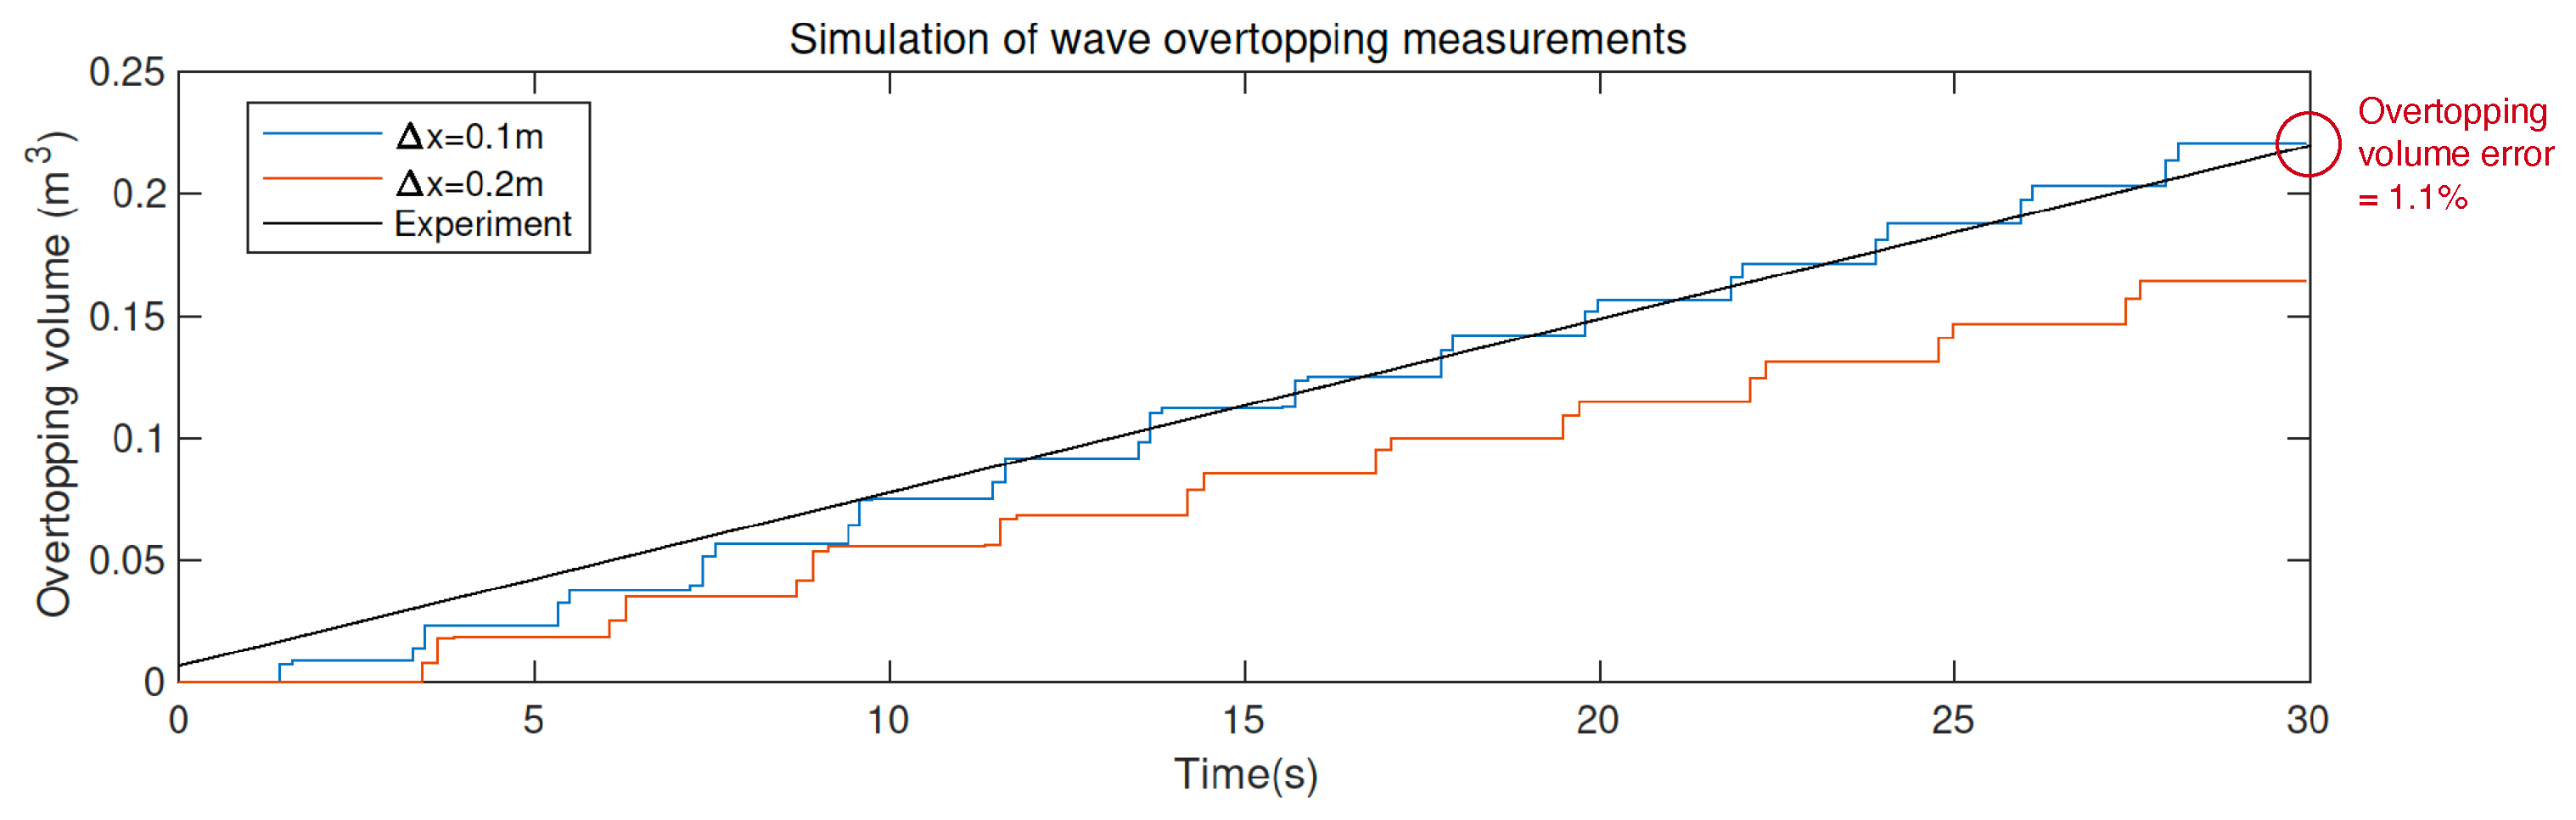
The data in the physical experiment does not include the time evolution of overtopping, but only the final overtopping value and total time. Therefore, it is assumed that the overtopping volume in the physical experiment increases linearly.
Figure 10 shows the evolution of overtopping volume at two different resolutions. The simulation data result with a grid size of 0.2 m is lower than the experiment. At a coarser resolution, the wave surface fluctuates greatly, so the simulation results should be quite different from the experimental results, which is also in line with our expectations.
As the resolution becomes more precise, the simulated data with a grid size of 0.1 m is very close to the experimental data. At this resolution, for this dike design numerical simulation, the amount of surging is slightly higher than the experimental data. At the end of the testing period, the total overtopping volume in the numerical simulation is
above the experimental measurement, as marked in
Figure 10. For engineering design, this is a safe simulation because the simulation is not underestimated, and the result is in line with our expectations.
The 40-s simulation in REEF3D::SFLOW takes 50 s in real time on a MacBook Pro with parallel computation using 8 cores (2.4 GHz Intel i9 core). In order to produce the same wave conditions in the same numerical wave tank, the two-phase CFD model REEF3D::CFD [
32] is used, where 21 h of computational time is required on the same laptop. As a result, the nonhydrostatic shallow water model is about 1500 times as fast as the two-phase CFD model. This confirmed the findings from Wang et al. [
43] where different modeling strategies are compared. Because most regions where overtopping is relevant have shallow water conditions and the geometric representation of breaking waves is not as important, the shallow water equation-based nonhydrostatic model REEF3D::SFLOW is found to be an attractive alternative to traditional two-phase CFD models. The drastic speed improvement is significant for long-term climate-change-related overtopping studies.
3.4. Overtopping under Future Scenarios
In order to understand the impact of sea level rise on overtopping, in the existing numerical simulation tank model, the initial water surface is reset to the future sea level predicted by IPCC, as shown in
Table 5:
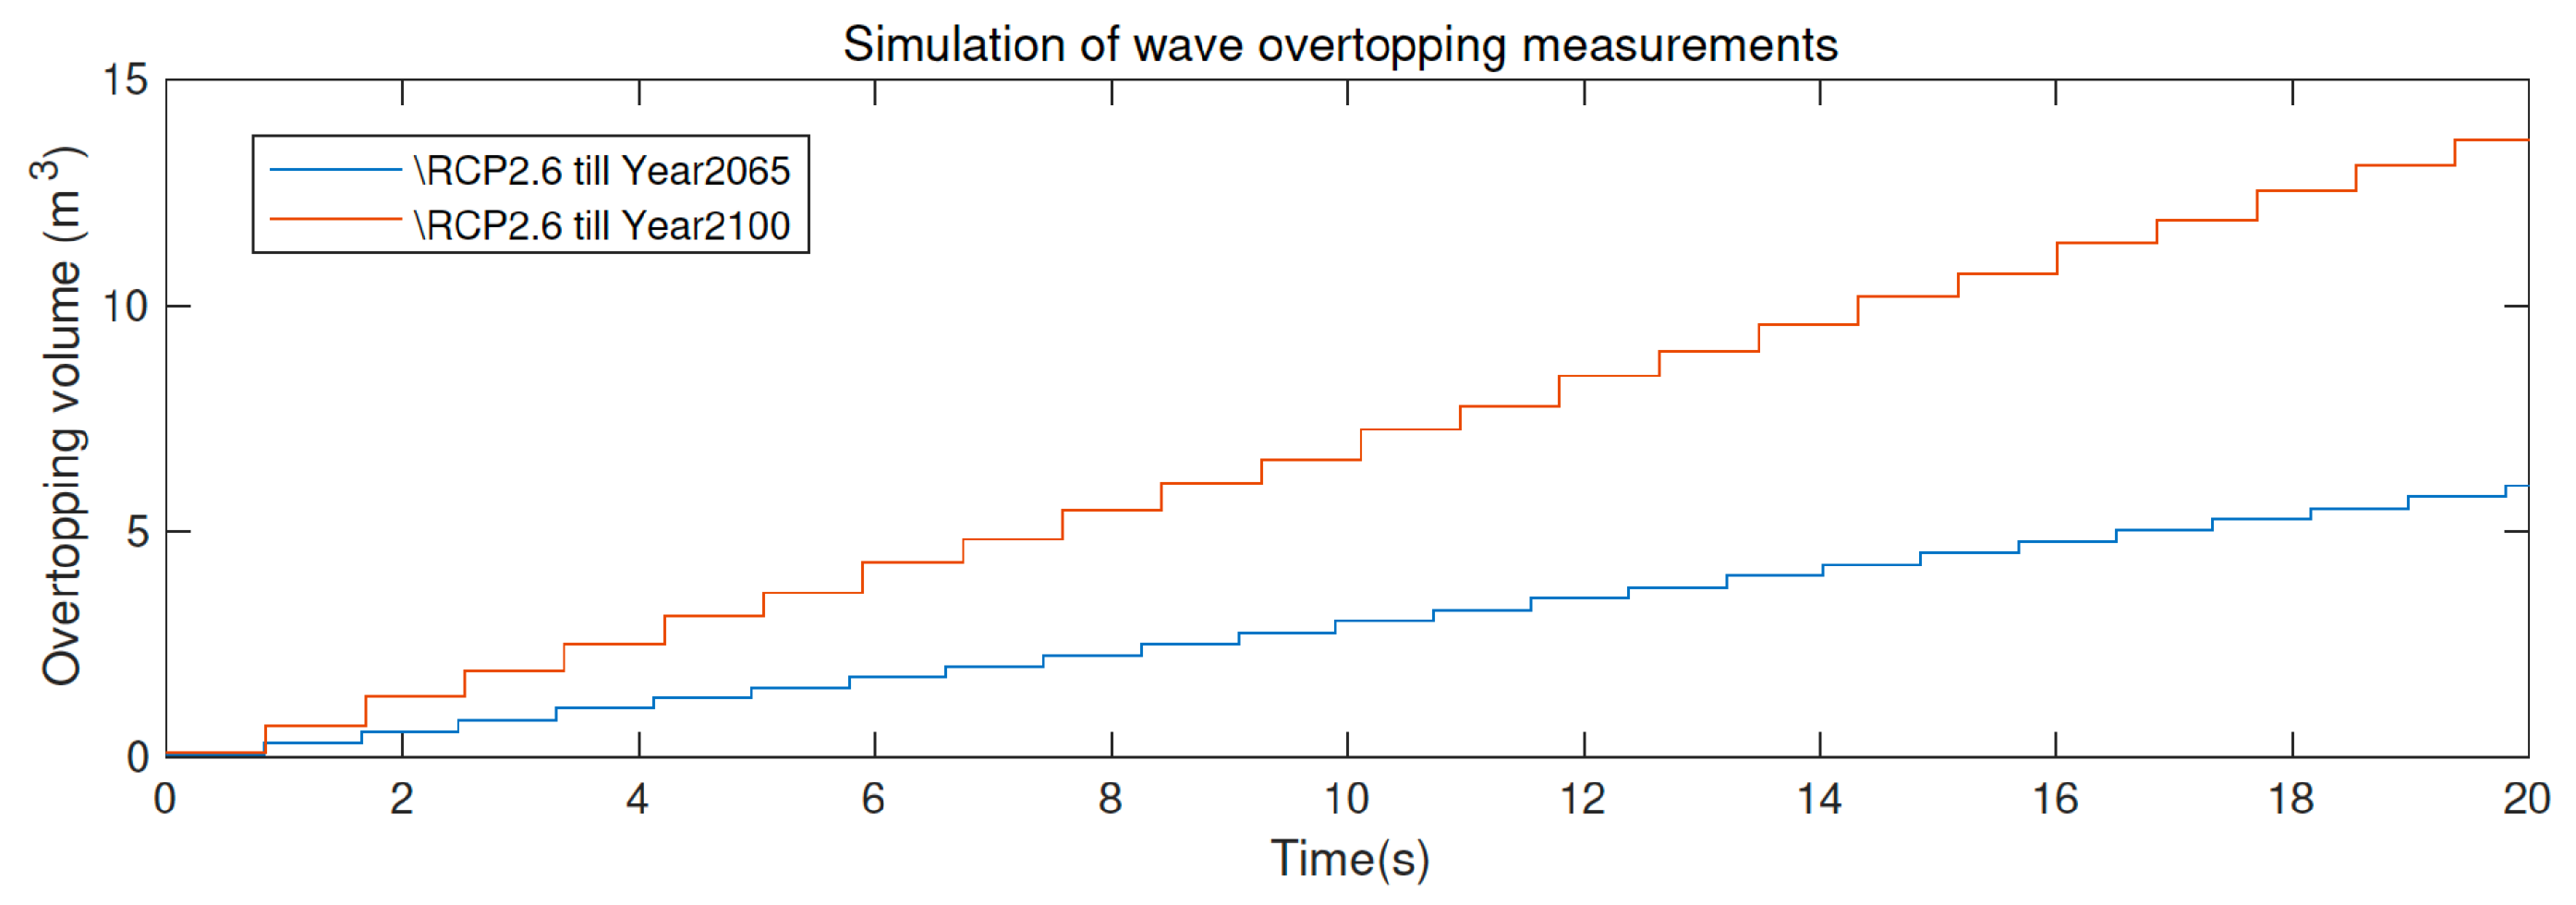
In this section, a total of eight sets of overtopping evolution under different water surfaces are simulated. They are the sea level after sea level rise in 2065 and 2100 under the four emission scenarios of RCP2.6, RCP4.5, RCP6.0, and RCP8.5 respectively. This also complies with the restrictions set forth in the EurOtop manual. Small-scale protective buildings need to consider the sea level rise over the next 50 years, that is, until 2065. Complex and difficult-to-renovate protective buildings need to consider the sea level rise in the next 100 years, that is, until 2100.
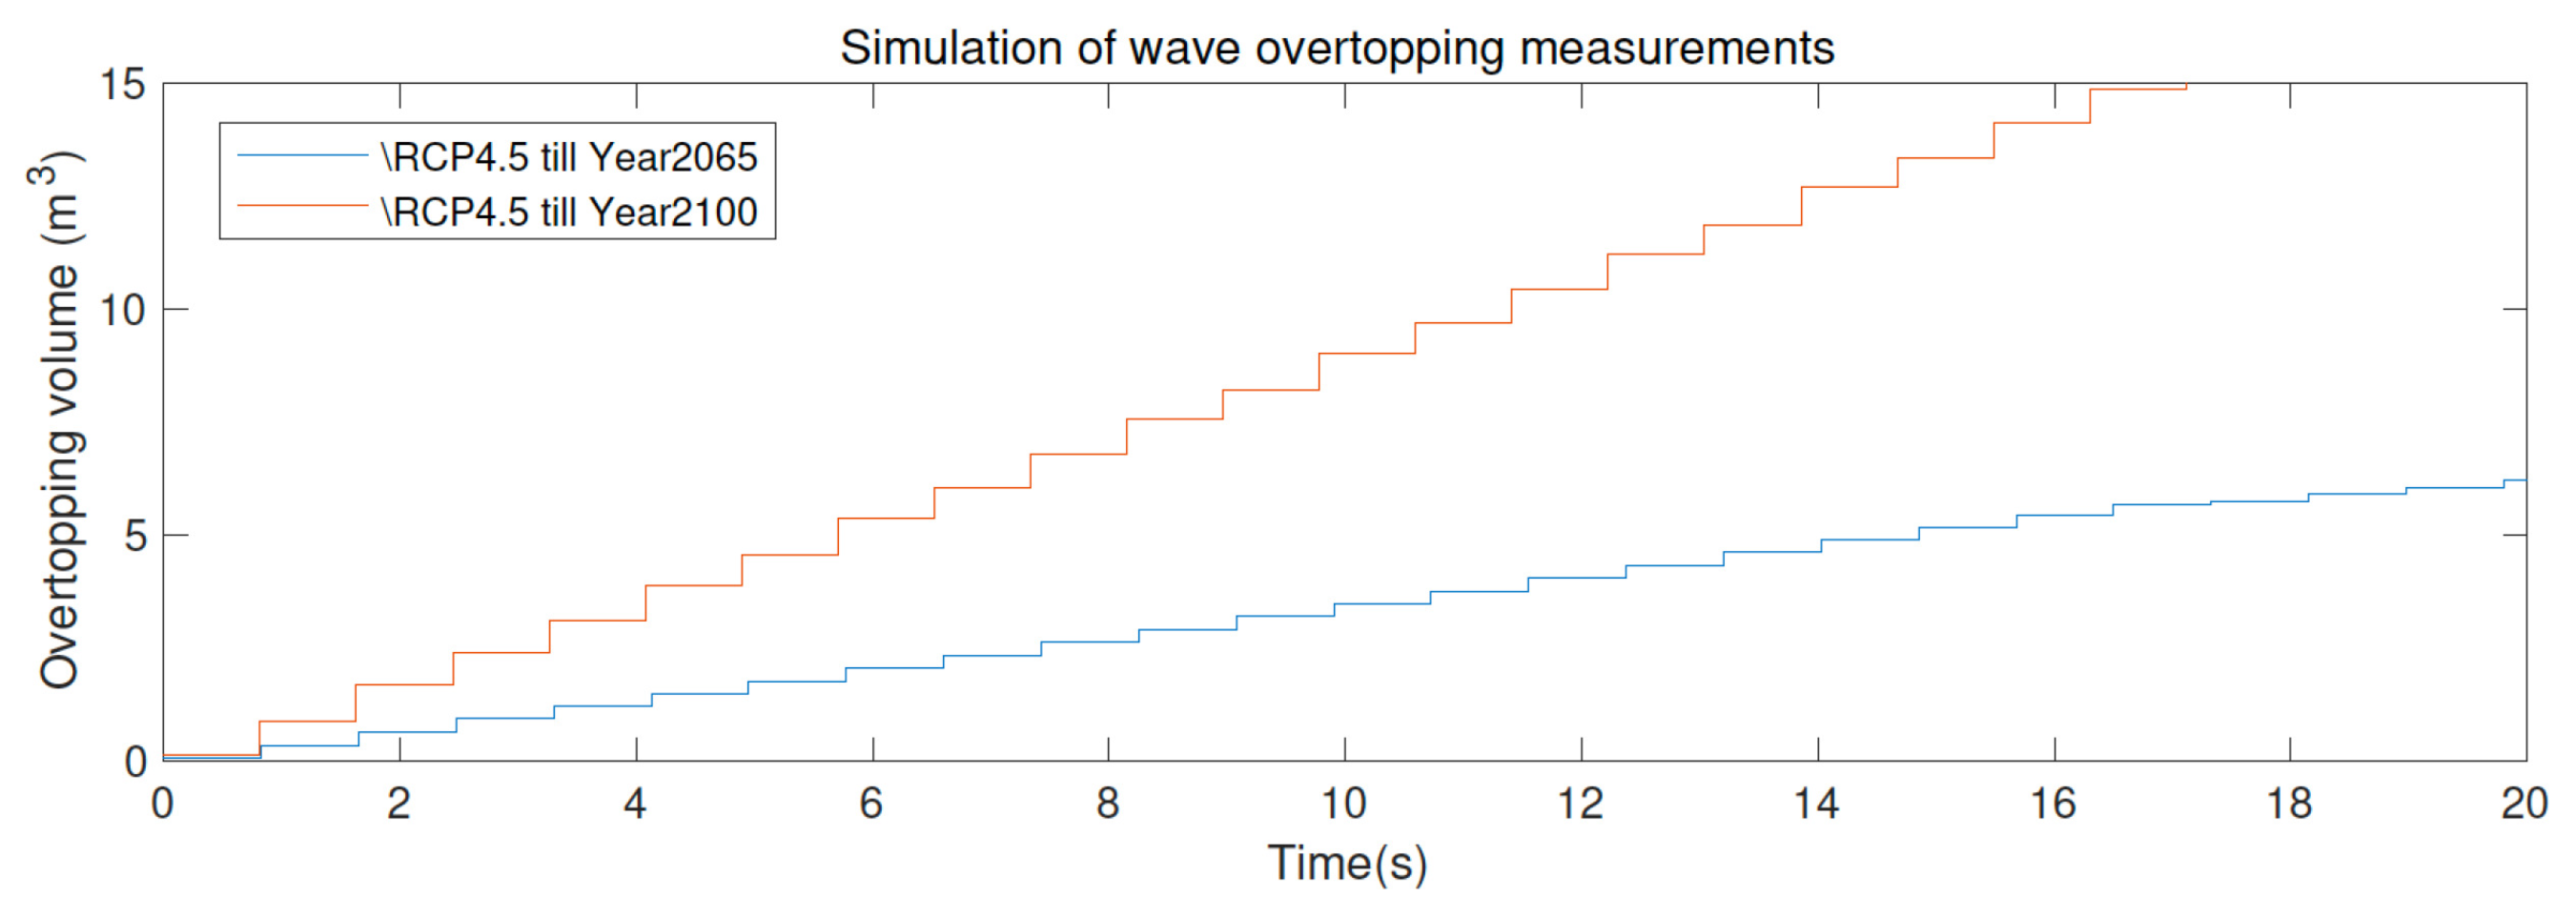
In the RCP2.6 emission scenario, until 2065, the average sea level rises to 0.24 m, and the water level is high enough to cover the wall crest. When overtopping occurs, more than 5 of waves will be generated in an average of 20 s. When the sea level rises by 0.44 m, which is about the sea level in 2100, the amount of surging is even more uncontrollable, with nearly 15 of surging every 20 s. In this case, it is necessary to reconsider the design of the protective building, and reduce the wave-overtopping by improving the crest or remodeling the building. In the RCP4.5 emission scenario, until 2065, the average sea level rises to 0.26 m, and the water level is high enough to cover the wall crest. When overtopping occurs, more than 5 of waves will be generated in an average of 20 s. This overtopping rate is similar to that of RCP2.6. When the sea level rises by 0.53 m, which is about the sea level in 2100, the amount of wave-overtopping is even more uncontrollable, with nearly 15 of overtopping volume every 15 s. In this case, the protective building must be redesigned and constructed because the protective building at this time will not slow down the overtopping.
In the RCP6.0 emission scenario, until 2065, the average sea level rises to 0.2 m, and the water level is high enough to cover the wall crest. When overtopping occurs, more than 5
of waves will be generated in an average of 20 s. This overtopping rate is similar to that of RCP2.6 and 4.5. When the sea level rises by 0.55 m, which is about the sea level in 2100, the amount of wave-overtopping is even more uncontrollable, with nearly 15
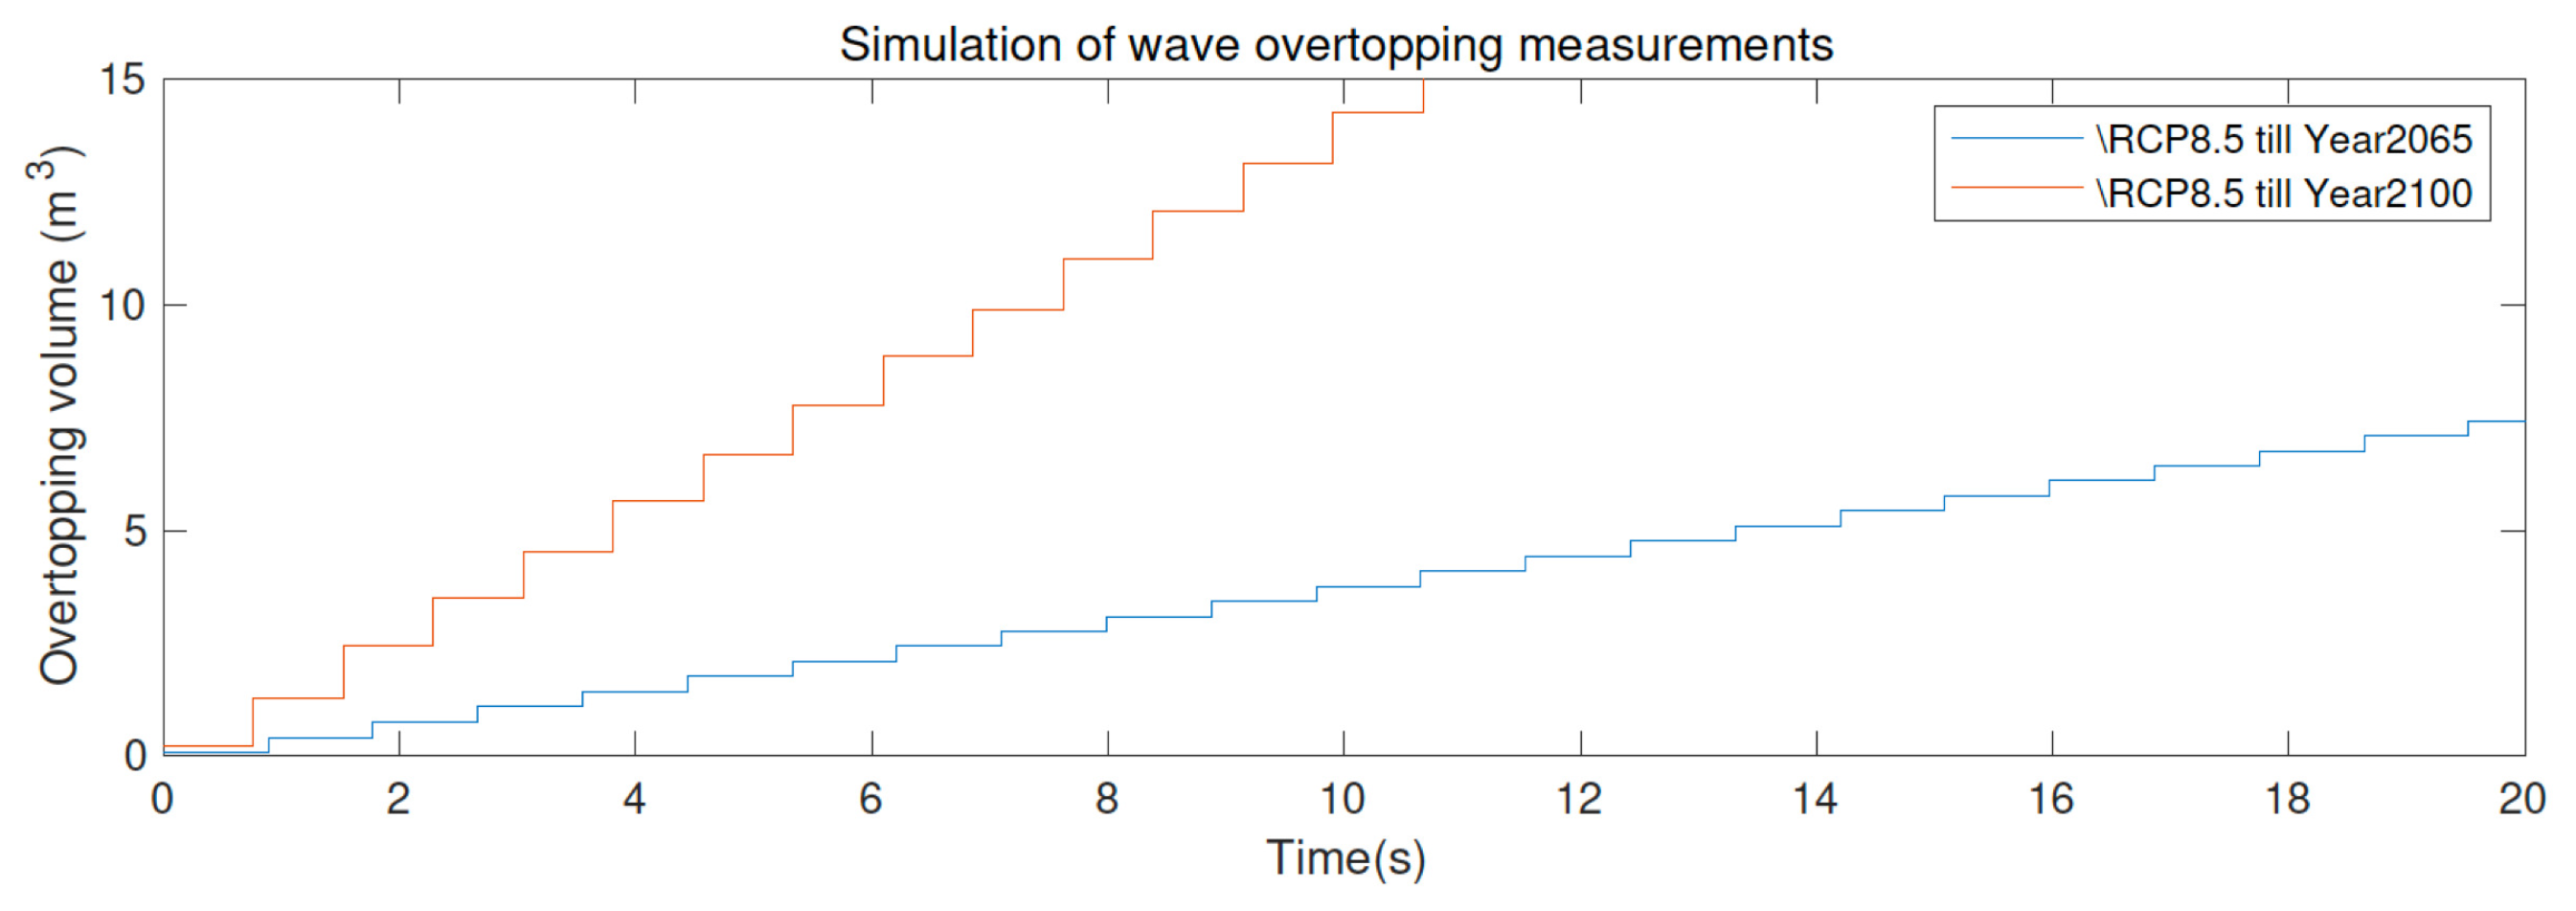
of water volume in every 15 s. In this case, the protective building must be redesigned and constructed. The situation is similar to RCP4.5, because the protective building at this time will not have any mitigation effect on overtopping. In the RCP8.5 emission scenario, until 2065, the average sea level rises to 0.29 m, and the water level is high enough to cover the wall crest. When overtopping occurs, more than 8
of waves will be generated in an average of 20 s. This overtopping rate is worse than RCP2.6 and 4.5. When the sea level rises by 0.74 m, which is about the sea level in 2100, the amount of overtopping volume is the most uncontrollable, with nearly 15
of water volume every 10 s. The protective building at this time will not slow down the overtopping. Therefore, the defence structure in the design model is not able to function against the seal level rise in 2100, under all three RCPs emission scenarios. In this case, increasing the crest height of the defence structure or redesigning the structural geometry is the rational solution to deal with sea level rise. At the same time, the simulation results under different emission scenarios indicate the significant influence of sea level rise on wave-overtopping. The more severe the RCP emission scenario that applies, the higher the wave-overtopping rate that is simulated. The calculated average of the overtopping rate rises from 0.704
(RCP2.6 in year 2100) to 1.438
(RCP8.5 in year 2100). Therefore, it is indispensable for EurOtop Manual to give design requirements related to sea level rise. Small and straightforward protective structures, such as an earthen dike, can improve applicability by improving the crest. Therefore, under different RCPs in 2065, maintenance can be carried out and partial reconstruction can be achieved. Complex protective structures, such as concrete dikes, need to be constructed in consideration of sea level rise in the next 100 years. Because this kind of complex structure or special-material dike is not suitable for partial rebuilding, under most of the sea level rise predictions given by the IPCC in 2100, defence structures without sea level design will be ineffectual. Therefore, following EurOtop’s design requirements for sea level rise is reasonable and necessary. These predictions regarding overtopping behaviours under different scenarios are summarised in
Figure 11,
Figure 12,
Figure 13 and
Figure 14.


