Abstract
This study numerically analyzes the thermal-fluid performance of supercritical hydrogen in regenerative cooling channels with aspect ratios (AR) ranging from 1 to 8 for rocket engine combustion chambers. The study investigates the effects of channel geometry and inlet Reynolds number on heat transmission efficiency, flow behavior, and pressure drop. The SST k-ω turbulence model was validated and utilized in ANSYS FLUENT (2024 R1, (Ansys Inc., Canonsburg, PA, USA) CFD simulations to examine temperature distributions, turbulent kinetic energy, and velocity profiles. The results show that convective heat transfer is improved with higher Reynolds numbers, while pressure drops are increased; the best range for balanced performance is found to be between 35,000 and 45,000. The aspect ratio significantly influences thermal performance; increasing it from 1 to 8 reduces peak wall temperatures by 12–15% but exacerbates thermal stratification and pressure losses. An intermediate aspect ratio (AR = 2–4) was found to optimize both heat transfer enhancement and hydraulic performance. The study provides critical insights for optimizing cooling channel designs in high-performance rocket engines, addressing the trade-offs between thermal efficiency and flow dynamics under extreme operating conditions.
1. Introduction
Rocket engines are subjected to extreme thermal conditions, with combustion chamber heat fluxes surpassing 160 MW/m2, creating formidable challenges for maintaining structural integrity and operational efficiency [1,2,3]. Effective thermal management is critical to mitigate these challenges, particularly in high-performance propulsion systems where conventional cooling methods may fall short. Supercritical hydrogen, renowned for its exceptional thermophysical properties, has emerged as a leading coolant and fuel choice for regenerative cooling systems [4,5,6,7]. Its ability to operate at supercritical pressures enhances heat absorption and dissipation, making it indispensable for managing the intense thermal loads in modern rocket engines. Despite these advantages, issues such as elevated pressure drops, non-uniform coolant flow, and thermal stratification persist in traditional cooling channel designs, underscoring the necessity for innovative solutions to optimize heat transfer and ensure reliable engine performance under extreme conditions.
The combustion chamber of a rocket engine faces extreme thermal stresses during operation, necessitating highly efficient cooling systems to prevent structural failure. Regenerative cooling, the predominant method in large liquid rocket engines, circulates fuel—typically hydrogen—through channels embedded in the chamber walls [8,9]. This approach not only extracts heat to protect the structure but also preheats the fuel, improving combustion efficiency [10]. However, as flight Mach numbers rise, the cooling demand often surpasses the fuel’s heat absorption capacity, leading to a critical trade-off between cooling and combustion mass flow requirements [11]. Challenges such as fuel phase change (boiling) and material thermal limits further complicate regenerative cooling, particularly for reusable engines or extended missions. To address these limitations, hybrid cooling strategies—combining regenerative, transpiration, and ablative techniques—are increasingly explored to enhance thermal management under extreme heat fluxes.
Recent advancements in rocket propulsion systems have highlighted supercritical hydrogen’s unique advantages as a cooling fluid, owing to its exceptional thermophysical properties near the pseudo-critical region [12]. At these conditions, hydrogen exhibits remarkable heat absorption capabilities due to its variable specific heat and enhanced thermal conductivity, making it ideal for managing the extreme thermal loads in supersonic and hypersonic engine applications. However, the complex behavior of supercritical hydrogen—including abrupt property variations and flow instabilities near critical points—presents significant challenges in thermal system design and performance prediction [13]. These complexities necessitate sophisticated computational modeling combined with experimental verification to develop reliable cooling solutions. A key parameter in this optimization is the channel aspect ratio (AR), defined as the height-to-width proportion. While increased AR values can improve thermal transfer through greater surface area exposure, they simultaneously introduce hydraulic challenges including amplified pressure losses and potential flow maldistribution. For rocket engine applications where both thermal efficiency and pressure constraints are critical, careful AR selection becomes paramount to balance these competing factors in cooling channel design.
Recent investigations into advanced cooling channel modifications have explored numerous innovative approaches to address thermal management challenges. Various geometric enhancements including ribbed configurations [14,15,16], sinusoidal wavy passages [12,17], wedge structures [18], dimpled surfaces [19], vortex-inducing elements [20,21], and porous media implementations [22,23,24] have demonstrated potential for performance improvements. These design modifications primarily target two critical objectives: reduction in undesirable thermal gradients and enhancement of overall heat transfer effectiveness. Zhang et al. [25] revealed that intersecting V-pattern ribs generate intensified secondary flows, substantially boosting thermal dissipation capacity. Complementary research by Jing et al. [26] employing conjugate heat transfer analysis emphasized the critical role of temperature-dependent fluid properties in curved channel applications. Further supporting these findings, Elmouzen et al. [27] documented significant convective enhancement from V-rib implementations, albeit with modest pressure penalty trade-offs. Building on these concepts, Gibreel et al. [28] developed a novel finned hybrid configuration that demonstrated remarkable performance gains, including a 25.4% improvement in thermal performance metrics and 14% reduction in maximum wall temperatures compared to conventional smooth channels. Recent studies on rotating and stationary internal cooling configurations further elucidate the complex interplay between flow structuring and thermal performance. Research on rib turbulators [29] and dimpled surfaces [30] under rotating conditions reveals significant modulation of heat transfer and flow resistance by Coriolis and centrifugal buoyancy forces, underscoring the need for system-specific design considerations. Complementary investigations into impingement cooling [31,32] and advanced surface modifications [33] provide critical insights into achieving heat transfer uniformity and efficiency in high-flux environments—challenges directly parallel to those in rocket engine cooling channel optimization. Parallel developments in structural design include Miao et al.’s [34] lattice-based thrust chamber concept targeting improved reusability. While previous studies have advanced cooling technology for various applications, the specific role of channel aspect ratio (AR) in supercritical hydrogen systems for rocket engines remains insufficiently characterized. The existing literature lacks a dedicated study that systematically isolates the AR effect while accounting for the sharp thermophysical property variations in supercritical hydrogen near the pseudo-critical point under representative rocket engine heat fluxes. Our work presents a comprehensive examination of AR effects (1–8) on the unique thermofluidic behavior of supercritical hydrogen, systematically evaluating critical parameters including thermal transport efficiency, hydraulic losses, and temperature uniformity to establish design guidelines for extreme-condition rocket engine applications.
2. Numerical Computational Model
2.1. Model Description
The geometry of a typical liquid rocket engine regenerative cooling channel is trapezoidal in cross-section to conform to the combustion chamber contour [35]. However, to isolate the fundamental effect of aspect ratio without the confounding influence of additional geometric parameters such as taper angle and variable wall proximity, this study adopts a simplified rectangular channel geometry. This approach is well-established in foundational parametric investigations of cooling channel performance—exemplified by the work of Zhang et al. [36], who employed rectangular channels to systematically study aspect ratio effects in scramjet cooling systems. The core thermo-fluidic phenomena governing supercritical hydrogen flow—including heat transfer, pressure drop, and thermal stratification—are dominantly influenced by the channel’s primary dimensions (height and width) and the extreme imposed heat flux. Consequently, the insights and optimal aspect ratio ranges identified here provide essential first-order design guidance, applicable to trapezoidal channels through the use of a representative or average aspect ratio.
The simplified rectangular channel configuration adopted for this parametric study is illustrated in Figure 1, which presents a conceptual schematic of the rocket engine cooling channel layout. To streamline the computational process while preserving accuracy, the geometric symmetry permits the use of a half-model for simulation. Figure 2 depicts the corresponding computational domain implemented in ANSYS FLUENT 2024 R1 (Ansys Inc., Canonsburg, PA, USA), explicitly showing the half-model with its adiabatic inlet, heated, and adiabatic outlet sections. While Figure 1 provides the overall geometric context and scaling of the representative unit cell, Figure 2 details the specific three-dimensional domain and boundary conditions used in the CFD analysis, ensuring consistency between the conceptual model and its numerical implementation. The channel is divided into three distinct sections: a 0.25 m inlet section to establish fully developed flow, a 0.5 m heated section, and a 0.25 m outlet section to minimize backflow effects. The boundary conditions for the computational model were defined as follows to accurately represent the rocket engine cooling channel operation. The fluid domain inlet was specified as a mass-flow-inlet with a mass flow rate of 0.0004 kg/s and a constant static temperature (Tin) of 300 K. The outlet was defined as a pressure-outlet with a back pressure (Pback) of 3 MPa. A constant heat flux () of 3 MW/m2 was applied exclusively to the bottom wall of the heated section, simulating the heat load from the combustion chamber. The top and side walls of the channel were treated as adiabatic, assuming symmetry and minimal heat loss to the surroundings. The solid domain interfaces with the fluid were set as coupled walls for conjugate heat transfer. A symmetry boundary condition was applied to the central x-y plane of the domain [19,37,38].
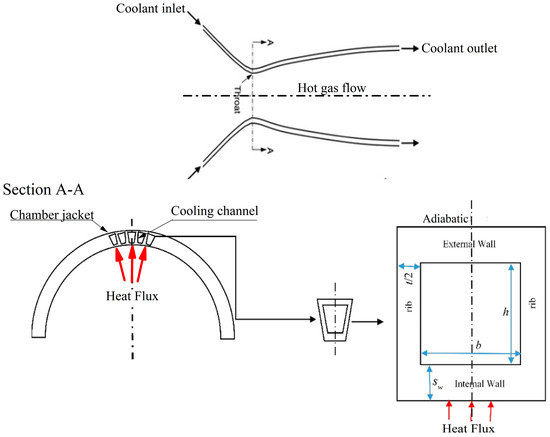
Figure 1.
Rocket engine cooling channel layout.
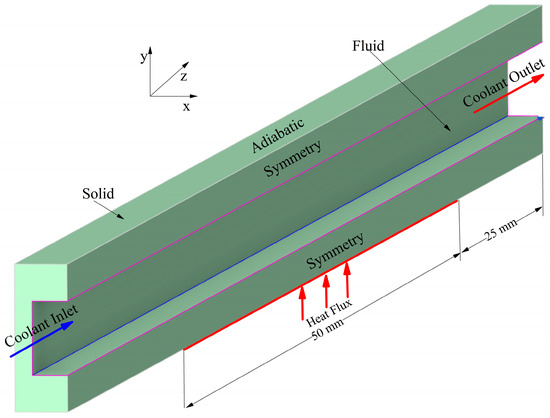
Figure 2.
Half-channel computational domain (symmetric section).
To analyze the effect of channel size on the flow and heat transfer of hydrogen fuel, we need to consider the principles of fluid mechanics and heat transfer.
This section investigates the effect of changing the channel’s AR from 1 to 8 on cooling efficiency. Throughout the investigation, the cooling channel’s rib thickness remains constant at 1 mm. The boundary conditions, including the cooling channel dimensions at various height–width ratios and the inlet flow rate, are detailed in Table 1. The gas-side heat flux and the cooling channel length remain consistent with the parameters established during the grid independence study. The back pressure was kept at 3 MPa and the intake temperature at 300 K.

Table 1.
Basic cooling channel parameters for different channel aspect ratios.
2.2. Thermophysical Properties of Supercritical Hydrogen and Validation
Hydrogen serves as the coolant and fuel in this study, exploiting its enhanced thermophysical properties under supercritical conditions. With a critical pressure of 1.29 MPa and a critical temperature of 33 K [39], hydrogen undergoes significant property variations near the pseudo-critical region, including abrupt changes in viscosity, density, and thermal conductivity. To capture these nonlinear behaviors, the Real Gas Peng–Robinson cubic equation of state (Equation (1)) [39,40,41] is adopted for density calculations, offering robust predictions across liquid and gaseous phases. This EOS was selected for its proven reliability and computational efficiency in predicting the thermodynamic properties of light gases like hydrogen at supercritical pressures relevant to this study (3 MPa), Khonakdar et al. [42]. It provides a robust balance of accuracy and stability for engineering-scale CFD simulations, effectively capturing the strong non-linear variations in density and specific heat near the pseudo-critical region, which are the dominant drivers of the unique thermofluidic behavior observed [43,44]. The piecewise-polynomial approach in ANSYS FLUENT is used to determine specific heat capacity, while temperature-dependent viscosity and thermal conductivity are implemented via user-defined functions (UDFs). At a constant pressure of 3 MPa, the analysis covers a temperature range of 287–1000 K, with property data sourced from the NIST database [45] to ensure fidelity in modeling supercritical hydrogen dynamics.
To rigorously confirm the accuracy of the implemented property models, a direct validation was performed against the benchmark experimental dataset for cryogenic hydrogen published by Hendricks et al. [43] (NASA TN D-3095). The property data from Appendix C of the report at a pressure of 5 MPa were used for comparison. As illustrated in Figure 3, the models show excellent agreement with the experimental values across the tested temperature range. The Peng–Robinson equation of state accurately predicts density variations, while the specific heat capacity model successfully captures the characteristic sharp peak near the pseudo-critical point. The temperature-dependent functions for viscosity and thermal conductivity also align closely with the measured data. This comprehensive validation confirms the fidelity of the thermophysical property implementations used in the present CFD simulations.
where is the universal gas constant, and is the specific volume. Equations (2)–(5) can be used to determine the coefficients and .
where , , and represent the acentric factor, critical temperature, and critical pressure, respectively.
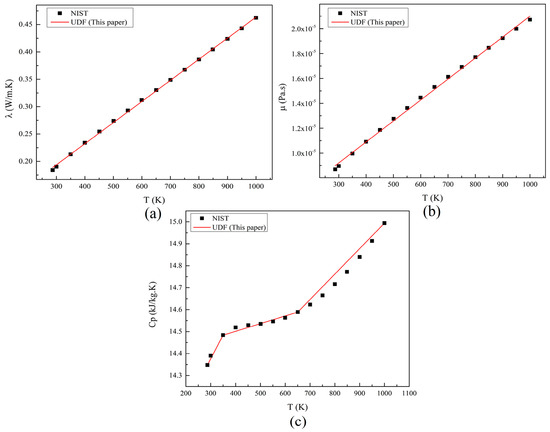
Figure 3.
Properties of the fuel: (a) density, (b) specific heat capacity, and (c) thermal conductivity. [39].
To compute , use specific heat of the ideal gas and the :
Equation (7) can be used to determine the specific heat of an ideal gas (), while the equation of state can be employed to calculate
where ~ is the polynomial coefficient.
The relevant factors include the Reynolds number (Equation (8)), Nusselt number (Equation (9)), Prandtl number (Equation (10)), and the geometry of the channel.
where and are the thermal conductivity of the fluid, characteristic length, convective heat transfer coefficient, and dynamic viscosity of the fluid, respectively. These dimensionless quantities characterize the relative importance of inertial forces to viscous forces, determining whether the flow is turbulent or laminar. In regenerative cooling systems, where heat is transferred from the hot combustion gases to the coolant flowing through the channels, the Reynolds number is critical in achieving optimal thermal performance and system reliability. The detailed thermophysical properties of supercritical hydrogen used in this study, including density, viscosity, thermal conductivity, and specific heat at the operating pressure of 3 MPa, are provided in Appendix A.
3. Validation of Turbulence Model
The predictive accuracy of computational fluid dynamics simulations hinges critically on selecting an appropriate turbulence closure model. This study systematically evaluates four prevalent turbulence modeling approaches for supercritical hydrogen flow applications: the Reynolds Stress Model (RSM), Shear Stress Transport (SST) k-ω model, renormalization group (RNG) k-ε model, and standard k-ε formulation. Comparative validation against the experimental dataset from [46] reveals significant variations in model performance.
As evidenced in Figure 4a, conventional k-ε based approaches (both standard and RNG variants) demonstrate substantial deviations from empirical Nusselt number measurements, with discrepancies exceeding 37%. In contrast, the SST k-ω formulation shows remarkable alignment with experimental values, maintaining prediction errors below 10.61% across the tested Reynolds number range. This superior performance persists under elevated Re conditions where other models exhibit deteriorating accuracy. The SST k-ω model’s efficacy stems from its hybrid formulation that: 1. Combines k-ω’s precision in near-wall regions with k-ε’s robustness in free-stream flows. 2. incorporates transport effects for principal shear stresses. 3. Accounts for turbulent-to-laminar transition phenomena. Supporting evidence from hydrocarbon flow studies [47] further confirms the model’s capability to resolve complex thermofluidic interactions in high-heat-flux cooling channels. The validation results justify selecting the SST k-ω approach for subsequent analyses of supercritical hydrogen behavior in variable-aspect-ratio channels.
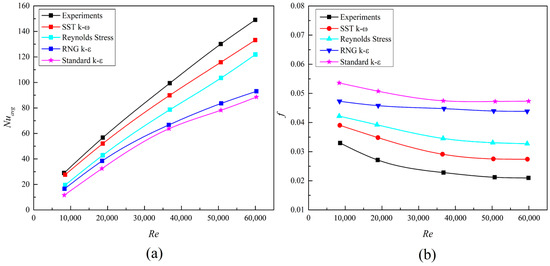
Figure 4.
Turbulence model validation: (a) Nusselt number (b) Friction factor.
The reliability of the numerical calculations was further verified by comparing the friction factors obtained from four turbulence models (SST k-ω, Reynolds stress, standard k-ε, and RNG k-ε) with experimental data from Ref. [46], as shown in Figure 4b. All channels’ friction factor values decrease as the Reynolds number increases, according to the results; however, for Reynolds numbers exceeding 45,000, the friction factors stabilize and remain approximately constant. Among the turbulence models evaluated, the SST k-ω model demonstrates the closest agreement with the experimental data, providing more accurate predictions of the friction factor. Given its superior performance in capturing both flow and thermal characteristics, all simulations in this investigation utilized the SST k-ω turbulence model. It is noted that the superior performance of the SST k-ω model for this specific case of internal supercritical hydrogen flow is consistent with its validated capabilities for flows with strong property sensitive. The performance ranking of RANS models can differ for other applications, such as film-cooling shear layers, where Reynolds Stress Models may demonstrate greater accuracy due to their ability to resolve anisotropic turbulence [48].
3.1. Solution Method
The mass, energy, and momentum conservation equations for supercritical-pressure flow conditions in the cooling channel were numerically solved in this study using UDFs and a pressure-based solver in ANSYS FLUENT 2024 R1. The pressure-based solver was employed in a low-Mach-number formulation, appropriate for the flow regime where the local Mach number remained below 0.1. The dominant density variations arise from intense thermal expansion, captured by the real gas equation of state, rather than aerodynamic compression. The pressure-based solver, coupled with real gas property routines, is therefore the suitable choice for this class of thermally dominated, low-speed flows. For all cases investigated, the local Mach number, calculated using the local velocity and the speed of sound derived consistently from the Peng–Robinson equation of state, remained below 0.1. A representative case (AR = 1, Re = 42,000) exhibited a maximum local Mach number of 0.078. Since aerodynamic compressibility is negligible at these low Mach numbers, the standard SST k-ω turbulence model was used without compressibility corrections or dilatation terms. The primary density variations are due to intense heating, which are fully accounted for by the real gas equation of state. To ensure high accuracy in predictions, the SST k-ω two-equation turbulence model is utilized, as discussed earlier. The model demonstrates particular effectiveness in capturing principal shear stress transport within boundary layers under adverse pressure gradients. It accurately characterizes flow pattern in both far-field and near-wall locations, as validated by previous studies [49,50,51].
In this study, the second-order upwind scheme was employed to discretize the convective term. While the primary focus is on analyzing cooling performance, liquid-solid coupling is incorporated to account for heat conduction within the solid domain, ensuring a more accurate representation of heat transfer from the coolant and heat conduction through the wall. A UDF is implemented in all simulations to handle the variable thermal properties of the fluid. The SIMPLEC algorithm (Semi-Implicit Method for Pressure-Linked Equations Consistent) is selected for solving the governing equations, as it generally outperforms other algorithms in the SIMPLE family, as demonstrated in references [52,53]. The convergence criterion for the continuity equation is set to 10−4, while for the momentum and energy equations, it is set to 10−6. The standard initialization approach is employed. The computational domain was discretized using a hexahedral structured mesh in ANSYS ICEM 2024 R1 to ensure precise spatial resolution. Close to the wall, a finer grid resolution is used to accurately represent boundary layer effects. A symmetric three-dimensional domain represents the cooling channel, with modeling assumptions of steady-state turbulent flow.
As a result, the governing Equations (11)–(13) for fluid flow can be expressed as follows:
Mass conservation equation
Momentum conservation equation
Energy conservation equation
Although our main focus is on the cooling process, the solid domain is also included to ensure a comprehensive analysis. Fourier’s equation (Equation (14)) is used to compute the heat transfer rate through the solid wall. ANSYS FLUENT utilizes a fluid-solid coupling approach to simulate domain interactions, enabling precise heat transfer modeling across the interface.
where
Here, is gravity, is the thermal expansion coefficient, is the wall heat flux, is the hydraulic diameter, is density, is kinematic viscosity, and is thermal conductivity. The subscript denotes bulk fluid properties. A threshold of > 3 × 10⁻⁶ is often cited as indicative of acceleration-induced HTD.
The SST k-ω turbulence model was employed in its Low-Reynolds-number formulation, requiring a wall-resolved mesh. The governing equations were integrated all the way to the wall, and no wall functions were used. To achieve this, the mesh was designed with a first cell height of 0.005 mm, ensuring the nondimensional wall distance y+ was maintained below 1 across the vast majority of the wetted surfaces. A growth ratio of 1.1 was used for the inflation layers normal to the wall. The turbulent Prandtl number (Prt) was set to the default value of 0.85. A sensitivity analysis confirmed that varying Prt by ±0.2 resulted in less than a 3.5% change in the local Nusselt number, indicating the robustness of the results to this parameter. The solution was considered converged when the residuals for the energy and turbulence equations fell below 10−6, and the residuals for continuity and momentum fell below 10−4, while also monitoring the stabilization of the area-weighted average temperature on the heated wall and the outlet pressure. A sensitivity analysis of the boundary conditions, including inlet length independence, inlet velocity profile robustness, and outlet independence, was conducted to ensure the results are not artifacts of boundary condition choices. The details of this analysis are provided in Appendix B.
3.2. Grid Convergence
A grid sensitivity evaluation was carried out at three refinement levels (see Table 2) prior to running numerical simulations in order to guarantee solution accuracy and dependability. The test case involved a 2 mm × 2 mm channel (100 mm long) with a uniform 1 mm thickness on the inner/outer surfaces and wall fin. Given the flow symmetry about the central perpendicular plane, only half of the rectangular channel was discretized. The symmetry condition was applied as a boundary condition on the center-plane of the domain and the mid-plane of the rib. Hexahedral elements were employed to generate a grid that ensures domain-independent results. Convergence criteria for the three grid levels included surface Nusselt number distribution, pressure drop, outlet velocity variation, and wall temperature profiles, with results shown in Figure 5 and Table 2. The results demonstrate that as the number of components rises, the flow solution converges, confirming the numerical model’s grid independence. The meshing strategy employed a denser grid in the solid domain compared to the fluid domain, as evidenced in Table 2. This approach was justified for two primary reasons. First, the solid domain encompasses a larger and more geometrically complex volume, including the top, bottom, and side walls surrounding the fluid channel (see Figure 2), necessitating more elements for high-quality discretization. Second, and more critically, the solid wall is subjected to the extreme heat flux (3 MW/m2) on its outer surface, resulting in steep, one-dimensional temperature gradients across its thickness.
Table 2.
Three mesh refinement levels.
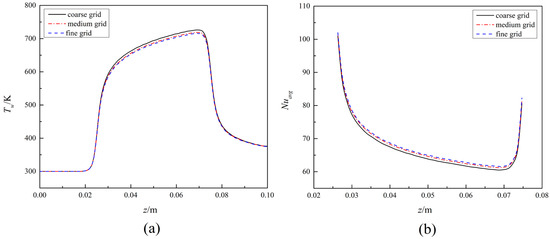
Figure 5.
Grid independence study: (a) Wall temperature (b) Nusselt number.
The analysis shows the largest variations in surface Nusselt number (1.16%) and wall temperature (0.78%) occur between coarse and medium grid resolutions, as demonstrated in Figure 5. However, when comparing the medium and fine grids, these differences are substantially reduced to just 0.65% and 0.34%, respectively. As demonstrated in Table 3, the discrepancies among coarse and medium grid solutions are significantly bigger than those among medium and fine grids. Given these observations, the medium grid level is considered adequate to achieve grid-independent results. The medium grid has been chosen for the current study. Additionally, to ensure accurate boundary layer resolution, the grid near the wall in the coolant field is refined, as demonstrated in Figure 6.
Table 3.
Numerical results of grid convergence analysis.
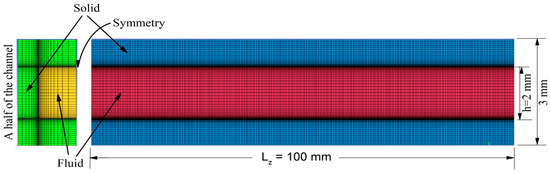
Figure 6.
Grid structure used in the simulations.
4. Model Validation
To confirm the accuracy of the numerical model, validation was performed using experimental data for supercritical hydrogen flow in cooling channels. Due to the scarcity of detailed experimental studies on this subject, the validation relied on the benchmark dataset from ref. [54], which provides extensive measurements of supercritical hydrogen behavior in heated tubes. The “64_706” test case was selected for validation based on its established reliability and frequent use in prior research (e.g., refs. [6,36,55]). The experimental validation case featured supercritical hydrogen flow in a 914.4 mm long, 8.51 mm diameter tube operating at 5 MPa constant pressure, with inlet and outlet temperatures of 25 K and 53 K, respectively. This temperature range (25 K to 110 K at the wall) encompasses the pseudo-critical temperature of approximately 43 K at 5 MPa, ensuring the model is validated across the region of most intense property variation. While the validation geometry (cylindrical tube) differs from our rectangular channels, the excellent agreement in the characteristic axial temperature profiles and the model’s ability to capture the fundamental physics of supercritical heat transfer provides high confidence in its application for the present comparative study of aspect ratio effects. Where a uniform heat flux of 2.35 MW/m2 was applied only to the downstream section while maintaining a mass flow rate of 0.07878 kg/s that achieved fully developed flow within the tube’s initial segment.
Figure 7 compares numerical findings to experimental data for both wall and bulk fluid temperatures. The comparison results clearly show that the numerical model presented in this paper agrees well with the experimental data, though minor discrepancies occur in certain regions, particularly at peak values. These differences may arise from slight variations in the applied constant heat flux compared to the experimental conditions, as well as the selection of node numbers during the post-processing of CFD results. Despite these minor deviations, the overall trend of the numerical results closely matches the experimental data, with the maximum discrepancy between the two being less than 3%. This confirms the asymptotic behavior of the numerical error and provides a high level of confidence in the accuracy of the error estimates.
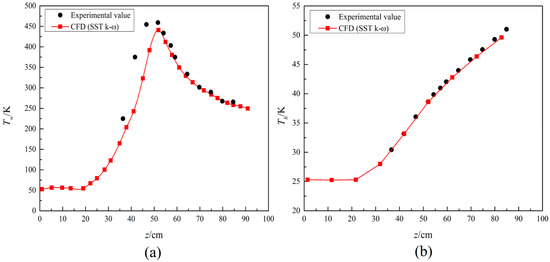
Figure 7.
Model validation: (a) wall temperature and (b) Bulk fluid temperature profiles.
5. Result and Discussion
5.1. The Effect of Inlet Reynolds Number on Heat Transfer and Flow Characteristics
The inlet Reynolds number (Rein) is a critical parameter in regenerative cooling systems because it directly affects the flow behavior and heat transfer efficiency in the cooling channels. The Reynolds number, defined in Equation (8). Figure 8 and Figure 9 present the temperature distributions and velocity profiles, respectively, across three cross-sections along the channel length for Reynolds numbers of 21,000, 42,000, and 63,000. As the Reynolds number increases, the flow transitions from a laminar to a turbulent regime. Turbulent flow is characterized by enhanced mixing between coolant layers, which significantly improves heat transmission to the cooling fluid from the heated surface. This is evident in Figure 10a, where the average Nusselt number (Nuavg) increases with higher Reynolds numbers, indicating improved convective heat transfer. Turbulent flows are known to exhibit superior heat transfer characteristics compared to laminar flows, making them more effective in dissipating the intense thermal loads encountered in rocket engine cooling systems.
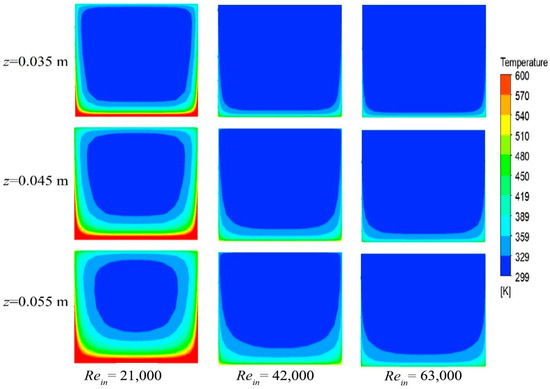
Figure 8.
Temperature distributions at three cross-sections along the channel length for different Reynolds numbers.
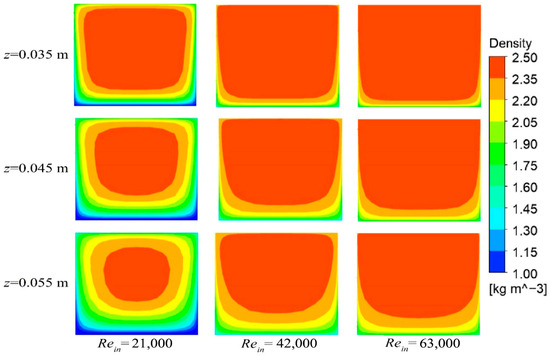
Figure 9.
Density distributions at three cross-sections along the channel length for different inlet Reynolds numbers.
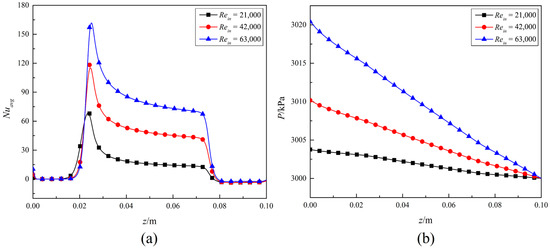
Figure 10.
Comparison of (a) Nuavg and (b) pressure drop for different inlet Reynolds numbers.
Prior to discussing the detailed results, the integrity of the numerical model was verified through a global energy balance for the representative case (AR = 1, Re = 42,000). The total heat input to the system, calculated from the applied heat flux (3 MW/m2) over the heated wall area (0.001 m2), is 3000 W. The total heat absorbed by the coolant, determined from the difference in fluid enthalpy between the inlet and outlet using NIST data, is 2960 W. This results in an energy balance discrepancy of approximately 1.3%, which is within an acceptable margin for numerical simulations of this complexity and confirms robust energy conservation in the model. All outer walls were adiabatic, and thus heat losses to the environment are considered negligible.
Although higher Reynolds numbers improve heat transfer performance, they simultaneously increase pressure drops in cooling channels, as demonstrated in Figure 10b. This pressure rise stems from elevated flow velocities and enhanced turbulence, both of which exacerbate frictional losses. This trade-off between thermal performance and hydraulic losses represents a fundamental design challenge for regenerative cooling systems. Excessive pressure drops can lead to higher pumping power requirements and potential flow instabilities, which may compromise the system’s efficiency and reliability. Therefore, it is essential to strike a balance between achieving optimal heat transfer and maintaining acceptable pressure losses. To address potential compressibility effects arising from the strong heating of supercritical hydrogen, the local Mach number was analyzed for a representative case (AR = 1, Re = 42,000). Figure 11 presents contours of the local Mach number at four streamwise locations (z = 0.03, 0.05, 0.07, and 0.09 m). The results confirm that the Mach number remains below 0.08 throughout the heated section of the channel. This firmly establishes that the flow is within the low-Mach-number regime, where aerodynamic compressibility is negligible. The primary driver of the observed strong density variations is therefore thermal expansion, which is fully captured by the real gas equation of state, rather than fluid dynamic compression. This justifies the use of the pressure-based solver without additional compressibility corrections in the turbulence model.
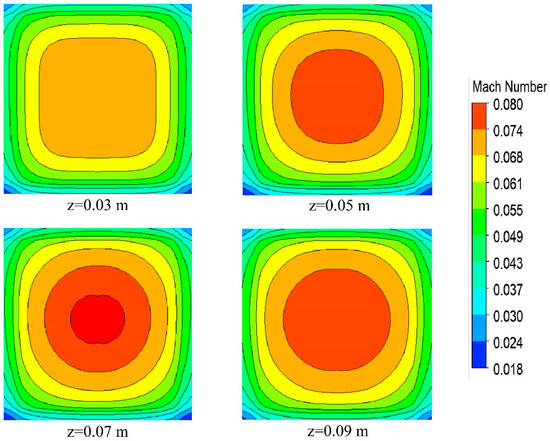
Figure 11.
Contours of local Mach number at various streamwise locations for the case AR = 1, Re = 42,000.
A sensitivity analysis on the turbulent Prt was conducted, confirming the robustness of the results. For the representative case (AR = 4, Re = 42,000) as in Table 4, varying Prt from 0.65 to 1.05 resulted in a maximum deviation of ±3.5% in the local Nusselt number and ±1.2% in the peak wall temperature, which does not affect the qualitative or key quantitative conclusions of this study.
Table 4.
Sensitivity of key outputs to the Turbulent Prandtl Number for the case AR = 4, Re = 42,000.
Figure 12 illustrates the effect of different input Reynolds numbers ( = 21,000, 42,000, and 63,000) on (a) the temperature of the bottom wall and (b) thermal conductivity. In Figure 12a, the temperature of the bottom wall significantly decreases as the Reynolds number (Re) increases. with the maximum Reynolds number ( = 63,000) displaying the lowest temperatures across the observed range (z). This pattern indicates improved convective cooling efficacy at higher flow velocities. Figure 12b corroborates this discovery, demonstrating enhanced thermal conductivity with increasing Re, especially at high values of z. Collectively, these findings indicate that increased Reynolds numbers enhance the effectiveness of heat transfer by lowering wall temperatures and improving thermal conductivity, which is essential for preventing localized hot spots and achieving uniform cooling performance in applications such as regenerative cooling systems. Although higher Reynolds numbers enhance heat transmission and flow uniformity, they can cause flow instabilities. These instabilities, such as flow separation, recirculation zones, and pressure fluctuations, might have a negative impact on the cooling system’s performance. For instance, flow separation can lead to the formation of stagnant regions where heat transfer is significantly reduced, while pressure fluctuations can cause mechanical vibrations and fatigue in the cooling channel walls. Therefore, it is crucial to evaluate the flow behavior across a range of Reynolds numbers to identify the optimal operating conditions that ensure stable and effective cooling without compromising system integrity.
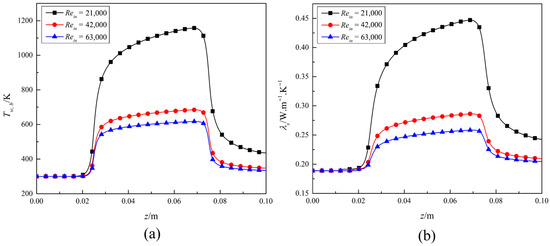
Figure 12.
Bottom wall temperature (a) and Thermal conductivity (b) vs. Rein.
In summary, the intake Reynolds number has a substantial impact on the thermal and flow performance of regenerative cooling systems. Increased Reynolds numbers improve mixing and encourage turbulence, which improves heat transfer and results in more effective cooling. However, this comes at the cost of increased pressure drops and the potential for flow instabilities. Designers must carefully balance these competing factors to optimize the cooling system’s performance, ensuring reliable operation under the extreme thermal conditions encountered in rocket engines. The results emphasize the necessity of choosing an adequate Reynolds number to strike a compromise between heat transfer enhancement, pressure drop mitigation, and flow stability. This analysis provides valuable insights into the role of the Reynolds number in regenerative cooling systems, highlighting the need for a comprehensive approach to cooling channel design that considers both thermal and fluid dynamic performance.
5.2. The Impact of Channel Aspect Ratio on Thermal Behavior and Flow Performance
The aspect ratio (AR = h/b), defined as the channel height-to-width ratio, serves as a critical design parameter governing cooling channel thermofluidic performance. This study systematically examines AR effects (1–8) on hydrogen fuel cooling efficiency in rocket engine channels. Furthermore, the spatial distribution of the pseudo-critical thermal layer—a region characterized by sharply peaked specific heat ()—is significantly influenced by the channel’s aspect ratio. In lower AR channels (e.g., AR = 1), the strong secondary flows and enhanced mixing promote a more uniform thermal field, causing the high- layer to develop closer to the channel inlet. Conversely, in higher AR channels (e.g., AR = 8), increased flow stratification and reduced cross-stream mixing delay the thermal development, shifting the pseudo-critical region further downstream. This spatial offset directly affects the local heat transfer coefficient distribution; an earlier onset of the high- layer generally correlates with improved average heat absorption in the front part of the heated section, while a delayed onset can lead to increased thermal gradients near the outlet. This interaction between geometric confinement (AR) and the axial positioning of the property-sensitive region is a crucial mechanism underlying the observed trade-off between heat transfer enhancement and thermal stratification.
The temperature distribution for different aspect ratios along the heated wall’s mid-central line is displayed in Figure 13a. As the aspect ratio increases, the maximum wall temperature decreases. The model with AR = 1 exhibits the highest wall temperature, while the model with AR = 8 shows the lowest. This reduction in wall temperature with increasing aspect ratio is attributed to the enhanced heat transfer surface area and improved flow distribution. However, as shown in Figure 13b, the surface heat transfer coefficient decreases with increasing aspect ratio, indicating a trade-off between temperature reduction and heat transfer efficiency.
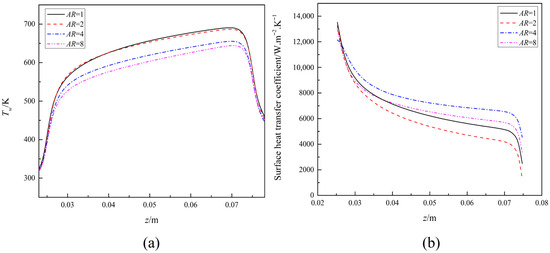
Figure 13.
Temperature distribution of the heated wall (a) and Surface heat transfer coefficient (b) along the cooling channel at different aspect ratios.
Figure 14 and Figure 15 present the distributions of coolant temperature and velocity, respectively, at the mid-cross-section of cooling channels with different aspect ratios (AR = 1, 2, 4, 8). The transition from a uniform profile at AR = 1 to a stratified, M-shaped profile at AR = 8 is a direct consequence of the increased channel height and reduced width. The taller flow domain allows for a wider core flow region with higher central velocities, while the physically narrowed width (decreasing from 2 mm to 0.5 mm) intensifies wall confinement, leading to steeper velocity gradients and increased shear near the sidewalls. Similarly, the increased thermal stratification evident in the temperature contours for higher AR values is a result of the larger height, which reduces cross-stream mixing and allows a hot layer to develop along the heated bottom wall.
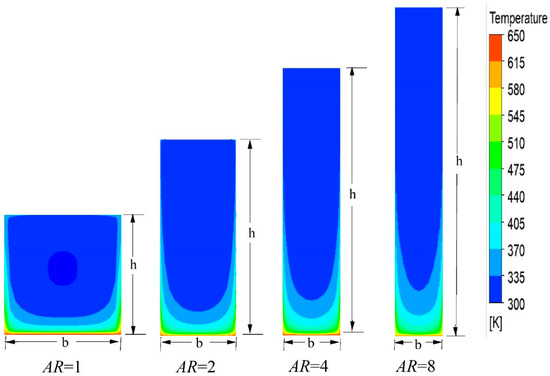
Figure 14.
Coolant temperature distribution at the mid-cross-section of the cooling channels for different channel aspect ratios.
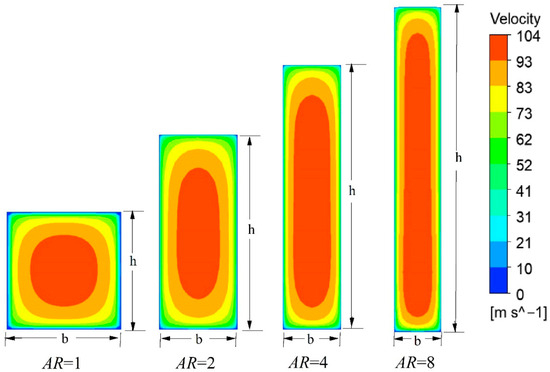
Figure 15.
Coolant velocity distribution at the mid-cross-section of the cooling channels for different channel aspect ratios.
The impact on fuel heat sink utilization was evaluated using non-uniformity coefficients (Ref. [55]) for both temperature and conversion distributions across the cooling channel cross-section. This subsection employs these parameters to identify the optimal channel aspect ratio for effective three-dimensional reduction in rocket engine combustion chamber wall temperatures. The temperature non-uniformity coefficient in the cooling channel cross-section is defined as the ratio of maximum temperature difference to mass-weighted average temperature, expressed mathematically as:
where Tmax is the maximum temperature, Tmin is the minimum temperature, and Tmean is the mass-weighted average temperature.
Figure 16a shows the temperature non-uniformity coefficients at x = 0 mm for the four different aspect ratios (AR = 1, 2, 4, 8), plotted along the z-axis. The non-uniformity coefficient decreases as z increases, signifying enhanced temperature uniformity at elevated heights. The coefficient is maximized at AR = 1 and decreases with increasing AR values, indicating that systems with greater aspect ratios demonstrate more uniform coolant temperature distributions. This trend may occur as larger AR values enhance flow mixing or decrease localized thermal gradients. The findings suggest that modifying the aspect ratio may serve as an effective approach for enhancing thermal management, with increased AR configurations promoting temperature uniformity. Figure 16b illustrates the variation in average thermal diffusion factor throughout the channel for various aspect ratios. As shown in the figure, the thermal diffusion coefficient exhibits a consistent decline as the aspect ratio increases, with AR = 8 yielding the lowest values. This reduction in thermal diffusion directly intensifies thermal stratification, as evidenced by the progressive divergence in the curves for higher AR values. Specifically, the coefficient for AR = 8 drops to nearly half of that for AR = 1 at the channel outlet, indicating significantly degraded heat redistribution capability at larger aspect ratios. It is important to note that while the precise magnitude of these effects is sensitive to property variations, the core finding of an intermediate optimal AR (2–4) is a consequence of the geometric trade-off between increased surface area and exacerbated hydraulic losses/stratification. This conclusion is robust, as it is based on the consistent presence of these strong property variations, not their exact numerical peak locations. Furthermore, the interplay of these variable properties with flow acceleration and buoyancy is critical for assessing heat transfer deterioration risks in supercritical cooling systems [56].
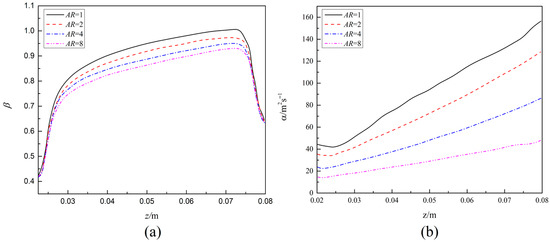
Figure 16.
Coolant temperature non-uniformity coefficients (a) and average thermal diffusion coefficients (b) along the cooling channel.
To evaluate the potential for heat transfer deterioration (HTD), a recognized risk in supercritical internal flows, the canonical buoyancy and acceleration parameters were calculated during post-processing. To evaluate the potential for buoyancy-induced effects, a dimensionless buoyancy parameter was calculated using Equations (21) and (23). According to the literature, significant buoyancy effects and a risk of HTD are typically indicated when Bo > 1 × 10⁻⁵ to 6 × 10⁻⁵. Acceleration Parameter (Kv) quantifies the influence of strong flow acceleration due to thermal expansion (Equation (23)). The results, in Table 5, confirm that both parameters remain orders of magnitude below their recognized HTD thresholds (Bo > 6 × 10⁻⁷ and Kv > 3 × 10⁻⁶) across the heated channel. This indicates that the observed thermal stratification and flow redistribution are primarily driven by the channel’s aspect ratio and intense property variations, without crossing into the regime of classical acceleration- or buoyancy-induced HTD. The results in Table 5 clearly show that both the Buoyancy Parameter (Bo) and the Acceleration Parameter (Kv) remain well below their respective recognized HTD thresholds across the entire heated length and in the downstream adiabatic section.
Table 5.
Buoyancy and Acceleration Parameters for the case AR = 4, Re = 42,000.
5.3. Effect of Aspect Ratio on Velocity Profile and Pressure Drop
In cooling channels, the aspect ratio affects the pressure drop and velocity distribution, which in turn affects the hydraulic performance and flow behavior. Turbulence near the walls is amplified and secondary flows become more intense as the channel geometry becomes longer. Increased wall shear and flow stratification cause pressure drop to increase, even though these changes promote heat transfer by improving mixing. Since heat dissipation and pumping capacity are two of the most important design concerns in cooling systems, it is critical to understand this trade-off between thermal efficiency and energy consumption. To be more specific, non-uniformity fuel conversion can lead to less turbulent motion within cooling channel, reducing heat transfer efficiency. In a channel, an increase in the aspect ratio can have a positive or negative effect on the heat transfer, depending on the situation. Figure 17 shows the variation in velocity distribution across the channel height at different longitudinal positions as the height-to-width ratio increases. The graph clearly shows that the cooling channel adopts a M-shaped velocity distribution in the height direction when thermal layers are present. The M-shaped velocity distribution becomes more pronounced as the height-to-width ratio increases, a result of increased thermal and gravitational delamination. The behavior of the velocity profile related to heat transfer degradation has been documented both experimentally and theoretically by several authors, as previously noted in [54] and supported by references [57,58,59]. The relationship between aspect ratio and cross sectional velocity is directly proportional; an increase in aspect ratio results in an increase in cross sectional velocity.
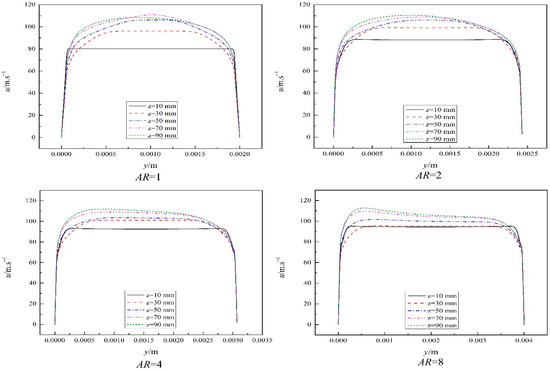
Figure 17.
Velocity along the channel height at different position along z axis.
Figure 18 depicts the hydrogen coolant flow streamlines in the channel cross-section at z = 0.073 m. A visual depiction of the flow patterns is given by the streamlines, which show how the coolant flows through the channel and interacts with its structure. The channel’s secondary flow patterns and velocity distribution are depicted by the streamlines. At this cross-section, the flow exhibits a distinct pattern, with streamlines showing the coolant’s movement’s amplitude and direction. There may be secondary flows, like vortices or recirculation zones, if the streamlines curve or spiral. These areas may facilitate or impede heat transfer and mixing. Figure 18 compares streamlines for various AR. Greater wall effects and flow stratification generally result in more noticeable secondary flows at higher aspect ratios (taller, narrower channels). This supports the study’s more general conclusions that AR affects thermal performance, turbulence, and flow behavior. The efficiency of heat transfer is impacted by the high and low velocity patterns seen in the streamline patterns. Uniform streamlines suggest stable flow with continuous cooling, whereas separation or turbulence may enhance mixing (heat transfer) or produce hot spots (inefficiency). As seen, channel geometry needs to be tuned for both flow stability and thermal performance. The distributions of temperature and velocity in Figure 14, Figure 15, Figure 16 and Figure 17 are supplemented by Figure 19. For example, if recirculation or asymmetries are visible in the streamlines, these characteristics could account for the pressure decreases or localized temperature changes covered in other sections.
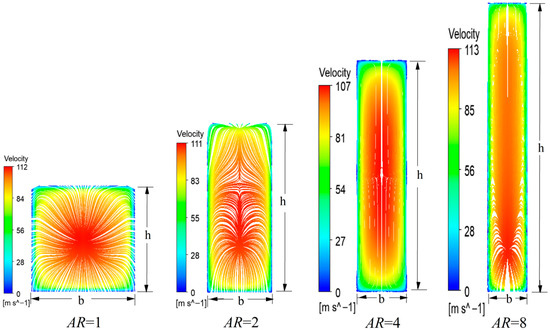
Figure 18.
Streamline visualization (z = 0.073 m).
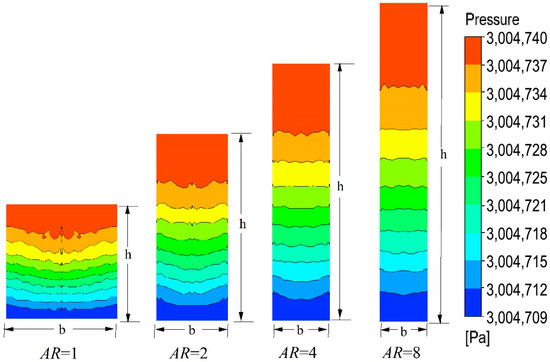
Figure 19.
Pressure distribution at the mid-cross-section of the cooling channels for different channel aspect ratios.
To analyze the pressure drop in a rocket engine cooling duct for different aspect ratios, it is necessary to consider the factors that contribute to the pressure drop. Several factors, including Reynolds number, channel geometry, fluid properties, and aspect ratio, can affect the pressure drop in a channel. The Darcy-Weisbach equation can be used to compute the channel pressure drop ():
where is the length of the channel, is the hydraulic diameter of the channel, v is the average velocity of the fluid.
Figure 19 presents the contour plots of static pressure distribution at the mid-cross-section (z = 0.073 m) for all aspect ratios. The contours reveal a key characteristic: the pressure is largely uniform across the channel’s width and height at this streamwise location. This uniformity indicates that the primary driver of pressure loss is frictional drag at the walls, rather than significant cross-stream pressure gradients or large-scale secondary flow recirculations. However, a critical trend is evident when comparing different AR values: the absolute pressure level systematically decreases as the aspect ratio increases from 1 to 8. This is visually apparent from the progression of the color map towards lower values (blue/purple). For instance, the pressure in the AR = 8 channel is markedly lower than in the AR = 1 channel at the same downstream location. This provides direct visual evidence of the heightened hydraulic penalty associated with taller, narrower channels, quantitatively supporting the pressure drop data presented subsequently in Figure 20a. The intensified wall confinement in high-AR geometries leads to greater shear stress, which is the fundamental reason for this increased pressure loss.
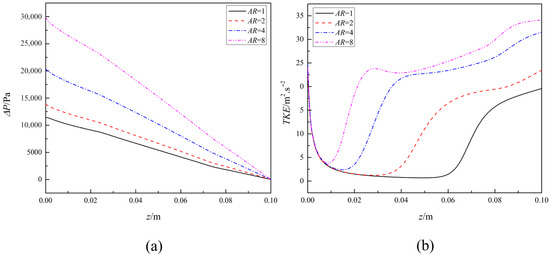
Figure 20.
Pressure drop (a) and Turbulent kinetic energy (b) along the z-axis for different aspect ratios.
Figure 20a displays pressure drop along the z-axis for different aspect ratios. an intricate relationship exists between the channel’s aspect ratio and the resulting pressure drop. As the aspect ratio increases, leading to wider channels relative to their height, the pressure drop tends to elevate. However, the paramount objective in configuring these cooling channels is to strategically optimize the design to ensure that the gas sidewall remains cooler than the maximum temperature limits permissible for the material while keeping the pressure drop within an acceptable range to maintain an efficient coolant flow dynamic. Figure 20b displays turbulent kinetic energy (TKE) along the z-axis for different aspect ratios. TKE is a measure of the average kinetic energy per unit mass associated with the random motions present in a turbulent flow. It is an important parameter in characterizing turbulence and understanding how it affects the heat transfer and pressure drop in the cooling channels of rocket engines. The TKE can be expressed mathematically as:
where represents the mean-square fluctuating velocity component in the flow direction.
The TKE of cooling channels with varying aspect ratios will differ due to changes in flow parameters such as velocity profiles, turbulence intensity, and the confinement effect of the channel dimensions on the flow. From the figure, as the aspect ratio increases (wider channels), the flow becomes more turbulent, leading to higher TKE, which can enhance heat transfer rates but also increase the pressure drop see Figure 20a. Figure 20b shows that the maximum value for the TKE is achieved in the highest aspect ratio (AR = 8), and the discrepancy between aspect ratios AR = 4 and 8 is not big compared to the others.
Figure 21 displays the distribution of TKE at the z = 0.07 m cross-section of cooling channels with varying aspect ratios (AR = 1, 2, 4, 8). The TKE values are color-coded, with higher values indicating regions of more intense turbulence. For AR = 1, the TKE distribution is relatively uniform, ranging from 2 to 75 m2/s2, as the lower aspect ratio limits flow disturbances due to its geometry, resulting in less pronounced turbulence. As the aspect ratio increases (AR = 2, 4, 8), the TKE values rise significantly, reaching up to 86 m2/s2 for AR = 2 and 81 m2/s2 for AR = 4. The highest TKE values are observed for AR = 8, where the flow exhibits the most intense turbulence. This trend aligns with the M-shaped velocity profile discussed earlier in the study, as higher aspect ratios enhance flow stratification and turbulence, particularly near the channel walls where velocity gradients are more pronounced. The increased TKE at higher AR values suggests improved mixing and heat transfer; however, it also corresponds to higher pressure drops, as evidenced in Figure 20a. This trade-off between enhanced turbulence and increased energy loss is a key consideration in optimizing cooling channel design.
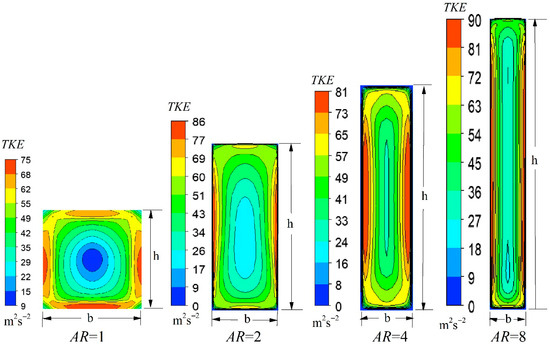
Figure 21.
The TKE distribution a cross-section at z = 0.07 m.
5.4. Effects of Channel Aspect Ratio on and Thermal Performance Factor
This section evaluates the effect of aspect ratio on the Thermal Performance Factor (TPF), a critical parameter for design optimization. The TPF provides a balanced measure of the thermo-hydraulic performance by comparing the heat transfer enhancement of a given channel to the accompanying increase in pumping power, relative to a baseline case, Equation (19). The AR of cooling channels is critical in defining their hydraulic properties and thermal efficiency. This section evaluates the effect of changing AR on the thermal performance factor (TPF), a critical parameter that balances improvements in heat transfer with penalties associated with pressure drops. As channel geometry shifts from square (AR = 1) to rectangular (AR > 1) designs, changes in flow behavior, including increased secondary motion and turbulence, result in improved heat transfer coefficients. However, these benefits are offset by increased frictional losses that escalate with aspect ratio due to increased wall shear and flow constriction. This study analyzes the TPF Equation (19) across various aspect ratios to identify the ideal channel geometry for improving thermal efficiency and reducing energy consumption, offering practical guidance for cooling system design.
Figure 22 illustrates the relationship between the average Nusselt number (Nuavg) and the aspect ratios (AR). Nuavg is a dimensionless quantity that measures convective/conductive heat transfer. Equations (15)–(18) calculate it. The results reveal a consistent decline in Nuavg as AR increases, with peak heat transfer efficiency occurring at AR = 1 (square channel) and the lowest efficiency observed at AR = 8 (tall, narrow channel). This trend underscores the superior convective heat transfer performance of lower aspect ratio channels, attributed to improved flow distribution and stronger secondary flows. In contrast, higher aspect ratio channels—despite generating increased turbulence (as shown in Figure 20b)—suffer from flow stratification and reduced thermal efficiency. These findings emphasize a critical design trade-off: while higher AR configurations improve temperature uniformity (Figure 16a) and reduce wall temperatures (Figure 13a), they compromise heat transfer effectiveness. Consequently, optimizing cooling channel design requires a careful balance between thermal and hydraulic performance for practical engineering applications.
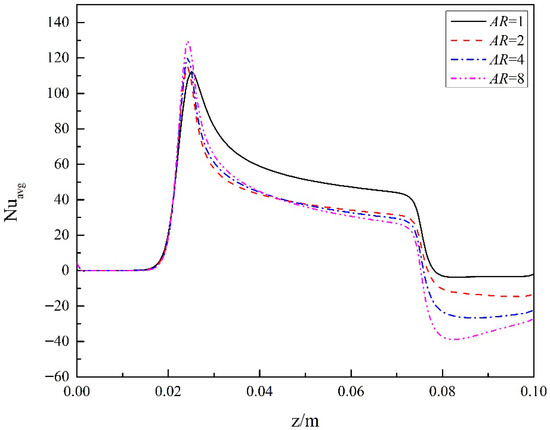
Figure 22.
Average Nusselt number for the four aspect ratios.
Figure 23 illustrates a comparative analysis of thermal performance factor (TPF) [60] and maximum wall temperature in cooling channels with differing AR. The peak wall temperature reduces gradually with increasing AR, calculated at 690.589 K for AR = 1, 686.668 K for AR = 2, 655.433 K for AR = 4, and 644.236 K for AR = 8. This trend indicates that taller, narrower channels (higher aspect ratio) improve cooling effectiveness by decreasing thermal stratification and enhancing heat transfer surface area. This enhancement incurs a hydraulic penalty, evidenced by the TPF values decreasing from 1.00 (AR = 1) to 0.96 (AR = 2), 0.85 (AR = 4), and 0.86 (AR = 8). This reduction in TPF signifies that whereas elevated AR configurations decrease wall temperatures, they concurrently result in increased pressure drops that impair overall system performance. The findings indicate that AR = 2 may present the optimal compromise, sustaining a relatively high true positive rate while facilitating moderate temperature reduction. For applications necessitating optimal cooling, AR = 4 or 8 may be deemed appropriate despite their reduced TPF, especially if pressure drop limitations can be managed. This analysis emphasizes the essential equilibrium between thermal performance and hydraulic efficiency in cooling channel design, underscoring the necessity for meticulous aspect ratio selection according to specific engine specifications and operational conditions. The results correspond with the study’s overarching insights regarding flow dynamics and thermal transfer properties in regenerative cooling systems. As summarized in Table 6, the AR = 2 channel provides the highest TPF at the representative Reynolds number of 42,000. This trend, where AR = 2 yields the optimal trade-off between heat transfer and pumping power, was found to be consistent across the range of Reynolds numbers (21,000 to 63,000) investigated in this study.
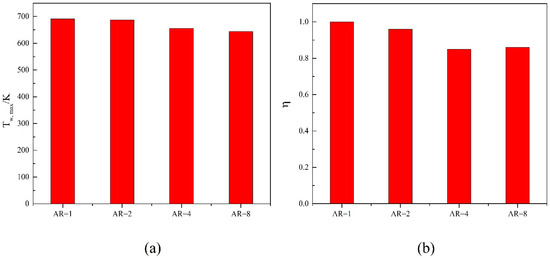
Figure 23.
Thermal analysis: (a) Maximum wall temperature (b) Performance factor.
Table 6.
Thermal Performance Factor (TPF) for different channel aspect ratios at Re = 42,000.
6. Conclusions
This study provides novel insights specifically for the design of regenerative cooling systems in high-performance rocket engines by systematically quantifying the thermo-fluidic trade-offs associated with channel aspect ratio when using supercritical hydrogen as a coolant. The findings bridge a critical gap in understanding how to optimize channel geometry for a fuel that exhibits extreme property variations under the intense thermal loads (3 MW/m2) characteristic of rocket engine combustion chambers, moving beyond generic cooling channel analysis. The main conclusions of the simulations were summarized as follows:
Increasing the inlet Reynolds number from 21,000 to 63,000 increased the average Nusselt number by 25–30%, indicating better convective heat transmission. This modification increased pressure drop by 40–45% due to turbulent mixing and wall shear. Simulations showed that Reynolds values above 42,000 caused flow instabilities, suggesting an optimal value between 35,000 and 45,000 for heat transfer efficiency and hydraulic performance.
Cooling performance changed significantly with aspect ratio (AR) from 1 to 8. Increased heat transfer surface area in AR channels (AR = 8) lowered peak wall temperatures by 12–15% compared to square channels (AR = 1). This was largely countered by 20–25% more thermal stratification along the channel height. The best thermal performance was achieved with intermediate AR values (2–4), minimizing hot spots and flow complexity.
Due to increased wall friction and secondary flows, velocity distribution changed from uniform profiles in low-AR channels to distinct M-shaped patterns in high-AR configurations (AR ≥ 4). The flow reorganization increased pressure drops by 30–35% in AR = 8 channels over AR = 1. Turbulent kinetic energy research showed that AR > 4 channels formed 50% stronger vortical structures near walls, explaining their increased mixing but greater energy penalty.
The analysis revealed that an intermediate aspect ratio (AR = 2–4) optimizes the balance between heat transfer enhancement and hydraulic performance, with AR = 2 providing the highest Thermal Performance Factor (TPF = 0.96). While channels with a higher AR, such as AR = 8, achieved the lowest absolute wall temperatures, the associated pressure losses resulted in a significantly lower TPF of 0.86. Consequently, AR ≈ 2 is recommended as a robust starting point for thermo-hydraulic efficiency; however, the final design selection must also integrate practical engine constraints, including manufacturing capabilities, the allowable pressure drop from the fuel pump, and the critical requirement to mitigate hot spots, which may necessitate a specific geometry to ensure peak wall temperatures remain within material limits.
Future studies should explore hybrid channel designs integrating optimized aspect ratios with surface enhancements (e.g., ribs or dimples) to simultaneously boost heat transfer and control pressure losses.
Author Contributions
Conceptualization, M.G.; methodology, M.G. and A.M.A.J.; software, M.G., A.A. and H.E.; validation, M.G., A.A. and H.W.; formal analysis, C.X. and H.W.; investigation, M.G.; resources, H.W.; data curation, A.M.A.J. and C.X.; writing—original draft preparation, M.G.; writing—review and editing, M.G., A.M.A.J., A.A., H.E. and C.X.; visualization, M.G. and H.E.; supervision, M.G. and A.A.; project administration, M.G.; funding acquisition, A.A. All authors have read and agreed to the published version of the manuscript.
Funding
This research was funded by the Fujian Provincial Natural Science Foundation grant number 2025J011604, and the Fujian Province Young Foreign Experts Recruitment Program. The APC was funded by the Fujian Province Young Foreign Experts Recruitment Program.
Institutional Review Board Statement
Not applicable.
Informed Consent Statement
Not applicable.
Data Availability Statement
The data presented in this study are available upon request from the corresponding author. The raw/processed data required to reproduce these findings are derived from the results of validated CFD simulations, which are thoroughly documented in the manuscript.
Conflicts of Interest
The authors declare no conflict of interest.
Nomenclature
| Nomenclature | |
| Ax | Cross-section area, m2 |
| b | Width of the cooling channel, m |
| Cp | Specific heat at constant pressure, J/(kg·K) |
| D | Hydraulic diameter, m |
| f | Friction factor |
| h | Height of the cooling channel, m; Convective heat transfer coefficient, W/(m2·K) |
| k | Thermal conductivity, W/(m·K) |
| L | Length of the cooling channel, m |
| ṁ | Mass flow rate, kg/s |
| Nu | Nusselt number |
| P | Pressure, Pa |
| Re | Reynolds number |
| sw | Internal and external wall thickness, m |
| t | Width of the side wall, m |
| T | Temperature, K |
| u | Velocity component, m/s |
| v | Velocity, m/s |
| Greek Symbols | |
| η | Thermal performance factor |
| λl | Thermal conductivity of the coolant, W/(m·K) |
| μ | Dynamic viscosity, Pa·s |
| ρl | Density, kg/m3 |
| ω | Specific turbulence dissipation rate, s−1 |
| Subscripts | |
| avg | Average |
| b | Bulk |
| c | Critical |
| in | Inlet |
| l | Coolant |
| max | Maximum |
| min | Minimum |
| w | Wall |
Appendix A. Thermophysical Properties of Supercritical Hydrogen
The thermophysical properties of supercritical hydrogen used in this study were sourced from the NIST Standard Reference Database 23 (REFPROP) [35]. The Peng–Robinson cubic equation of state was employed, and property variations with temperature and pressure were implemented directly in ANSYS FLUENT via User-Defined Functions (UDFs) that interpolate from the NIST database. This approach ensures high fidelity in capturing the strong non-linear behavior, especially near the pseudo-critical region. The turbulent Prandtl number (Prt) was set to a constant value of 0.85. Key properties at the operating pressure of 3 MPa across the relevant temperature range are tabulated below for reproducibility.
Table A1.
Thermophysical Properties of Supercritical Hydrogen at P = 3 MPa.
Table A1.
Thermophysical Properties of Supercritical Hydrogen at P = 3 MPa.
| Temperature (K) | Density, ρ (kg/m3) | Dynamic Viscosity, μ (×10−5 Pa·s) | Thermal Conductivity, k (W/m·K) | Specific Heat, Cp (kJ/kg·K) | Prandtl Number, Pr |
|---|---|---|---|---|---|
| 300 | 2.21 | 1.15 | 0.198 | 14.68 | 0.85 |
| 400 | 1.66 | 1.33 | 0.243 | 14.86 | 0.81 |
| 500 | 1.33 | 1.49 | 0.284 | 14.92 | 0.78 |
| 600 | 1.11 | 1.64 | 0.323 | 14.96 | 0.76 |
| 700 | 0.95 | 1.78 | 0.361 | 14.99 | 0.74 |
Appendix B. Boundary Condition Sensitivity Analysis
To ensure the reported results are not artifacts of the boundary condition choices, a sensitivity analysis was performed for a representative case (AR = 1, Re = 42,000).
B.1 Inlet Length Independence: The standard 0.25 m adiabatic inlet length was compared against a configuration with a 50% longer inlet (0.375 m). The difference in the local Nusselt number along the heated section was less than 1.5% after the first 10% of the heated length (z > 0.05 m). The maximum wall temperature differed by less than 0.4%, confirming the sufficiency of the standard inlet length.
B.2 Inlet Velocity Profile Robustness: The sensitivity of the results to the inlet velocity profile was assessed by comparing a uniform (top-hat) profile to a fully developed velocity profile. The differences in key performance metrics were negligible, as summarized in Table A2.
Table A2.
Comparison of key results for uniform vs. developed inlet velocity profile (AR = 1, Re = 42,000).
Table A2.
Comparison of key results for uniform vs. developed inlet velocity profile (AR = 1, Re = 42,000).
| Parameter | Uniform Inlet | Developed Inlet | Change |
|---|---|---|---|
| Average Nusselt Number (Nuavg) | 63.3 | 62.8 | −0.8% |
| Pressure Drop (Pa) | 11,542 | 11,605 | +0.5% |
| Maximum Wall Temperature (K) | 847 | 849 | +0.2% |
B.3 Outlet Independence: A check was performed to confirm that the outlet location did not influence the results. Increasing the outlet section length by 50% resulted in a negligible change in the overall pressure drop (<0.8%) and the area-weighted average outlet temperature (<0.3%).
Appendix C
“Figure A1 illustrates the key thermofluidic mechanisms governing supercritical hydrogen flow in a regenerative cooling channel with an aspect ratio of 4 at a Reynolds number of 42,000. Panel (a) reveals the flow velocity field, characterized by a distinct M-shaped profile resulting from the channel’s geometric confinement. This flow structure enhances fluid mixing and wall shear, which improves heat transfer but also increases frictional losses. Panel (b) displays the temperature distribution, showing significant thermal stratification with a hot layer developing along the heated bottom wall. The temperature range of 309 K to 668 K is consistent with operational limits for rocket engine materials. Panel (c) presents the specific heat (Cp) distribution, highlighting a layer of fluid with exceptionally high heat capacity (approximately 14,400–14,600 J/kg·K) adjacent to the heated wall. This high-Cp layer, a characteristic feature of supercritical fluids near the pseudo-critical point, acts as a thermal buffer by absorbing substantial energy and modulating the local heat transfer efficiency. Collectively, these panels elucidate the fundamental trade-off in cooling channel design: The M-shaped velocity profile promotes turbulent mixing and heat transfer enhancement, while the stratified thermal and property fields influence the overall cooling performance and pressure drop characteristics reported in Section 5.2, Section 5.3 and Section 5.4.” Panel (c) presents the specific heat (Cp) distribution, highlighting a distinct layer of fluid with exceptionally high heat capacity (approx. 14,400–14,600 J/kg·K) adjacent to the heated wall. This high-Cp layer, a hallmark of the pseudo-critical region, acts as a thermal buffer. Its axial and wall-normal extent is modulated by the channel’s aspect ratio, influencing the overall cooling efficiency.

Figure A1.
Contours of velocity (a), temperature (b), and specific heat (c) at a mid-channel location (z = 0.073 m).
Figure A1.
Contours of velocity (a), temperature (b), and specific heat (c) at a mid-channel location (z = 0.073 m).

References
- Gascoin, N.; Gillard, P.; Dufour, E.; Touré, Y. Validation of transient cooling modeling for hypersonic application. J. Thermophys. Heat Transf. 2007, 21, 86–94. [Google Scholar] [CrossRef]
- Qin, J.; Bao, W.; Zhou, W.; Yu, D. Performance cycle analysis of an open cooling cycle for a scramjet. Proc. Inst. Mech. Eng. Part G J. Aerosp. Eng. 2009, 223, 599–607. [Google Scholar] [CrossRef]
- Song, J.; Sun, B. Thermal-structural analysis of regeneratively-cooled thrust chamber wall in reusable LOX/Methane rocket engines. Chin. J. Aeronaut. 2017, 30, 1043–1053. [Google Scholar] [CrossRef]
- Gibreel, M.; Zhang, X.; Elmouazen, H. Investigation of heat transfer enhancement and thermal stratification phenomenon on supercritical hydrogen fuel flow. Therm. Sci. Eng. Prog. 2024, 53, 102759. [Google Scholar] [CrossRef]
- Elmouazen, H.; Zhang, X.; Gibreel, M.; Ali, M. Numerical investigation of pentagonal V-shape ribs to enhance heat transfer in hydrogen rocket engine cooling channels. Int. J. Hydrogen Energy 2022, 47, 23871–23886. [Google Scholar] [CrossRef]
- Xie, P.; Zhang, X. A method of rib-bed plate enhancing heat transfer in hydrogen rocket engine chamber wall. Int. J. Hydrogen Energy 2019, 44, 20504–20515. [Google Scholar] [CrossRef]
- Palaszewski, B.; Ianovski, L.S.; Carrick, P. Propellant technologies: Far-reaching benefits for aeronautical and space-vehicle propulsion. J. Propuls. Power 1998, 14, 641–648. [Google Scholar] [CrossRef]
- Ulas, A.; Boysan, E. Numerical analysis of regenerative cooling in liquid propellant rocket engines. Aerosp. Sci. Technol. 2013, 24, 187–197. [Google Scholar] [CrossRef]
- Nasser, I.; Haidn, O.; Manfletti, C. Numerical investigation of rocket engine cooling channel heat transfer for different LNG under trans-critical conditions. Int. J. Thermofluids 2023, 20, 100461. [Google Scholar] [CrossRef]
- Elmouazen, H.; Zhang, X.; Gibreel, M. Enhanced heat transfer and flow topology of hydrogen regenerative-cooling channels with novel X-shape ribs. Int. J. Hydrogen Energy 2023, 8, 32110–32124. [Google Scholar] [CrossRef]
- Xie, P.; Zhang, X. Enhancement heat transfer analysis of supercritical hydrogen fuel in small-scale channels with spherical concave. Int. J. Therm. Sci. 2020, 152, 106287. [Google Scholar] [CrossRef]
- Gibreel, M.; Zhang, X.; Elmouazen, H. Serpentine and furrowed wavy channels-based enhancement in heat transfer for a rocket engine chamber. Int. J. Therm. Sci. 2023, 185, 108074. [Google Scholar] [CrossRef]
- Angelucci, M.; Ambrosini, W.; Forgione, N. Numerical estimation of wall friction ratio near the pseudo-critical point with CFD-models. Nucl. Eng. Des. 2013, 264, 71–79. [Google Scholar] [CrossRef]
- Gibreel, M.; Zhang, X.; Elmouazen, H. Numerical study on enhanced heat transfer and flow characteristics of supercritical hydrogen rocket engine’s chamber wall using cylindrical ribs structure. Int. J. Hydrogen Energy 2022, 47, 17423–17441. [Google Scholar] [CrossRef]
- Elmouazen, H.; Zhang, X.; Gibreel, M.; Ali, M. Heat transfer enhancement of hydrogen rocket engine chamber wall by using V-shape rib. Int. J. Hydrogen Energy 2022, 47, 9775–9790. [Google Scholar] [CrossRef]
- Xie, P.; Zhang, X. Study on the influence of periodic contraction and expansion flow disturbance on convection heat transfer. Int. Commun. Heat Mass Transf. 2022, 138, 106384. [Google Scholar] [CrossRef]
- Hajialibabaei, M.; Saghir, M.Z. A critical review of the straight and wavy microchannel heat sink and the application in lithium-ion battery thermal management. Int. J. Thermofluids 2022, 14, 100153. [Google Scholar] [CrossRef]
- Buchanan, T.; Garcia, D.; Hossain, J.; Kapat, J.S. Investigation into the feasibility of using turbulators in liquid rocket combustion chamber cooling channels using a conjugate heat transfer analysis. In Proceedings of the 2018 Joint Propulsion Conference, Cincinnati, OH, USA, 9–11 July 2018; p. 4464. [Google Scholar]
- Xie, P.; Zhang, X. The influence of thermal stratification on hydrogen fuel flow and heat transfer in cooling channel with combining fin and dimple. Int. J. Hydrogen Energy 2020, 45, 9064–9076. [Google Scholar] [CrossRef]
- Liao, C.-C.; Li, W.-K.; Lin, H.-E. Heat transfer enhancement in microchannel systems through geometric modification of vortex generators and nanofluid integration: A numerical study. Results Eng. 2025, 25, 104138. [Google Scholar] [CrossRef]
- Ismail, M.; Ali, A.M.; Pereira, S.-C.C. Vortex generators in heat sinks: Design, optimisation, applications and future trends. Results Eng. 2025, 25, 104216. [Google Scholar] [CrossRef]
- Sozer, E.; Shyy, W. Modeling of fluid dynamics and heat transfer through porous media for liquid rocket propulsion. In Proceedings of the 43rd AIAA/ASME/SAE/ASEE Joint Propulsion Conference & Exhibit, Cincinnati, OH, USA, 8–11 July 2007; p. 5549. [Google Scholar]
- Choudhury, R.; Das, U.J.; Ceruti, A.; Piancastelli, L.; Frizziero, L.; Zanuccoli, G.; Daidzic, N.; Rocchi, I.; Casano, G.; Piva, S. Visco-elastic effects on the three dimensional hydrodynamic flow past a vertical porous plate. Int. Inf. Eng. Technol. Assoc 2013, 31, 1–8. [Google Scholar]
- Brighenti, R.; Tatar, F. Thermo-mechanical performance of two-dimensional porous metamaterial plates. Int. J. Mech. Sci. 2023, 238, 107854. [Google Scholar] [CrossRef]
- Zhang, Q.; Xue, T.; Zhang, X. Advancing heat transfer efficiency: V-shape crossed structures in regenerative cooling channels for rocket engines. Int. Commun. Heat Mass Transf. 2024, 158, 107921. [Google Scholar] [CrossRef]
- Jing, T.; He, G.; Li, W.; Zhang, D.; Qin, F.; Li, R. Flow and thermal analyses of supercritical hydrocarbon fuel in curved regenerative cooling channel around cavity in rocket based combined cycle engine. Appl. Therm. Eng. 2018, 145, 423–434. [Google Scholar] [CrossRef]
- Elmouazen, H.; Zhang, X.; Gibreel, M.; Ali, M. Ribbed channel-based enhancement in the thermal-structural design of the hydrogen rocket engine’s chamber. Int. J. Hydrogen Energy 2025, 138, 77–90. [Google Scholar] [CrossRef]
- Gibreel, M.; Weining, L.; Xiaohu, C.; Wahballa, H. Enhanced heat transfer in rocket engine cooling channels using combined finned designs. Int. J. Hydrogen Energy 2025, 124, 123–139. [Google Scholar] [CrossRef]
- Pandya, N.; Ekkad, S.V. Experimental study of rib height and pitch effects on thermal-hydraulic performance in gas turbine cooling at high Reynolds numbers. Int. Commun. Heat Mass Transf. 2025, 169, 109875. [Google Scholar] [CrossRef]
- Che, J.; You, R.; Xu, Y.; Li, H. Study on the effects of dimple density and dimple diameter on heat transfer and flow resistance in rotating dimpled channels. Appl. Therm. Eng. 2025, 264, 125444. [Google Scholar] [CrossRef]
- Liu, Z.; You, R.; Wang, Q.; Zhang, X.; Li, H.; Guo, W. Investigation of flow and heat transfer mechanisms in square cavity array impingement jet configurations under rotating conditions. Int. J. Heat Mass Transf. 2026, 255, 127830. [Google Scholar] [CrossRef]
- Guo, T.; Zhang, X.; You, R.; Li, H.; Han, H.; Wan, L.; Liu, L.; Li, N. The influence of impingement angle on heat transfer at leading edge of blades in a rotating state. Int. Commun. Heat Mass Transf. 2025, 169, 109693. [Google Scholar] [CrossRef]
- Sreekesh, K.; Tafti, D.; Vengadesan, S. The combined effect of coriolis and centrifugal buoyancy forces on internal cooling of turbine blades with modified ribs using Large Eddy Simulation (LES). Int. J. Therm. Sci. 2022, 182, 107797. [Google Scholar] [CrossRef]
- Miao, X.; Hu, J.; Xu, Y.; Fu, R.; Gao, L.; Su, J.; Yang, J. Thermal–structural response and life prediction of lattice regenerative cooling thrust chambers in liquid rocket engines based on a simplified viscoplastic model. Int. Commun. Heat Mass Transf. 2024, 159, 108254. [Google Scholar] [CrossRef]
- Huzel, D.K.; Huang, D.H. Modern engineering for design of liquid-propellant rocket engines (Revised and enlarged edition). In Progress in Astronautics and Aeronautics; American Institute of Aeronautics and Astronautics: Reston, VA, USA, 1992; p. 147. [Google Scholar]
- Zhang, S.; Qin, J.; Xie, K.; Feng, Y.; Bao, W. Thermal behavior inside scramjet cooling channels at different channel aspect ratios. J. Propuls. Power 2016, 32, 57–70. [Google Scholar] [CrossRef]
- Shin, D.-H.; Kim, C.S.; Park, G.-C.; Cho, H.K. Experimental analysis on mixed convection in reactor cavity cooling system of HTGR for hydrogen production. Int. J. Hydrogen Energy 2017, 42, 22046–22053. [Google Scholar] [CrossRef]
- Urbano, A.; Pizzarelli, M.; Nasuti, F. Numerical analysis of transcritical fluids heating in liquid rocket engine cooling channels. J. Aerosp. Sci. Technol. Syst. 2009, 88, 20–30. [Google Scholar]
- Reid, R.C.; Prausnitz, J.M.; Poling, B.E. The Properties of Gases and Liquids; McGraw-Hill: New York, NY, USA, 1987. [Google Scholar]
- Poling, B.E.; Prausnitz, J.M.; O’connell, J.P. Properties of Gases and Liquids; McGraw-Hill Educataion: New York, NY, USA, 2001. [Google Scholar]
- Adrian, T.; Wendland, M.; Hasse, H.; Maurer, G. High-pressure multiphase behaviour of ternary systems carbon dioxide–water–polar solvent: Review and modeling with the Peng–Robinson equation of state. J. Supercrit. Fluids 1998, 12, 185–221. [Google Scholar] [CrossRef]
- Khonakdar, D.R.; Raveshi, M.R. Mixed convection on a vertical plate in supercritical fluids by selecting the best equation of state. J. Supercrit. Fluids 2016, 107, 549–559. [Google Scholar] [CrossRef]
- Teymourtash, A.R.; Khonakdar, D.R.; Raveshi, M.R. Natural convection on a vertical plate with variable heat flux in supercritical fluids. J. Supercrit. Fluids 2013, 74, 115–127. [Google Scholar] [CrossRef]
- Jackson, J. Fluid flow and convective heat transfer to fluids at supercritical pressure. Nucl. Eng. Des. 2013, 264, 24–40. [Google Scholar] [CrossRef]
- Lemmon, E. Thermophysical Properties of Fluid Systems; NIST Chemistry WebBook, NIST Standard Reference Database Number 69; NIST: Gaithersburg, MD, USA, 2005. Available online: http://webbook.nist.gov (accessed on 5 November 2025).
- Rao, Y.; Feng, Y.; Li, B.; Weigand, B. Experimental and numerical study of heat transfer and flow friction in channels with dimples of different shapes. J. Heat Transf. 2015, 137, 031901. [Google Scholar] [CrossRef]
- Zhu, Y.; Liu, B.; Jiang, P. Experimental and numerical investigations on n-decane thermal cracking at supercritical pressures in a vertical tube. Energy Fuels 2014, 28, 466–474. [Google Scholar] [CrossRef]
- Khaled, B.; Khadidja, K. Efforts to Identify the Most Suitable RANS Turbulence Model for Accurate Conjugate Heat Transfer Prediction in Regenerative Cooled Nozzles. J. Therm. Sci. Eng. Appl. 2024, 16, 061001. [Google Scholar] [CrossRef]
- Xie, P.; Zhang, X. Hydrogen flow and heat transfer characteristic analysis in cooling channel wall with the spherical convexity structure. Int. J. Hydrogen Energy 2019, 44, 16991–17003. [Google Scholar] [CrossRef]
- Zhang, S.; Feng, Y.; Zhang, D.; Jiang, Y.; Qin, J.; Bao, W. Parametric numerical analysis of regenerative cooling in hydrogen fueled scramjet engines. Int. J. Hydrogen Energy 2016, 41, 10942–10960. [Google Scholar] [CrossRef]
- Gibreel, M.; Zhang, X.; Elmouazen, H. Enhancement of heat transfer and hydrogen fuel flow characteristics in a wavy cooling channel with secondary branch design. Int. J. Therm. Sci. 2023, 193, 108513. [Google Scholar] [CrossRef]
- Jang, D.; Jetli, R.; Acharya, S. Comparison of the PISO, SIMPLER, and SIMPLEC algorithms for the treatment of the pressure-velocity coupling in steady flow problems. Numer. Heat Transf. Part A Appl. 1986, 10, 209–228. [Google Scholar]
- Moukalled, F.; Darwish, M. A unified formulation of the segregated class of algorithms for fluid flow at all speeds. Numer. Heat Transf. -Part B-Fundam. 2000, 37, 103. [Google Scholar]
- Hendricks, R.C. Experimental Heat-Transfer Results for Cryogenic Hydrogen Flowing in Tubes at Subcritical and Supercritical Pressures to 800 Pounds Per Square Inch Absolute; National Aeronautics and Space Administration: Washington, DC, USA, 1966.
- Bao, W.; Zhang, S.; Qin, J.; Zhou, W.; Xie, K. Numerical analysis of flowing cracked hydrocarbon fuel inside cooling channels in view of thermal management. Energy 2014, 67, 149–161. [Google Scholar] [CrossRef]
- Bodkha, K.; Maheshwari, N. Heat transfer in supercritical fluids: A review. J. Nucl. Eng. Radiat. Sci. 2021, 7, 030802. [Google Scholar] [CrossRef]
- Duffey, R.B.; Pioro, I.L. Experimental heat transfer of supercritical carbon dioxide flowing inside channels (survey). Nucl. Eng. Des. 2005, 235, 913–924. [Google Scholar] [CrossRef]
- Polyakov, A. Heat transfer under supercritical pressures. In Advances in Heat Transfer; Elsevier: Amsterdam, The Netherlands, 1991; Volume 21, pp. 1–53. [Google Scholar]
- Lee, S.H.; Howell, J.R. Turbulent developing convective heat transfer in a tube for fluids near the critical point. Int. J. Heat Mass Transf. 1998, 41, 1205–1218. [Google Scholar] [CrossRef]
- Syaiful; Nabilah, H.; Suryo Utomo, M.S.K.T.; Suprihanto, A.; Soetanto, M.F. Numerical simulation of heat transfer enhancement from tubes surface to airflow using concave delta winglet vortex generators. Results Eng. 2022, 16, 100710. [Google Scholar] [CrossRef]


Disclaimer/Publisher’s Note: The statements, opinions and data contained in all publications are solely those of the individual author(s) and contributor(s) and not of MDPI and/or the editor(s). MDPI and/or the editor(s) disclaim responsibility for any injury to people or property resulting from any ideas, methods, instructions or products referred to in the content. |
© 2025 by the authors. Licensee MDPI, Basel, Switzerland. This article is an open access article distributed under the terms and conditions of the Creative Commons Attribution (CC BY) license.