Abstract
Flow resistance is a critical determinant of the efficiency and economics of a slurry pipeline. This study aims to reduce pipeline resistance by integrating a swirler to enhance particle suspension. The variation laws of slurry conveying resistance with and without a swirler under various conveying conditions were investigated. Whether a swirler is present or not, the conveying resistance increases with an increase in the conveying velocity (1~6 m/s), volume concentration (10~50%), particle diameter (0.1~5 mm), particle density (1100~1500 kg/m3), and pipe inclination (0~90°). It decreases with an increase in the pipe diameter (50~200 mm). A moderate swirling intensity reduces the resistance in high-velocity large-particle slurry transport. Considering the swirling flow characteristics in the conveying pipeline, resistance loss calculation models accounting for these characteristics were established for different flow states of the slurry in the pipeline. Taking into account the swirling characteristics in the conveying pipeline, a calculation model for resistance loss of the slurry in different flow states within the pipeline was established. The average error between this model and the experimental results was 9.04%.
1. Introduction
With the gradual depletion of shallow coal resources [1], deep-earth resource extraction has emerged as an inevitable global development trajectory [2]. To address the challenges of deep mining, Xie [3,4,5,6] pioneered a concept of in situ fluidized mining for deep coal seams. This concept aims to extract coal through underground unmanned intelligent shield tunneling operations, converting coal resources into liquefied, gasified, electrochemical, biological, and other fluidized materials, and then transporting them to the surface. For ultra-deep mines, the traditional wire rope lifting system has been unable to meet the transportation and lifting requirements of the deep coal fluidized mining system in terms of economy and reliability [7,8,9]. Due to the advantages of pipeline hydraulic conveying technology in terms of continuity, efficiency, and controllability [10,11], it becomes a feasible technical solution to address the challenges of coal transportation following deep fluidized mining. In recent years, our research group proposed a deep coal fluidization pipeline lifting system [12], which used pipeline-lifting coal slurry instead of elevator skips to transport coal, then pumped the coal slurry after fluidization mining to the surface after multistage pressurization.
It is worth noting that hydraulic transport systems have been successfully applied in deep-sea mining for lifting minerals from the seabed to surface vessels, offering valuable insights for deep underground mining scenarios. For instance, He [13] conducted a multi-objective optimization and performance analysis of splitter blades in multiphase pumps, providing guidance for enhancing the efficiency and reliability of pumping equipment under complex fluid conditions. Similarly, Chang [14] investigated the affinity law under gas–liquid conditions in multistage radial and mixed-flow multiphase pumps, contributing to the design optimization of pressurized transport systems. Moreover, Sun [15] studied the motion characteristics of multi-scale particles in periodic lifting pipes, which helps in understanding particle behavior and improving transport stability in vertical or inclined pipeline sections. These studies underscore the potential of hydraulic lifting technologies in challenging environments.
At present, most studies on pipeline transportation on the ground have focused on fine-particle slurries [16]. However, smaller particle sizes lead to higher dehydration and concentration costs. Furthermore, after dehydration, problems such as dust pollution and difficulty in loading and unloading tend to occur [17]. Therefore, increasing the diameter of coal particles is one of the future development trends in pipeline transportation technology [18], especially for application scenarios with weak infrastructure and harsh environmental conditions. When transporting large coal particles through pipelines, particle sedimentation becomes a significant challenge. Particularly in the case of long-distance horizontal pipeline transportation, the movement trajectory of particles deviates from the conveying direction and tends to deposit at the bottom of the pipeline, increasing conveying resistance and potentially leading to pipeline blockages [19]. The swirler can generate spiral flow, thereby changing the movement characteristics of particles. Although the attenuation of swirling flow may limit the use of long-distance ground pipelines, they can provide an effective solution for short horizontal sections in deep coal fluidized pipeline transportation systems [20].
The application of swirlers or spiral flow generators has expanded into a wide range of industrial multiphase transport systems [21]. For instance, in deep-sea mining systems, swirlers are primarily studied for their ability to enhance the lifting efficiency and stability of coarse, dense mineral particles in vertical or inclined pipes under high-pressure conditions [22]. Conversely, in the pneumatic conveying of fragile materials such as food grains, the focus shifts to utilizing spiral flow to minimize particle breakage and degradation by creating a cushioned, low-shear flow regime [23]. Within chemical process intensification, static swirling elements are commonly employed to dramatically improve gas–liquid mass transfer rates in tubular reactors, where interfacial area creation is paramount [24]. Meanwhile, in dredging and slurry transport engineering, research has investigated spiral flow for its potential to reduce pipeline wear by altering particle trajectories, even if full suspension is not always achieved [25]. Zhao [26] arranged a guide vane-type swirling device upstream of the coal slurry-conveying pipeline to generate a spiral flow, studied the wear reduction mechanism of the elbow and the evolution law of the wear morphology under the action of the swirling device, established a mathematical model between the guide vane parameters and the conveying parameters and the maximum wear rate of the elbow, and verified the wear reduction effect of the elbow through experiments.
The resistance loss in solid–liquid two-phase pipelines constitutes a critical determinant of hydraulic transport performance, directly influencing ore throughput and energy efficiency. Consequently, the resistance losses in slurry conveyance have garnered significant global research attention. Three principal theoretical frameworks dominate current practice: the diffusion theory, gravity theory, and energy theory [27]. The diffusion theory treats slurries as homogeneous fluids with uniform properties, neglecting particle-fluid interactions. Gravity theory focuses exclusively on particle sedimentation phenomena; while it acknowledges fluid-particle coupling, it disregards energy dissipation from solid-phase motion during transport. The energy theory makes up for the deficiencies of the diffusion theory and the gravity theory, and therefore is widely applied at present.
However, the current research on drag loss is still focused on the pipeline axial flow field, and the law of influence of spiral flow field guided by a swirler in conveying pipeline on slurry resistance loss is still unclear. Therefore, this paper will study the variation law of slurry resistance loss in the spiral flow field under the swirler and establish the corresponding calculation model. The research results will provide a theoretical reference for the economy and reliability of the deep coal fluidization pipeline transportation system.
2. Test Methods
2.1. Numerical Simulation Method
Given the characteristics of the slurry being transported, a guide vane swirler, which features high structural strength, low energy consumption, and an unrestricted installation position, has been selected as the research subject [28]. Changes in its structural parameters can alter the spiral flow characteristics within the pipeline [29,30], thereby affecting the motion of particles within the pipeline, which consequently influences the performance of the pipeline transportation system.
The internal flow field of the simulation model was divided by tetrahedral meshes, and the Element Quality and Element Quality of the grid are both above 0.8, as shown in Figure 1 [31].
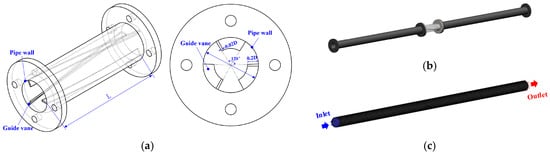
Figure 1.
Physical model and internal flow grid of the pipeline under the swirler. (a) Structure diagram of the guide vane swirler; (b) physical model of transport pipeline; (c) internal flow field meshing.
The Euler–Lagrange method was used for the numerical simulation of solid–liquid two-phase flow in pipelines, and the continuity equation and momentum equation given as follows [32,33,34,35].
where αg is the volume fraction of the fluid. ρg is the fluid density. ug is the fluid velocity; g is the fluid velocity vector. ▽ is the horizontal and vertical gradient operator. μg is the fluid viscosity. ex is the solid–liquid interaction force. p is static pressure.
The Realizable k-ε model delivers enhanced computational accuracy when mesh quality is sufficient. The turbulent kinetic energy (k) and dissipation rate (ε) are modeled using the following differential equations:
where μt is the turbulent viscosity coefficient. xj is the Cartesian coordinate component in tensor notation. ug,j is the Cartesian component of the fluid velocity vector in tensor notation. C1ε and C2 are the constant coefficients for the turbulence model. σk and σε are the turbulent Prandtl numbers of the k equation and the ε equation. The default values are C1ε = 1.44, C2 = 1.9, σk = 1.0, and σε = 1.2. Sk and Sε represent the turbulent energy term and the turbulent dissipation source term. Gk is the turbulent kinetic energy caused by velocity. Gb is the turbulent kinetic energy caused by buoyancy. YM is the influence of turbulent pulsation on the total dissipation rate. C3ε is the uncertain constant affecting buoyancy. C1 is the equation correction coefficient.
The trajectory of a particle is governed by the force balance equation acting on the particle. The equation of motion for the particle in the Cartesian coordinate system is expressed as follows:
where mp is the mass of the particle. p is the particle velocity vector. ρs is the particle density. ds is the particle diameter. Cd is the drag coefficient. FKTGF is the particle fluid dynamics used in the DDPM model to consider the interaction between particles (such as particle collision, translation, etc.). On the right side of Equation (5), the first term is the pressure gradient force, the second term is the drag force of the fluid on the particles, and the third term is the buoyancy force of the particles.
2.2. Bench Test Method
Resistance loss measurements were conducted using the customized experimental apparatus depicted in Figure 2. The swirler was customized using 3D printing technology. Pressure sensors were installed at the upstream and downstream positions of the test section. Acquired signals underwent wavelet transform-based denoising procedures. The pipeline resistance loss index im, was calculated as the pressure drop per unit conveying length (ΔP/L).
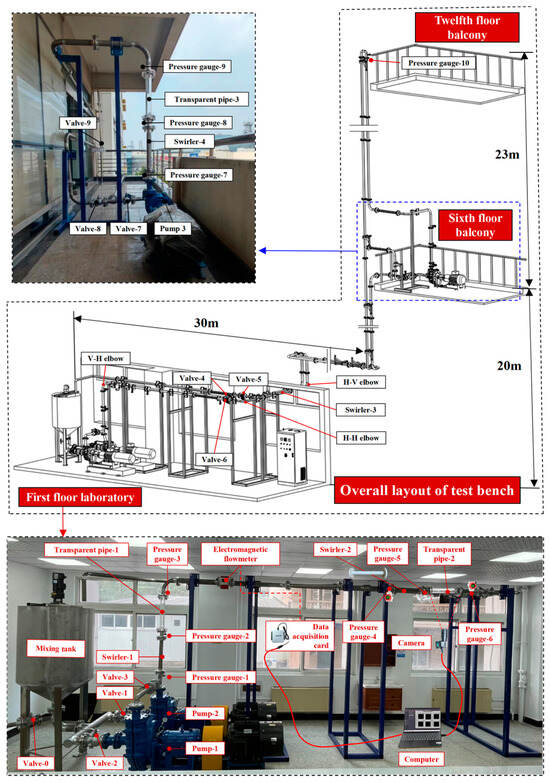
Figure 2.
Deep coal fluidization pipeline lifting simulation test bench.
In order to verify the grid independence, the pressure difference between the inlet and outlet are calculated and compared under different grid sizes, as shown in Figure 3a. It can be seen from Figure 3a that as the number of grids increases, the pressure difference between the inlet and outlet vary continuously. When the number of grids reaches 50 × 105, the pressure difference between the inlet and outlet tend to be stable. Therefore, all simulations use a number of 50 × 105 grids, which can effectively reduce the amount of calculation while ensuring the accuracy of the calculation. The comparison between the experimental data and the simulation results is shown in Figure 3b. The results show that the simulation results are in good agreement with the test data, indicating that the accuracy of the simulation model is high.
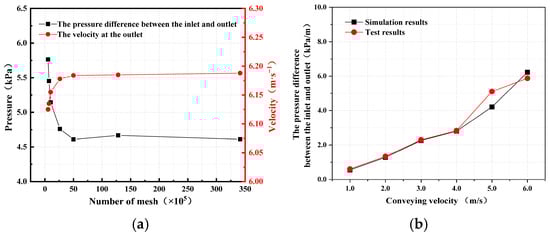
Figure 3.
Mesh sensitivity analysis and simulation model verification. (a) The grid-independent verification; (b) comparison of numerical results with experimental data.
The combined use of bench tests and simulation tests in this study is due to the fact that altering pipeline diameter and inclination angle, as outlined in the test scheme, is not feasible on the fixed experimental bench. Therefore, we substitute the relevant tests with simulation experiments.
3. Simulation and Test Results
3.1. Particle Settlement in the Pipeline with and Without a Swirler
Simulation tests were conducted on coal particles with diameters ranging from 0.1 mm to 5 mm in horizontal pipelines. The movement trajectories of some randomly selected particles were recorded and presented in Figure 4 and Figure 5. As shown in Figure 4, in the absence of a swirler and at a conveying velocity of 4 m/s, particles with smaller diameters (e.g., less than 0.2 mm) remain suspended and transported along with the fluid. As the particle diameter increases (such as when the diameter is greater than or equal to 2 mm), the larger the diameter of the particles, the more likely they are to settle as the conveying distance increases (as shown in the downward arrow in Figure 4a),and then move forward along the bottom of the pipe (as shown in the blue box in Figure 4a). In these cases, the particles will collide and rub against the pipe wall. Moreover, the accumulation of large particles will further increase the local resistance to the fluid flow. Therefore, the larger the particle diameter and the more pronounced the sedimentation, the higher the resistance loss during the transportation process is usually. This also corresponds to the proportion of large particles at the outlet section of the conveying pipe.
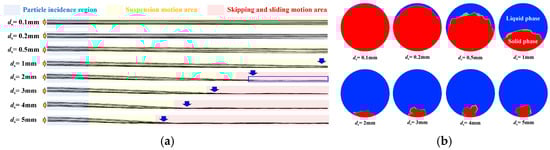
Figure 4.
Particle motion in a conveying pipeline without a swirler. (a) Particle motion state; (b) particle proportion.
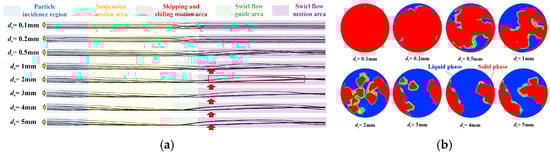
Figure 5.
Particle motion in a conveying pipeline with a swirler. (a) Particle motion state; (b) particle proportion.
As shown in Figure 5, the motion states of particles of different sizes in the conveying pipeline have changed differently with a swirler. When the particle diameter is small (ds ≤ 0.2 mm), their motion state is the same as that without a swirler, and they are not easy to settle. As the particle diameter increases, especially when the particle diameter ds ≥ 1 mm, the particles show a significant upward movement trend after passing through the swirler (as shown in the upward arrow in Figure 5a). The particles originally located at the bottom of the pipeline return to the center of the pipeline and move forward in a spiral manner (as shown in the red box in Figure 5a). This is also consistent with the proportion of large particles in the cross-section at the outlet of the conveying pipeline. The swirler modifies the flow field to sustain large particles in a helical suspension state. Under this condition, the total resistance loss encompasses two primary components: the frictional drag between the fluid and particles, and the energy dissipation inherent to the swirling flow itself. However, compared to the scenario without a swirler—where particle settling leads to pronounced wall collisions and accumulation resistance—the resistance distribution in this swirling regime becomes more uniform. Consequently, the overall energy consumption for slurry transportation is more manageable and predictable.
3.2. The Variation Law of Resistance Loss in the Pipeline with and Without a Swirler
The dynamic behavior of particles (or droplets) near complex multiphase interfaces, such as sedimentation, collision and re-swirl, is a key factor determining the resistance and stability of the system. The related mechanisms have been widely studied in various multiphase flow systems [36]. Our previous research indicated that the addition of a swirler in the slurry-conveying pipeline can affect the motion state of the particles [37]. Whether it can reduce the transportation resistance of the slurry pipeline under all working conditions has not yet been studied. Therefore, the resistance loss tests were conducted according to the test scheme shown in Table 1 to compare and study the variation laws of the resistance loss of the clear water pipeline and the coal slurry pipeline with and without the swirler. The test results are shown in Figure 6.

Table 1.
Resistance loss test scheme.
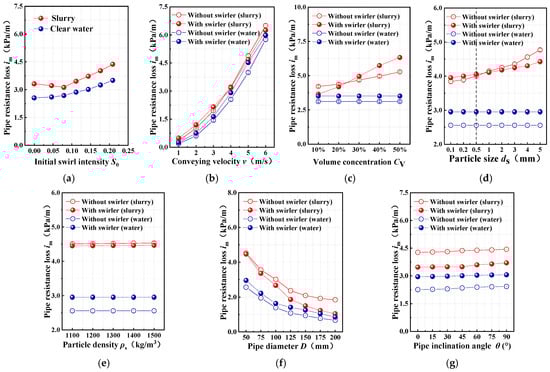
Figure 6.
Test results of resistance loss under different operating conditions. Subfigures (a–e) present the bench test results, while (f,g) present the simulation results.
3.2.1. The Influence of Swirl Intensity on Resistance Loss
In general, swirl number S is used to quantitatively describe the swirl intensity of the flow field in the pipeline, and its calculating formula is shown in Equation (6) [38].
where R is the radius of the pipe. r is the distance from a point on the section of the pipe to the center of the pipeline. ua is the axial velocity of the liquid phase. uc is the circumferential velocity of the liquid phase.
As shown in Figure 6a, after the installation of the swirler, the resistance loss in water pipelines increases with swirl intensity enhancement, and the resistance loss in slurry pipelines first decreases and then increases with swirl intensity. Experimental results demonstrate that when the initial swirl intensity S0 ≤ 0.08 (the guide vane angle of swirler does not exceed 60°) [37], the increased resistance loss in the swirler section at this time is less than the reduced resistance loss of the downstream slurry due to the change in flow state caused by obtaining rotational kinetic energy. However, when S0 > 0.08, the significantly enhanced circumferential velocity and increased rotational kinetic energy make the downstream resistance reduction insufficient to compensate for the additional resistance loss at the swirler section. This study will employ the swirler with a guide vane angle of 60° (corresponding to initial swirl intensity S0 = 0.08) for further investigation.
3.2.2. The Influence of Conveying Velocity on Resistance Loss
Figure 6b shows that resistance loss in both water and slurry pipelines increases with conveying velocity, irrespective of the swirler’s presence. For slurry, resistance increases more sharply without the swirler. At the velocity ≤ 4 m/s, resistance without a swirler is lower than with it. As indicated by the flow state discrimination method (Figure 7), when the conveying velocity is ≤4 m/s and the particle diameter is 5 mm, the role of the swirler in suspending the particles is limited. In these conditions, the slurry predominantly maintains a slip state along the pipe wall both with and without the swirler, resulting in higher resistance losses. However, when the velocity exceeds 4 m/s, under the action of the circumferential water flow, the particles were influenced by the circumferential drag force (as illustrated in Figure 8). Consequently, the particles above the deposition layer exhibited an “upward” trend, and the particles close to the wall beneath the deposition layer also moved forward and upward along the pipe wall following the circumferential water flow. During this process, the moving surface of the depositing particles was the curved surface of the pipe wall. When the depositing particles rose along with the circumferential water flow, part of their gravity was borne by the wall surface. During the process of being pushed upward and forward by the circumferential flow, the particles might re-deposit at the bottom of the pipe. Moreover, the circumferential flow velocity became stronger as it got closer to the pipe wall, causing the particles to be lifted again by the circumferential flow rotation, transitioning particle movement from slip to skip state. This transition reduces particle-wall friction at the pipe bottom, ultimately yielding lower resistance losses with the swirler than without it. For water flow (lacking solid particles), resistance loss is consistently higher with the swirler. The device cannot reduce non-existent particle friction but forcibly converts axial flow into spiral flow. This flow transformation consumes additional energy to sustain the rotation, inevitably increasing resistance loss compared to straight flow.
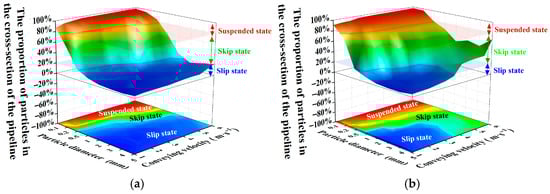
Figure 7.
Quantitative identification method of slurry flow state in spiral flow conveying pipeline. (a) Without a swirler; (b) With a swirler.
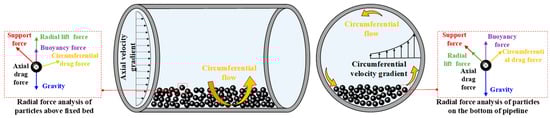
Figure 8.
Schematic diagram of particle motion analysis under the action of swirler.
3.2.3. The Influence of Volume Concentration on Resistance Loss
As shown in Figure 6c, in slurry pipelines without a swirler, the resistance loss increases with volume concentration. This is because a higher particle concentration leads to more collisions between particles. With a swirler, resistance loss also increases with concentration, but more steeply. When concentration is greater than 30%, swirler-induced resistance loss exceeds non-swirler resistance loss. The reason is that the spiral flow of the swirler intensifies the particle collisions. For water pipelines, resistance loss remains constant and is consistently lower without the swirler.
3.2.4. The Influence of Particle Diameter on Resistance Loss
Figure 6d shows that slurry pipeline resistance loss increases with particle diameter. Critically, the swirler increases loss for small particles (ds ≤ 0.5 mm) but decreases it for larger particles (ds > 0.5 mm). At constant volumetric concentration, particle count inversely relates to diameter. Small particles (ds ≤ 0.5 mm) stay suspended (Figure 7b), and swirler-induced spiral flow boosts particle-particle and particle-wall collisions, increasing loss. Larger particles (ds > 0.5 mm) settle, which causes the slurry to slip along the pipe bottom (Figure 7b). The swirler changes the flow to a skip state, reducing particle-wall contact and friction, thus lowering loss.
3.2.5. The Influence of f Particle Density on Resistance Loss
As shown in Figure 6e, resistance loss in slurry pipelines increases with particle density, with and without a swirler, due to the higher energy required to suspend denser particles. Nevertheless, resistance with the swirler remains consistently lower than without it, as the swirler resuspends settled large particles, reducing particle-wall collisions and frictional losses.
3.2.6. The Influence of f Pipe Diameter on Resistance Loss
Figure 6f shows resistance loss decreasing with increasing pipe diameter for both slurry and water pipelines, irrespective of swirler presence. Notably, the reduction is more pronounced in slurry pipelines with the swirler. This enhanced reduction occurs because a larger pipe diameter increases inter-particle spacing and reduces particle-wall interaction under constant operating conditions. The swirler further optimizes flow conditions, thereby significantly reducing the energy loss caused by the particle collisions. Conversely, in water pipelines, resistance reduction stems solely from decreased viscous friction and shows minimal difference with or without the swirler, as there are no particles that would be affected.
3.2.7. The Influence of f Pipe Inclination Angle on Resistance Loss
As shown in Figure 6g, resistance loss in slurry and water pipelines (with or without swirler) slightly increases with rising pipe inclination angle. The reason is that upward-inclined transport raises fluid potential energy, requiring extra energy and increasing loss, with greater angles causing more loss. However, for slurry pipelines, the swirler reduces resistance loss at the same inclination angle. When kinetic energy converts to potential energy during upward transport, particles tend to settle. The swirler mitigates this settling, thus decreasing resistance loss.
3.3. Comparative Analysis of Drag Reduction Methods for Slurry Transport
The experimental results presented in Section 3.2 demonstrate the feasibility of installing a swirler to reduce the conveying resistance in coal slurry pipelines, particularly under conditions of high velocity and large particle size. To further elucidate the position and advantages of this active flow-control strategy within the broader context of pipeline engineering, a comparative analysis with several established drag reduction methods is provided in Table 2. As summarized, the swirler-based approach offers distinct benefits, including targeted prevention of particle settlement and modular retrofit capability for existing systems. Furthermore, its purely physical mechanism allows for potential synergistic use with passive wear-reduction techniques (e.g., protective linings), presenting a comprehensive strategy for enhancing both the efficiency and longevity of slurry transport systems.
Table 2.
Characteristics of various drag-reduction methods for conveying pipelines [39,40,41].
4. Calculation Model of Resistance Loss Considering the Swirl Characteristics
The form of slurry resistance loss under the energy theory is im = iw·Sm + ∆i. To construct a slurry resistance loss calculation model including swirl characteristics in this paper, the additional resistance loss ∆i is divided into three parts, as shown in Equation (7).
where im is the slurry resistance loss. iw is the clear water resistance loss. is is the particle resistance loss. ig is the potential resistance loss (the resistance loss when the fluid is lifted to a higher place, that is, the difference between the clear water resistance loss in the inclined pipeline and the clear water resistance loss in the horizontal pipeline without the action of the swirler). ix is the swirl resistance loss (the difference between the slurry resistance loss im0 without the swirler and the slurry resistance loss im with the swirler).
4.1. The Functional Relationship Between Resistance Loss and Its Influencing Factors
Based on the experimental data, functional relationships were systematically established to quantify the dependencies of three resistance loss components—particle resistance loss is, potential energy resistance loss ig and swirl resistance loss ix—on key parameters: initial swirl intensity S0, conveying velocity v, volume concentration CV, particle size ds, particle density ρs, pipe diameter D, and pipe inclination angle θ. As shown in Figure 9, the fitted mathematical models are as shown in Equations (9)–(15).
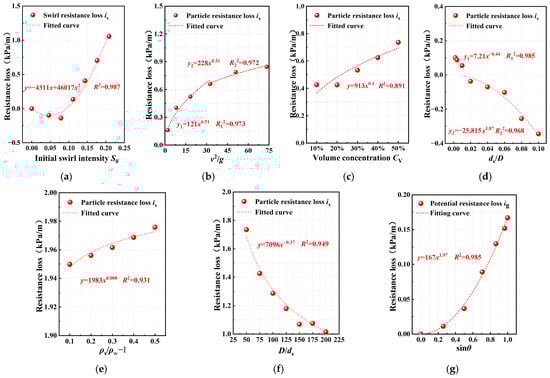
Figure 9.
Fitting curve of resistance loss. (a) Initial swirl intensity vs. Swirl resistance loss, (b) Conveying flow velocity vs. Particle resistance loss, (c) Volumetric concentration vs. Particle resistance loss, (d) Particle size vs. Particle resistance loss, (e) Particle density vs. Particle resistance loss, (f) Pipe diameter vs. Particle resistance loss, and (g) Pipe inclination angle vs. Potential resistance loss. Thank you for the guidance.
4.2. The Calculation Model of Slurry Resistance Loss Based on Swirling Characteristics
Considering the relationship between slurry flow state and pipeline resistance loss, and based on the quantitative discrimination method of slurry flow state with the swirler in Figure 7b, resistance loss calculation models for the swirl flow conveying pipeline are constructed for the suspended, skip, and slip states. The resistance loss calculation functions are corrected using the swirl flow attenuation function in Equation (16).
4.2.1. Suspended State
As can be seen from the above, when the slurry is in the suspended state, the corresponding particle diameter ds < 0.5 mm. The resistance loss of clear water iw, the resistance loss of particles is, the swirl resistance loss ix, and the potential resistance loss ig are combined according to Equation (6), and SPSS [26.0] multiple linear regression analysis is adopted. The calculation model, im-SUF of the slurry resistance loss in the suspended state based on the swirling characteristics, is obtained as shown in Equation (17).
4.2.2. Skip State
Under this flow state, the corresponding particle diameter is in the range of 0.5 mm ≤ ds < 5 mm, and the conveying velocity v ≥ 4 m/s. Using the same method mentioned above, the calculation model im-SKF of slurry resistance loss in the skip state based on the swirling characteristics is obtained as shown in Equation (18).
4.2.3. Slip State
Under this flow state, the corresponding particle diameter is in the range 0.5 mm ≤ ds < 5 mm, and the conveying velocity v < 4 m/s. Using the same method mentioned above, the calculation model im-SLF of slurry resistance loss in the slip state based on swirling characteristics is obtained as shown in Equation (19).
4.3. Verification Test of the Slurry Resistance Loss Calculation Model
To verify the accuracy of the resistance loss calculation model based on the swirling characteristics established in this paper, resistance loss tests were conducted using the test device shown in Figure 2, according to the test scheme outlined in Table 3. Figure 10 presents the comparison results of the calculated values of different resistance loss calculation models and the test values of resistance loss.
Table 3.
Bench verification test scheme for calculating model of slurry resistance loss.
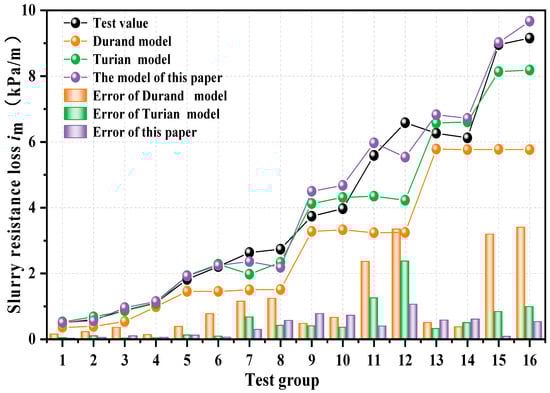
Figure 10.
The calculation model of resistance loss in this paper is compared with that of other studies.
All models show similar trends, but the proposed model’s calculated values closely match the experimental data, with an average error of 9.04% and a maximum error of 19.38%. Critically, this validation confirms that effective resistance reduction using a swirler requires generating appropriate swirl intensity tailored to specific conveying conditions. Excessive swirl intensity raises loss, while weak intensity fails to alter particle flow. The optimal conveying conditions occur near the slip-skip states, characterized by high flow rates, large particle diameters, and moderate volume concentrations.
5. Conclusions
This study investigates the variation patterns of flow resistance in slurry-conveying pipelines. The results demonstrate that swirler implementation reduces pressure losses under specific conditions and elucidate the underlying mechanism governing swirler-induced resistance modification. The principal findings are summarized as follows:
- (1)
- The addition of the swirler transforms the axial flow field in the conveying pipeline into a spiral flow field. The dragging force of the circumferential water flow can cause the large particles that have settled at the bottom of the pipeline to rise, making the particles easier to suspend. As a result, the slurry changes from a slip state to a skip state, thereby reducing the resistance loss.
- (2)
- Under the action of the swirler, the slurry resistance loss first decreases and then increases with the increase in the swirling intensity. It increases with the increase in conveying velocity, volume concentration, particle diameter, particle density, and pipe inclination angle, and decreases with the increase in pipe diameter. Only under the conditions where the conveying velocity exceeds 4 m/s, the particle diameter is larger than 0.5 mm, and the volume concentration remains below 25%, does the pressure loss become lower than that without the swirler.
- (3)
- Considering the relationship between the flow state of the slurry in the conveying pipeline and the resistance loss, resistance loss calculation models for the suspended state, skip state, and slip state based on the swirl characteristics were established, respectively. The average error is 9.04% and the maximum error is 19.38%.
Author Contributions
Writing—original draft, S.Z.; Writing—review and editing, J.B.; Conceptualization, J.J.; Software, Y.L.; Investigation, X.Z.; Validation, Y.M.; Methodology, Y.Y. All authors have read and agreed to the published version of the manuscript.
Funding
This work was supported in China by the National Natural Science Foundation of China (Grant No. 52404165), the Natural Science Foundation of the Jiangsu Higher Education Institutions (Grant No. 25KJD440001), and the Xuzhou Science and Technology Program (Grant No. KC2025012).
Institutional Review Board Statement
Not applicable.
Informed Consent Statement
Not applicable.
Data Availability Statement
The original contributions presented in this study are included in the article. Further inquiries can be directed to the corresponding author.
Conflicts of Interest
The authors declare no conflicts of interest.
Nomenclature
| αg | the volume fraction of the fluid |
| ρg | the fluid density, kg/m3 |
| ug | the fluid velocity, m/s |
| g | the fluid velocity vector, m/s |
| ▽ | the horizontal and vertical gradient operator, 1/m |
| μg | the fluid viscosity, Pa·s |
| ex | the solid–liquid interaction force, N |
| the pressure, Pa | |
| k | the turbulent kinetic energy, m2/s2 |
| ε | the dissipation rate, m2/s3 |
| xj | the Cartesian coordinate component in tensor notation |
| ug,j | the Cartesian component of the fluid velocity vector in tensor notation |
| σk | the turbulent Prandtl numbers of the k equation |
| μt | the turbulent viscosity coefficient, Pa·s |
| σt | the turbulent Prandtl numbers of the ε equation |
| Gk | the turbulent kinetic energy caused by velocity, kg/(m·s3) |
| Sk | the turbulent energy term, m2/s3 |
| C1ε, C2 | the constant coefficients for the turbulence model |
| YM | the influence of turbulent pulsation on the total dissipation rate, m2/s3 |
| Sε | the turbulent dissipation source term, m2/s4 |
| C1 | the equation correction coefficient |
| Gb | the turbulent kinetic energy caused by buoyancy, kg/(m·s3) |
| p | the particle velocity vector, m/s |
| C3ε | the uncertain constant affecting buoyancy |
| ds | the particle diameter, mm |
| mp | the mass of the particle, kg |
| Cd | the drag coefficient |
| ρs | the particle density, kg/m3 |
| r | the distance from a point on the section of the pipe to the center of the pipeline, mm |
| R | the radius of the pipe, mm |
| uc | the circumferential velocity of the liquid phase, m/s |
| ua | the axial velocity of the liquid phase, m/s |
| im | the slurry resistance loss, Pa/m |
| iw | the clear water resistance loss, Pa/m |
| ig | the potential resistance loss, Pa/m |
| ix | the swirl resistance loss, Pa/m |
| S0 | the initial swirl intensity |
| CV | the volume concentration |
| D | the pipe diameter, mm |
| θ | the pipe inclination angle, rad |
| χ(Zsd) | the spiral flow attenuation function |
| Zsd | the distance from the outlet of the swirler, mm |
| KTGF | the particle fluid dynamics used in the DDPM model to consider the interaction between particles (such as particle collision, translation, etc.), N |
References
- Zhang, Q.H.; Wang, X.R.; Yuan, L. Development of a multi-field coupled numerical simulation program for underground coal gasification and multi-field evolution laws. J. China Coal Soc. 2023, 48, 2506–2518. [Google Scholar] [CrossRef]
- Chen, S.D.; Tang, D.Z.; Hou, W.; Li, Y.Z.; Tao, S.; Xu, H.; Li, S.; Tang, S.L.; Pu, Y.F.; Zhang, B. Geological particularity and reservoir engineering response of deep coalbed methane. Acta Pet. Sin. 2023, 44, 1993–2006. [Google Scholar] [CrossRef]
- Xie, H.P.; Gao, F.; Ju, Y.; Zhang, R.; Gao, M.Z.; Deng, J.H. Novel idea and disruptive technologies for the exploration and research of deep earth. Adv. Eng. Sci. 2017, 49, 1–8. [Google Scholar] [CrossRef]
- Xie, H.P.; Gao, F.; Ju, Y.; Ge, S.R.; Wang, G.F.; Zhang, R.; Gao, M.Z.; Wu, G.; Liu, J.Z. Theoretical and technological conception of the fluidization mining for deep coal resources. J. China Coal Soc. 2017, 42, 547–556. [Google Scholar] [CrossRef]
- Xie, H.P.; Ju, Y.; Gao, M.Z.; Gao, F.; Liu, J.Z.; Ren, H.W.; Ge, S.R. Theories and technologies for in-situ fluidized mining of deep underground coal resources. J. China Coal Soc. 2018, 43, 1210–1219. [Google Scholar] [CrossRef]
- Xie, H.P.; Ju, Y.; Ren, S.H.; Gao, F.; Liu, J.; Zhu, Y. Theoretical and technological exploration of deep in situ fluidized coal mining. Front. Energy 2019, 13, 603–611. [Google Scholar] [CrossRef]
- Singh, R.P.; Mallick, M.; Verma, M.K. Studies on failure behaviour of wire rope used in underground coal mines. Eng. Fail. Anal. 2016, 70, 290–304. [Google Scholar] [CrossRef]
- Wang, D.G.; Zhang, J.; Ge, S.R.; Zhang, D.K.; Shi, G.Y. Mechanical behavior of hoisting rope in 2 km ultra deep coal mine. Eng. Fail. Anal. 2019, 106, 104185. [Google Scholar] [CrossRef]
- Galy, B.; Giraud, L. Risk mitigation strategies for automated current and future mine hoists. Saf. Sci. 2023, 167, 106267. [Google Scholar] [CrossRef]
- Das, S.N.; Biswal, S.K.; Mohapatra, R.K. Recent advances on stabilization and rheological behaviour of iron ore slurry for economic pipeline transportation. Mater. Today Proc. 2020, 33, 5093–5097. [Google Scholar] [CrossRef]
- Das, D.; Das, S.K.; Parhi, P.K.; Dan, A.K.; Mishra, S.; Misra, P.K. Green strategies in formulating, stabilizing and pipeline transportation of coal water slurry in the framework of WATER-ENERGY NEXUS: A state of the art review. Energy Nexus 2021, 4, 100025. [Google Scholar] [CrossRef]
- Bao, J.S.; Zhao, S.D.; Wang, Z.B.; Ge, S.R.; Yin, Y.; Huang, C.G.; Zhou, H. A Deep Coal Fluidized Pipeline Transportation System. CN202110715365.2. 18 February 2022. Available online: https://kns.cnki.net/kcms2/article/abstract?v=29aDaWKg40GLx-CVGG35OkGpkvaQYG7YrPDBKcWU_7BjN2PvCu-tXfp4YGLIC3WcdexAWLm_qaiygr_UmUIvQQpDIaVJ9tASXL5qQkN14nFHflz20Kg266bITRQ5mNBsAs_s2U96dNB0qSDLy-7LHAvUhiCSWrB-_XnKxYuPEJAC6UXBaT3xjfjmpyoZNiyA&uniplatform=NZKPT (accessed on 22 December 2025).
- He, C.; Han, W.; Li, R.; Dong, Y.; Zhang, Y. Multi-objective optimization and performance analysis of the splitter blades in a multiphase pump. Int. J. Fluid Eng. 2024, 2, 013501. [Google Scholar] [CrossRef]
- Chang, L.; Yang, C.; Su, X.; Dai, X.; Xu, Q.; Guo, L. Investigations on affinity law under gas–liquid conditions in multistage radial and mixed-flow multiphase pumps. Int. J. Fluid Eng. 2024, 1, 013503. [Google Scholar] [CrossRef]
- Sun, X.; Lin, Z.; Li, L.; Zhu, Z. Motion characteristics of multi-scale particles in periodic lifting pipes. Ocean Eng. 2025, 327, 120952. [Google Scholar] [CrossRef]
- Ma, Y.; Chen, J.Q.; Men, Z.M.; Ruan, Z.Y.; Zou, D.Z.; Zuo, H.Q.; Han, W.L. Optimization of coal pipeline transportation parameters. Coal Eng. 2017, 49, 107–111. [Google Scholar] [CrossRef]
- Li, Y.G.; Pang, Y.Q.; Song, X.T.; Jia, X.M.; Lu, Y.F.; Sun, X.H.; Zhang, X.L. Influence of setting angle for guide bar on velocity characteristics of spiral flow in cross-sections between piped carriages. Trans. Chin. Soc. Agric. Eng. 2021, 37, 87–94. [Google Scholar] [CrossRef]
- Lu, Y. Application status and development direction of coal slurry pipeline transportation technology. Guangdong Chem. Ind. 2020, 47, 67–68. [Google Scholar]
- Singh, M.K.; Kumar, S.; Ratha, D.; Kaur, H. Improvement in head loss characteristics of fine particulate coal water suspension with addition of coarser particulate. Int. J. Coal Prep. Util. 2019, 42, 305–314. [Google Scholar] [CrossRef]
- Sun, X.H.; Yan, Q.F.; Li, Y.Y. Study on Hydraulic Characteristics of Pipe Helical Flow Transportation; China Water and Power Press: Beijing, China, 2012. [Google Scholar]
- Hawkins, E.K.; Cheng, J.S.; Abbate, J.A.; Pilegard, T.; Stellmach, S.; Julien, K.; Aurnou, J.M. Laboratory Models of Planetary Core-Style Convective Turbulence. Fluids 2023, 8, 106. [Google Scholar] [CrossRef]
- Chen, X.; Chen, Y.; Wu, X.; Zhu, P.; Yang, L. Optimizing Energy Efficiency in Deep-Sea Mining: A Study on Swirling Flow Transportation of Double-Size Mineral Particles. Energies 2024, 17, 4240. [Google Scholar] [CrossRef]
- Klinzing, G.E.; Rizk, F.; Marcus, R.; Leung, L.S. Chapter 8, Flow Aids and Their Applications. In Pneumatic Conveying of Solids: A Theoretical and Practical Approach; Springer: Dordrecht, The Netherlands, 2010. [Google Scholar] [CrossRef]
- Thakur, R.K.; Vial, C.; Nigam, K.D.P.; Nauman, E.B.; Djelveh, G. Static Mixers in the Process Industries—A Review. Chem. Eng. Res. Des. 2004, 82, 155–164. [Google Scholar] [CrossRef]
- Nan, J.H.; Luo, H.; Ma, K.N.; Gao, H.; Wang, C.Q. Orthogonal numerical experiment method and application for shape optimization of desilting channel with swirling flow. J. Hydroelectr. Eng. 2022, 41, 160–169. [Google Scholar] [CrossRef]
- Zhao, S.D.; Bao, J.S.; Ge, S.R.; Wang, Z.B.; Yin, Y.; Li, Y.F. Influence of solid-liquid two-phase flow conveying parameters on the elbow wear with and without the swirler. Tribol. Int. 2023, 186, 108635. [Google Scholar] [CrossRef]
- Gao, R.J.; Tang, J.; Lin, T. Resistance loss of transportation derivation on high-speed spiral flow in lifting pipe for deep-sea mining. Mach. Des. Manuf. 2017, 2, 153–156. [Google Scholar] [CrossRef]
- Zhao, S.D.; Bao, J.S.; Ge, S.R.; Wang, Z.B.; Yin, Y.; Huang, C.G. Influence and optimization of swirler parameters on elbow wear of deep coal fluidization pipeline transportation system. Friction 2024, 12, 1408–1433. [Google Scholar] [CrossRef]
- Saad, I.; Baria, S. Guide vane swirl and tumble device to improve in-cylinder air flow of CI engine using vegetable oil. Procedia Eng. 2014, 90, 425–430. [Google Scholar] [CrossRef][Green Version]
- Baria, S.; Saad, I. CFD modelling of the effect of guide vane swirl and tumble device to generate better in-cylinder air flow in a CI engine fuelled by biodiesel. Comput. Fluids 2013, 84, 262–269. [Google Scholar] [CrossRef]
- Kim, I.; Kim, J.; Choe, Y.; Ryu, K.; Cha, J.; Ri, J. Effect of vane angle on combustion characteristics of premixed H2/air in swirl micro-combustors with straight vane or twisted vane. Appl. Therm. Eng. 2023, 228, 120528. [Google Scholar] [CrossRef]
- Singh, M.K.; Kumar, S.; Ratha, D. Computational analysis on disposal of coal slurry at high solid concentrations through slurry pipeline. Int. J. Coal Prep. Util. 2020, 40, 116–130. [Google Scholar] [CrossRef]
- Li, Y.; Liu, D.X.; Cui, B.L.; Lin, Z.; Zheng, Y.H.; Ishnazarov, O. Studying particle transport characteristics in centrifugal pumps under external vibration using CFD-DEM simulation. Ocean Eng. 2024, 301, 117538. [Google Scholar] [CrossRef]
- Fagbade, A.; Heinz, S. Continuous Eddy Simulation vs. Resolution-Imposing Simulation Methods for Turbulent Flows. Fluids 2024, 9, 22. [Google Scholar] [CrossRef]
- Jeong, S.-J.; Lee, S.-J.; Moon, S.-J. CFD Thermo-Hydraulic Evaluation of a Liquid Hydrogen Storage Tank with Different Insulation Thickness in a Small-Scale Hydrogen Liquefier. Fluids 2023, 8, 239. [Google Scholar] [CrossRef]
- Dehghanghadikolaei, A.; Abdul Halim, B.; Khoshbakhtnejad, E.; Sojoudi, H. Dynamics of a Water Droplet Impacting an Ultrathin Layer of Oil Suspended on a Pool of Water. Fluids 2024, 9, 82. [Google Scholar] [CrossRef]
- Bao, J.S.; Zhao, S.D.; Yin, Y.; Wang, Z.B.; Liu, S.; Ge, S.R. Non-silting transport characteristics of coal slurry in a deep underground fluidization conveying pipeline under the action of a guide vane swirler. Deep Undergr. Sci. Eng. 2025, 1–17. [Google Scholar] [CrossRef]
- Paolillo, G.; Greco, C.S.; Cardone, G.; Astarita, T. A semi-empirical correlation for the swirl number of swirling jets generated by a radial-type swirler. Exp. Therm. Fluid Sci. 2023, 144, 110874. [Google Scholar] [CrossRef]
- Besagni, G.; Varallo, N.; Mereu, R. Computational Fluid Dynamics Modelling of Two-Phase Bubble Columns: A Comprehensive Review. Fluids 2023, 8, 91. [Google Scholar] [CrossRef]
- Li, T.; Yang, T.; Liu, J.; Gao, H.; Ma, H. Study on suspension state stability of coal-based solid waste filling slurry of long-distance pipeline transportation. Coal Sci. Technol. 2025, 53, 444–456. [Google Scholar] [CrossRef]
- Hall, T.D.; Weerasekara, N.S. ARTERRATM ultra-high molecular weight polyethylene: A sustainable solution for slurry pipeline transportation. In Proceedings of the 27th International Conference on Paste, Thickened and Filtered Tailings, Swakopmund, Namibia, 8–10 April 2025; pp. 249–262. [Google Scholar] [CrossRef]


Disclaimer/Publisher’s Note: The statements, opinions and data contained in all publications are solely those of the individual author(s) and contributor(s) and not of MDPI and/or the editor(s). MDPI and/or the editor(s) disclaim responsibility for any injury to people or property resulting from any ideas, methods, instructions or products referred to in the content. |
© 2025 by the authors. Licensee MDPI, Basel, Switzerland. This article is an open access article distributed under the terms and conditions of the Creative Commons Attribution (CC BY) license.