Abstract
This study investigates the hydrodynamic characteristics of supercavitating flows near boundaries through numerical simulations, focusing on the influence of free surfaces and solid walls. A validated numerical framework combining the Realizable k-ε turbulence model with the VOF multiphase approach and Schnerr–Sauer cavitation model is employed to capture complex phase interfaces and turbulent cavitating flows. Systematic validation against existing experimental data and dedicated underwater launch tests confirms the reliability of the methodology. The results demonstrate significant boundary effects on supercavitation dynamics. Near a free surface, the cavity tail deflects away from the interface, whereas it bends toward the wall when in close proximity to a solid boundary. Simultaneous presence of both boundaries causes combined torsional deformation and deflection. The cavity interface exhibits progressive indentation toward the tail, with indentation angle following a power–law relationship to axial position. Boundary interactions create distinct effects: free surfaces suppress cavity elongation, whereas solid walls promote extension, with cavity length remaining bounded within predictable limits. A notable torque reversal phenomenon occurs at
from the cavitator tip, creating positive torque upstream (x < D) and negative torque downstream (x > D).
1. Introduction
Supercavitation involves utilizing cavitation effects to generate a gas or vapor bubble large enough to envelop an object moving through a liquid, significantly reducing hydrodynamic drag and enabling high speeds [1,2]. When a supercavitating object operates near the waterline or seabed, the free surface and nearby walls can substantially influence the formation of the supercavitation bubble, altering the hydrodynamic loads and potentially causing motion instability. Therefore, understanding the effects of the free surface and nearby solid walls on the supercavitation bubble is crucial for designing high-speed supercavitating objects.
Interest in supercavitation research has surged over the past decade, primarily due to its potential to reduce hydrodynamic drag on underwater objects [3,4,5]. However, it is only recently that significant attention has been given to the effects of the free surface on supercavitation. Laiadi [6] derived theoretical solutions for two-dimensional free surface cavity flow past an inclined plate using boundary integral methods [7], showing that capillary waves exist when the Weber number is zero. Subsequently, Anevlavi and Belibassakis [8] proposed an enhanced boundary integral method to study partially cavitating two-dimensional hydrofoils moving beneath the free surface. Given the limitations of theoretical methods in providing detailed flow field information, Xu et al. [9,10,11,12] employed the Split Hopkinson Pressure Bar (SHPB) technique to accelerate projectiles over extremely short durations, investigating the influence of the free surface and solid walls on cavitating flows. Their findings indicated that the cavity becomes shorter and thicker under the influence of the free surface. Jin et al. [13] and Zhi et al. [14] examined the effect of the free surface on the ventilated cavitation process, observing that the interaction of the free surface and supercavity decreases the supercavity length and increases the free surface rise height, a phenomenon also confirmed for high-speed projectiles moving beneath a free surface [15,16]. Erfanian [17] demonstrated that the size of the supercavity near the free surface is influenced by the cavitation number, submersion depth, and Froude number. Wang et al. [18,19], Xu et al. [20], and Li and Lyu [21] studied cavitating flow around a blunt axisymmetric body near the free surface, finding that the supercavity undergoes asymmetric deformation, and the cavity shape, lift coefficient, and drag coefficient of the blunt body vary periodically with wave fluctuations. Zhang et al. [22] highlighted the significant impact of the free surface on the collapse behavior of cavitation bubbles. Collectively, these studies indicate that the free surface significantly influences the generation and evolution of supercavities.
In addition to the free surface, the presence of a solid wall also exerts a significant influence on supercavities. Chen et al. [23] analyzed natural cavitating flows around a 2D wedge in shallow water, finding that the lower surface of the cavity flattens due to the restriction of the solid wall. Kawakami et al. [24] and Karn et al. [25] investigated the flow physics of supercavitating objects in water tunnel experiments, revealing that the blockage effect plays a crucial role in the closure modes of supercavitating bubbles. Shao et al. [26] conducted experiments in water tunnels with different cross-sectional areas to evaluate the boundary influence on supercavitating bubbles. Their results indicated that, at identical Froude numbers and blockage ratios, the total cavity length in smaller tunnels was significantly greater than in larger tunnels. Despite these studies, a systematic investigation of the wall boundary’s influence on supercavities remains lacking.
This study systematically investigates the combined effects of the free surface and solid wall on the generation and evolution of supercavities, as well as their impacts on the hydrodynamic loads of supercavitating objects, using numerical simulation methods. The Realizable k-ε turbulence model [27] is employed to simulate complex cavitating flows, while the VOF multiphase flow model coupled with the Schnerr–Sauer cavitation model [28] captures the phase interface of the supercavity. By examining various configurations of submergence depth (H) and distance (L) between the solid wall and supercavitating object, the study comprehensively reveals the effects of the free surface and solid wall on the morphological characteristics of the supercavity and the associated hydrodynamic loads. These findings provide a theoretical foundation for ensuring stable navigation of underwater objects near both free surfaces and solid boundaries.
The structure of this paper is as follows: Section 2.1 introduces the numerical methods used, and Section 2.2 presents the corresponding verification. Section 3.1 provides a grid independence analysis, while Section 3.2, Section 3.3 and Section 3.4 explore the effects of the free surface and solid wall on the supercavitating bubble and the hydrodynamic loads on the supercavitating object. Finally, Section 4 summarizes the key findings of the study.
2. Numerical Methodology
2.1. Governing Equations
In this study, the dynamics of supercavitating bubbles near free surfaces and solid walls are simulated using the Reynolds-averaged Navier–Stokes (RANS) equations with a homogeneous model.
The governing equations for the multiphase flow field are given by:
where
is the mixture velocity vector,
is the pressure,
is the gravitational acceleration, and
represents the surface tension force. The mixture density
and effective viscosity
are defined as:
where the subscripts
and
denote the liquid and vapor phases, respectively.
represents the volume fraction, satisfying
. The VOF multiphase flow model [29] is employed to track the interface, the transport equation for the vapor volume fraction is given by:
Here, the mass transfer rate
is modeled using the Schnerr–Sauer model [28], which relates the phase transition to the bubble dynamics based on the Rayleigh-Plesset equation [30]. The vapor volume fraction
is related to the bubble radius
and the bubble number density
by:
Consequently, the bubble radius is derived as:
The net mass transfer source term
is decomposed into the evaporation term
(when
) and the condensation term
(when
):
the saturation pressure is set to
.
The Realizable
turbulence model [27] improves predictive accuracy and physical consistency for complex flows through modifications to the dissipation rate equation. The governing equations for this model are:
where
is the component of the velocity vector in the j-th direction; xj is the component of the spatial coordinate vector in the j-th direction;
is the generation of turbulent kinetic energy due to mean velocity gradients;
is the turbulent eddy viscosity;
,
,
,
are model constants.
The numerical model adopts a pressure-based finite-volume method to discretize the governing equations into algebraic form. The resulting system is solved using the pressure-based SIMPLE algorithm, which couples pressure and velocity within the computational domain. The momentum equation is solved using an estimated pressure field
to derive the intermediate velocity field
, as expressed in Equation (13):
where
denotes the central coefficient of the control volume,
represents the neighboring coefficients of the control volume,
and
are the intermediate velocity components at the central node and neighboring nodes, respectively,
is the estimated pressure gradient at the central node, and
is the source term of the momentum equation.
The pressure correction equation is given by:
where the source term
is defined in Equation (14):
Here,
is the area vector of the control volume face,
and
are the fluid densities at the current iteration and the previous time step, respectively. Subsequently, the velocity field is updated using the solved pressure correction value, as shown in Equation (15):
where
is the velocity correction coefficient, which is related to the grid geometry and the coefficients of the momentum equation.
Finally, the corrected pressure field is obtained via Equation (16):
where
is the pressure under-relaxation factor, typically ranging from 0.1 to 1.0.
For the spatial discretization of convection terms in transport equations, the second-order upwind scheme is adopted. For a generic scalar
, the value at a cell face
is reconstructed based on the upstream cell information, as given in Equation (17):
where
is the scalar value at the upwind cell center, and
is the position vector from the upwind cell center to the face center.
2.2. Validations
To validate the present numerical methods, we first simulate the supercavitating flow around a cone cavitator with a base diameter of
and a free-stream velocity of
. The supercavitating bubble shapes obtained from the present numerical methods agree well with the experimental observations [31], as shown in Figure 1. The maximum length and diameter of the supercavitation bubble obtained by the present numerical methods are
and
, respectively, which show good agreement with the experimental values (maximum length
and maximum diameter
). The hydrodynamic drag is presented in Figure 2, showing that the stable value is approximately
, close to the experimental value.
Figure 1.
Comparison of supercavitating bubble between the present numerical results (top) and the experimental observations (bottom) with flow velocity
.
Figure 2.
Hydrodynamic drag on the supercavitating object at 37 m/s.
To further validate the present numerical methods, we conduct an underwater launching experiment in a cylindrical water tank, as shown in Figure 3a. The dynamics of the supercavitating bubble were imaged through the observation windows with a Photron FASTCAM SA-Z high-speed camera (Tokyo, Japan)at a frame rate of 60,000 fps. as shown in Figure 3b. Figure 3c displays the detailed underwater launching system. The structure of the supercavitating object adopted in the experiments is given in Figure 4, where the diameter
. Figure 5 presents a comparison of the supercavitating bubbles between experimental observations and the present numerical results when the supercavitating object moves at a speed of
. It can be found that the shape of the supercavitating bubble shows good agreement with the experimental results.
Figure 3.
Experimental setup for underwater launching. (a) Cylindrical water tank. (b) High-speed photography. (c) Detailed schematic of the underwater launching system.
Figure 4.
Structural parameters of the supercavitating objects.
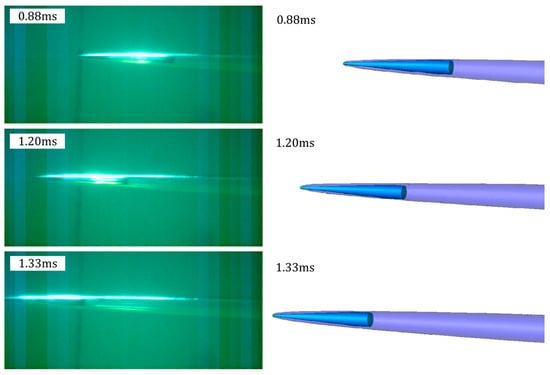
Figure 5.
Comparison of experimental and numerical results for the supercavitating object moving at
.
In summary, it can be concluded that the present numerical method can effectively simulate the supercavitation problem.
3. Numerical Results and Discussion
This section investigates the influence of free surface and solid wall boundaries on supercavitating bubble formation/evolution and associated hydrodynamic loads using numerical simulations.
3.1. Grid Independence Verification
The specific dimensions of the computational domain and supercavitating object adopted in the present study are illustrated in Figure 6. The supercavitating object features a cylindrical configuration with a conical cavitator, which is analogous to the model utilized in Javadpour’s experiment [31]. The length of the cylindrical section is
, while the conical nose has a diameter of
and a cone angle of
. The computational domain extends
in length,
in width, and
in depth. The initial quiescent free surface is positioned at
, with the supercavitating object submerged at a depth
below the free surface. The distance between the axis of the supercavitating object and the side wall is defined as
. The effects of the free surface and a solid wall on supercavitating bubble dynamics are studied by parametrically varying the submerged depth
and wall distance
from
to
.
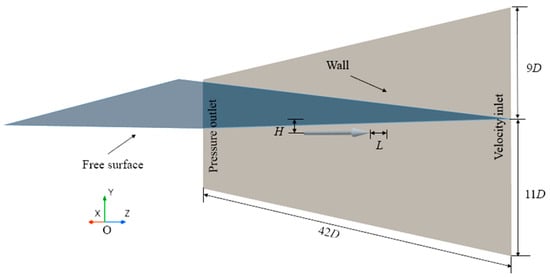
Figure 6.
Computational domain schematic.
Regarding boundary conditions: a velocity inlet is imposed on the right side of the domain, a pressure outlet is specified on the left side, wall boundary conditions are applied to the wall surfaces, and non-reflective boundary conditions are assigned to the remaining boundaries. The origin of the coordinate system is set at the head of the cavitator.
A grid independence study was first performed under the conditions of an inlet velocity of
,
, and
. Given the need for high mesh resolution in the regions adjacent to the supercavitating object, three mesh configurations were constructed with total cell counts of 1.30 million, 1.74 million, and 2.25 million, respectively. The corresponding dimensionless minimum grid spacings are
,
, and
, where
represents the minimum grid spacing at the wall and the cavitator diameter is
(Figure 7). To adequately resolve the near-wall gradient, a boundary layer mesh consisting of ten prismatic layers was generated on the wall surface. The first-layer height was set to yield a
value near 30, thereby satisfying the standard requirement for employing high-Reynolds-number wall functions.
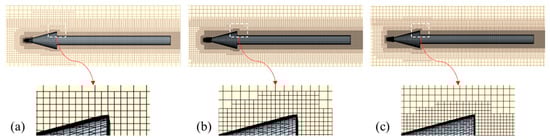
Figure 7.
Refined meshes adjacent to the supercavitating objects. (a) Total cells: 1.30 million
, (b) Total cells: 1.74 million
and (c) Total cells: 2.25 million
.
Figure 8 presents the profiles of the supercavity interface. It can be observed that the supercavity tail deflects downward away from the free surface while approaching the solid wall. Furthermore, the results obtained from the three mesh configurations exhibit good agreement with one another. To optimize computational efficiency while ensuring numerical accuracy, the mesh configuration with
was selected for all subsequent simulations.
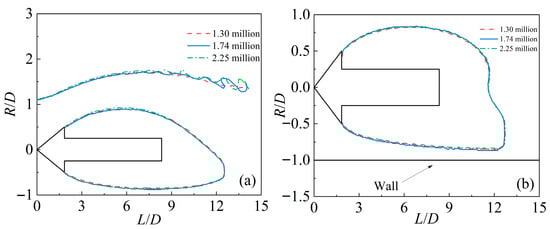
Figure 8.
Supercavity interface profiles
in cross-sections (a) xOy and (b) xOz for different mesh resolutions.
3.2. Effects of the Free Surface and Solid Wall on Supercavitation Dynamics
In this section, the characteristics of supercavitation near the free surface and solid wall are analyzed in detail. Figure 9a illustrates the evolution of the supercavity and free surface. At
, incipient cavitation bubbles emerge on the conical and behind the cylindrical sections of the underwater object. As the supercavity further develops, the free surface above it becomes slightly elevated compared to the undisturbed free surface
. Subsequently, the supercavity expands rapidly toward the object’s rear, significantly lifting the overlying free surface; moreover, it is noteworthy that the supercavity tail begins to deflect away from the free surface
. With the continued development of the supercavity, the deflection of its tail away from the free surface becomes more pronounced, accompanied by intensified free surface breaking above the tail region .
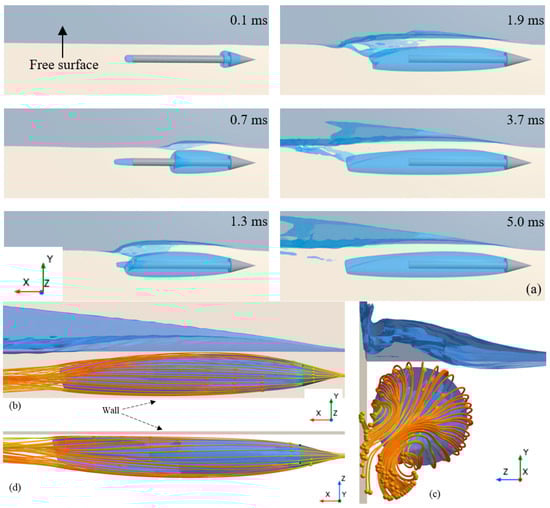
Figure 9.
Supercavitating bubble and streamline under the influence of the free surface and solid wall. (a) Evolution of the supercavitating bubble (α = 0.5). (b–d) Streamline distributions in various views.
As observed in Figure 9b, the streamlines diverge when flowing over the conical cavitator. They then extend along the supercavity interface toward its rear, eventually converging at the tail. Under the influence of the free surface, the streamlines deflect away from the interface, simultaneously causing the tail of the supercavity to bend away from the free surface. Interestingly, Figure 9d reveals that the streamlines tend to pull the supercavity tail toward the solid wall. Consequently, under the combined effect of the free surface and solid wall, the supercavity tail undergoes torsional deformation and deflects obliquely downward when the supercavity shape stabilizes, as depicted in Figure 9c.
Figure 10 further compares the individual effects of the free surface and solid wall on supercavity morphology. As depicted in Figure 10a, when a supercavitating object moves close to a free surface, the streamlines deflect away from the interface, causing the tail of the supercavity to bend away from the free surface. In the region where streamlines converge, a portion of the supercavity tail detaches and propagates obliquely downstream. In contrast, Figure 10b shows that when the supercavitating object travels near a solid wall, the streamlines converge toward the boundary, drawing the supercavity tail closer to the wall.
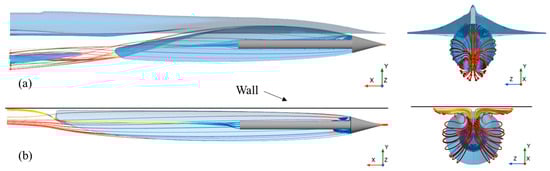
Figure 10.
Comparison of the free surface (a) and solid wall (b) effects on supercavity tail deflection from different perspectives.
As further observed from Figure 10, the supercavity length near the solid wall is significantly greater than that near the free surface. This phenomenon can be attributed to the following mechanisms: the free surface undergoes significant disturbance, which converts a portion of the incoming flow’s kinetic energy into the free surface’s potential energy, thereby leading to a substantial reduction in supercavity length. Conversely, for the supercavitating object moving near the solid wall, as the incoming flow passes through the gap between the solid wall and the supercavity, the solid wall significantly accelerates the flow velocity. This enhanced flow velocity effectively promotes the extension of the supercavity, resulting in a marked increase in its total length.
Given the significant impacts of the free surface and solid wall on the supercavity, a quantitative analysis of the supercavity length under the combined influence of these two factors is subsequently performed. As illustrated in Figure 11, for a specified normalized wall distance
, the normalized supercavity length
increases approximately linearly with the normalized submergence depth
. Conversely, for a fixed
,
decreases as
increases.
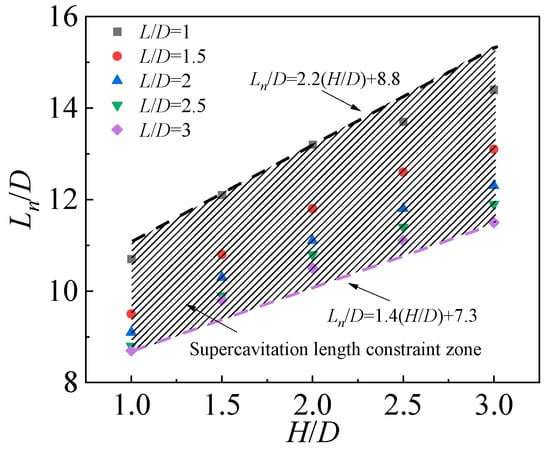
Figure 11.
Normalized supercavity length under the combined effects of the free surface and solid wall.
Taking the cases corresponding to the longest and shortest supercavities as the upper and lower bounds, respectively, a bounded region representing the supercavity length under the combined effects of the free surface and solid wall is defined, as indicated by the shaded area in Figure 11.
The upper bound of the normalized supercavity length is expressed as:
The lower bound is given by:
Note that the expression of the upper boundary line is derived from the supercavity length
corresponding to
and
, while that of the lower boundary line is obtained from
corresponding to
and
. Consequently, the applicable range of Equations (18) and (19) is
; outside this range, non-negligible errors may arise.
In summary, the greater the distance between the object and the free surface, the weaker the free surface’s inhibitory effect, resulting in a longer supercavity. In contrast, increasing the distance between the object and the solid wall weakens the wall’s promotional effect, leading to a shorter supercavity. Under the combined action of the two boundary conditions, the free surface suppresses the supercavity’s expansion, while the solid wall enhances its elongation. Consequently, a bounded region for the supercavity length has been delineated, which enables rapid estimation of the supercavity length under specified
and
conditions.
3.3. Analysis of Morphological Characteristics of the Supercavity Tail
Under the combined effects of the free surface and solid wall, the supercavity tail undergoes deflection, indentation, and torsional deformation, as illustrated in Figure 9a. To investigate the combined influences of these two boundary conditions on the morphological characteristics of the supercavity tail, five equally spaced cross-sections were arranged at
,
,
,
and
along the tail region (Figure 12). Here,
corresponds to the tip of the cavitator, and the positive
-axis direction points toward the tail of the supercavitating object.
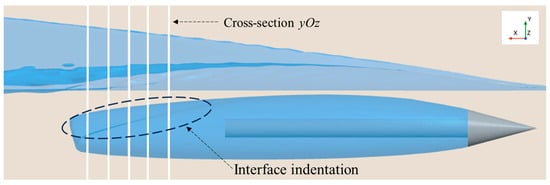
Figure 12.
Schematic of selected cross-sections at the supercavity tail (,
,
,
,
), where
corresponds to the cavitator tip, and the positive
-axis points toward the tail of the supercavitating object.
Figure 13 presents the supercavity tail morphologies at each selected cross-section. It can be observed that the supercavity tail exhibits distinct configurations across the cross-sections at different axial positions. Specifically, the supercavity has a circular profile at
; at
, the cavitation interface beneath the free surface initiates deformation, accompanied by an inward indentation. As the cross-sectional position progresses from
to
, the indentation angle
decreases from
to
. Furthermore, the direction of the inward indentation on the supercavity interface shifts as the cross-section moves toward the tail. These observations indicate that under the combined effects of the free surface and solid wall, the supercavity tail undergoes increasingly significant indentation toward its terminal end.
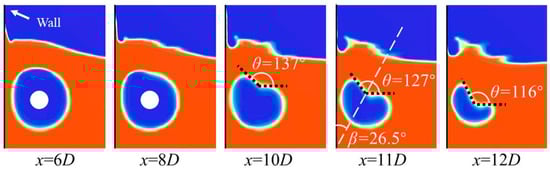
Figure 13.
Volume fraction
at the cross-sections
,
,
,
, and
with the initial conditions
and
.
To quantify the supercavity tail deformation, the indentation angle
was measured at each cross-section. Additionally,
is defined as the included angle between the midline of the indentation at the supercavity tail and the solid wall, which serves to quantify the torsional deformation of the supercavity. Specific definitions of these parameters are illustrated in Figure 13.
As both
(normalized submergence depth) and
(normalized wall distance) increase, the influences of the free surface and solid wall on the supercavity shape gradually diminish. Consequently, the indentation angle
increases toward
, approaching the cross-sectional profile of an undisturbed circle. At this limit, the indentation effectively vanishes. Figure 14 summarizes the indentation angle
at the supercavity tail. It can be observed that for a specific value of
,
exhibits a strong negative correlation with the axial position
, and this relationship follows a power function. For instance, when
, the fitting result is
; when
, it conforms to
and when
, the fitted power function is
.
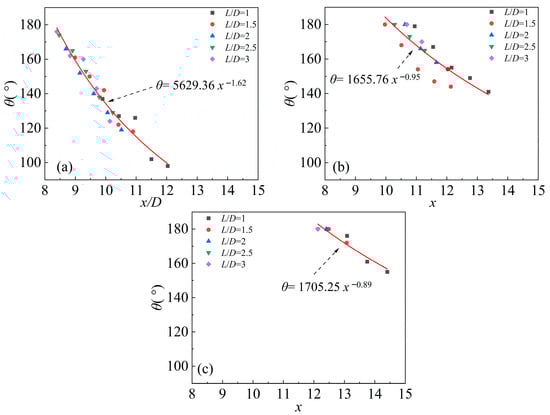
Figure 14.
Indentation angle
at the supercavity tail for (a)
, (b)
, and (c)
.
Notably, a larger indentation angle
indicates a weaker indentation on the supercavity interface. As
or
increases, the regulatory effects of the free surface and solid wall gradually weaken, and the supercavity tail adopts a flat or circular profile with no apparent indentation. As illustrated in Figure 14, with the increase of
, the range of axial positions where indentation (characterized by
) occurs is significantly reduced. These results demonstrate that the free surface plays a dominant role in inducing the inward indentation at the supercavity tail.
The torsional angle
quantifies the extent of torsional deformation at the supercavity tail: a larger
indicates a more significant torsional deformation. As illustrated in Figure 15,
increases with the normalized submergence depth
; notably, the growth rate of
with
increases as the normalized wall distance
increases. When
,
approaches 0 and remains nearly constant with further increases in
. For a specific value of
,
decreases as
increases. These results lead to the conclusion that the free surface inhibits torsional deformation at the supercavity tail, while the solid wall promotes this torsional behavior.
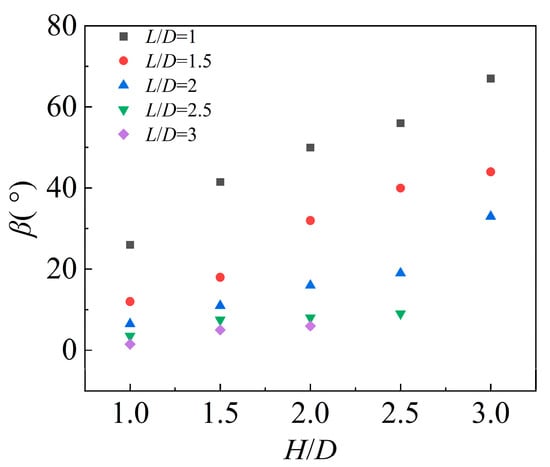
Figure 15.
Summary of the torsional angle
at the supercavity tail.
3.4. Analysis of Hydrodynamic Loads on the Supercavitating Object
To further clarify the combined effects of the free surface and solid wall on the hydrodynamic loads acting on the supercavitating object, the lift
, drag
, and torque
exerted on the object are subsequently investigated. For the sake of comparison, we define the lift coefficient
, drag coefficient
, and torque coefficient
as follows:
where
is the inlet velocity,
denotes the base area of the cavitator and
refers to the total length of the supercavitating object. The torque
at an arbitrary point on the object is obtained by integration:
where
represents the pressure force acting on a surface element, and
is the vector from the reference location to that element. Figure 16 shows the torque exerted by pressure on an arbitrary surface element of the supercavitating vehicle about the reference location
. Here,
corresponds to the cavitator tip, and the axial coordinate is normalized as
(the same convention applies in the following).
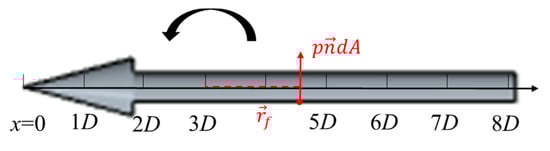
Figure 16.
Torque exerted by the pressure on an arbitrary surface element of the supercavitating object about the reference location
.
Figure 17 presents the lift coefficient
of the supercavitating object. For a specific wall distance
, the lift coefficient decreases with increasing submergence depth
, indicating that a greater submergence depth (i.e., increased distance from the free surface) leads to a reduction in lift. However, when
is large,
varies only slightly with further increases in
. For smaller
values,
decreases rapidly as
increases: the maximum lift coefficient
occurs at
and
, whereas
decreases to a much smaller value
when
and
.
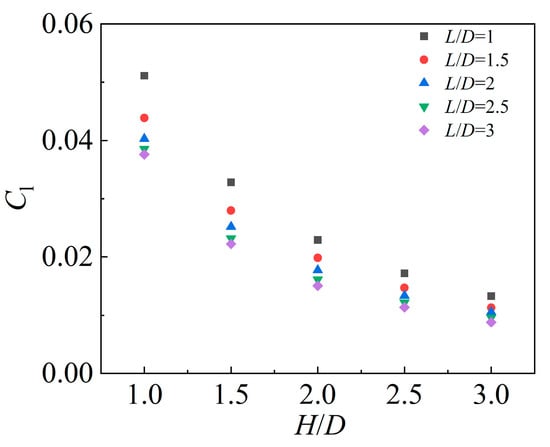
Figure 17.
Lift coefficient of the supercavitating object.
In summary, under the combined action of the free surface and solid wall, increasing either the normalized wall distance
or the normalized submergence depth
results in a decrease in the lift coefficient. This demonstrates that the proximity of either the solid wall or the free surface enhances the hydrodynamic lift force acting on the supercavitating object.
Figure 18 presents the drag coefficient
exerted on the supercavitating object. For a specific wall distance
,
increases with the submergence depth
: when
is small (e.g.,
), the drag coefficient is relatively low; when
is large (e.g.,
),
reaches a relatively high value. In contrast, for a specific value of
,
decreases as
increases. Consequently, the maximum drag coefficient
occurs at
and
, whereas the minimum
is observed at
and
—representing a reduction of approximately 11.8% compared to the maximum value. Additionally, it is noteworthy that
remains consistently higher than that of the supercavitating object in open water, regardless of the
and
values.
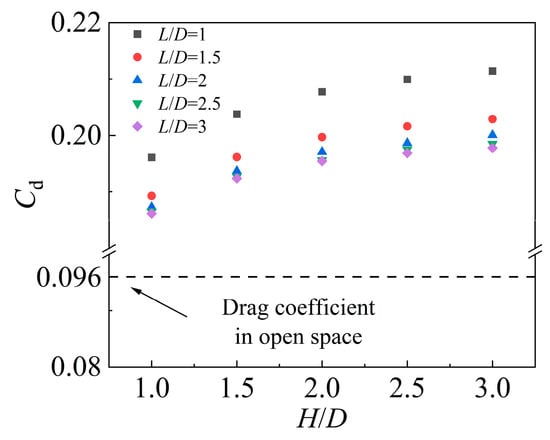
Figure 18.
Drag coefficient of the supercavitating object.
In summary, increasing
leads to an increase in
, while increasing
results in a decrease in
. This demonstrates that the proximity of the solid wall enhances the hydrodynamic drag force acting on the supercavitating object, whereas the presence of the free surface tends to reduce it. However, the combined effect of the free surface and solid wall ultimately increases the hydrodynamic drag compared to the supercavitating object in the open space.
Figure 19 presents the axial distribution of the torque coefficient
along the supercavitating object (Figure 19c) under the combined effects of the free surface and nearby solid wall. It can be observed that for all test cases,
decreases from a positive value to a negative value along the
-axis. Specifically, for smaller normalized submergence depths (e.g.,
),
decreases more rapidly with increasing
; in contrast, for larger
(e.g.,
), the decreasing rate is significantly slower. Another key observation is that
consistently at
:
is positive for
and negative for
.
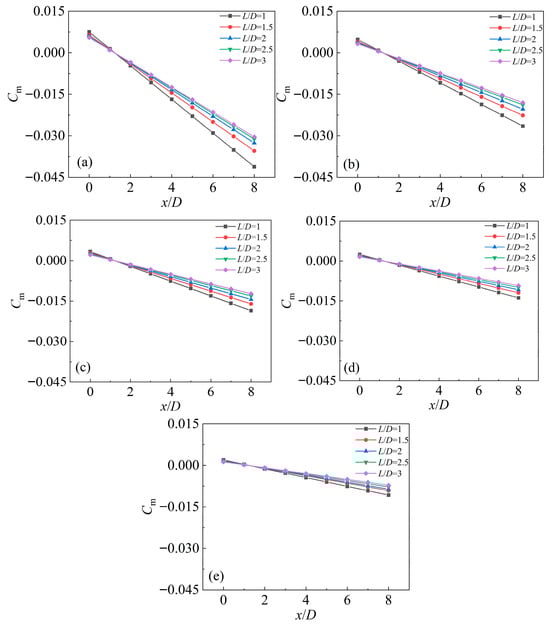
Figure 19.
Axial distribution of the torque coefficient (|Cₘ|) along the supercavitating object for (a)
, (b)
, (c)
, (d)
and (e)
.
The zero-torque point
corresponds to the line of action of the resultant hydrodynamic force on the supercavitating object. With positive torque to the left of this point and negative torque to the right, it can be concluded that the resultant force acts upward. This is consistent with the positive lift force observed in Figure 17. The absolute value of the torque coefficient
characterizes the magnitude of the lift force: as shown in Figure 19,
is relatively large at
, indicating a larger lift force. As
increases,
decreases continuously, implying a corresponding reduction in lift. For a specific value of
, the normalized wall distance
has a limited effect on the torque distribution—particularly for
.
In summary, the free surface exerts a more significant influence on the torque and lift forces of the supercavitating object than the solid wall.
4. Conclusions
A systematic numerical study was conducted to investigate the characteristics of supercavitating flow under the combined effects of the free surface and solid wall. First, the proposed numerical method was systematically validated against existing supercavitation experiments and custom-designed underwater launch tests. Subsequently, the formation and evolution of supercavitation under these boundary conditions were comprehensively analyzed, followed by a quantitative investigation of the asymmetric deflection characteristics of the supercavity tail. Finally, the hydrodynamic loads acting on the supercavitating object were systematically evaluated. The key conclusions drawn from this research are as follows:
- (1)
- The free surface and solid wall exert significant influences on the morphology of the supercavity tail. Their presence alters the incoming flow direction: when the supercavitating object approaches the free surface, the tail of the supercavity deflects away from the interface; conversely, near a solid wall, it bends toward the boundary; under the simultaneous action of both boundaries, the supercavity tail undergoes torsional deformation accompanied by deflection.
- (2)
- The free surface and solid wall modify the flow velocity around the supercavity, leading to variations in supercavity length. Specifically, the free surface suppresses supercavity expansion, while the solid wall promotes its elongation. The normalized supercavity length is consistently distributed within a bounded region, with the upper boundary described by and the lower boundary by .
- (3)
- Based on the variation characteristics of the indentation angle and torsional angle of the supercavity tail, the free surface is identified as the dominant factor inducing inward indentation. Additionally, the free surface inhibits torsional deformation of the supercavity tail, whereas the solid wall promotes this behavior. The supercavity interface exhibits increasing indentation toward the tail, and shows a strong negative correlation with the axial position , which can be well-described by a power function.
- (4)
- The free surface and solid wall also significantly affect the lift, drag, and torque acting on the supercavitating object. Proximity to either the solid wall or free surface enhances the hydrodynamic lift. For drag, the solid wall increases the force magnitude, while the free surface tends to reduce it; however, compared to open water conditions, the combined action of both boundaries ultimately increases both lift and drag. A critical observation is that the torque coefficient is consistently zero at : positive for and negative for .
The findings of this work provide quantitative insights into supercavitating flow under complex boundary conditions, offering valuable references for the effective control of supercavitating flow and the improvement of motion stability for supercavitating objects.
Author Contributions
Conceptualization, X.Y.; methodology, X.Y.; software, X.Y.; validation, X.Y. and Y.H.; formal analysis, X.Y.; investigation, X.Y.; resources, X.Y.; data curation, X.Y. and M.W.; writing—original draft preparation, X.Y. and M.W.; writing—review and editing, X.Y.; visualization, M.W.; supervision, X.Y., P.W., W.L. and S.S.; project administration, X.Y.; funding acquisition, X.Y., P.W. and Y.H. All authors have read and agreed to the published version of the manuscript.
Funding
This research was funded by Hubei Provincial Natural Science Foundation of China (Grants No. 2024AFB400), National Natural Science Foundation of China (Grants No. 12502334), Natural Science Foundation of Jiangsu Province (Grants No. BK20250729), and Natural Science Foundation of the Jiangsu Higher Education Institutions of China (Grant No. 25KJB170015).
Institutional Review Board Statement
Not applicable.
Informed Consent Statement
Not applicable.
Data Availability Statement
The data presented in this study are available on request from the corresponding author.
Conflicts of Interest
The authors declare no conflicts of interest.
References
- Young, Y.L.; Valles, Z.; Di Napoli, I.; Montero, F.M.; Minerva, L.F.; Harwood, C. Wave effects on the hydroelastic response of a surface-piercing hydrofoil. Part 2. Cavitating and ventilating flows. J. Fluid Mech. 2023, 965, A3. [Google Scholar] [CrossRef]
- Ceccio, S.L. Friction Drag Reduction of External Flows with Bubble and Gas Injection. Annu. Rev. Fluid Mech. 2010, 42, 183–203. [Google Scholar] [CrossRef]
- Xiao, Z.; Wang, J.; Huang, R.; Wang, Y.; Zhi, Y.; Huang, J.; Wang, J. Modulation mechanisms of swept angle on the ventilated flows around surface-piercing hydrofoils. Phys. Fluids 2025, 37, 085193. [Google Scholar] [CrossRef]
- Wang, Y.; Huang, R.; Qiu, R.; Wang, Y.; Du, T. Experimental study on the mechanism of cavitation-induced ventilation. Int. J. Multiph. Flow 2024, 170, 104633. [Google Scholar] [CrossRef]
- Huang, R.; Qiu, R.; Zhi, Y.; Wang, Y. Investigations into the ventilated cavities around a surface-piercing hydrofoil at high Froude numbers. Phys. Fluids 2022, 34, 043304. [Google Scholar] [CrossRef]
- Laiadi, A. The influence of surface tension and gravity on cavitating flow past an inclined plate in a channel. Q. Appl. Math. 2022, 80, 529–548. [Google Scholar] [CrossRef]
- Laiadi, A.; Merzougui, A. Numerical solution of a cavity problem under surface tension effect. Math. Methods Appl. Sci. 2021, 44, 8463–8471. [Google Scholar] [CrossRef]
- Anevlavi, D.; Belibassakis, K.A. Analysis of partially cavitating hydrofoils under the free surface using BEM-based adjoint optimization. Appl. Math. Model. 2022, 112, 415–435. [Google Scholar] [CrossRef]
- Xu, C.; Khoo, B.C. Numerical investigation on the cloud cavitating flow over a Clark Y foil under free surface effect. Ocean Eng. 2022, 266, 112953. [Google Scholar] [CrossRef]
- Xu, C.; Huang, J.; Yu, C.; Wang, Y.; Huang, C.; Khoo, B.C. Free surface and near-wall effects on the cloud cavitating flow over an axisymmetric projectile. Ocean Eng. 2021, 238, 109682. [Google Scholar] [CrossRef]
- Xu, C.; Wang, Y.; Huang, C.; Yu, C.; Huang, J. Cloud Cavitating Flow That Surrounds a Vertical Hydrofoil Near the Free Surface. J. Fluids Eng.-Trans. Asme 2017, 139, 101302. [Google Scholar] [CrossRef]
- Xu, C.; Huang, J.; Wang, Y.; Wu, X.; Huang, C.; Wu, X. Supercavitating flow around high-speed underwater projectile near free surface induced by air entrainment. AIP Adv. 2018, 8, 035016. [Google Scholar] [CrossRef]
- Jin, M.-S.; Ha, C.-T.; Park, W.-G. Numerical study of ventilated cavitating flows with free surface effects. J. Mech. Sci. Technol. 2013, 27, 3683–3691. [Google Scholar] [CrossRef]
- Zhi, Y.; Zhan, J.; Huang, R.; Wang, Y.; Li, N. Numerical Investigation on the Ventilated Supercavity around a Body under Free Surface Effect. J. Mar. Sci. Eng. 2023, 11, 912. [Google Scholar] [CrossRef]
- Zhou, H.; Xiang, M.; Zhao, S.; Zhang, W. Development of a multiphase solver for cavitation flow near free surface. Ocean Eng. 2019, 188, 106236. [Google Scholar] [CrossRef]
- Nguyen, V.-T.; Phan, T.-H.; Duy, T.-N.; Park, W.-G. Unsteady cavitation around submerged and water-exit projectiles under the effect of the free surface: A numerical study. Ocean Eng. 2022, 263, 112368. [Google Scholar] [CrossRef]
- Erfanian, M.-R.; Moltani, A.-A.; Pasandidehfard, M. Numerical investigation of the interaction between a ventilated supercavity and free surface waves at high Froude numbers. Phys. Fluids 2024, 36, 123309. [Google Scholar] [CrossRef]
- Wang, Y.; Chang, X.; Xiaocui, W.; Chenguang, H.; Xianqian, W. Ventilated cloud cavitating flow around a blunt body close to the free surface. Phys. Rev. Fluids 2017, 2, 084303. [Google Scholar] [CrossRef]
- Wang, Y.; Wu, X.; Huang, C.; Wu, X. Unsteady characteristics of cloud cavitating flow near the free surface around an axisymmetric projectile. Int. J. Multiph. Flow 2016, 85, 48–56. [Google Scholar] [CrossRef]
- Xu, C.; Wang, Y.-W.; Huang, C.-G.; Huang, J.; Yu, C. The effect of free surface on cloud cavitating flow around a blunt body. J. Hydrodyn. Ser. B 2017, 29, 979–986. [Google Scholar] [CrossRef]
- Li, D.; Lyu, X. Numerical study on supercavitating flow in free stream with regular waves. Int. J. Nav. Archit. Ocean Eng. 2020, 12, 799–809. [Google Scholar] [CrossRef]
- Zhang, T.; Zhang, A.M.; Zhang, S.; Long, S.; Han, R.; Liu, L.; Ohl, C.-D.; Li, S. Free-surface jetting driven by a cavitating vortex ring. J. Fluid Mech. 2025, 1003, A4. [Google Scholar] [CrossRef]
- Chen, X.; Lu, C.-J.; Li, J.; Chen, Y. Properties of Natural Cavitation Flows Around A 2-D Wedge in Shallow Water. J. Hydrodyn. 2011, 23, 730–736. [Google Scholar] [CrossRef]
- Kawakami, E.; Arndt, R.E.A. Investigation of the Behavior of Ventilated Supercavities. J. Fluids Eng. 2011, 133, 091305. [Google Scholar] [CrossRef]
- Karn, A.; Arndt, R.E.A.; Hong, J. An experimental investigation into supercavity closure mechanisms. J. Fluid Mech. 2016, 789, 259–284. [Google Scholar] [CrossRef]
- Shao, S.; Karn, A.; Ahn, B.-K.; Arndt, R.E.A.; Hong, J. A comparative study of natural and ventilated supercavitation across two closed-wall water tunnel facilities. Exp. Therm. Fluid Sci. 2017, 88, 519–529. [Google Scholar] [CrossRef]
- Wu, P.-C.; Chen, J.-H. Numerical study on cavitating flow due to a hydrofoil near a free surface. J. Ocean Eng. Sci. 2016, 1, 238–245. [Google Scholar] [CrossRef]
- Schnerr, G.H.; Sauer, J. Physical and Numerical Modeling of Unsteady Cavitation Dynamics. In Proceedings of the Fourth International Conference on Multiphase, New Orleans, LA, USA, 27 May–1 June 2001. [Google Scholar]
- Rayleigh, L. On the pressure developed in a liquid during the collapse of a spherical cavity. Philos. Mag. 1917, 34, 221–226. [Google Scholar] [CrossRef]
- Moltani, A.-A.; PasandidehFard, M.; Erfanian, M.R. Experimental and numerical study of free surface effect on the ventilated cavitating flow around a surface vehicle model. Ocean Eng. 2023, 268, 113413. [Google Scholar] [CrossRef]
- Javadpour, M.; Farahat, S.; Ajam, H.; Salari, M.; Nezhad, A.H. An experimental and numerical study of supercavitating flows tric cavitators. J. Theor. Appl. Mech. 2016, 54, 795–810. [Google Scholar] [CrossRef]


Disclaimer/Publisher’s Note: The statements, opinions and data contained in all publications are solely those of the individual author(s) and contributor(s) and not of MDPI and/or the editor(s). MDPI and/or the editor(s) disclaim responsibility for any injury to people or property resulting from any ideas, methods, instructions or products referred to in the content. |
© 2026 by the authors. Licensee MDPI, Basel, Switzerland. This article is an open access article distributed under the terms and conditions of the Creative Commons Attribution (CC BY) license.