Abstract
Large underwater vehicles, designed for multiple cruising speeds, are required to operate under diverse conditions such as full speed, surfacing, diving, and hovering. This demands that the axial flow pumps used in these applications have a broad operational range, typically functioning efficiently from 0.1 times rated flow to 1.5 times rated flow. In the process of adjusting operational conditions, axial flow pumps may experience rotating stall phenomena. Importantly, the presence of tip leakage vortices within the pump markedly influences the internal flow dynamics. To assess the impact of tip leakage vortices on the internal flow field under varied operational states, this study delves into the inherent link between tip leakage vortices and pressure pulsation across three specific scenarios: optimal, critical stall, and deep stall conditions. Analyzing from the perspective of the vorticity transport equation, it is found that the compression–expansion term dictates the core strength of tip leakage vortices, while the viscous dissipation factor determines the frequency of pressure pulsation. With an increase in the core strength of tip leakage vortices, a gradual rise in pressure pulsation is observed; in optimal scenarios, the core of tip leakage vortices progressively shifts toward the interior of the clearance, keeping the pulsation amplitude at each monitoring point within the blade tip clearance at integer multiples of the blade passing frequency. During critical stall and deep stall scenarios, the viscous dissipation effect of tip leakage vortices contributes to the emergence of high-frequency harmonic components within pressure pulsation.
1. Introduction
Serving as critical fluid pressurizing components within the power and cooling systems of underwater crafts and unmanned submersibles, the internal flow dynamics of axial flow pumps significantly affect the performance of these vessels. Given the requirement for large underwater vehicles to operate under a comprehensive spectrum of conditions—ranging from full speed and surfacing to diving and hovering—there is a necessity for axial flow pumps to perform efficiently and reliably across an extensive range of operational conditions, where they may face rotating stall phenomena. Present research in axial flow pump systems has achieved notable advancements, mainly aiming to ensure the pumps’ safe and stable operation under designed conditions and in the presence of rotating stalls [1]. Additionally, the blade tip clearance within axial flow pumps, which allows a portion of the main flow to cross over the blade top into the clearance, results in the formation of tip leakage vortices (TLV). TLVs lead to an uneven pressure distribution at the impeller outlet, diminishing the hydraulic efficiency of the pump and impacting the pump shaft’s power output [2]. Moreover, changes in the blade tip clearance not only affect the intensity of TLV but also significantly alter the distribution of other flow structures, thereby causing unstable pressure pulsations, vibrations, and noise, which in severe cases, could result in system damage [3,4,5].
Research on the flow structure of TLV has been conducted extensively. Kan et al. [6] observed that when the tip leakage flow (TLF) enters the blade tip clearance using the standard k-ε turbulence model, it forms tip separation vortices (TSV), and as it develops, it gradually transforms into TLV. Liu et al. [7] investigated the intensity of pressure pulsation and vortex characteristics across different blade tip clearances in mixed-flow pumps, identifying TLV as falling into four distinct categories: primary, secondary, entangled, and dispersed TLV. Wen et al. [8] and Shu et al. [9], through detailed analysis, identified that the three-dimensional spatiotemporal evolution of TLV can be categorized into splitting, contracting, and merging phases. Furthermore, an increase in blade tip clearance accentuates the TLV near the blade tip and the associated pressure pulsation. Feng et al. [10] discovered that the flow pattern of TLV is largely contingent on the size of the blade tip clearance, significantly affecting the main flow on the suction side of the impeller as the clearance widens. Zhang et al. [11] noted that the trajectory of TLV in axial flow pumps is influenced by operational conditions and blade load, with TLV initiating near the blade’s leading edge under low flow conditions and shifting backward as flow increases. Tran et al. [12] found that TLV manifests under both designed and off-designed conditions, with its vortex intensity markedly rising with increased blade tip clearance. Pogorelov et al. [13] analyzed the structural evolution of TLV, indicating that disturbances caused by the blade tip clearance vortex lead to unstable turbulent wake behavior, thus generating intermittent noise and vibration. Liu et al. [14], focusing on the evolution of TLV in Pump As Turbine (PAT) through vorticity transport equation analysis, concluded that the relative vortex stretching term, associated with the velocity gradient, predominantly governs the TLV’s splitting, stretching, and merging processes.
Regarding the effects of TLV and blade tip clearance on pressure pulsation, Dai et al. [15] conducted unsteady numerical simulations on car engine pumps with various blade tip clearances and found that increasing blade tip clearance leads to a gradual increase in pressure pulsation within the blade and volute, while reducing it at the blade tip. An et al. [16] assessed the impact of blade tip clearance on pressure pulsation using an interaction method, showing that pump efficiency declines and the distribution of pressure pulsation intensity significantly changes with increasing blade tip clearance size. Xiang et al. [17] discovered that the amplitude of pressure pulsation in turbo pumps decreases markedly with larger blade tip clearances, indicating that larger clearances can have a stabilizing effect. Shi et al. [18] observed that an increase in blade tip clearance results in diminished boosting performance of multiphase pumps and shifts the onset of gas-phase TLV backward. Yu et al. [19] analyzed pump performance across different blade tip clearance sizes, noting significant effects on the pump’s external characteristics at high flow rates due to changes in blade tip clearance size. Russell et al. [20] investigated the cavitation mechanism of TLV under varying blade tip clearances and proposed corresponding optimization strategies for clearance width. Yang et al. [21] identified the spiral breakthrough of TLV as a major cause of high-frequency pulsation associated with blade passing frequency (BPF) and isolated vortices. Jia et al. [22] pinpointed the viscous dissipation effect of TLV as the primary source of high-frequency components in pressure fluctuations. Li et al. [23], utilizing the Large Eddy Simulation (LES) turbulence model, analyzed that the frequency of vortices within the blade tip seal cavity encompasses both the impeller rotation frequency and the high frequencies arising from the breakdown of blade tip leakage flow into small-scale vortices. They noted that the unsteady nature of TLF induces complex steam excitation forces that vary over time, and pressure pulsation of TLV increases with greater clearance. Although existing studies have extensively investigated the formation mechanisms and impacts of tip leakage vortex (TLV), there remains a lack of systematic comparison regarding the coupled evolution mechanisms of TLV under different tip clearances and off-design conditions. Current research predominantly focuses on single operational conditions or isolated parameter analyses, failing to fully reveal the interaction effects between tip clearance sizes and operational conditions on TLV behavior and pressure pulsation characteristics. Through multi-condition and multi-parameter comparative analysis, this study aims to elucidate the evolution mechanisms of TLV and pressure pulsation characteristics under the synergistic effects of tip clearance and operational conditions, providing theoretical basis for cross-condition optimal design.
For scenarios involving large gradients and unbalanced flows, general turbulence models may fall short in precision. The Delayed Detached Eddy Simulation (DDES) turbulence model, as employed in this study, enables a more accurate prediction of the pump’s external characteristics with significantly reduced eddy viscosity, greatly benefiting the capture of small-scale vortices. This research concentrates on the transient pressure and vorticity changes within axial flow pumps, employing the DDES turbulence model to meticulously assess and compute the correlation features of TLV and pressure pulsation under optimal, critical stall, and deep stall conditions for three distinct blade tip clearance sizes (0.05%D, 0.15%D, 0.25%D). It delves into the mechanisms of vortex-induced vibration within axial flow pumps, thus offering insights for the optimization of blade tip clearance design, improving pump pressure pulsation characteristics, and boosting pump stability and efficiency.
2. Numerical Simulation
2.1. Axial Flow Pump Model
This study examines an axial flow pump (with a specific speed of , 466) and a pipeline diameter of D = 400 mm. The design parameters include a flow coefficient of Φ = 1.35, a design speed of n = 1000 r/min, and a head coefficient of Ψ= 1.41. The axial flow pump’s design parameters are detailed in Table 1, and its three-dimensional model is illustrated in Figure 1.

Table 1.
Design Parameters for Axial Flow Pumps.
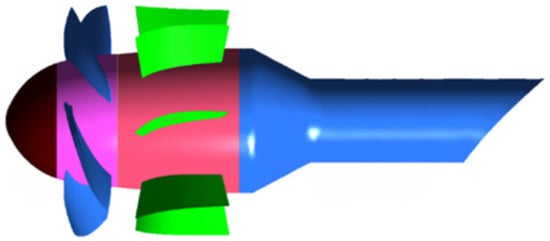
Figure 1.
Axial Flow Pump Structure.
2.2. Mesh Generation and Boundary Conditions
The study utilizes a hexahedral structured mesh for grid division, with the specific division effect shown in Figure 2: employing the O-block method for the impeller and guide vanes and refining the mesh in areas with significant changes in pressure and flow velocity, such as the wall and blade tip clearance, as illustrated in Figure 3, ensuring an average Y plus value of less than 10.
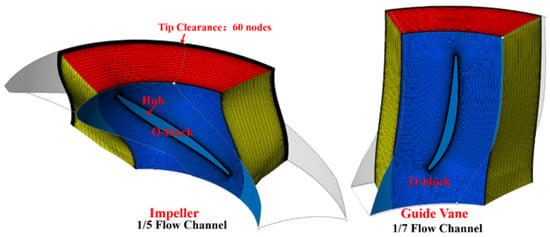
Figure 2.
Axial Flow Pump Grid Structure.
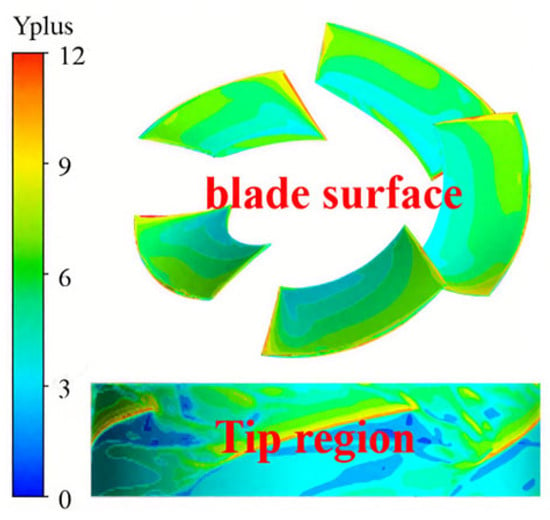
Figure 3.
Distribution of Yplus on the Impeller Wall Surface.
Using Richardson’s [24] extrapolation method and Roache’s [25] Grid Convergence Index (GCI) to estimate the discretization error due to grid scaling in numerical simulations ensures the simulation outcomes are unaffected by grid resolution. As depicted in Figure 4, different grid resolutions were applied to calculate the head coefficient and efficiency. With GCI values under 1%, the discretization error is deemed acceptable. Balancing numerical precision and computational efficiency, the study opts for a grid of 9.89 million cells.
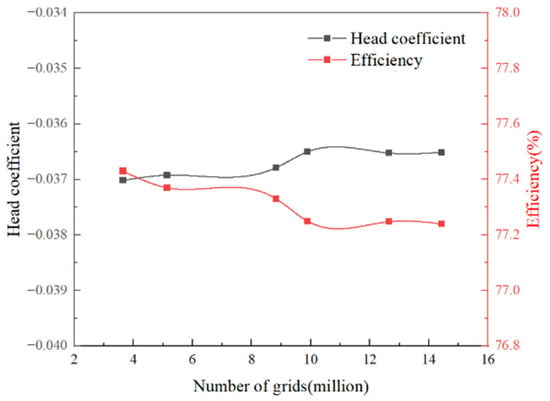
Figure 4.
Grid Independence Verification.
To establish the time step for unsteady computations, the Courant number 1. The chosen time step was 0.00008251 s, aligning with the impeller’s 0.5-degree rotation. In this context, denotes the grid size, the time step, and U the flow velocity.
The simulations utilized the DDES model, setting the inlet boundary condition to a total pressure of 1 atm and a turbulence intensity of 5%; the outlet boundary condition was static fluid pressure, with all wall roughness specified at 0.1 mm. An unsteady time step of 0.0000825 s, corresponding to a 0.5-degree rotation of the impeller, was established to ensure computational convergence. Analysis was conducted on data after the impeller had completed 10 rotations for post-processing.
2.3. Experimental Methodology
The axial flow pump’s operational stability testing setup included a data acquisition system (capturing dynamic pressure, vibration characteristics, and external features), the axial flow pump, valves, a model pump, a water storage tank, and an auxiliary pump. Figure 5 showcases a photograph of the axial flow pump setup. The test medium was water at 25 °C. Pressure was measured with a 0.08% precision pressure transmitter; flow rate with a 0.3% precision electromagnetic flowmeter; and rotational speed with a 0.2% precision tachometer. Pressure pulsation was gauged using a SCYG314 dynamic pressure sensor, capable of measuring within a range of −0.1 to 1 MPa, with 0.25% accuracy, and a 20 kHz response frequency.
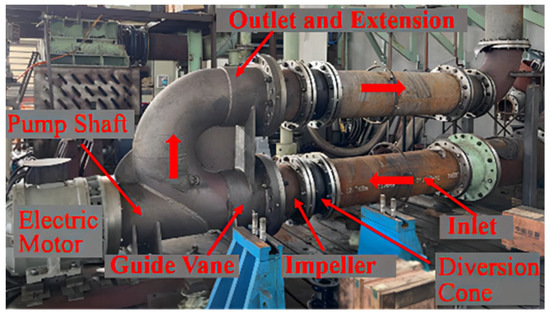
Figure 5.
Axial Flow Pump Physical Diagram.
The study designated six monitoring points: Point1 at the blade tip’s leading edge, Point6 on the pipeline wall, and Point2-Point5 evenly spread within the blade tip clearance. Figure 6 illustrates the layout of the pressure pulsation monitoring points.
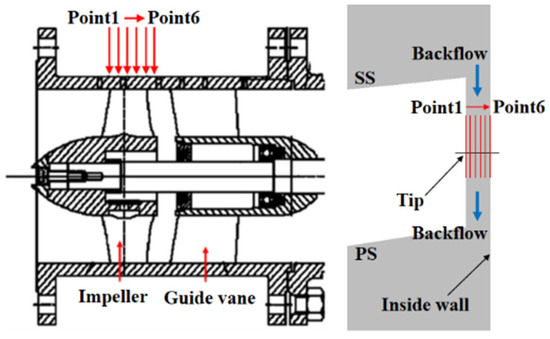
Figure 6.
Pressure Fluctuation Monitoring Points.
3. Numerical Computation Method
3.1. Turbulence Model
The paper adopted the DDES method for the unsteady numerical calculations of the axial flow pump, accounting for the temporal disturbances in the impeller’s rotational axis and flow state. The method’s governing equation is as follows:
where U represents the fluid velocity; is the length scale; is the specific dissipation rate; = 0.85, = 0.5, = 0.856, = 0.31, = 1, and = 0.09 are all fixed coefficients in the DDES model; and are the production terms; P stands for pressure; is the turbulent eddy viscosity; and are the blending functions of the SST model. is defined as:
where and represent the length scales for LES and RANS, respectively; S is the strain rate tensor; is the vorticity tensor; represents the ratio of the turbulent scale to the wall distance. When ≤ 1, = 1, and the LES algorithm is applied in that region; when = 0, the RANS method is employed.
3.2. Vorticity Transport Theory
To delve into how TLV contributes to flow instability within the pump, the study employed the vorticity transport equation [26,27,28]. This approach effectively captures TLV’s core strength and structure while assessing the effects of impeller rotational speed and fluid viscosity on vorticity.
where is the relative vorticity, is the relative velocity, is the angular velocity of the impeller, ρ is the fluid density, and p is the static pressure.
4. Results Analysis
4.1. Validation of Numerical Simulation
All paper Experimental data were processed using nondimensionalization, representing the axial flow pump’s flow coefficient, rotational speed, head coefficient, and efficiency as , n, , and , respectively.
where H is the pump head; and are the inlet and outlet total pressures, respectively; is the density; d is the impeller diameter; n is the rotating speed; and T is the impeller torque.
Figure 7 illustrates that the pump’s flow coefficient and head coefficient increase within the 0.3–0.5 times design operating point range, known as the saddle region [29], where an efficiency spike was observed. The study measured deep stall condition (Φ = 0.78, Ψ = 1.72, η = 43.7%), critical stall condition (Φ = 0.87, Ψ = 1.90, η = 61.2%), and optimal condition (Φ = 1.35, Ψ = 1.41, η = 77.25%) and performed simulations for these scenarios.
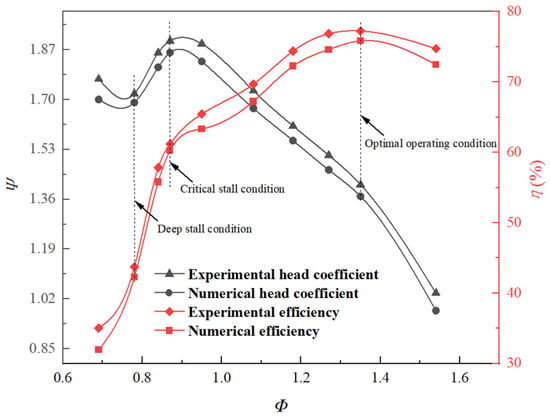
Figure 7.
Performance Chart of Axial Flow Pump Experiment and Numerical Simulation.
As shown in Figure 8, focusing on the monitoring Point 6 (at the central wall of the impeller) and using a clearance size of 0.2 mm for illustration, the comparison between simulation and experimental results of pressure pulsation validated DDES ‘s accuracy. The main frequencies of the experimental and simulated results were 84.1 Hz and 83.3 Hz, respectively, with slight deviations due to variations in actual impeller speed from the rated speed under motor variable speed drive; the main frequency error did not exceed 3.5%. Generally, the experimental and simulated phases and amplitudes of pressure pulsation closely aligned, with minor discrepancies in pressure pulsation details not precisely captured.
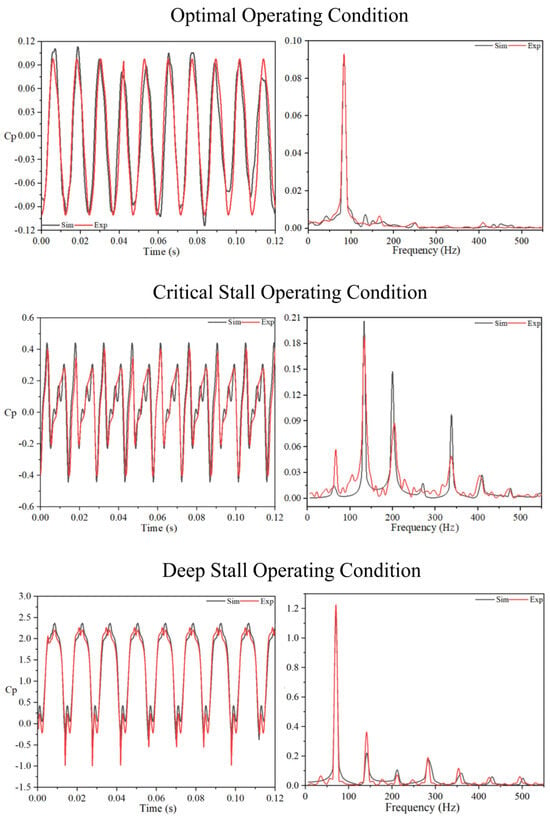
Figure 8.
Verification of Pressure Fluctuations (TC = 0.2 mm).
4.2. Variation Process of TLV at Different Time Points
TLV is a common flow phenomenon in axial-flow fluid machinery. It primarily forms in the gap between the rotating blade tips and the stationary casing. As the fluid passes through this gap, the rotation of the blades induces a swirling vortex structure near the blade tips, which is known as the TLV.
As the blade tip clearance width increases, the TLV fragments into multiple smaller-scale vortices, with their strength varying. Operating the axial flow pump in a rotating stall condition amplifies the impact of increased clearance size on pressure distribution within the blade tip clearance, potentially altering the TLV’s generation frequency.
As shown in Figure 9, a blade passage period is selected as the object of study, with eight time points chosen within a blade passage period, each corresponding to a time when the impeller has rotated by 9°. The moments from Time point1 to Time point3 represent the growth period of the TLV, during which the TLV located at the leading edge and suction side of the blade gradually lengthens. At moment Time point3, the tail of the TLV experiences a swing and breaks at Time point4. At this time, the TLV at the trailing edge of the blade has merged with the vortex in the next passage and has entered the dissipation process of the TLV. At Time Point6 and Time Point7, the merged vortex begins to disappear and is transformed into small-scale vortices, and the TLV enters the process of regeneration.
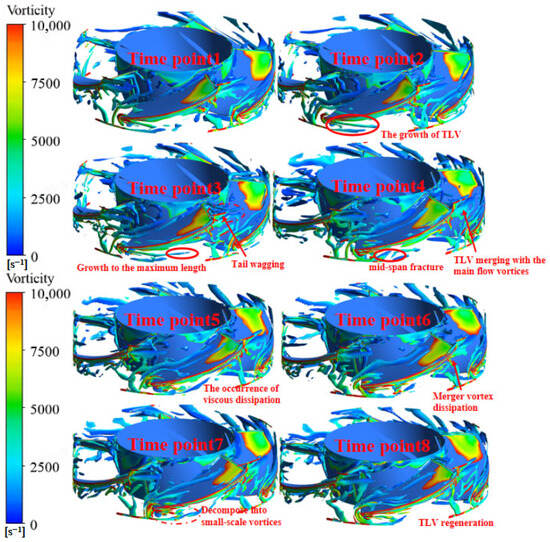
Figure 9.
Evolution of TLV inside the impeller.
4.3. Analysis of the Correlation Between Pressure Fluctuations and Vorticity Fluctuations Under Optimal Operating Condition
Figure 10, Figure 11 and Figure 12 illustrate the temporal changes in pressure and vorticity at various blade tip clearance sizes under optimal conditions. The red line depicts pressure changes, while the black line shows vorticity intensity. At a clearance of TC = 0.05%D, vorticity fluctuations at Point1, near the blade tip, significantly surpass pressure fluctuations, demonstrating the highest amplitude variation and indicating the most complex flow conditions at this point. Point6, on the pipeline’s inner wall, experiences the second-highest amplitude of pressure and vorticity fluctuations. At TC = 0.15%D, the enhancement of the clearance backflow effect leads to increased pressure and vorticity changes at all monitoring points, albeit to varying degrees. Notably, some points within the clearance, such as Point4, undergo extended periods of slight pressure changes, likely a result of the TLV’s viscous dissipation effect. At TC = 0.25%D, XiaoQi Jia et al. [30], observed that axial flow pumps with large blade tip clearances contain multiple counter-rotating vortices within the clearance. Furthermore, as clearance size grows, pressure distribution within the clearance significantly decreases, and backflow intensifies. This results in further increases in the amplitude of pressure and vorticity fluctuations at each monitoring point, with Point3, located at the clearance’s center, exhibiting particularly chaotic pressure fluctuations, indicating the most potent viscous dissipation action of the TLV at this spot.
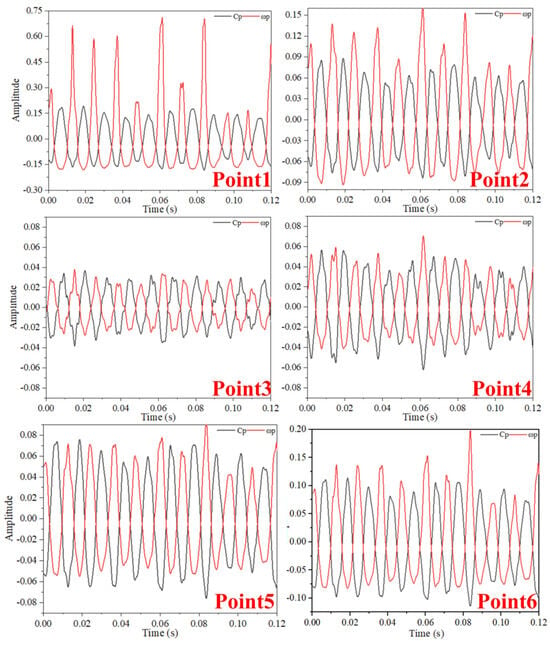
Figure 10.
Time-Domain Diagram of Pressure Fluctuations and Vorticity Fluctuations at TC = 0.05%D (Optimal Operating Condition).
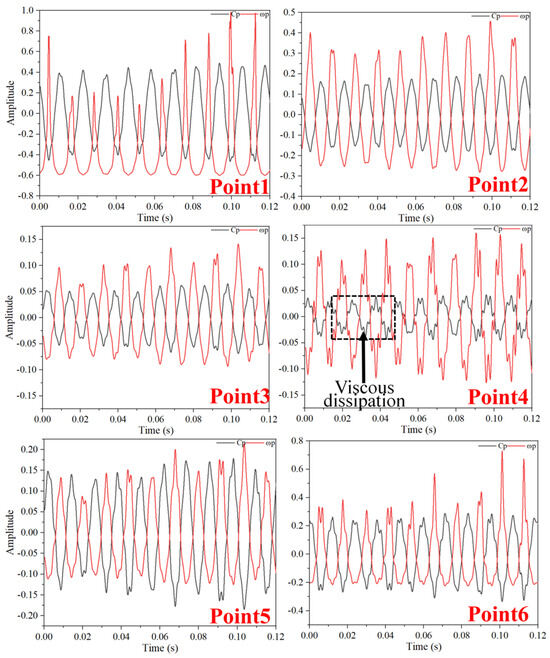
Figure 11.
Time-Domain Diagram of Pressure Fluctuations and Vorticity Fluctuations at TC = 0.15%D (Optimal Operating Condition).
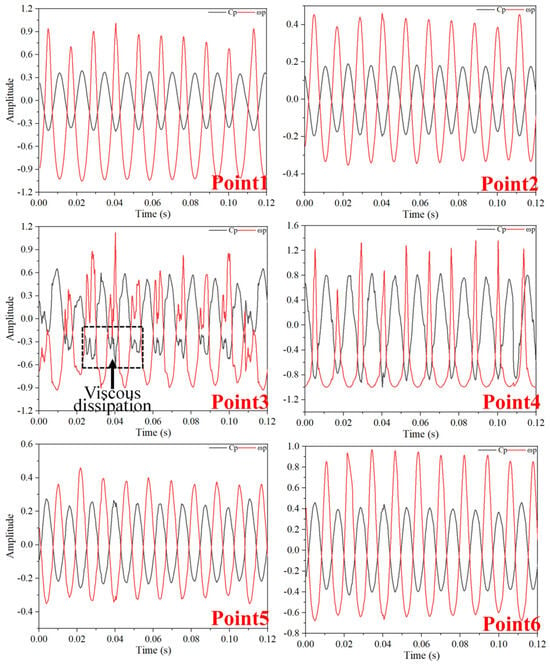
Figure 12.
Time-Domain Diagram of Pressure Fluctuations and Vorticity Fluctuations at TC = 0.25%D (Optimal Operating Condition).
Figure 13 reveals that with larger clearance sizes, the backflow effect within the blade tip clearance becomes more pronounced, gradually creating large-scale vortices that obstruct the flow path. At this juncture, vorticity primarily consists of large-scale TLVs and wake vortices, with the backflow intensity yet to be distinctly evident. Despite notable changes in the amplitude of pressure fluctuations, TLV does not influence the frequency of these fluctuations.
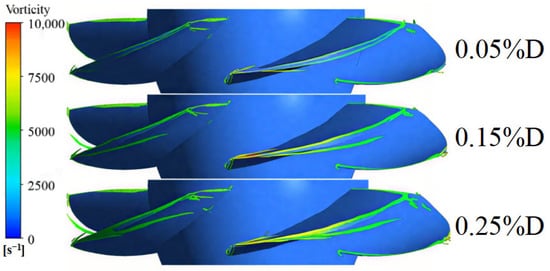
Figure 13.
Vorticity Distribution of the Impeller under Optimal Operating Condition.
Figure 14, Figure 15 and Figure 16 display the frequency-amplitude relationship of pressure and vorticity fluctuations under optimal conditions. At TC = 0.05%D, the primary frequency of pressure and vorticity fluctuations at each monitoring point aligns with the BPF. Given Point1’s proximity to the blade tip, it registers the highest intensity of pressure fluctuation, with vorticity generation shifting to a higher frequency due to vortex viscous dissipation. However, at smaller clearance sizes, backflow in the blade tip region remains weak, with Point3 and Point4 exhibiting low-frequency pressure fluctuations, where pressure and vorticity changes are nearly identical, indicating favorable flow conditions. The impact of the fluid on the pipe’s end wall is significant at small clearances, slightly elevating pressure fluctuations at Point6. At TC = 0.15%D, Point1, Point2, and Point6 exhibit high-frequency vorticity fluctuation components, with frequencies ranging from 150 Hz to 400 Hz, though pressure fluctuations continue to dominate the primary frequency. At TC = 0.25%D, the amplitude of pressure changes at Point1 and Point2 marginally decreases, yet the amplitude of vorticity fluctuations markedly increases. This occurs as the increased clearance size reduces fluid impact on the blade tip, facilitating fluid entry into the clearance and significantly boosting vortex strength. Concurrently, the vortex core concentrates in the clearance center, with Point3 and Point4 experiencing the highest amplitude of pressure pulsations, accompanied by intense dissipation effects, leading to high-frequency pressure and vortex strength fluctuations. Moreover, the fluid’s impact on the pipe’s inner wall remains significant, continuing to cause high-frequency changes in wall vorticity and inducing flow separation.
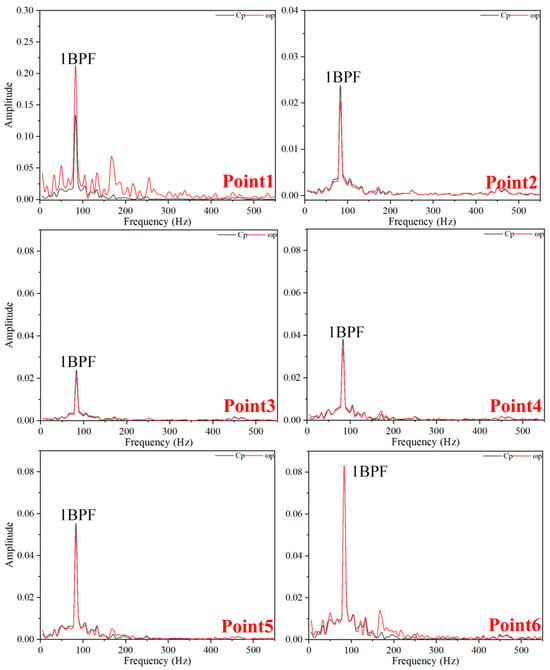
Figure 14.
Frequency-Domain Diagram of Pressure Fluctuations and Vorticity Fluctuations at TC = 0.05%D (Optimal Operating Condition).
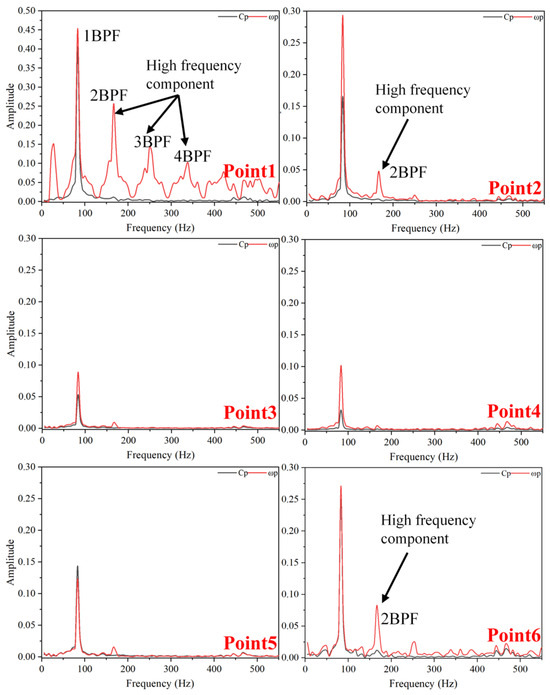
Figure 15.
Frequency-Domain Diagram of Pressure Fluctuations and Vorticity Fluctuations at TC = 0.15%D (Optimal Operating Condition).
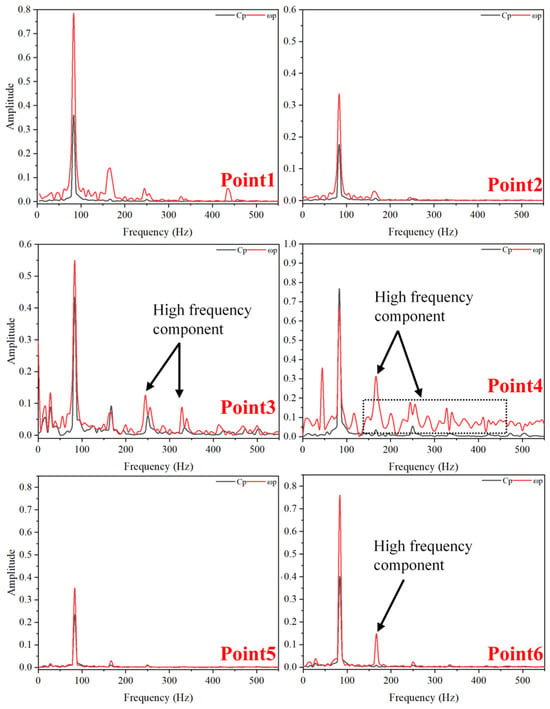
Figure 16.
Frequency-Domain Diagram of Pressure Fluctuations and Vorticity Fluctuations at TC = 0.25%D (Optimal Operating Condition).
4.4. Analysis of the Correlation Between Pressure Fluctuations and Vorticity Fluctuations Under Critical Stall Operating Condition
Figure 17, Figure 18 and Figure 19 showcase the time-domain representations of pressure and vorticity fluctuations under critical stall conditions. In comparison to optimal conditions, all monitoring points register an increase in the amplitude of pressure pulsations and vorticity fluctuations, with some points experiencing faster fluctuation frequencies. The effect of minor pressure fluctuations, attributed to viscous dissipation, becomes more pronounced. At TC = 0.05%D, the influence of TLV’s viscous dissipation leads to high-frequency components in pressure pulsations at points Point1, Point5, and Point6, alongside significant amplitude increases in both pressure pulsations and vorticity fluctuations. During stall conditions, TLVs undergo separation within the blade tip clearance, and the overlapping of two vortices elevates the pressure fluctuation frequency. Consequently, point Point3, positioned between two separated vortices [31], shows a markedly accelerated frequency of pressure fluctuations. At TC = 0.15%D, the phenomenon of TLV dissipation emerges at all monitoring points, except for Point3, lasting for varying periods. Rotating stall conditions precipitate an uneven fluid velocity distribution across each channel, which, when combined with backflow from the blade tip clearance, leads to more frequent cycles in pressure fluctuations at Point3 and Point4 [32]. At TC = 0.25%D, points Point2, Point3, Point4, and Point5 all exhibit slower fluctuation cycles. With an additional increase in clearance size, the clearance center hosts multiple small-scale STLVs, degrading the pressure distribution within the clearance due to the compounded effects of TLV and STLV. Notably, at TC = 0.25%D, the viscous dissipation effect of the TLV gradually fades, with pressure fluctuations in certain areas displaying both high frequency and amplitude.
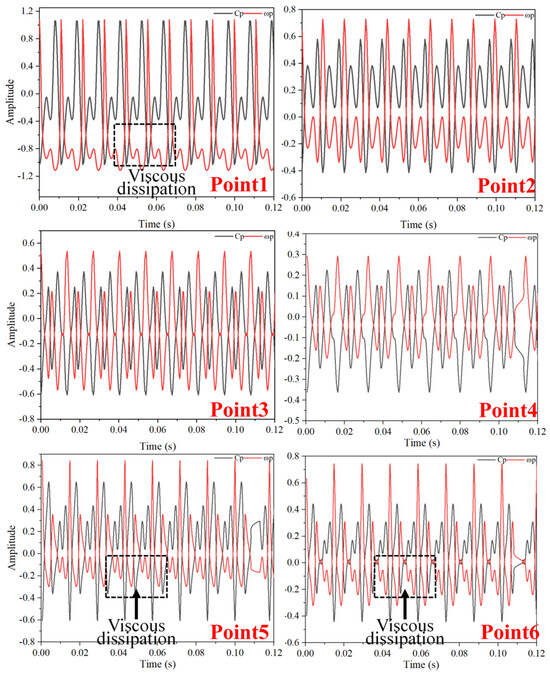
Figure 17.
Time-Domain Diagram of Pressure Fluctuations and Vorticity Fluctuations at TC = 0.05%D (Critical Stall Operating Condition).
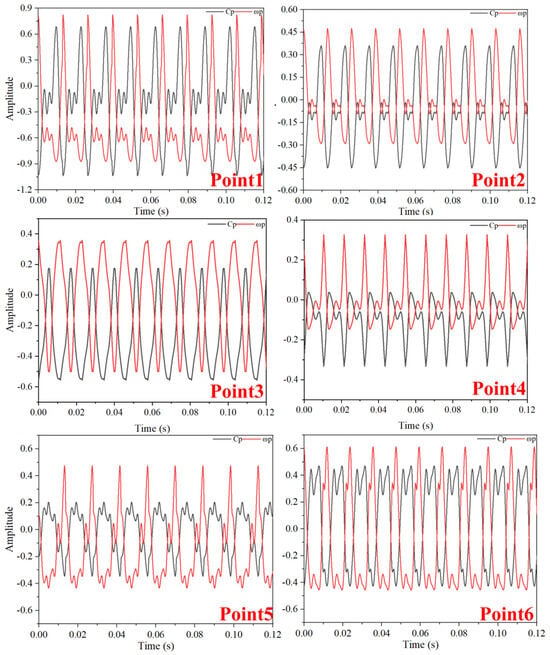
Figure 18.
Time-Domain Diagram of Pressure Fluctuations and Vorticity Fluctuations at TC = 0.15%D (Critical Stall Operating Condition).
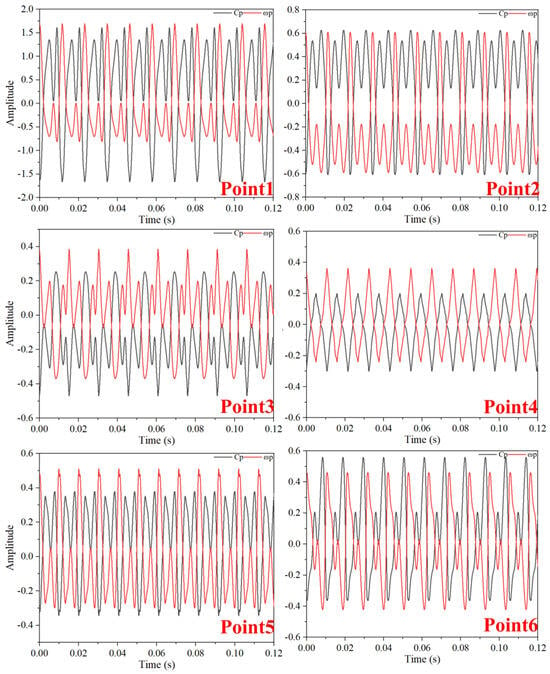
Figure 19.
Time-Domain Diagram of Pressure Fluctuations and Vorticity Fluctuations at TC = 0.25%D (Critical Stall Operating Condition).
As depicted in Figure 20, under critical stall conditions, vorticity primarily consists of large-scale TLVs and channel vortices, accompanied by elevated turbulence kinetic energy. Once the clearance size surpasses 0.15%D, the interplay between TLV and channel vortices induces large-scale recirculation within the impeller channels, obstructing flow. At a blade tip clearance of 0.25%D, TLV intensity reaches its peak, generating large-scale recirculation vortices beneath the impeller. The TLV’s increased incidence angle, a result of backflow in low-flow conditions [22], suggests that a rise in clearance size under these circumstances impedes the pump’s internal flow efficiency. Additionally, a sharp increase in the turbulence kinetic energy of vorticity at the blade’s leading edge diminishes the blade’s operational efficiency and results in fluid slippage at the leading edge.
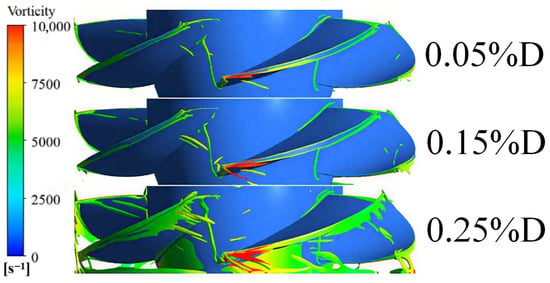
Figure 20.
Vorticity Distribution of the Impeller under Critical Stall Operating Condition.
Figure 21, Figure 22 and Figure 23 illustrate the frequency-domain graphs of pressure and vorticity fluctuations under critical stall conditions. Relative to optimal conditions, there is a notable increase in amplitude at each monitoring point, with the presence of high-frequency components in pressure and vorticity changes becoming increasingly apparent. At TC = 0.05%D, the dominant frequencies of pressure pulsations are at 1BPF and 2BPF. Point1 and Point6, situated at the blade tip and pipeline wall, respectively, record the highest amplitudes. Despite the minimal clearance size, the impact of TLV on the wall is significant, especially at Point6, where the main frequency notably increases (approximately 134 Hz). Point3 and Point4, located mid-clearance, primarily exhibit wall effects under small clearances, with internal backflow not being pronounced. The frequencies at Point2 and Point5, influenced by intense shear flow within the clearance, are challenging to pinpoint but generally remain within 2 BPF. At TC = 0.15%D, the frequency at each monitoring point rises by 7–10% compared to TC = 0.05%D. With increased clearance size, the frequency band between 1 BPF and 2 BPF vanishes, attributed to the mitigated impact of fluid on the wall at larger clearances. TLV dissipation slightly modifies the pressure fluctuation bands at Point2 and Point4, while Point3 sees a significant rise in amplitude, as the TLV core is concentrated near this point. The combined forces of the main impeller stream and leakage flow from the clearance marginally elevate the amplitude at Point6. At TC = 0.25%D, the enlarged clearance size partially balances the energy distribution in the impeller’s mainstream field but exacerbates backflow and increases the scale of leakage vortices within the blade tip clearance. Compared to 0.15%D, the amplitude of pressure changes at Point1 significantly escalates, with the main frequency decreasing from 1.07 BPF to 1.03 BPF. Point2 exhibits minimal amplitude change, suggesting negligible TLV impact on pressure distribution at this location. Significantly, Point3’s frequency distribution undergoes marked changes, with its main frequency escalating from 1.07 BPF to 1.18 BPF, and it exhibits low-frequency, high-amplitude pressure fluctuations. This results from TLV simultaneously shedding and generating at this spot, where vortex core strength is extremely unstable. The increased clearance size further deteriorates the fluid’s impact on the pipeline’s inner wall. Consequently, Point4’s amplitude of pressure fluctuations and its frequency domain slightly reduce, while the amplitude of vorticity changes significantly increases. The main frequencies at Point5 and Point6 decrease, with their corresponding amplitudes rising.
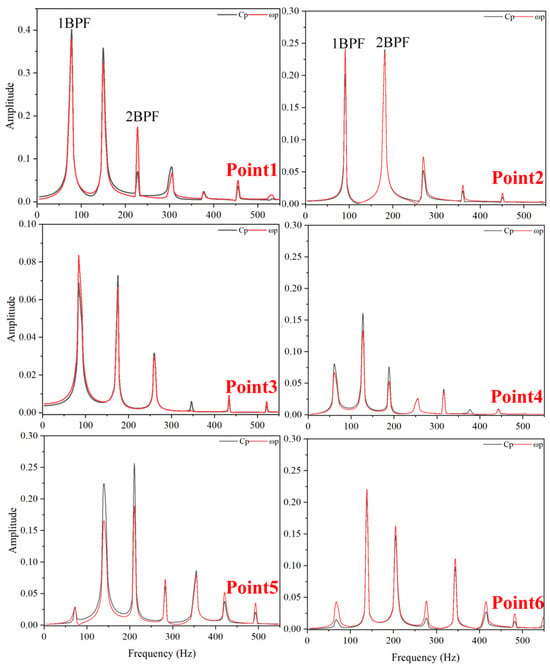
Figure 21.
Frequency-Domain Diagram of Pressure Fluctuations and Vorticity Fluctuations at TC = 0.05%D (Critical Stall Operating Condition).
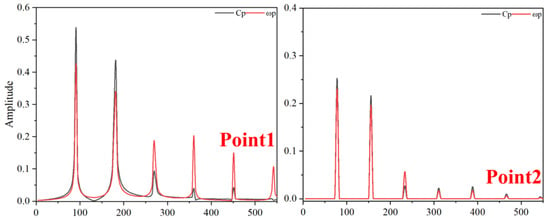
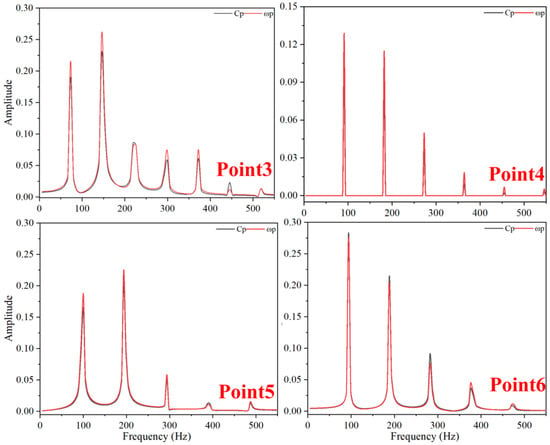
Figure 22.
Frequency-Domain Diagram of Pressure Fluctuations and Vorticity Fluctuations at TC = 0.15%D (Critical Stall Operating Condition).
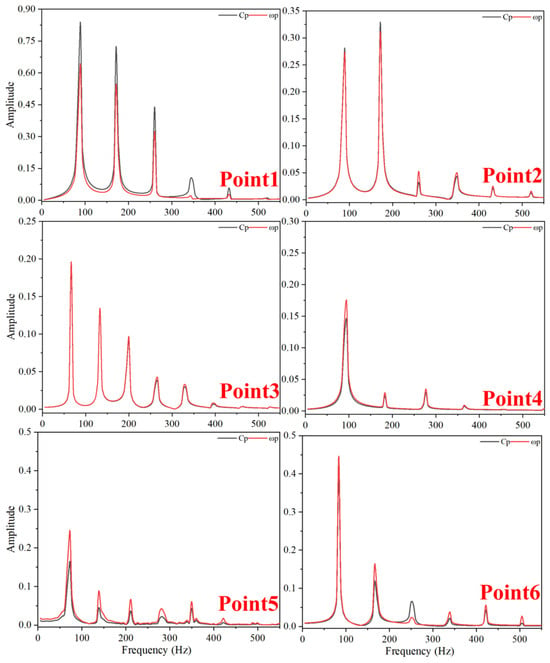
Figure 23.
Frequency-Domain Diagram of Pressure Fluctuations and Vorticity Fluctuations at TC = 0.25%D (Critical Stall Operating Condition).
4.5. Analysis of the Correlation Between Pressure Fluctuations and Vorticity Fluctuations Under Deep Stall Operating Condition
Figure 24, Figure 25 and Figure 26 display pressure and vorticity fluctuations under deep stall conditions, where each monitoring point shows a marked increase in fluctuation amplitude, and the subtle pressure changes caused by TLV dissipation gradually weaken. Additionally, with the changing clearance size in deep stall conditions, there is a significant shift in the turbulent dissipation frequency at each point, leading to considerable variations in fluctuation cycles.
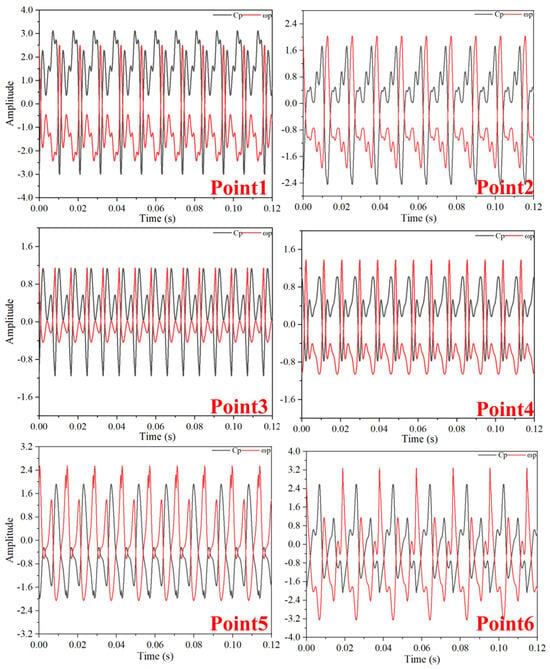
Figure 24.
Time-Domain Diagram of Pressure Fluctuations and Vorticity Fluctuations at TC = 0.05%D (Deep Stall Operating Condition).
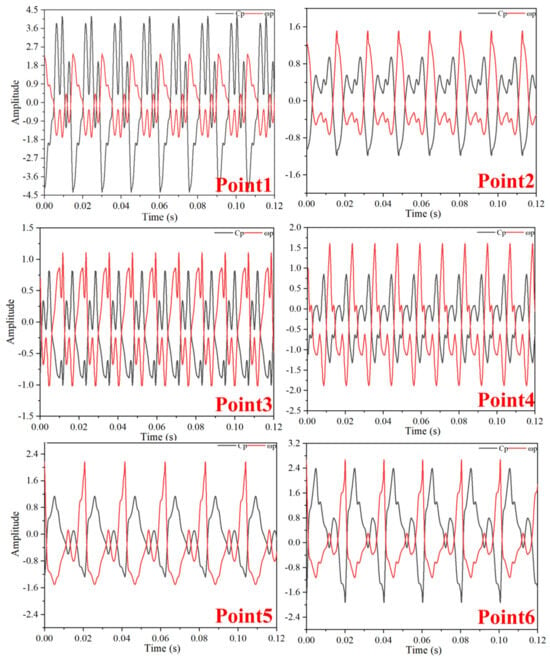
Figure 25.
Time-Domain Diagram of Pressure Fluctuations and Vorticity Fluctuations at TC = 0.15%D (Deep Stall Operating Condition).
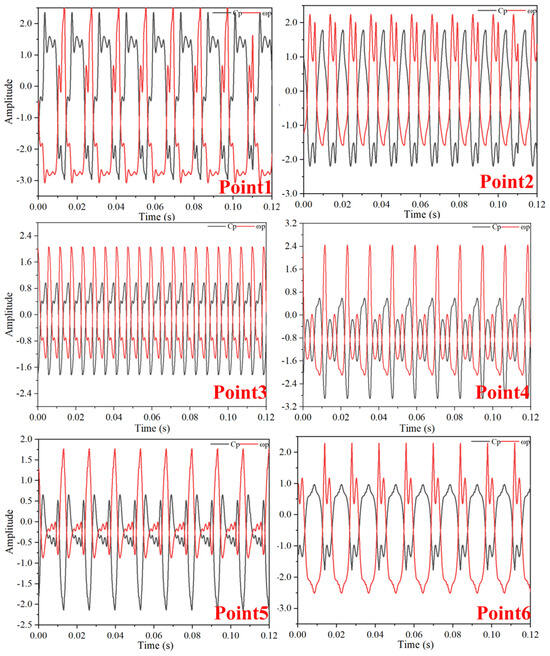
Figure 26.
Time-Domain Diagram of Pressure Fluctuations and Vorticity Fluctuations at TC = 0.25%D (Deep Stall Operating Condition).
Figure 27 reveals that recirculation vortices are predominant under deep stall conditions. At 0.05%D clearance, the flow within the clearance is affected by a “sudden narrowing” of the cross-sectional area, causing flow velocities to peak and saturate the intensity of the TLV. This saturation, combined with the vorticity from the impeller’s internal channels, results in the formation of large-scale recirculation vortices beneath the blades. As the clearance size increases, the flow velocity and the TLV intensity within the blade tip clearance decrease, attributed to the lesser tendency for recirculation as fluid exits the impeller through the wider clearance. Consequently, at larger clearances, the intensity of both recirculation vortices and vorticity reduces, which in turn diminishes vortex instability.
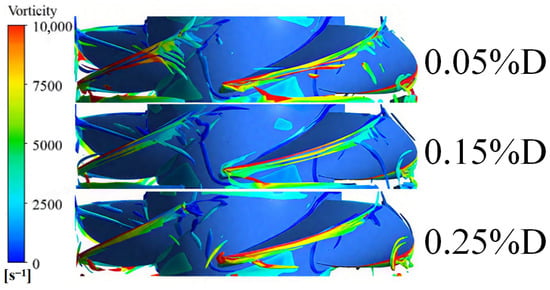
Figure 27.
Vorticity Distribution of the Impeller under Deep Stall Operating Condition.
Figure 28, Figure 29 and Figure 30 present the frequency-domain analysis of pressure pulsations and vorticity fluctuations. At points Point1 and Point6, the amplitude of pressure pulsations decreases with an increase in clearance size, while the fluctuation frequency rises. This phenomenon is due to the slowed internal flow and the intensified vortex formation within the larger clearance during stall conditions. The expansion of the clearance contributes to greater vortex instability and accelerated dissipation, thereby softening the impact on the wall and decreasing the amplitude of pressure pulsations. The effects of dissipation and vortex instability also lead to high-frequency components in the pressure pulsations. Conversely, at Point3 and Point4, the primary fluctuation frequency sees a substantial rise of up to 19%. Furthermore, with the increase in clearance size, the core strength of TLV naturally increases, resulting in higher amplitudes of both pressure pulsations and vorticity strength. Additionally, high-frequency components, especially above 300 Hz, significantly increase at points Point3 and Point4. The fluctuation magnitudes at points Point2 and Point5 show minimal change with clearance size, with their amplitude variations staying under 20%. Due to the complex viscous dissipation and turbulent effects in the clearance flow, fluctuation frequencies lack a clear pattern, diverging from the BPF.
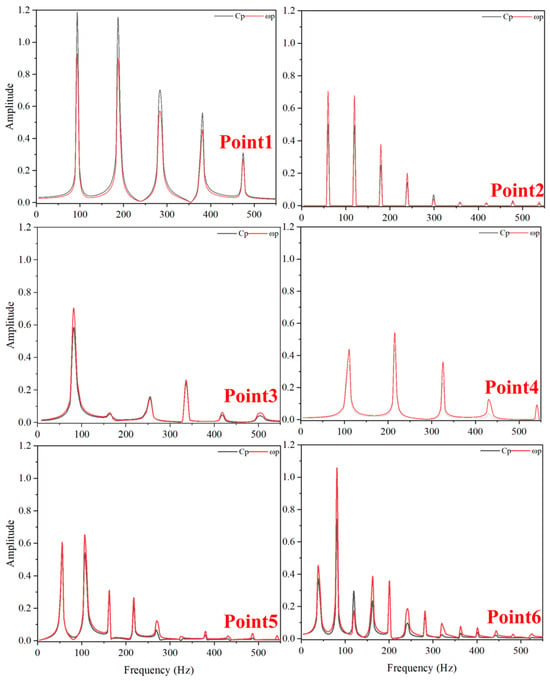
Figure 28.
Frequency-Domain Diagram of Pressure Fluctuations and Vorticity Fluctuations at TC = 0.05%D (Deep Stall Operating Condition).
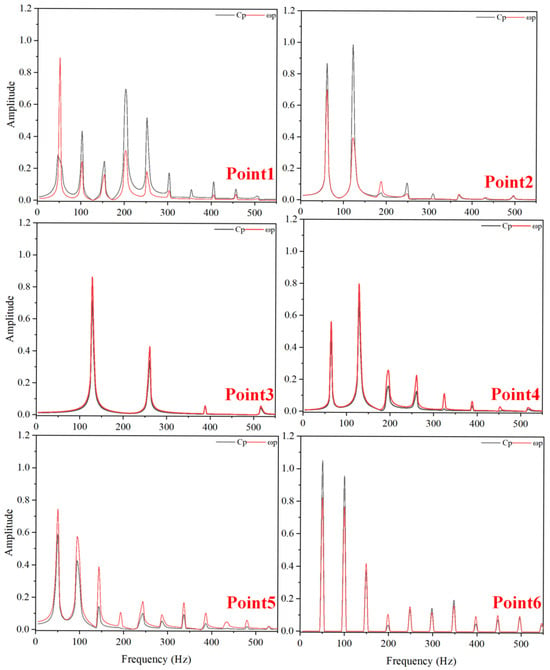
Figure 29.
Frequency-Domain Diagram of Pressure Fluctuations and Vorticity Fluctuations at TC = 0.15%D (Deep Stall Operating Condition).
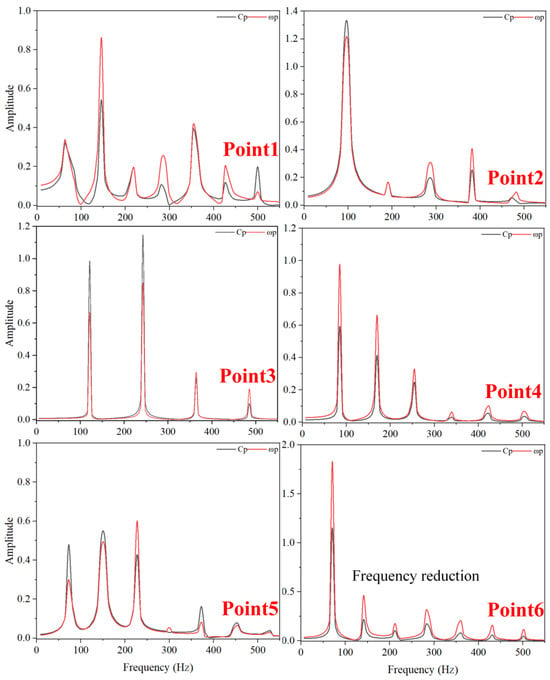
Figure 30.
Frequency-Domain Diagram of Pressure Fluctuations and Vorticity Fluctuations at TC = 0.25%D (Deep Stall Operating Condition).
5. Conclusions
This study examines the pressure pulsation and vorticity fluctuation characteristics in the blade tip clearance area of axial flow pumps under optimal, critical stall, and deep stall conditions. By analyzing TLV characteristics through the vorticity transport equation, and upon achieving convergence in the velocity and pressure fields within the blade tip clearance region, the following conclusions can be drawn from comparing numerical simulations and experimental data:
The core strength of TLV is determined by the compression–expansion term, which positively correlates with the amplitude of pressure pulsations. The viscous dissipation term governs the frequency of pressure pulsations; an increase in this term leads to a rise in the harmonic frequency of pressure pulsations, causing higher-frequency fluctuations. During stall conditions, pressure pulsations exhibit high-frequency harmonic components, with the viscous dissipation effect intensifying markedly.
Pressure decreases with vortex generation and increases with vortex shedding. Vortex shedding, accompanied by viscous dissipation, induces minor pressure oscillations. The frequencies of pressure pulsations and vorticity fluctuations generally align, with the exception of Point1, where the difference arises from fluid–wall interactions and the strong dissipative influence of TLV.
Across optimal, critical stall, and deep stall conditions, the amplitude of pressure fluctuations progressively increases with clearance size. With the expansion of the clearance, the average amplitude of pressure and vorticity fluctuations at each monitoring point rises, notably more so under optimal conditions.
In optimal conditions, the fluctuation amplitudes at each monitoring point within the blade tip clearance adhere to integer multiples of the BPF. Under critical stall conditions at TC = 0.05%D, the fluctuation amplitudes at each point also stick to integer multiples of BPF. At TC = 0.15%D and TC = 0.25%D, the main fluctuation frequency at each point increases by approximately 7% due to changes in turbulent dissipation frequency. Under deep stall conditions, the frequencies of pressure and vorticity fluctuations deviate from the BPF, with some points experiencing more than a 20% increase in frequency and most points exhibiting high-frequency harmonics.
Based on the findings of this study, the following recommendations are proposed for the design of future pumps: the tip clearance size should be optimized to approximately 0.15%D to achieve the best balance between suppressing tip leakage vortex (TLV) strength and reducing pressure pulsations, particularly under off-design conditions. Furthermore, the design process should incorporate analysis using the vorticity transport equation to evaluate the effects of the compression–expansion and viscous dissipation terms. This approach will provide a theoretical basis for controlling high-frequency pulsations induced by TLV and enhancing the operational stability of pumps across various conditions.
Author Contributions
X.J., Z.G., J.L. and X.L.: software, Conceptualization, Validation, Investigation, resources, Data curation, Writing—original draft, Visualization, and Supervision. Z.L.: Validation, Funding acquisition, Data curation. Z.Z.: Conceptualization, Data curation, Writing—review and editing, Visualization. All authors have read and agreed to the published version of the manuscript.
Funding
This research was funded the National Natural Science Foundation of China (Grant No. 52376035) and the Key Research and Development Program of Zhejiang Province (No. 2024C01175).
Institutional Review Board Statement
Not applicable.
Informed Consent Statement
Not applicable.
Data Availability Statement
The original contributions presented in this study are included in the article. Further inquiries can be directed to the corresponding author.
Conflicts of Interest
Authors Jie Liu and Xiaoqin Li were employed by the company Hangzhou Dalu Industry Co., Ltd. The remaining authors declare that the research was conducted in the absence of any commercial or financial relationships that could be construed as a potential conflict of interest.
References
- Zhang, X.; Tang, F. Investigation on hydrodynamic characteristics of coastal axial flow pump system model under full working condition of forward rotation based on experiment and CFD method. Ocean. Eng. 2022, 253, 111286. [Google Scholar] [CrossRef]
- Kan, K.; Zhang, Q.; Xu, Z.; Zheng, Y.; Gao, Q.; Shen, L. Energy loss mechanism due to tip leakage flow of axial flow pump as turbine under various operating conditions. Energy 2022, 255, 124532. [Google Scholar] [CrossRef]
- Song, M.; Xie, H.; Yang, B.; Zhang, S. Influence of tip clearance on flow characteristics of axial compressor. Processes 2020, 8, 1445. [Google Scholar] [CrossRef]
- Wei, X.; Zhang, R. The axial tip clearance leakage analysis of the winglet and composite blade tip for the liquid-ring vacuum pump. Vacuum 2022, 200, 111027. [Google Scholar] [CrossRef]
- Yu, H.; Zhang, Z.; Hua, H. Numerical investigation of tip clearance effects on propulsion performance and pressure fluctuation of a pump-jet propulsor. Ocean. Eng. 2019, 192, 106500. [Google Scholar] [CrossRef]
- Kan, N.; Liu, Z.; Shi, G.; Liu, X. Effect of Tip Clearance on Helico-Axial Flow Pump Performance at Off-Design Case. Processes 2021, 9, 1653. [Google Scholar] [CrossRef]
- Liu, Y.; Tan, L. Tip clearance on pressure fluctuation intensity and vortex characteristic of a mixed flow pump as turbine at pump mode. Renew. Energy 2018, 129, 606–615. [Google Scholar] [CrossRef]
- Wen, H.; Lv, W.; Shi, G.; Liu, Z. Effect of the tip clearance on tip leakage vortex and pressure fluctuation characteristics in a helico-axial flow multiphase pump. Aip Adv. 2022, 12, 085326. [Google Scholar] [CrossRef]
- Shu, Z.; Shi, G.; Tao, S.; Tang, W.; Li, C. Three-dimensional spatial-temporal evolution and dynamics of the tip leakage vortex in an oil-gas multiphase pump. Phys. Fluids 2021, 33, 113320. [Google Scholar] [CrossRef]
- Feng, J.; Luo, X.; Guo, P.; Wu, G. Influence of tip clearance on pressure fluctuations in an axial flow pump. J. Mech. Sci. Technol. 2016, 30, 1603–1610. [Google Scholar] [CrossRef]
- Zhang, D.; Shi, W.; van Esch, B.; Shi, L.; Dubuisson, M. Numerical and experimental investigation of tip leakage vortex trajectory and dynamics in an axial flow pump. Comput. Fluids 2015, 112, 61–71. [Google Scholar] [CrossRef]
- Tran, B.N.; Jeong, H.; Kim, J.-H.; Park, J.-S.; Yang, C. Effects of Tip Clearance Size on Energy Performance and Pressure Fluctuation of a Tidal Propeller Turbine. Energies 2020, 13, 4055. [Google Scholar] [CrossRef]
- Pogorelov, A.; Meinke, M.; Schröder, W. Cut-cell method based large-eddy simulation of tip-leakage flow. Phys. Fluids 2015, 27, 075106. [Google Scholar] [CrossRef]
- Liu, Y.; Han, Y.; Tan, L.; Wang, Y. Blade rotation angle on energy performance and tip leakage vortex in a mixed flow pump as turbine at pump mode. Energy 2020, 206, 118084. [Google Scholar] [CrossRef]
- Dai, J.; Mou, J.; Liu, T. Influence of Tip Clearance on Unsteady Flow in Automobile Engine Pump. Fluid Dyn. Mater. Process. 2020, 16, 161–179. [Google Scholar] [CrossRef]
- An, X.; Wang, P.; Song, B.; Xia, H.; Jin, Z.; Han, S.; He, R. Tip clearance influence on pressure fluctuation of a composite ducted propeller using two-way FSI method. In Proceedings of the Global OCEANS Singapore—U.S. Gulf Coast Conference, Electr Network, Biloxi, MS, USA, 5–30 October 2020. [Google Scholar]
- Xiang, L.; Tan, Y.; Chen, H.; Xu, K. Experimental investigation of cavitation instabilities in inducer with different tip clearances. Chin. J. Aeronaut. 2021, 34, 168–177. [Google Scholar] [CrossRef]
- Shi, G.; Liu, Z.; Liu, X.; Xiao, Y.; Tang, X. Phase Distribution in the Tip Clearance of a Multiphase Pump at Multiple Operating Points and Its Effect on the Pressure Fluctuation Intensity. Processes 2021, 9, 556. [Google Scholar] [CrossRef]
- Yu, Z.; Zhang, W.; Zhu, B.; Li, Y. Numerical analysis for the effect of tip clearance in a low specific speed mixed-flow pump. Adv. Mech. Eng. 2019, 11. [Google Scholar] [CrossRef]
- Russell, P.S.; Barbaca, L.; Venning, J.A.; Pearce, B.W.; Brandner, P.A. Influence of nucleation on cavitation inception in tip leakage flows. Phys. Fluids 2023, 35, 13341. [Google Scholar] [CrossRef]
- Yang, F.; Wu, Y.; Chen, Z.; Spence, S.; Li, B. The unsteadiness of tip leakage vortex breakdown and its role in rotating instability. Phys. Fluids 2023, 35, 107108. [Google Scholar] [CrossRef]
- Jia, X.; Lv, H.; Rao, K.; Zhang, S.; Zhu, Z. Research on pressure fluctuation induced by tip leakage vortex of axial flow circulating pump under unpowered driven conditions. Phys. Fluids 2023, 35, 34118. [Google Scholar] [CrossRef]
- Li, P.; Cao, L.; Si, H.; Wang, W. Investigation on the unsteady pressure fluctuation characteristic in the blade tip seal of steam turbine based on spectrum. Therm. Sci. 2020, 24, 3823–3834. [Google Scholar] [CrossRef]
- Roy, C.J. Grid convergence error analysis for mixed-order numerical schemes. AIAA J. 2003, 41, 595–604. [Google Scholar] [CrossRef]
- Stern, F.; Wilson, R.V.; Coleman, H.W.; Paterson, E.G. Comprehensive approach to verification and validation of CFD simulations—Part 1: Methodology and procedures. J. Fluids Eng. 2001, 123, 793–802. [Google Scholar] [CrossRef]
- Ye, W.; Ikuta, A.; Chen, Y.; Miyagawa, K.; Luo, X. Numerical simulation on role of the rotating stall on the hump characteristic in a mixed flow pump using modified partially averaged Navier-Stokes model. Renew. Energy 2020, 166, 91–107. [Google Scholar] [CrossRef]
- Gatski, T.B.; Speziale, C.G. On explicit algebraic stress models for complex turbulent flows. J. Fluid Mech. 1993, 254, 59–78. [Google Scholar] [CrossRef]
- York, W.D.; Walters, D.K.; Leylek, J.H. A simple and robust linear eddy-viscosity formulation for curved and rotating flows. Int. J. Numer. Methods Heat Fluid Flow 2009, 19, 745–776. [Google Scholar] [CrossRef]
- Wu, X.; Ye, H.; Tan, M.; Liu, H. Effect of Discharge Elbow on Performance of the Axial Flow Pump in Saddle Zone. International J. Fluid Mach. Syst. 2020, 13, 775–785. [Google Scholar] [CrossRef]
- Jia, X.; Lv, H.; Zhu, Z. Research on the influence of impeller tip clearance on the internal flow loss of axial circulating pump under unpowered driven condition. J. Fluids Eng. 2023, 145, 21202. [Google Scholar] [CrossRef]
- Wang, L.; Tang, F.; Chen, Y.; Liu, H. Evolution characteristics of suction-side-perpendicular cavitating vortex in axial flow pump under low flow condition. J. Mar. Sci. Eng. 2021, 9, 1058. [Google Scholar] [CrossRef]
- Lin, T.; Zhu, Z.; Li, X.; Li, J.; Lin, Y. Theoretical, experimental, and numerical methods to predict the best efficiency point of centrifugal pump as turbine. Renew. Energy 2021, 168, 31–44. [Google Scholar] [CrossRef]
Disclaimer/Publisher’s Note: The statements, opinions and data contained in all publications are solely those of the individual author(s) and contributor(s) and not of MDPI and/or the editor(s). MDPI and/or the editor(s) disclaim responsibility for any injury to people or property resulting from any ideas, methods, instructions or products referred to in the content. |
© 2025 by the authors. Licensee MDPI, Basel, Switzerland. This article is an open access article distributed under the terms and conditions of the Creative Commons Attribution (CC BY) license (https://creativecommons.org/licenses/by/4.0/).