Article

Effects of the Left Ventricular Mechanics on Left Ventricular-Aortic Interaction: Insights from Ex Vivo Beating Rat Heart Experiments

1
Department of Mechanical Engineering, Michigan State University, East Lansing, MI 48824, USA
2
Joint Department of Biomedical Engineering, Marquette University and Medical College of Wisconsin, Milwaukee, WI 53233, USA
3
Department of Biomedical Engineering, Lawrence Technological University, Southfield, MI 48075, USA
*
Author to whom correspondence should be addressed.
Fluids 2025, 10(9), 234; https://doi.org/10.3390/fluids10090234
Submission received: 6 July 2025 / Revised: 15 August 2025 / Accepted: 28 August 2025 / Published: 2 September 2025
(This article belongs to the Special Issue Recent Advances in Cardiovascular Flows)

Abstract

The interaction between the left ventricle (LV) and aorta is critical for cardiovascular performance, particularly under pathophysiological conditions. However, how changes in LV mechanics, including preload and afterload, affect aortic function via LV–aorta interactions remains poorly understood due to the challenges associated with varying loading conditions in vivo. To overcome these limitations, the effects of varying LV preload or afterload on LV and aortic functions via LV–aorta interactions are quantified using ex vivo beating rat heart experiments in this study. In five healthy rat hearts under retrograde Langendorff and antegrade working heart perfusion, LV pressure, volume, aortic pressure, and aortic blood flow were measured. Key findings include the following: (1) under Langendorff perfusion, aortic flow increased linearly with LV developed pressure (DP), with a slope of 4.04 mmHg·min/mL; under working heart constant-pressure perfusion (2) a 12.4% increase in afterload decreased aortic flow by 58.8%, indicating that elevated aortic pressure significantly impedes aortic flow; (3) a 10.4% increase in preload enhanced aortic flow by 44.2%, driven primarily by an increase in LV DP that promoted forward flow. These results suggest that aortic pressure predominantly influences aortic flow under varying afterload conditions, whereas LV DP plays the dominant role in regulating aortic flow under different preload conditions. These findings demonstrate that the heart’s loading conditions strongly impact aortic blood flow. Specifically, elevated LV afterload can severely limit forward blood flow, while increased LV filling with increased LV preload can enhance blood flow, highlighting the importance of managing both afterload and preload in conditions such as hypertension and heart failure with preserved ejection fraction. This pilot study also established the feasibility of experimental platforms for coronary and ventricular function analysis.

1. Introduction

The interaction between the left ventricle (LV) and the aorta plays a critical role in determining global cardiovascular performance in both health and disease states [1,2]. Cardiac responses to changes in loading conditions have long been described by classical physiological laws. The Frank–Starling mechanism explains how increased preload enhances force generation through sarcomere length–tension relationships [3], while Hill’s force–velocity relationship describes the reduced shortening velocity and output under elevated afterload [4]. The Suga–Sagawa framework integrates these principles by characterizing ventricular–arterial coupling, linking contractile performance to arterial load [5,6]. These foundational concepts form the theoretical basis for our investigation of preload- and afterload-dependent changes in ventricular and aortic function in the ex vivo beating heart model. The contractile function of LV is commonly assessed by developed pressure (DP), a well-established index of myocardial performance [7,8]. Aortic function has been characterized using hemodynamics, including aortic blood flow and pressure [9,10]. Changes in the LV mechanics (e.g., afterload and preload) due to heart diseases alter the LV function, which further alters the aortic function via the LV–aorta interaction [11,12,13,14]. Since these confounding changes in loading conditions seldom occur in isolation during the progression of heart diseases, it is exceedingly challenging to isolate the effects of changing each individual loading condition on LV and aortic functions in in vivo animal experiments [15,16]. As such, it remains unclear how changes in the LV loading conditions impact the LV and its interaction with aortic function [17]. This limitation poses a significant barrier to our mechanistic understanding of cardiovascular disease progression and hinders the development of targeted diagnostics and therapeutic interventions.
Ex vivo beating heart experiments offer a powerful alternative to overcome these limitations. In such systems, the mechanical loading conditions can be precisely controlled, where the effects of afterload or preload can be separately evaluated [18,19,20,21,22]. Specifically, left atrial filling pressure (preload) and systemic pressure (afterload) can be varied by adjusting the height of the preload chamber, while afterload can be adjusted through changes in the resistance of the afterload chamber [23]. Despite advances in ex vivo beating heart experiments, most prior ex vivo beating heart studies have focused on ischemia–reperfusion injury [24] and heart failure [25] under retrograde Langendorff perfusion alone. Few studies have integrated both retrograde and antegrade (working heart) perfusion to investigate LV–aorta interactions [26,27,28]. Existing studies have applied ex vivo working heart models to investigate the effects of preload and afterload on heart function in isolation [29,30], where LV preload and afterload can be independently modulated to assess cardiac output and DP in rodent heart [31,32,33,34]. However, these works [29,30,31,32,33,34] primarily focused on overall cardiac function, with limited attention to aortic hemodynamics, and a few studies [30] have directly quantified how LV loading alters aortic flow and pressure dynamics. Some in vitro setups have examined how LV responds to varying afterload but without reproducing physiological LV–aortic interaction in an intact beating heart system [29,30,31]. In particular, aortic blood flow changes under varying loading conditions via LV–aortic interaction have not been determined.
To systemically quantify the contribution of the changes in LV afterload or preload to LV and aortic functions, isolated ex vivo beating rat heart experiments will be performed. These experiments are able to reproduce the in vivo antegrade perfusion. The established setup can be potentially applied to quantify the effects of cardiovascular diseases on the LV and aortic functions. This approach will provide critical insights into how loading conditions shape cardiac and vascular function, enhancing our understanding of pathophysiological changes in LV–aorta dynamics.

2. Materials and Methods

2.1. Animals

Male Sprague-Dawley rats (n = 5), weighing between 380 and 450 g, were used in the ex vivo beating rat heart experiments. The protocols for animal experiments were approved by the Institutional Animal Care and Use Committee at Medical College of Wisconsin. Based on a power analysis (G*Power: 3.1), the necessary number of rats used in this study is 5 with a power of 0.8, effect size of 0.85, and α-level of 0.05.

2.2. Echocardiography Images (ECHO)

Echocardiography images (ECHO) were acquired from all rats’ hearts under in vivo conditions to analyze LV function (Figure 1). Rats (n = 5) were anesthetized with 1.5–3.5% isoflurane mixed with air. ECHOs were recorded using the Vevo 3100 (VisualSonics FujiFilm, Toronto, ON, Canada) with the following settings: frequency of 20.5 MHz, bandwidth of 15–30 MHz, axial resolution of 75 µm, and image depth of 3–20 mm [35]. Longitudinal views were obtained at the position when the apex and aorta were aligned in the horizontal direction (Figure 1A). Short-axis views were acquired by rotating the probe by 90° clockwise from the longitudinal view (Figure 1B).

2.3. Ex Vivo Beating Heart Experiments

2.3.1. System Preparation

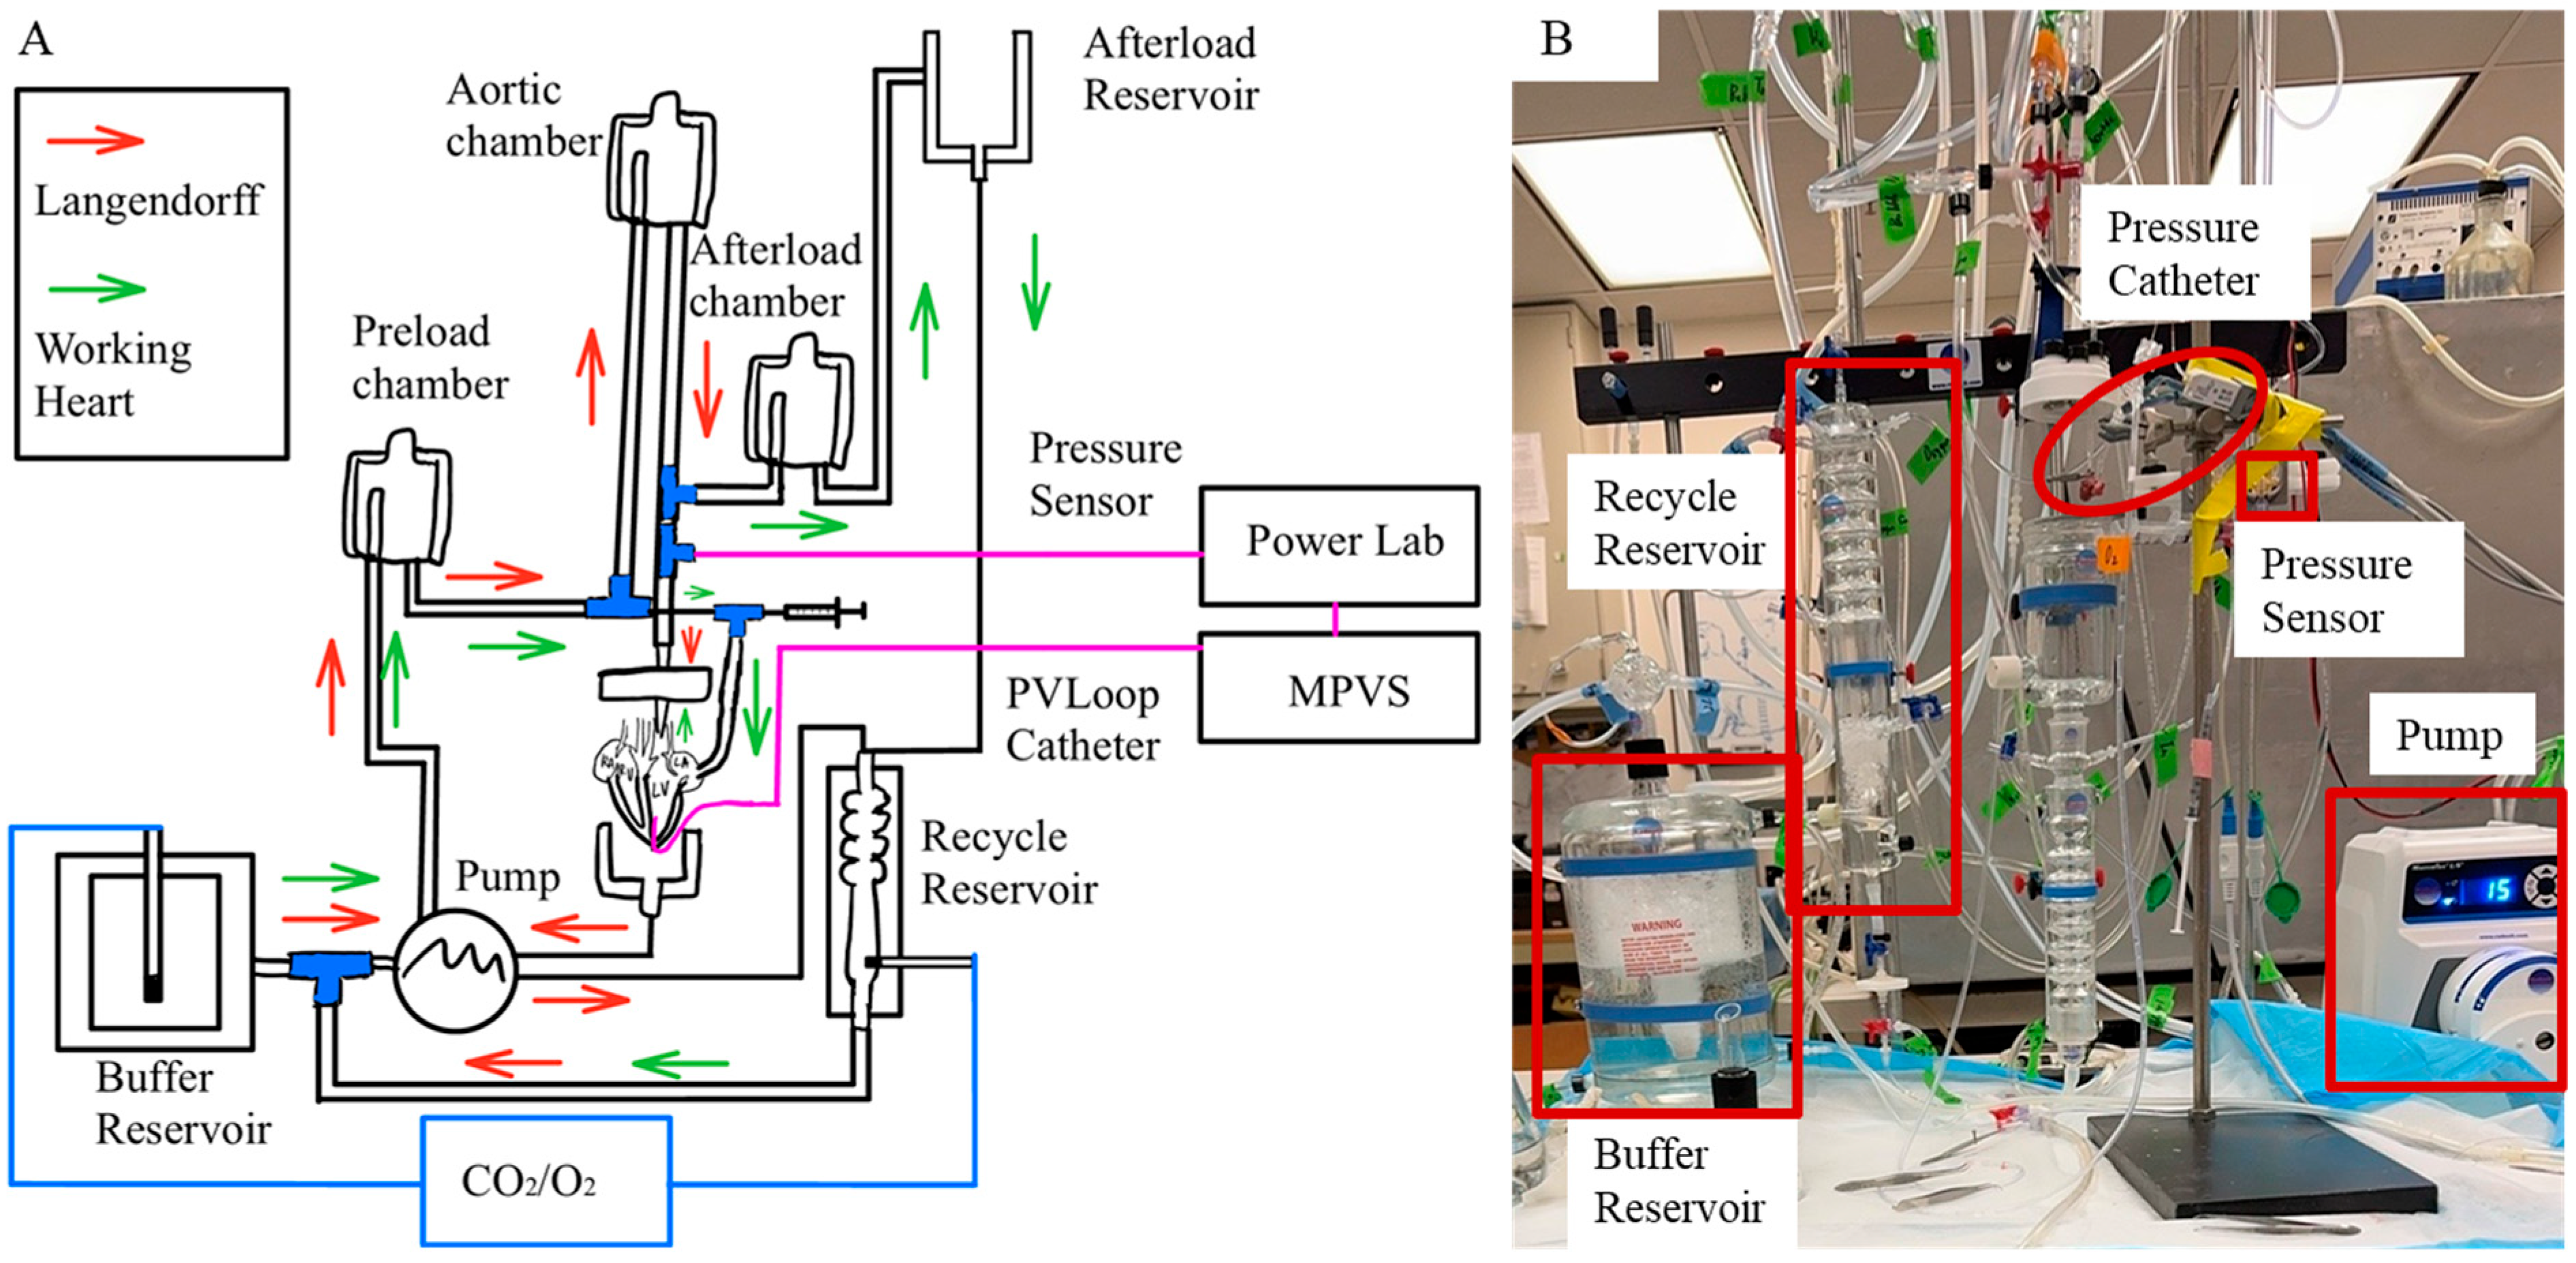
The Krebs–Henseleit bicarbonate buffer (KHB) contained 123.25 mM NaCl, 3.3 mM KCl, 1.2 mM MgCl2 1.2 mM KH2PO4, 2.5 mM CaCl2, 0.05 mM EDTA, 14.4 mM NaHCO3, 2.02 mM pyruvate, 11.49 mM Dextrose, and 16.03 mM Mannitol. The KHB solution was filtered through a 0.22 µm filter [23]. The perfusate was oxygenated using a 95%/5% O2/CO2 gas mixture and calibrated to a pH of 7.4. A 20 mL KHB was reserved in a culture dish surrounded by ice for heart transition immediately following dissection. To keep the physiological temperature of KHB the same as the body temperature (37 °C) during the experiments, KHB was preheated and maintained at 37 °C in the isolated perfusion System (Radnoti, Monrovia, CA, USA) (Figure 2A). The system was continuously perfused with the KHB.

2.3.2. Animal Preparation and Heart Dissection

To prepare for the ex vivo beating rat heart experiments, rats (n = 5) were anesthetized with ketamine (75 mg/kg) and xylazine (13 mg/kg). Heparin (100 U/kg) was administered via intraperitoneal injection to prevent blood clotting. Once the rat was confirmed to be unresponsive to a toe-pinch, it was prepared for decapitation. A thoracotomy was then performed to expose the heart. The connections between the lungs and diaphragm were excised, and the connective tissue between the lungs and thoracic was rapidly incised. The heart was carefully extracted from the chest and immediately immersed in cold buffer prepared in a culture dish.

2.3.3. Heart Cannulation

The aorta was rapidly connected to an aortic cannula attached to an 80 mmHg perfusion line (Figure 2B). The cannula tip was positioned to be approximately 1 mm above the aortic valve, and the aorta was tightly sutured to the cannula using a 0.4 mm thick suture to prevent any leakage. The pulmonary artery was opened to air. Two left and two right pulmonary veins were identified and sutured to avoid fluid loss. A 2F pressure–volume catheter (SPR-838, Millar, Pearland, TX, USA) was inserted through the LV apex to record LV pressure and volume waveforms throughout the cardiac cycle. A flow meter (TRANSONIC SYSTEMS T206, Ithaca, NY, USA) placed in-line between the perfusion line and the aortic annual was used to measure aortic blood flow. The heart was stabilized until the aortic pressure, LV pressure waveforms, and aortic blood flow reached a steady state under Langendorff constant flow mode, with a developed pressure (DP) greater than 60 mmHg [23]. The left atrium (LA) was then cannulated using an atrial cannula and carefully sutured to prevent any leakage.

2.3.4. Data Collection

Under both Langendorff and working heart perfusion modes, the myocardium was excited spontaneously. Within each rat, the measurements were collected when the spontaneous heart rhythm was stable over 20 mins. Left ventricular pressure waveform and volume waveforms (under working heart perfusion condition only) measured by a Millar pressure–volume (PV) catheter, aortic and atrial pressures measured by pressure transducers, aortic blood flow rate measured by the flow meter, ECG, heart rate, and rate product were continuously recorded using a 16–Channel PowerLab system (AD Instruments, Colorado Springs, CO, USA) with LabChart Pro v8.1.30 Software (AD Instruments, Colorado Springs, CO, USA).
Two pressure transducers and the pressure channel of the Millar PV catheter were calibrated using the Delta-Cal procedure in LabChart Pro Software. The pressure signal was referenced against two known pressures to ensure linearity and accuracy across the physiological range of pressure (0–150 mmHg). The volume channel of the Millar PV catheter was calibrated using volumes derived from ECHOs. Firstly, conductance for each subject was determined, then the uncalibrated stroke volume was scaled from PV loops to match the stroke volume derived from ECHO under identical loading conditions. To minimize these potential errors or inter-subject variability arising from differences in image quality, geometric assumptions, or slight hemodynamic changes between measurements, we used consistent probe positioning across all rats and applied calibration individually for each subject.
  • Langendorff Perfusion:
Under Langendorff constant-flow mode, the heart was perfused retrogradely. LV pressure, aortic pressure, aortic blood flow, and ECG were recorded continuously, while pump speed was adjusted across 5–8 settings for each rat heart. These measurements, in combination with established viability criterion of LV DP > 60 mmHg, were used to monitor heart viability.
  • Working Heart Perfusion:
Under the working heart constant-pressure mode, the heart was perfused antegradely. The pump speed was adjusted to ensure overflow in the preload chamber, which did not need to be identical among five rats. However, blood flow was regulated by heart contraction and therefore varied among 5 rats. During the transition to working heart mode, LV pressure and aortic flow were monitored to ensure stable function. Established viability criteria included LV DP > 60 mmHg and a positive aortic flow rate, indicating that the heart remained viable throughout the transition. LV pressure and volume, aortic pressure, and aortic blood flow were measured under three conditions, (1) baseline; (2) with varying LV afterload; and (3) with varying LV preload. To increase LV afterload, the volume of KHB in the afterload chamber was adjusted from empty to full (the chamber was full at baseline) (Figure 2A). To increase LV preload, the height of the preload chamber (Figure 2A) was raised from the height of 71.3 cm to 92.5 cm (the preload chamber height is at 92.5 cm at baseline).

2.3.5. Data Analysis

LV end-diastolic volume (EDV), end-systolic volume (ESV), stroke volume (SV), ejection fraction (EF), global longitudinal strain (GLS), and global circumferential strain (GCS) were analyzed from ECHOs using Vevostrain 5.7.1. LV volumes were obtained by manually tracing the LV endocardial borders in VevoLab 5.7.1. The LV volume measurements were calculated as the mean of volumes obtained from both longitudinal and short-axis views in B-mode and M-mode. GLS and GCS were post-processed from ECHOs in VevoStrain using semi-automated tracing of both endocardial and epicardial contours. EDV and ESV derived from ECHOs were used to calibrate pressure–volume catheter measurements at baseline in LabChart Pro for all 5 rats. Pressure and volume waveforms under each condition were derived by averaging over 8 cardiac cycles. Stroke work (SW) was calculated by SW = MAP × SV, where MAP represents mean aortic pressure.

3. Results

3.1. ECHO Analyses

The LV function of five rats was analyzed using ECHOs. The mean value of each index over five rats was calculated with standard deviation (SD). The mean value of EDV was 0.45 ± 0.08 mL; that of ESV was 0.16 ± 0.06 mL; that of SV was 0.28 ± 0.05 mL; and that of EF was 64.69 ± 11.32% (Table 1). The mean value of cardiac output (CO) was 64.06 ± 13.11 mL/min; that of GLS was −17.15 ± 7.18%; and that of GCS was −9.59 ± 6.18% (Table 1).

3.2. Langendorff Perfusion

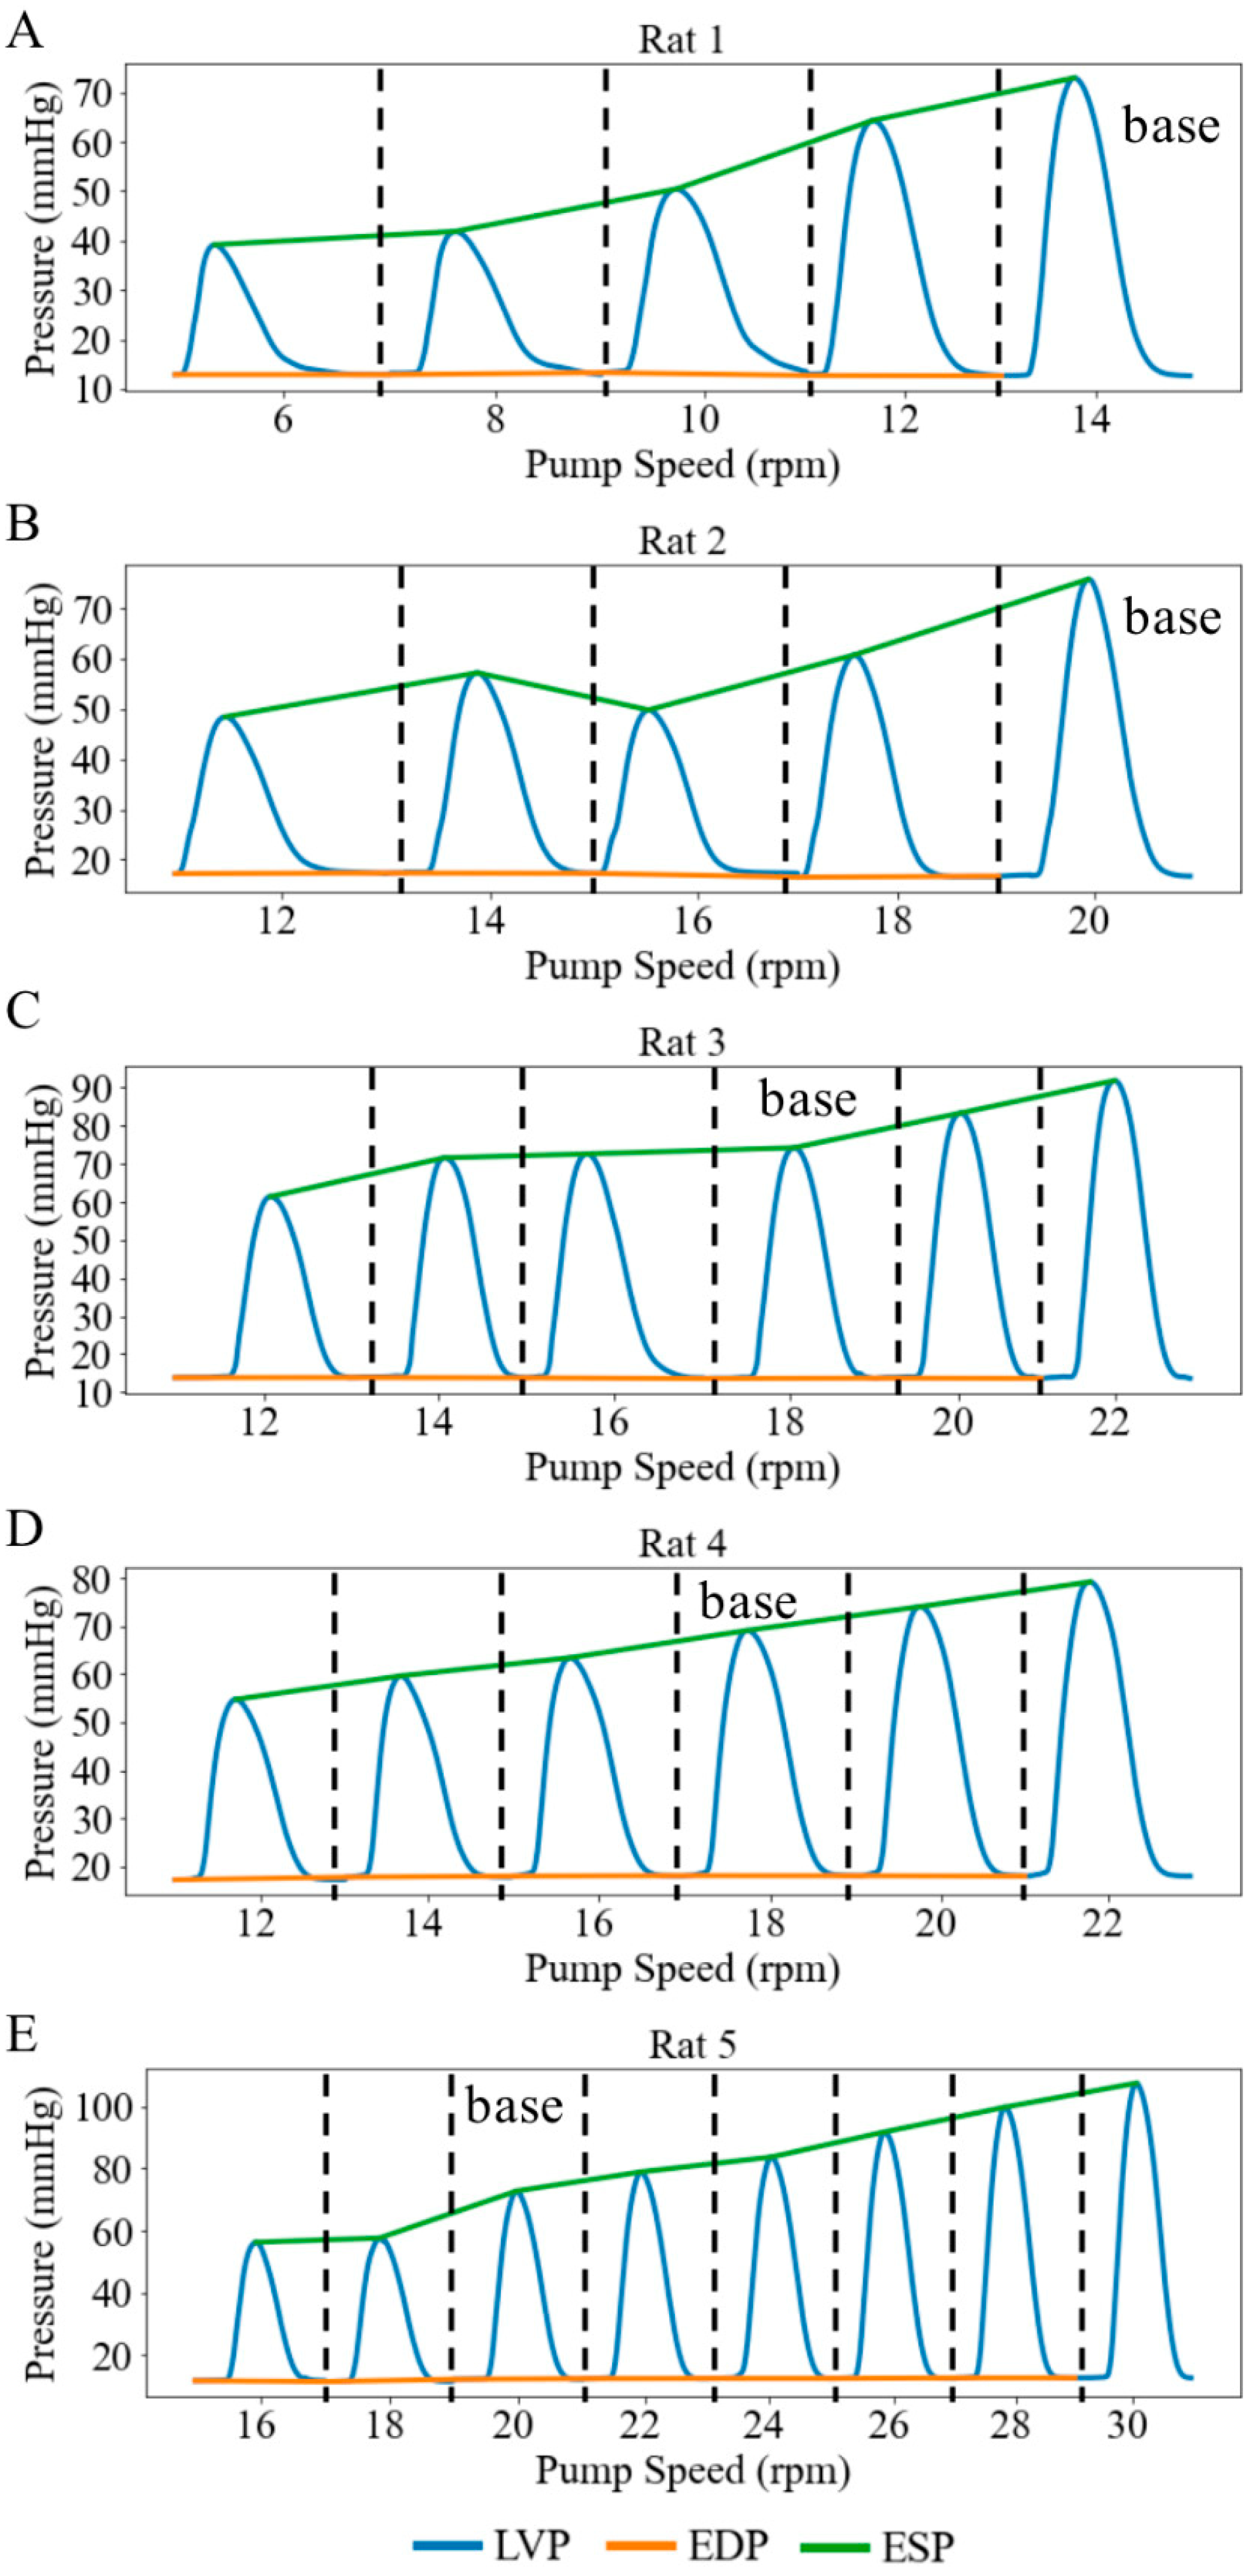
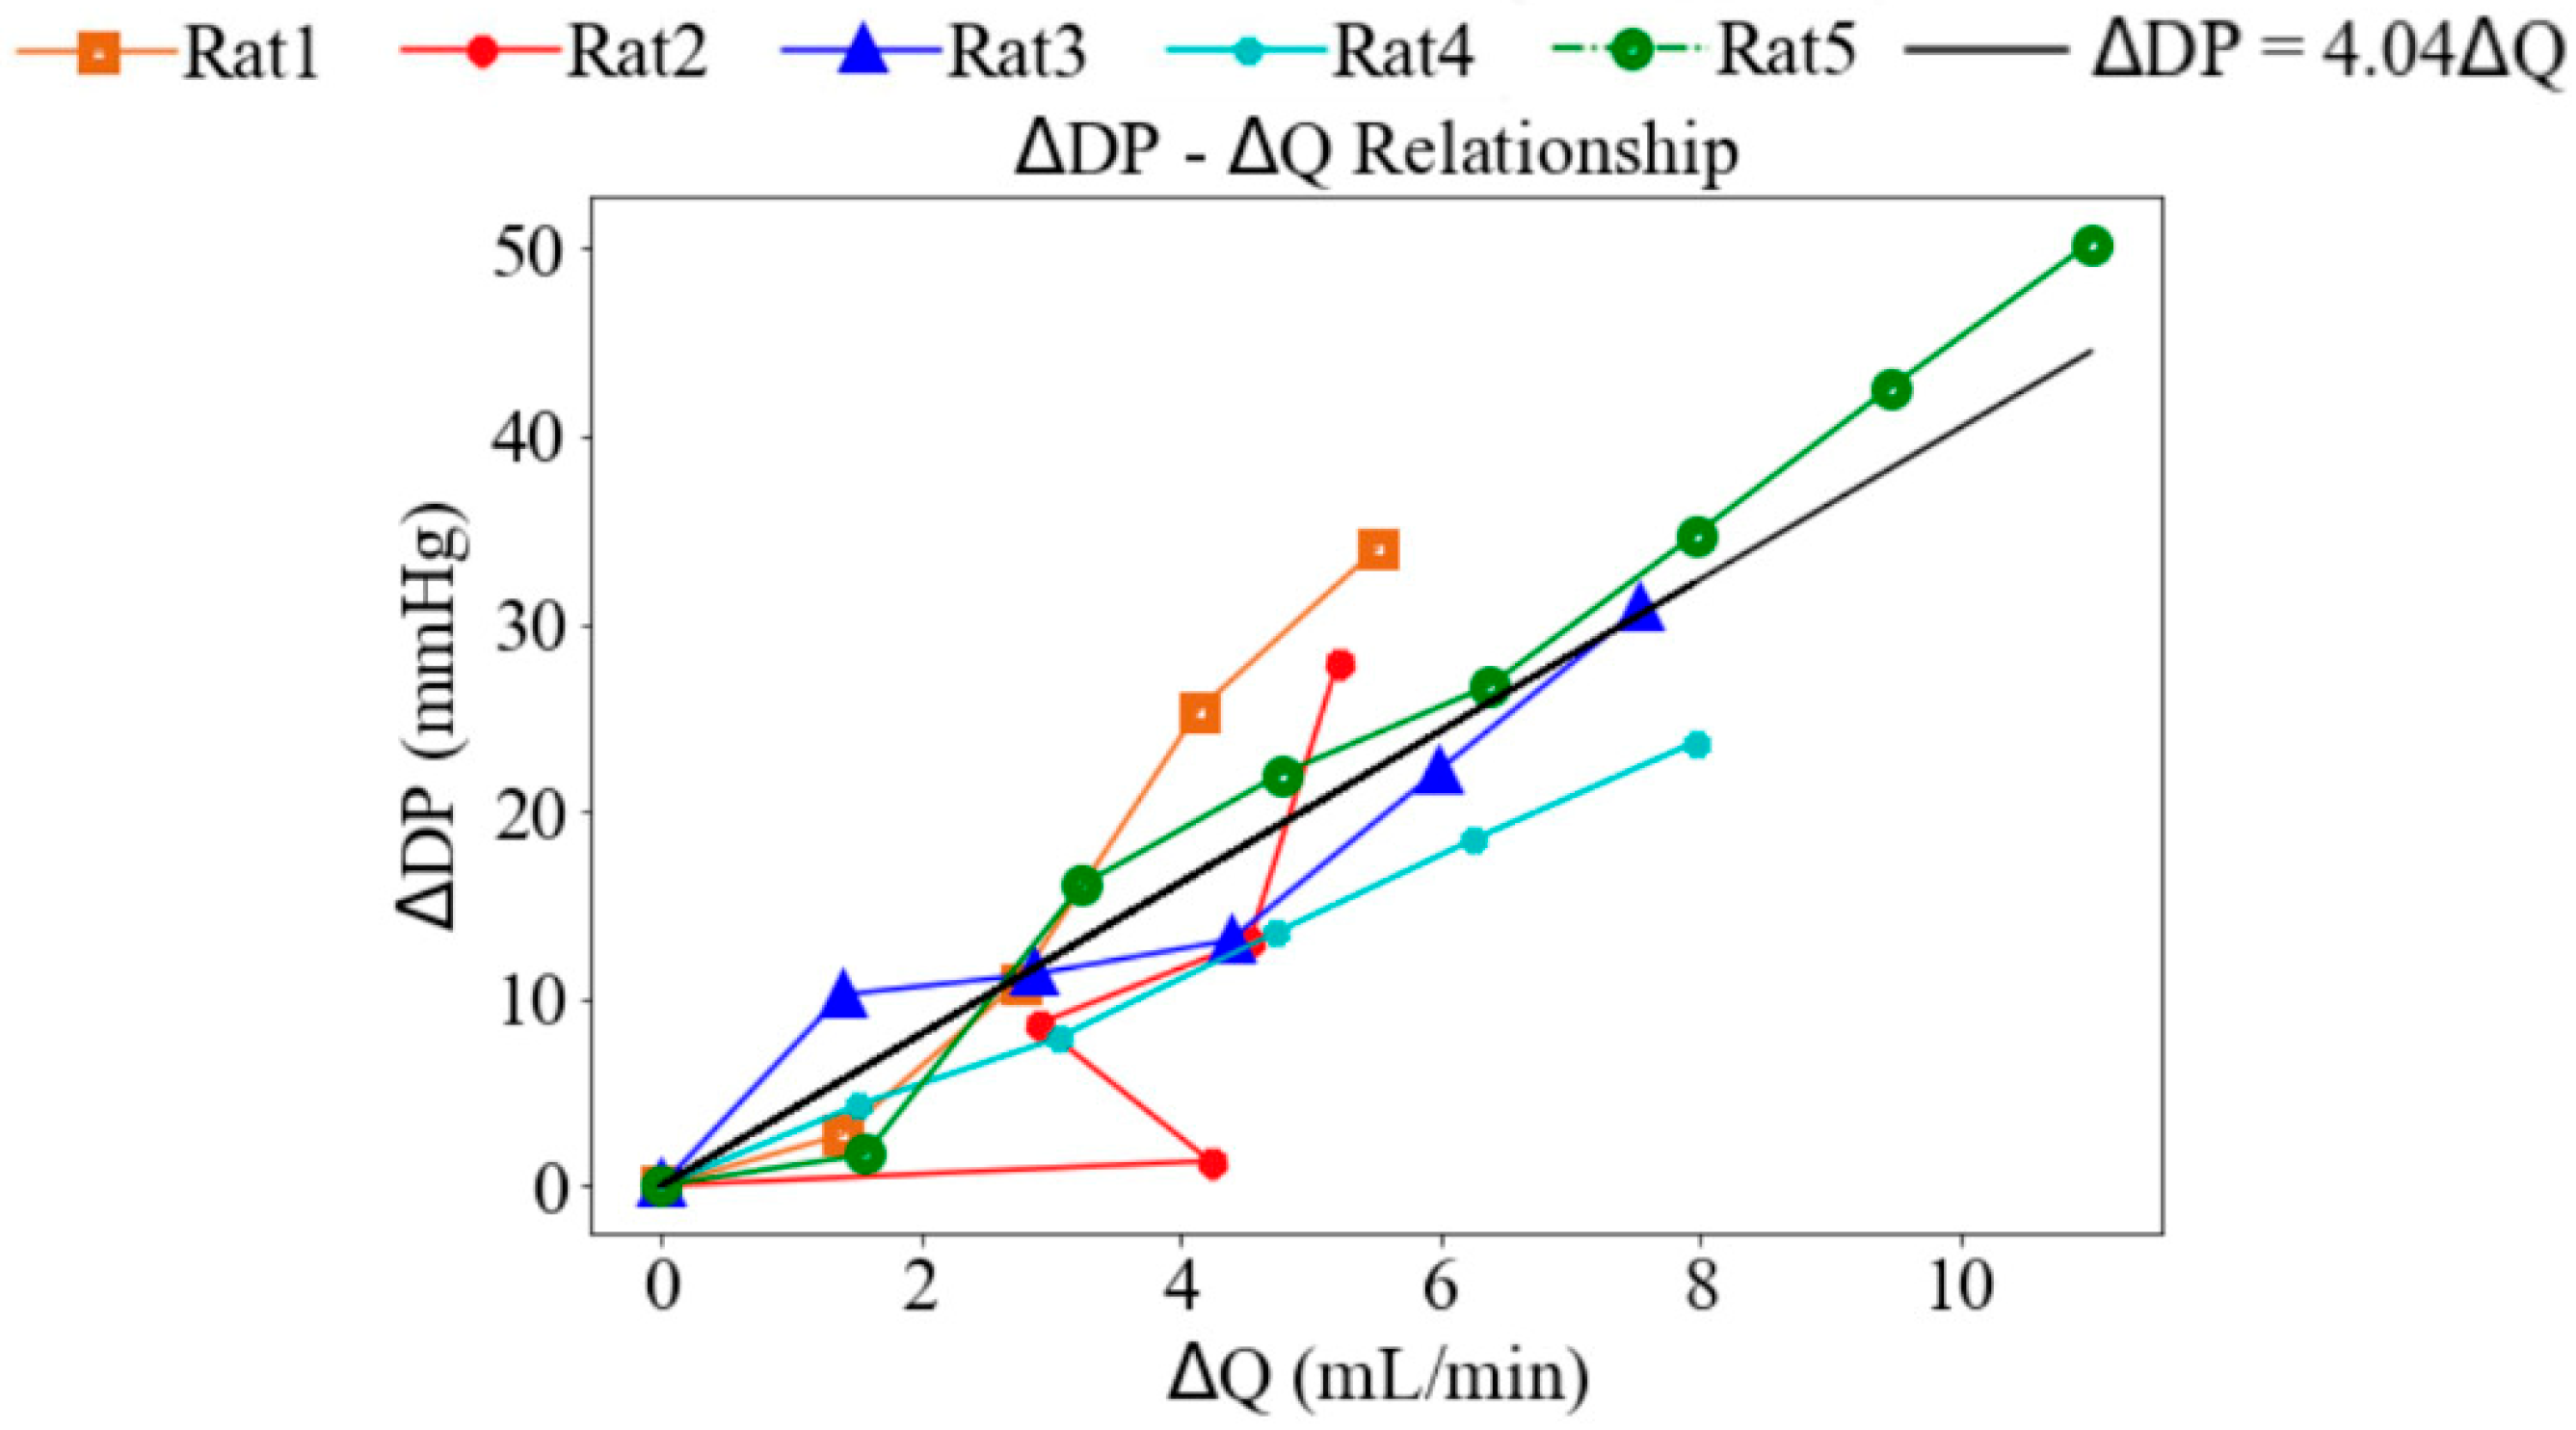
Under Langendorff constant-flow perfusion at baseline (base), the LV end-diastolic pressure (EDP) ranged from 12.30 to 18.07 mmHg with a mean value of 14.65 mmHg, and the LV end-systolic pressure (ESP) ranged from 69.09 to 75.76 mmHg with a mean value of 72.95 mmHg across five rats. These values were within the physiological range. Consequently, the LV DP—that is, the difference between LV ESP and LV EDP—exceeded 60 mmHg (Figure 3). When pump speed was increased by a range of 8 to 14 rpm under the Langendorff constant-flow mode, the mean LV ESP and EDP were improved by 67.13 and 14.75 mmHg, respectively, resulting in an increase in the LV DP of 53.38 mmHg (Figure 3). In addition, aortic blood flow rose to a mean value of 11.01 mL/min. Changes in LV pressure and aortic flow across pump speeds were statistically significant (p < 0.01). Moreover, the increase in LV DP with rising pump speed was positively correlated with the increase in aortic blood flow, with a slope of 4.04 mmHg·min/mL (Figure 4), indicating that enhanced blood flow was associated with stronger ventricular contraction.

3.3. Working Heart Perfusion

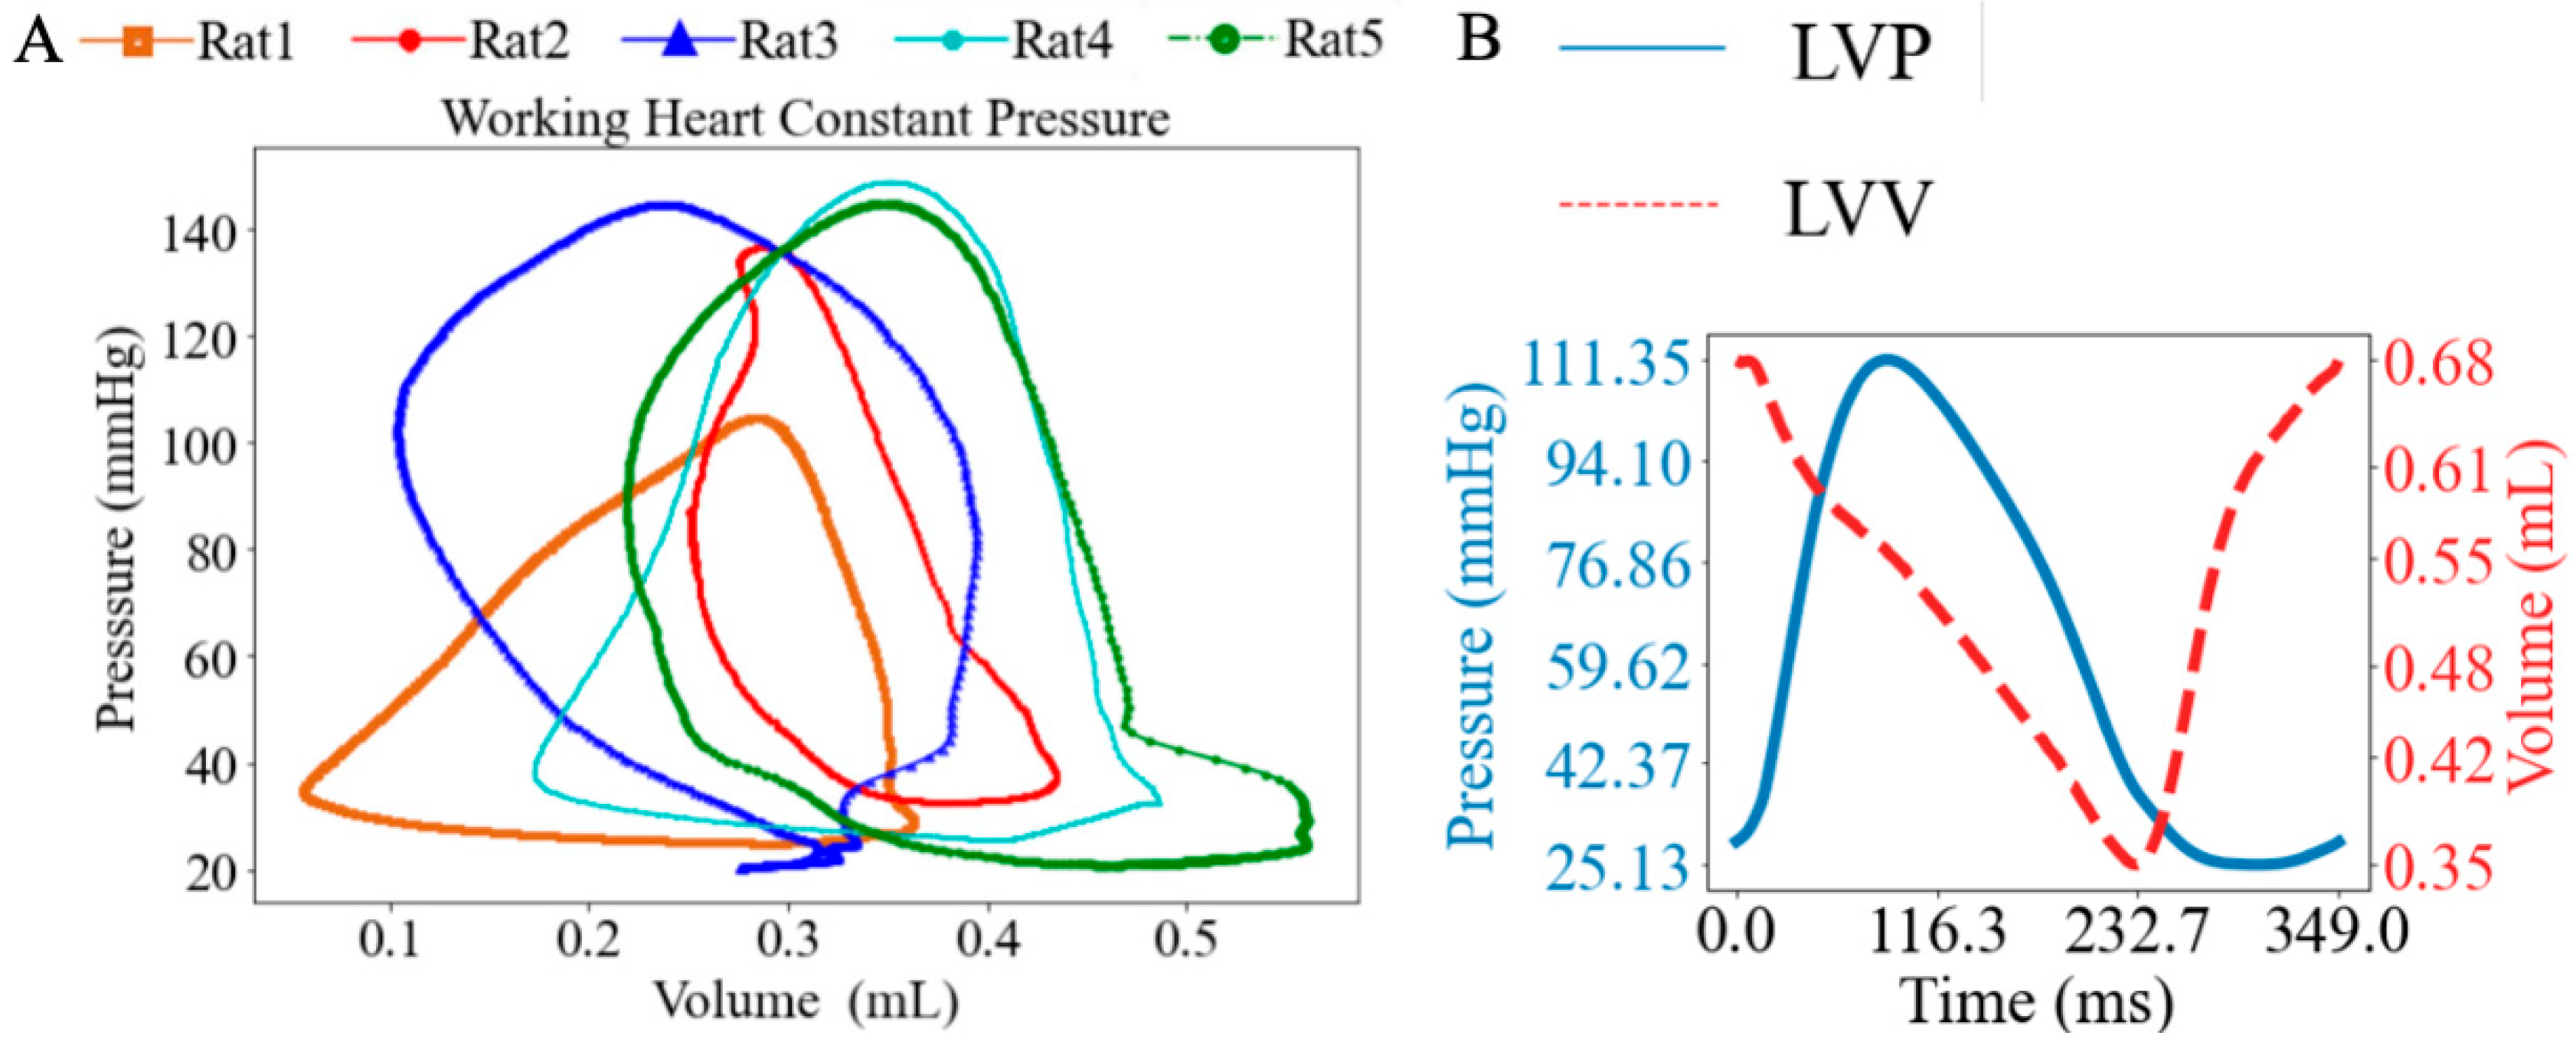
Under working heart constant-pressure conditions, the heart was perfused antegradely, and LV PV loops were recorded at baseline with a mean PVA of 25.80 mmHg∙mL (Figure 5A). The ESP ranged from 104.45 mmHg to 148.88 mmHg, with a mean value of 136.00 mmHg, while the EDP ranged from 20.40 mmHg to 32.60 mmHg, with a mean value of 25.70 mmHg. A representative set of synchronized LV pressure and volume waveforms is shown (Figure 5B).
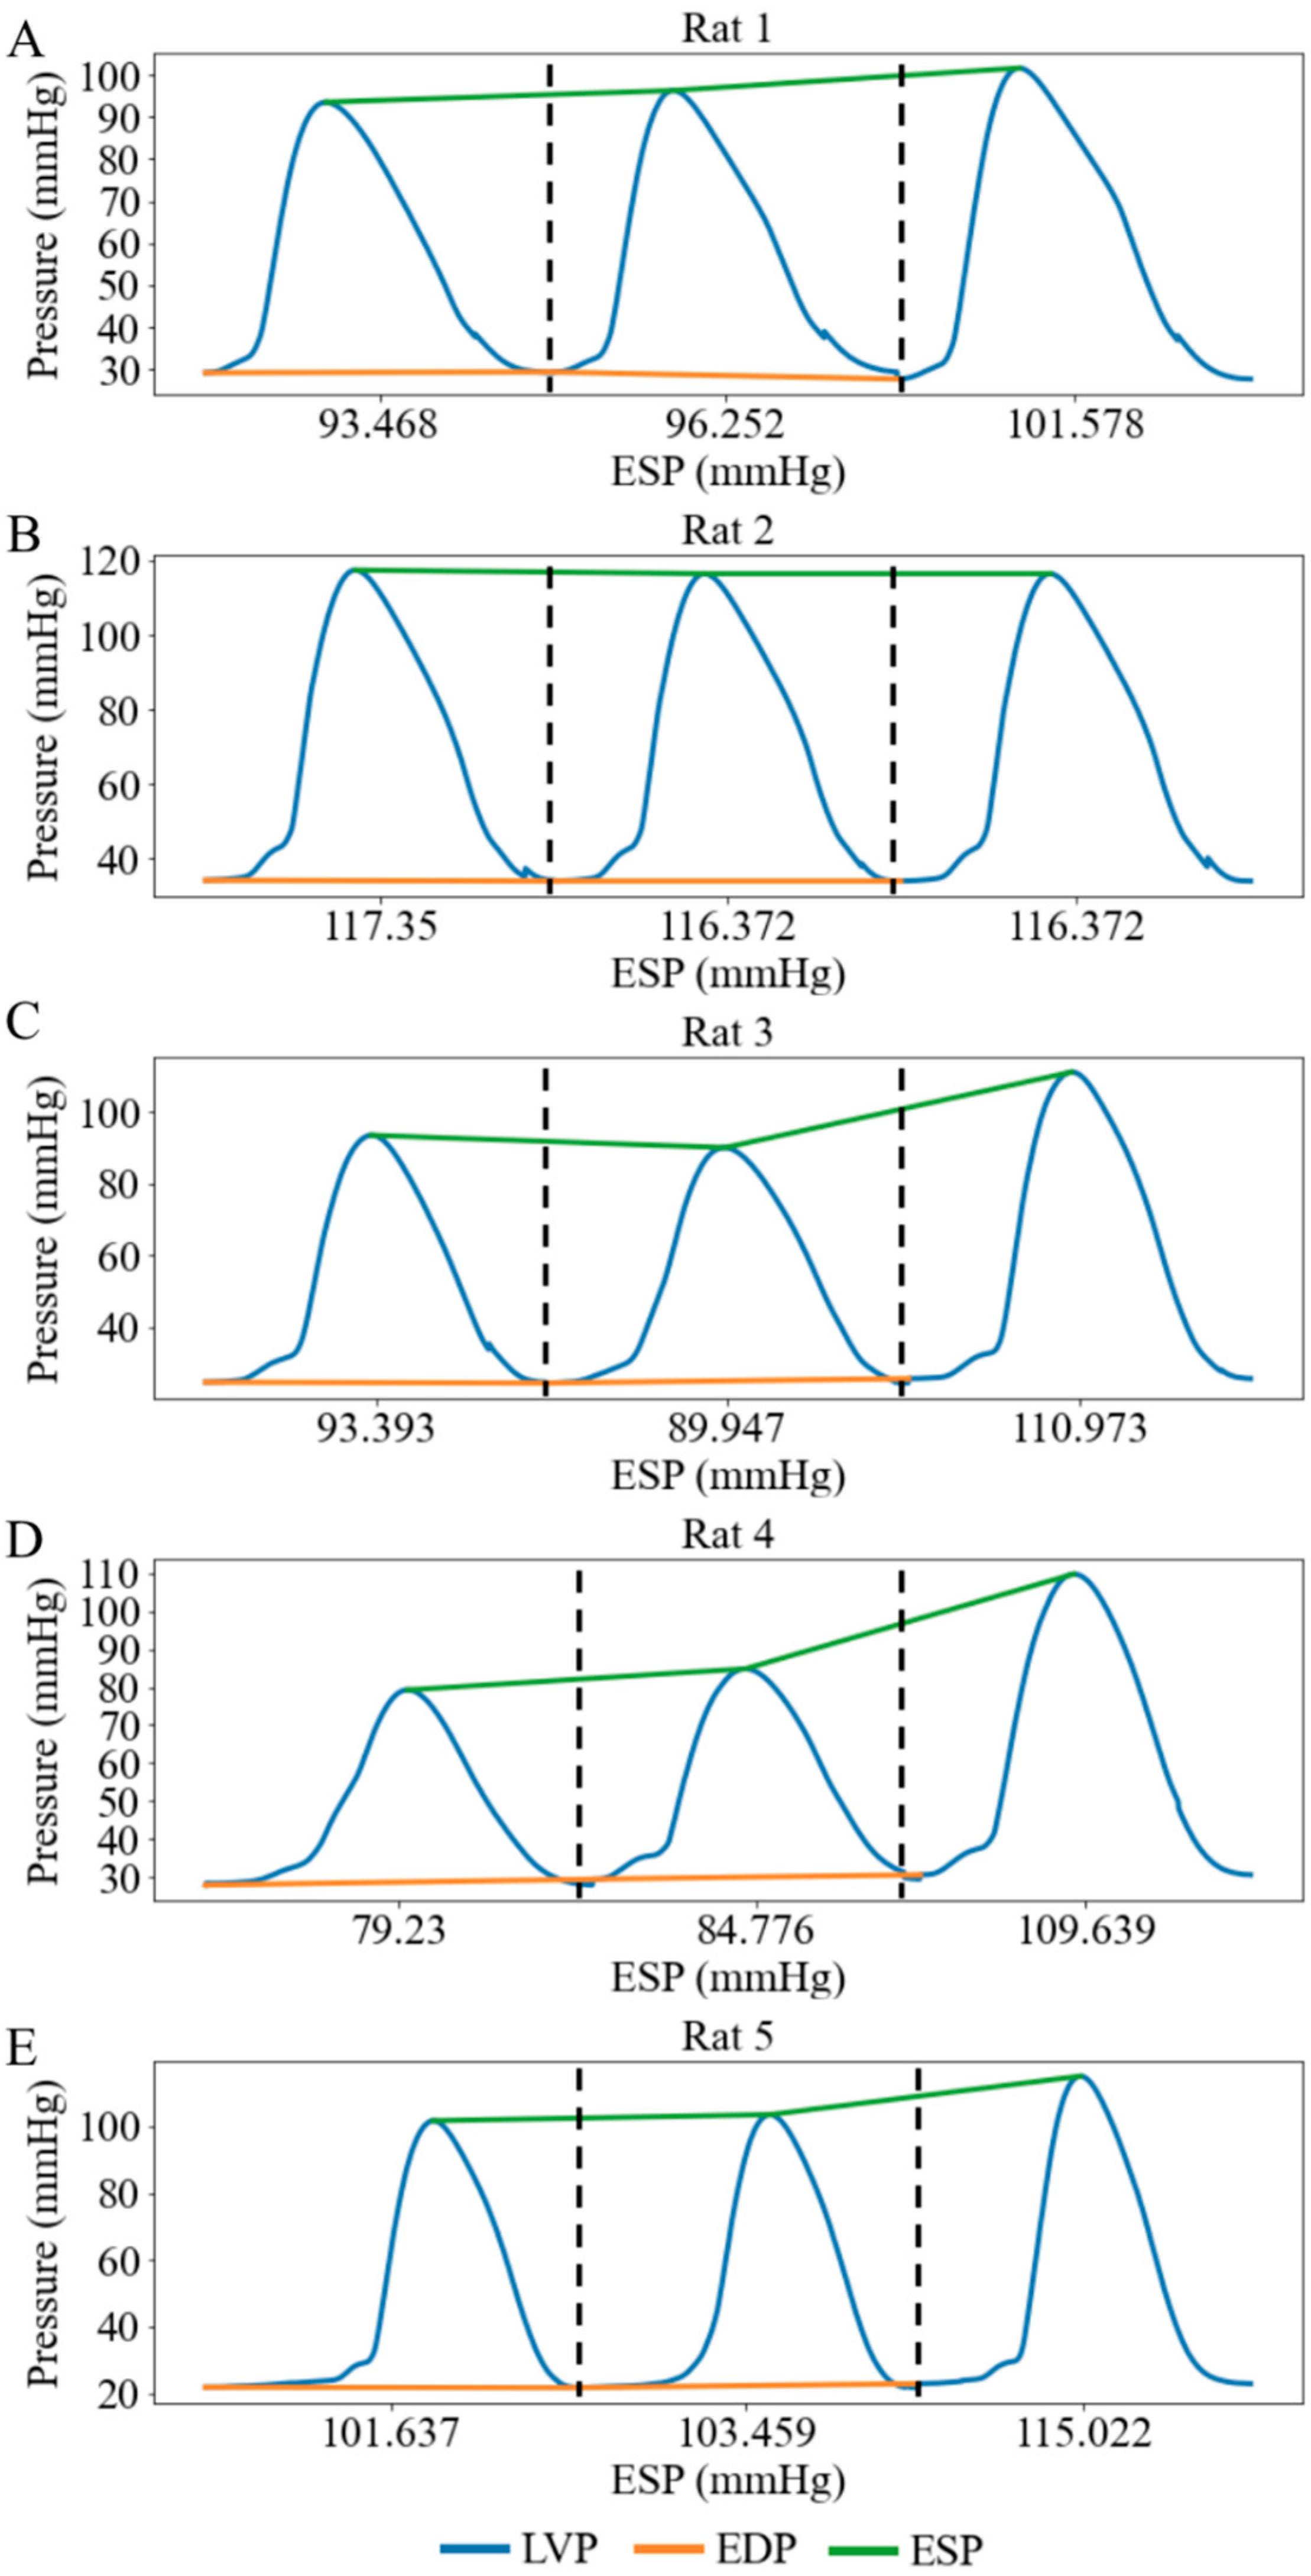
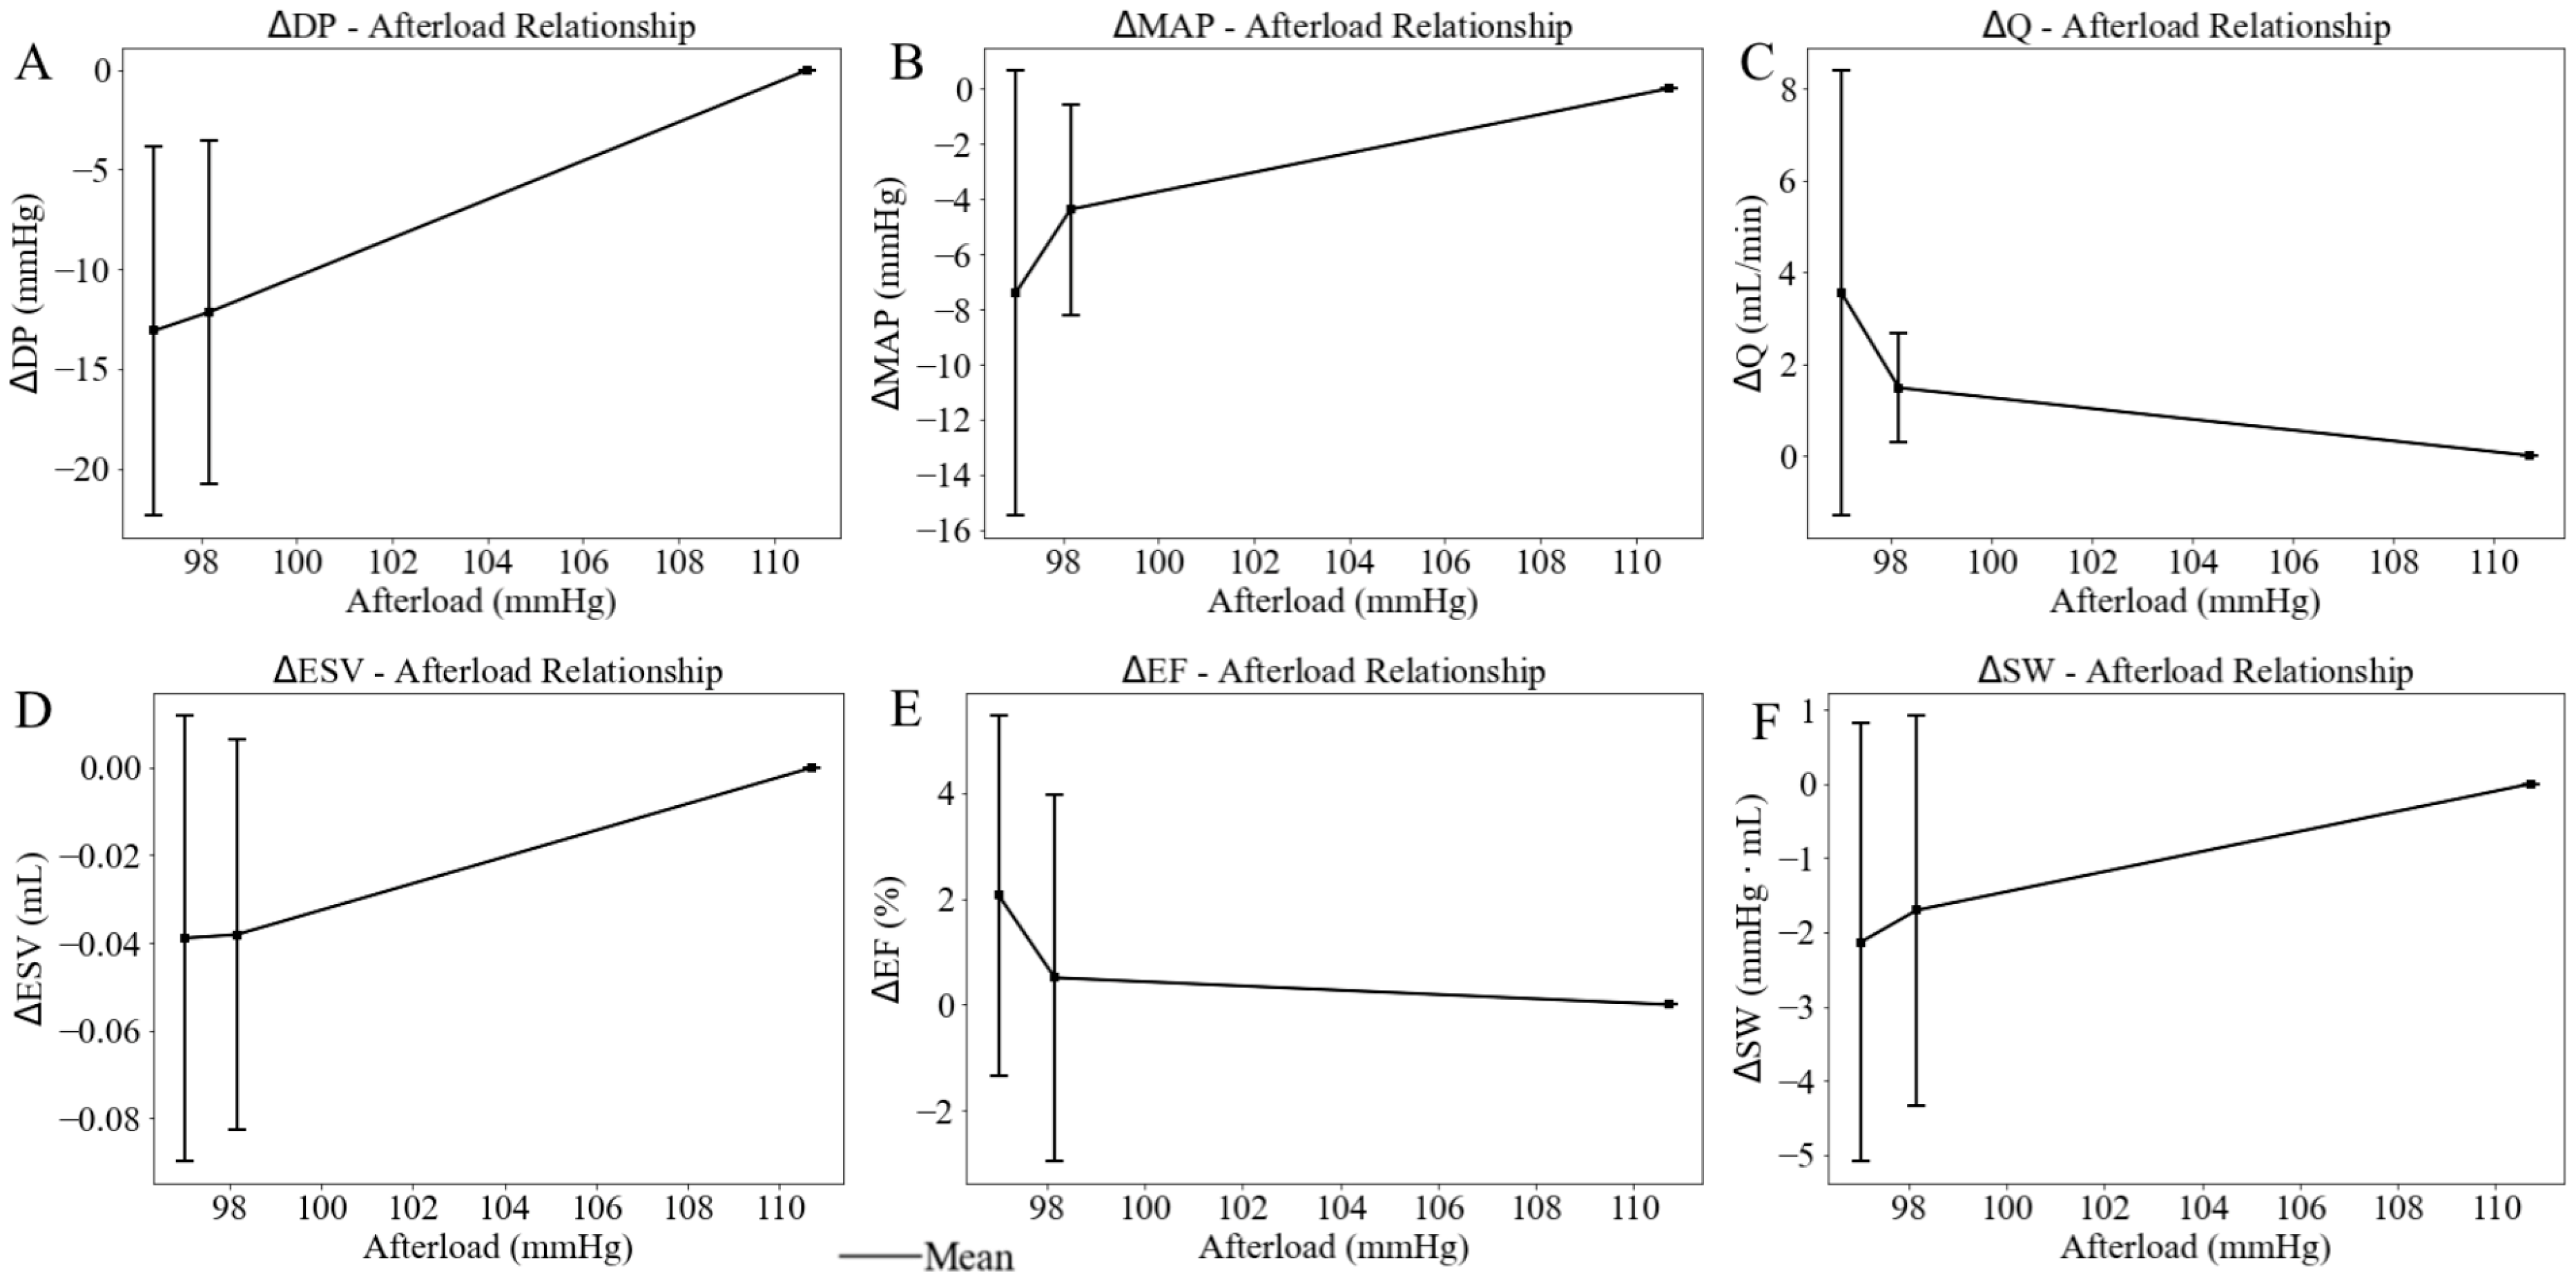
When the afterload chamber was transitioned from empty to fully filled with KHB, the LV afterload, measured as LV ESP, increased from a mean value of 97.02 mmHg at the lowest LV afterload to a mean value of 110.72 mmHg at the highest LV afterload (baseline) among five rats (Figure 6). Correspondingly, LV DP increased by 13.09 mmHg (from 69.45 at the lowest afterload to 82.54 mmHg at the highest afterload) and MAP increased by 7.40 mmHg (from 56.38 mmHg at the lowest afterload to 63.78 mmHg at the highest afterload) (Figure 7A,B). Together, these changes resulted in a 3.55 mL/min reduction in aortic blood flow (from 6.04 at the lowest afterload to 2.49 mL/min at the highest afterload) (p < 0.01) (Figure 7C). This reduction is primarily attributed to the 13.13% rise in MAP having a more substantial impedance effect on aortic flow from the LV to the aorta than the 18.85% increase in LV DP. When mean LV ESP increased from 97.00 to 111.00 mmHg, LV ESV increased by 0.04 mL (from 0.34 mL at the lowest afterload to 0.38 mL at the highest afterload) (Figure 7D), EF decreased by 2% (Figure 7E), and SW increased by 2.1 mmHg·mL (Figure 7F) (Table 2). As a result, the mean LV PV loop area (PVA) increased from 7.07 to 9.08 mmHg∙mL. Heart rate (HR) also increased by 12.37% from 167 to 177 beats per minute (bpm) with increased afterload.
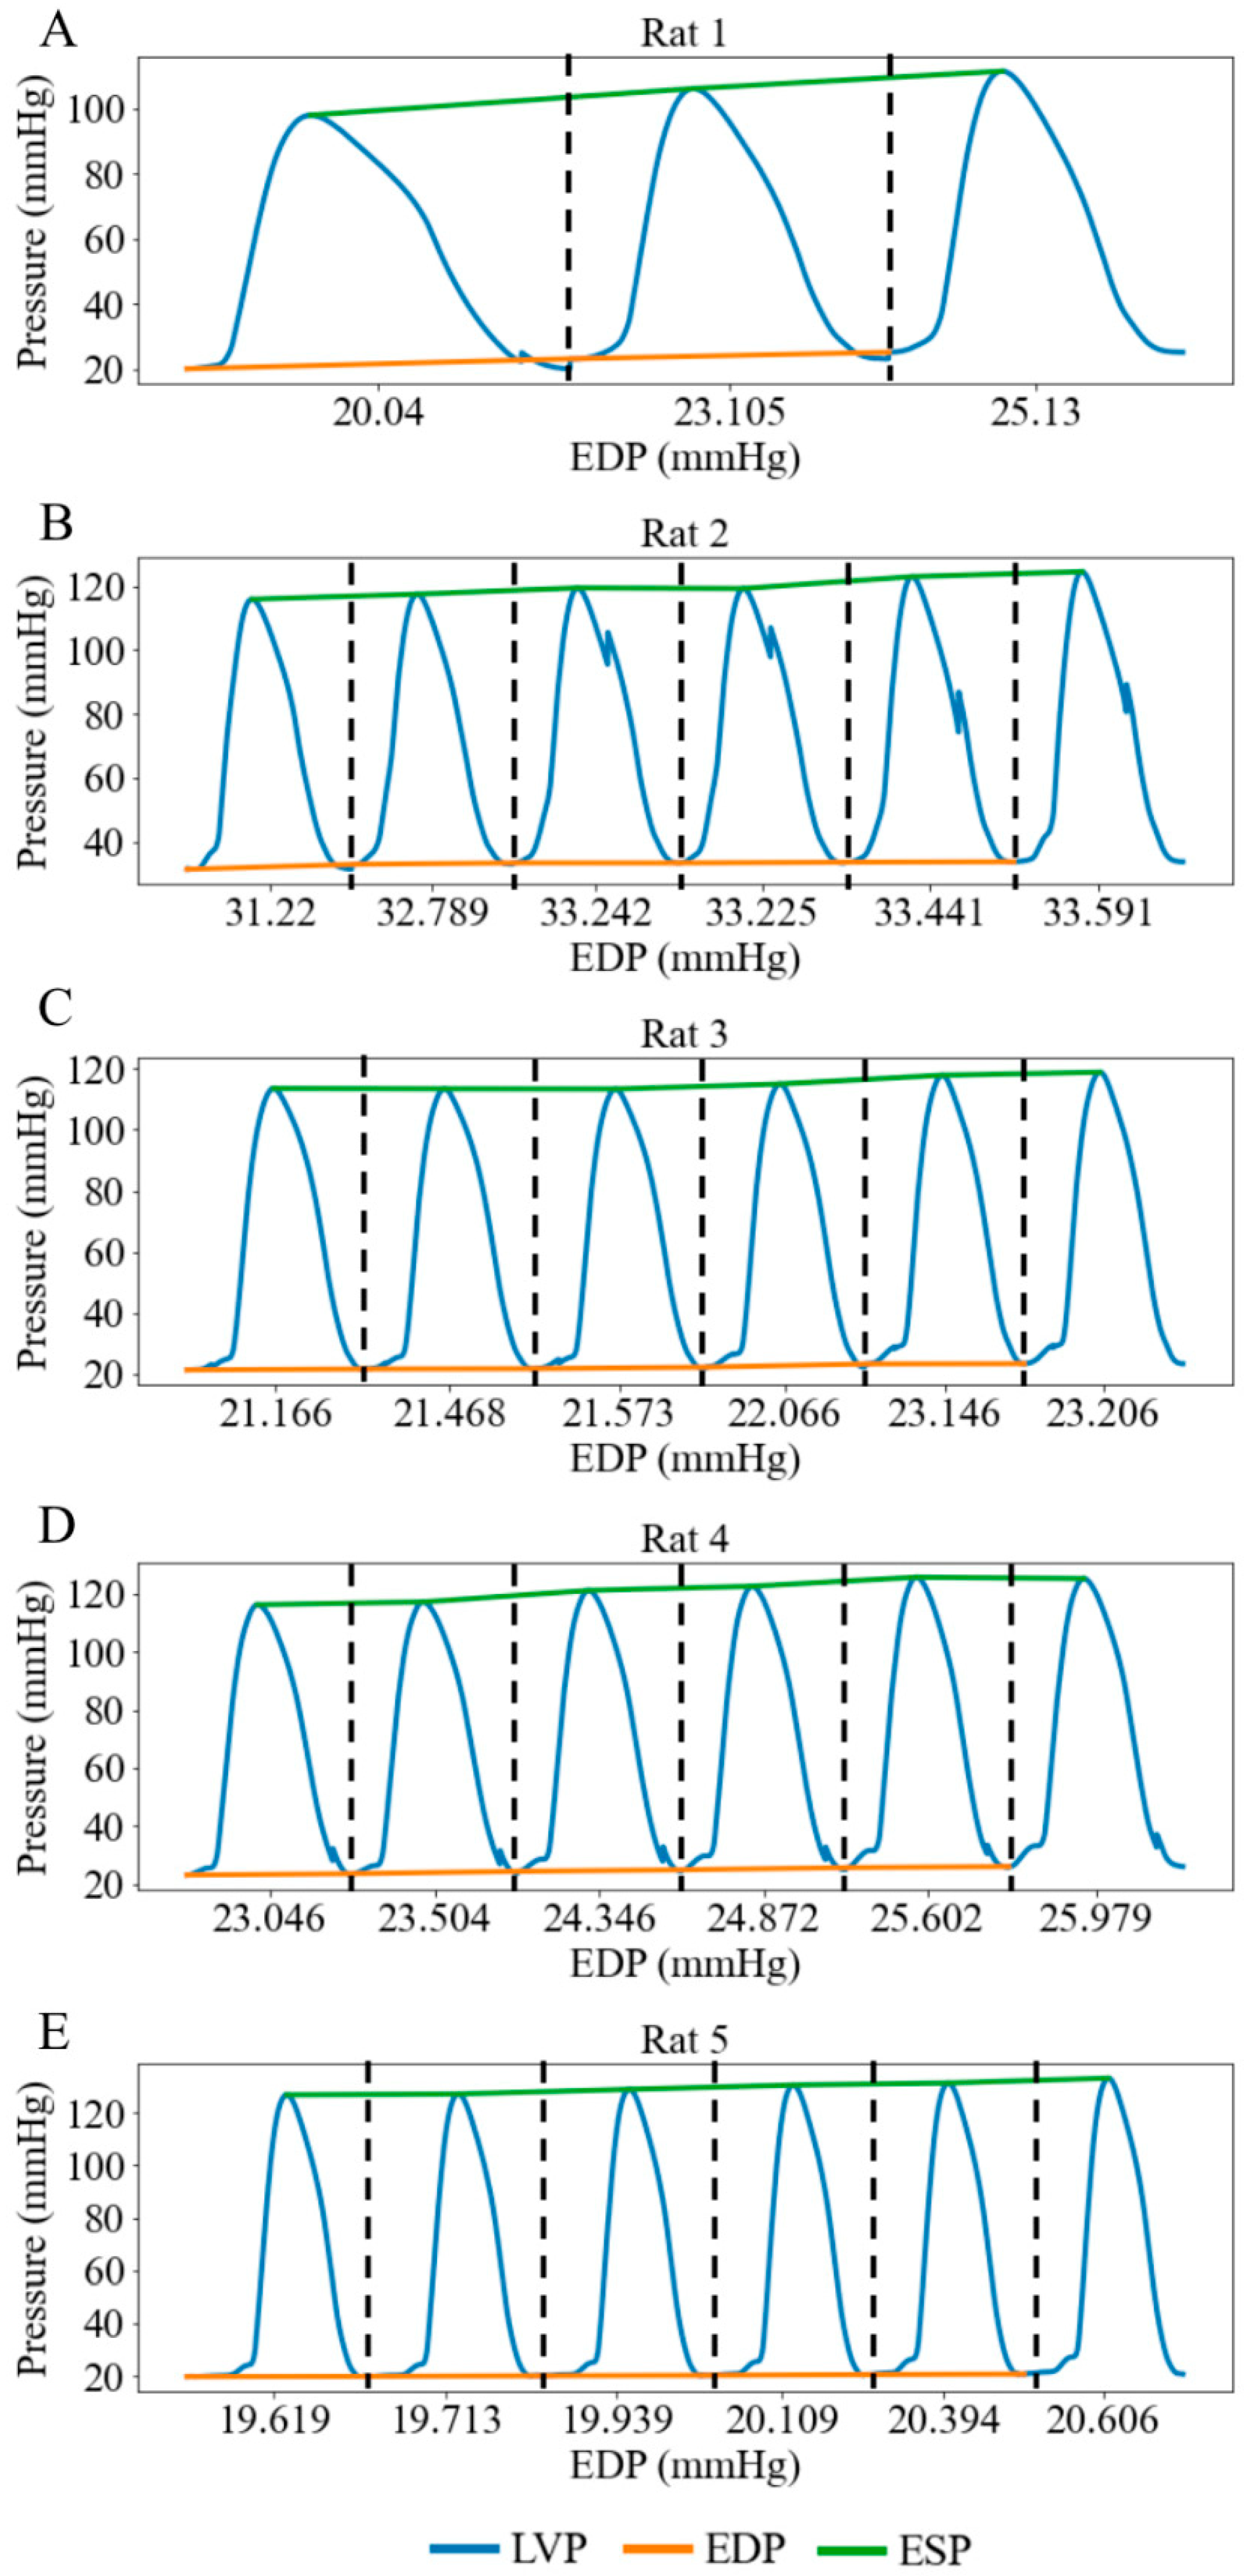
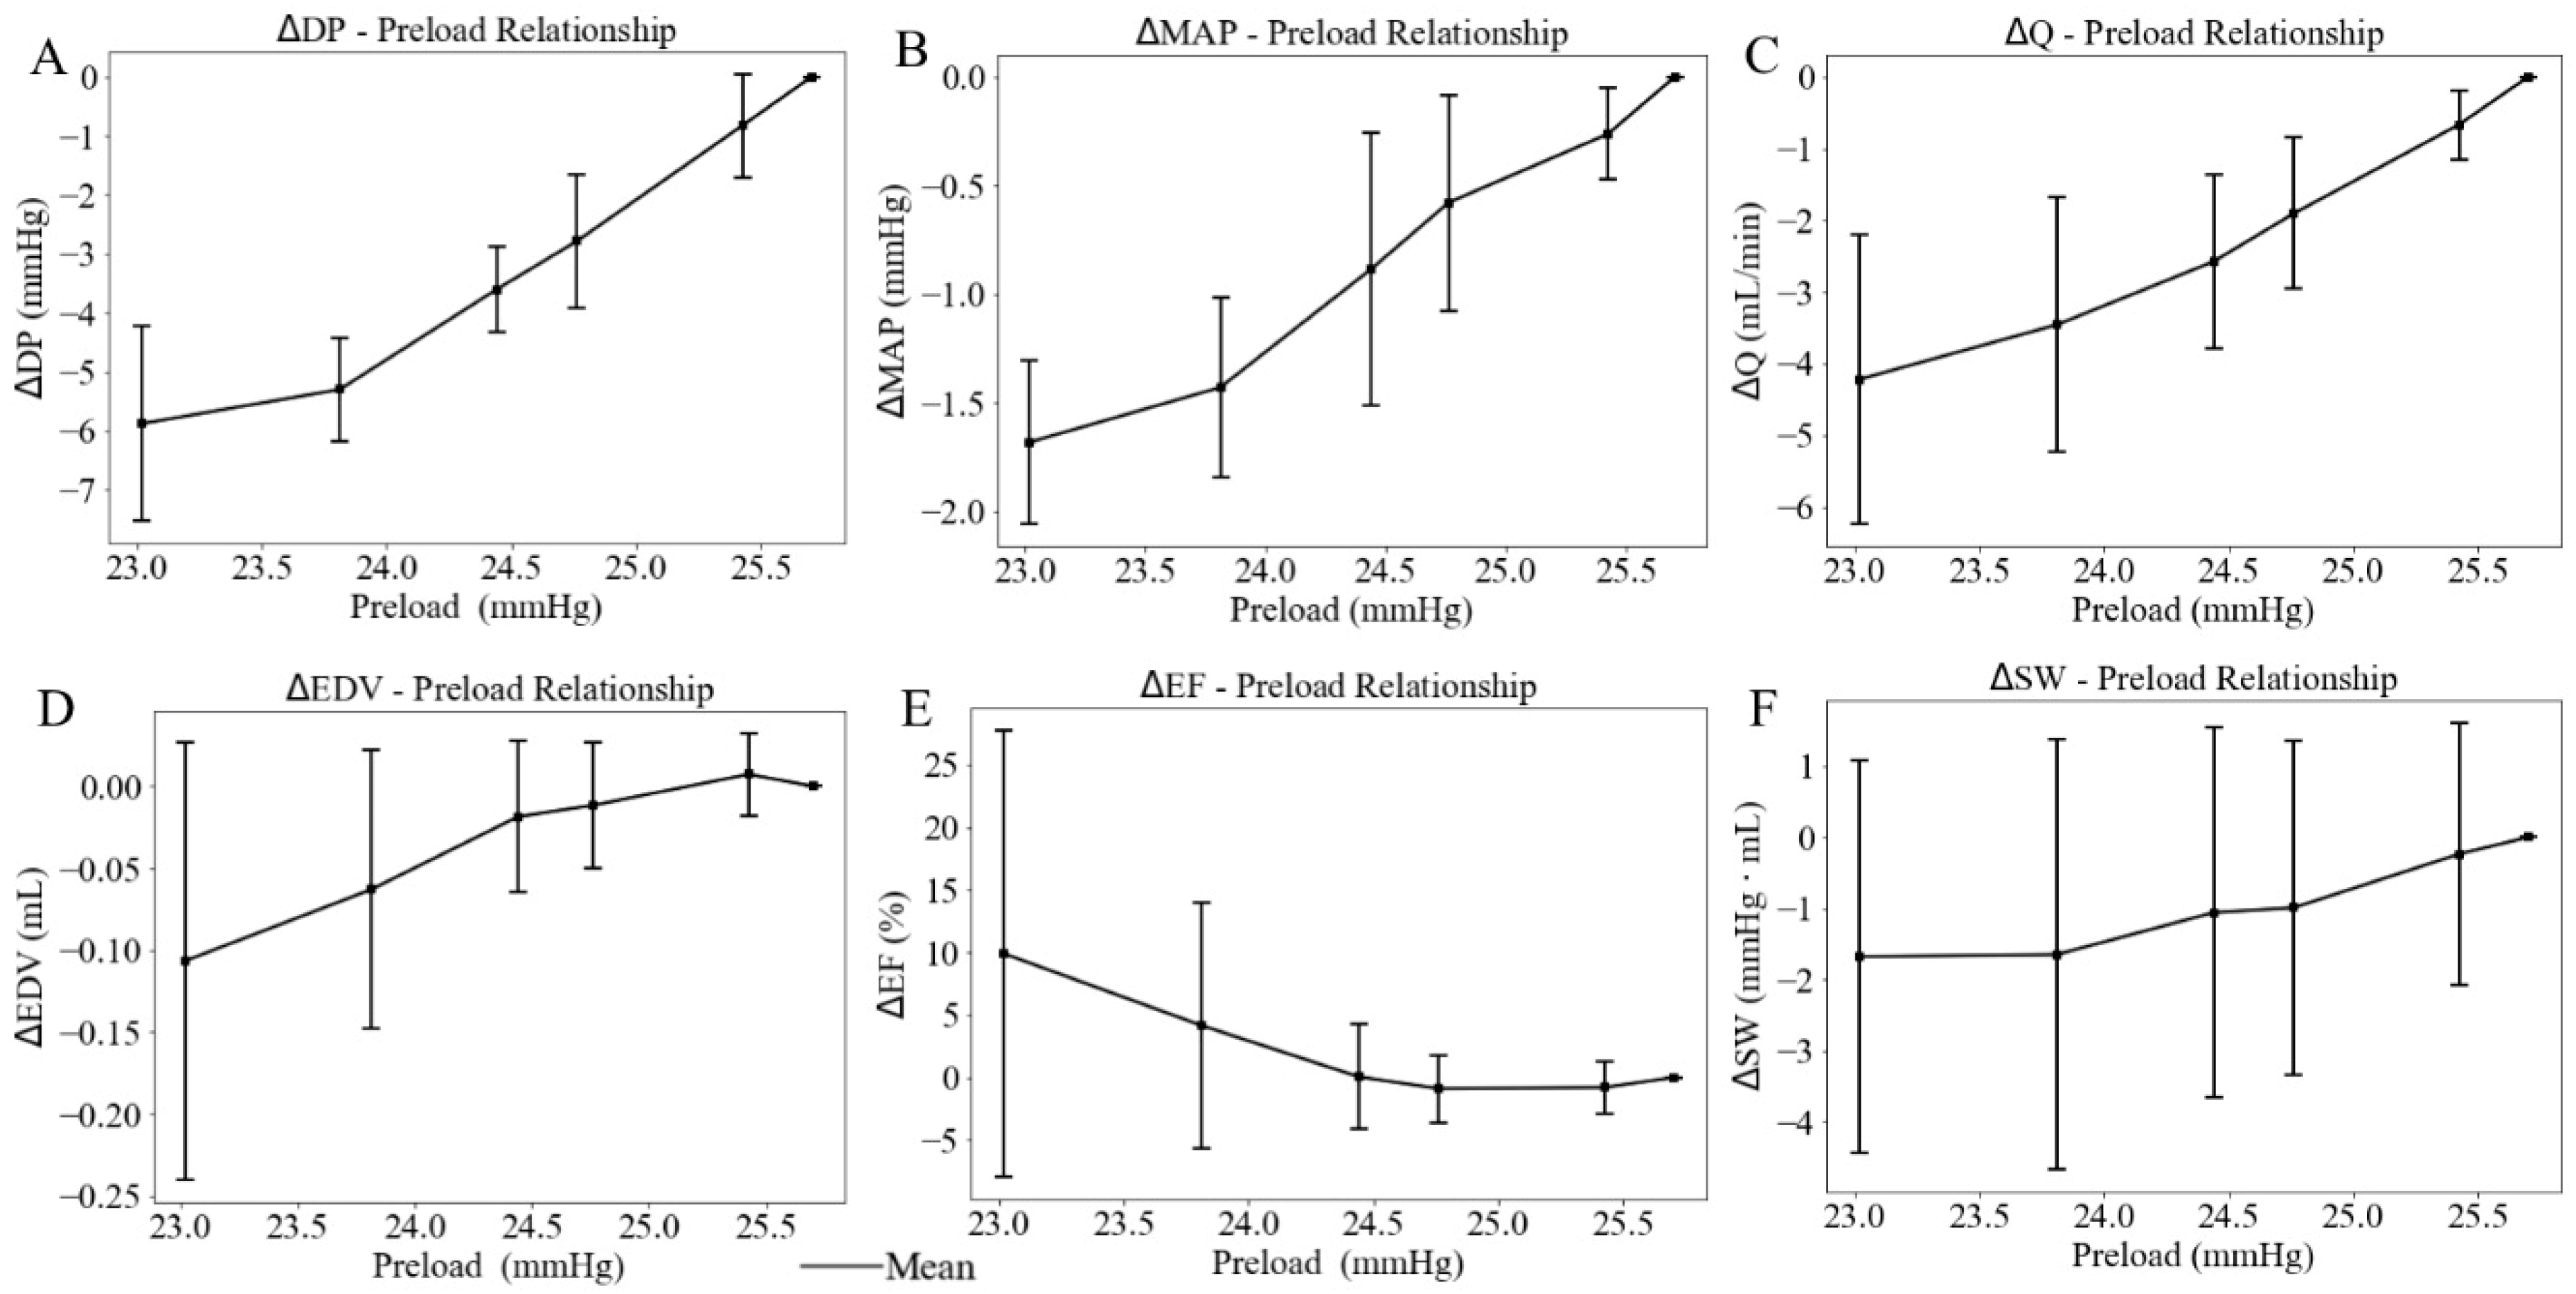
When the height of the preload chamber increased from 71.3 cm to 92.5 cm (baseline), LV preload measured as LV EDP increased from a mean value of 23.02 mmHg at the lowest preload to a mean value of 25.70 mmHg at the highest preload (Figure 8). Correspondingly, LV DP increased by 5.88 mmHg (from 91.03 at the lowest preload to 96.91 mmHg at the highest preload) (Figure 9A), and mean aortic pressure (MAP) increased by 1.68 mmHg (from 70.66 at the lowest preload to 72.34 mmHg at the highest preload), respectively (Figure 9B), resulting in an increase in aortic blood flow of 4.22 mL/min (from 5.34 at the lowest preload to 9.56 mL/min at the highest preload) (Figure 9C). This flow enhancement is primarily driven by the rise in LV DP (6.46%), which had a more substantial effect than the change in MAP (2.37%) on promoting blood flow from the LV to the aorta. As LV preload increased from 23.02 mmHg to 25.70 mmHg, LV EDV increased by 0.10 mL (from 0.49 at the lowest preload to 0.59 mL at the highest preload) (Figure 9D), while EF reduced by 10% (Figure 9E). SW improved by 1.68 mmHg·mL as the LV preload increased from 23.02 mmHg to 25.70 mmHg (Figure 9F) (Table 3). As a result, the mean LV PV loop area (PVA) increased from 13.39 to 19.55 mmHg·mL. Heart rate (HR) also increased by 5.38% from 186 to 196 beats per minute (bpm) with elevated LV preload.

4. Discussion

This study investigates the effects of LV mechanics on both LV and aortic functions via LV–aortic interactions by performing ex vivo beating rat heart experiments. The overall findings are as follows: (1) In the Langendorff mode, an increase in LV DP is positively correlated with an increase in aortic blood flow, with a gradient of 4.04 mmHg·min/mL. In the working heart mode, (2) an increase in LV afterload leads to increases in both LV DP and MAP while decreasing the aortic blood flow. This reduction occurs because the increase in MAP (13.13%) plays a more dominant role than the increase in LV DP (18.85%) in impeding flow from the LV to the aorta; (3) an increase in LV preload increases both LV DP and MAP, resulting in increased aortic blood flow. This is because the increase in the LV DP (6.46%) plays a more significant role than the increase in MAP (2.37%) in promoting flow from the LV to the aorta. These findings from Langendorff constant-flow retrograde perfusion indicate that increasing pump speed augments both aortic perfusion and ventricular filling, thereby enhancing myocardial contractility via the Frank–Starling mechanism. As the LV generates higher DP, the aortic valve experiences greater forward pressure, which directly translates into increased aortic flow. In contrast, results from working heart constant-pressure perfusion demonstrate that heart’s loading conditions strongly impact aortic blood flow. Specifically, high aortic pressure (elevated LV afterload) can severely limit forward blood flow, whereas increased ventricular filling (increased LV preload) can enhance blood flow. These observations highlight the importance of managing both afterload and preload in clinical conditions such as hypertension and heart failure with preserved ejection fraction.

4.1. Left Ventricle Function

In Langendorff constant-flow mode, both the LV ESP and EDP increase with rising pump speed, resulting in an average increase of 46.92% in LV DP (Figure 4). As the LV DP increases by 46.92%, aortic blood flow increases by 84.90%, showing a linear relationship with a gradient of 4.04 mmHg·min/mL.
In working heart constant-pressure mode, when afterload rises by 12.4%, LV DP increases by 15.9%, SW increases by 19.5%, ESV increases by 10.2%, and EF decreases by 5.6%. This trend reflects LV–aorta coupling, where a higher afterload requires the LV to generate greater pressure to eject blood, but the increased arterial resistance limits forward flow, leading to a rise in ESV and a decline in EF. A previous study in guinea pigs weighing 380–430 g found that a 14.3% increase in afterload led to a 13.6% increase in SW [36], a trend consistent with our measurements. This discrepancy may be attributed to species differences between rats and guinea pigs. In another study using a primed LV perfusion model in Yorkshire pigs, a 21.24% increase in preload resulted in a 6.07% increase in LV DP [37]. In comparison, our data showed a 6.1% increase in LV DP with only a 10.4% increase in preload. The prior study [37] involved cannulating and perfusing both the left and right sides of the heart, which may account for the observed differences in LV pressure response.
When LV preload increases by 10.4%, LV DP rises by 6.1%, SW increases by 9.4%, EDV increases by 19.0%, and EF decreases by 20.5% (Figure 9). Previous studies demonstrate that LV DP increases by 9.6% when LV preload rises by 60% in Adult Swiss-Webster mice weighing 35–40 g [38]. SW increases by 2.7% when preload rises by 33.4% in guinea pigs weighing 380–430 g [36].

4.2. Aortic Function

When LV afterload rises by 12.4%, MAP increases by 13.1%, while aortic blood flow decreases by 58.8%. This indicates that under high resistance, the aorta becomes an effective flow-limiting element, where pressure is maintained but forward volume is compromised. A previous study using preterm piglets (5 male, 4 female) [32] reported a 13.2% decrease in aortic blood flow when the LV afterload increased by 10% [32]. Another study, conducted with open-chest dog experiments, found that peak aortic blood flow decreased by 77.8% when the LV afterload was raised by 62.5% [39]. The changing trend of aortic blood flow with increased LV afterload is consistent with our measurements.
When LV preload rises by 10.4%, MAP increases by 2.4%, and aortic blood flow increases by 44.2%. This supports the concept that preload augmentation primarily enhances flow, while systemic pressure rises only slightly because the aorta can accommodate the increased stroke volume under baseline stiffness. Similarly, a previous study using the hearts of mice demonstrated that an increase in LV preload by 55% resulted in an increase in aortic blood flow by 100% [40]. Another study using preterm piglets (five male and four female) [32] demonstrated a 6.4% increase in aortic blood flow when LV preload was elevated by 14.3%, which aligns with our findings. These discrepancies between previous studies and our measurements are likely attributable to species-specific cardiovascular compliance.

4.3. Left Ventricle–Aorta Interaction

In Langendorff perfusion, both LV ESP and EDP increase with an increase in pump speed, leading to a rise in aortic blood flow. Specifically, when DP increases by 46.9%, aortic blood flow increases by 84.9%. Mechanistically, a higher pump speed increases initial sarcomere stretch to enhance contractile force via the Frank–Starling effect, and thereby drives the 84.9% increase in aortic flow.
As the afterload rises, the mean LVP and MAP increase by 18.85% and 13.13%, respectively, resulting in a 58.8% reduction in aortic blood flow. In contrast, when the preload increases, mean LVP and MAP increase by 6.46% and 2.37%, respectively, leading to an increase in aortic blood flow by 44.2%. Compared to previous studies, the changes in preload and afterload in our study are smaller in magnitude, likely due to the overall higher baseline values [26]. In the earlier study, afterload and preload ranged from 20.0 to 55.0 mmHg and 2.0 to 16.0 mmHg, respectively [26], whereas in our study, afterload varied from 97.0 to 110.7 mmHg, and preload ranged from 23.0 to 25.7 mmHg.
This ex vivo LV–aorta experiment demonstrates that preload primarily enhances aortic flow through volume-driven mechanisms, whereas afterload limits flow through pressure-dominated ventricular–vascular coupling. These mechanistic insights are clinically relevant for disease diagnosis and treatments because they replicate core hemodynamic patterns observed in cardiovascular disease. In heart failure, the model can simulate how impaired ventricular contractility diminishes the heart’s ability to augment flow under a preload challenge. In aortic stenosis, the system can reproduce pressure-overload conditions to examine how elevated afterload reduces forward flow and impairs LV–aortic interaction. Similarly, in hypertension, this ex vivo approach can isolate the effects of chronically elevated systemic pressure on ventricular mechanics and ejection, providing a controlled platform to study pressure-loading effects relevant to diagnosis and treatment strategies.

5. Conclusions

This study investigates the effects of LV afterload and preload on LV–aorta interaction using isolated ex vivo beating rat heart experiments. We found that when afterload increases by 12.4%, aortic blood flow decreases by 58.8%. Conversely, when LV preload increases by 10.4%, aortic blood flow increases by 44.2%. These results suggest that aortic function predominantly influences LV–aortic interactions when afterload increases, while LV function plays a dominant role when preload increases. In summary, these findings contribute to a mechanistic understanding of the mechanical interactions between the LV and aorta, informing clinical approaches to managing conditions involving altered afterload or preload.
Limitations: As this was a pilot study which aimed to establish the feasibility of the setup, despite the limited sample size, we observed statistically significant differences (p < 0.01) for some variables. To improve statistical power and reproducibility, we will increase the number of rats in future studies. A direct load-independent index of myocardial contractility (e.g., end-systolic pressure–volume relationship) was not obtained in this study. Although the constant coronary perfusion pressure and consistent LV developed pressure at a reference preload suggest that the inotropic state remained stable during load variations, we cannot entirely exclude the possibility that changes in contractility contributed to the observed variations in LV performance and aortic flow. Future work incorporating direct contractility measurements will help further isolate the effects of preload and afterload from intrinsic myocardial properties.

Author Contributions

Conceptualization, L.F.; methodology, L.F., G.H. and C.C.; formal analysis, C.C. and L.F.; investigation, C.C., G.H. and L.F.; data curation, C.C.; writing—original draft preparation, C.C.; writing—review and editing, L.F. and G.H.; visualization, C.C.; supervision, L.F.; project administration, L.F.; funding acquisition, L.F. All authors have read and agreed to the published version of the manuscript.

Funding

This research received no external funding.

Institutional Review Board Statement

The animal study protocol was approved by the Institutional Review Board of Medical College of Wisconsin (AUA00008091 on 03/08/2023).

Informed Consent Statement

Not applicable.

Data Availability Statement

The original contributions presented in this study are included in the article. Further inquiries can be directed to the corresponding author.

Conflicts of Interest

The authors declare no conflicts of interest.

References

  1. Bell, V.; McCabe, E.L.; Larson, M.G.; Rong, J.; Merz, A.A.; Osypiuk, E.; Lehman, B.T.; Stantchev, P.; Aragam, J.; Benjamin, E.J.; et al. Relations between aortic stiffness and left ventricular mechanical function in the community. J. Am. Heart Assoc. 2017, 6, e004903. [Google Scholar] [CrossRef]
  2. Thompson, R.; Yacoub, M.; Ahmed, M.; Seabra-Gomes, R.; Rickards, A.; Towers, M.; London, F. Influence of Preoperative Left Ventricular Function on Results of Homograft Replacement of the Aortic Valve for Aortic Stenosis. Am. J. Cardiol. 1979, 43, 929–938. [Google Scholar] [CrossRef] [PubMed]
  3. Fukuda, N.; Sasaki, D.; Ishiwata, S.I.; Kurihara, S. Length Dependence of Tension Generation in Rat Skinned Cardiac Muscle Role of Titin in the Frank-Starling Mechanism of the Heart. Circulation 2001, 104, 1639–1645. [Google Scholar] [CrossRef]
  4. Mashima, H. MINIRE VIEW Force-velocity Relation and Contractility in Striated Muscles. Jpn. J. Physiol. 1984, 34, 1–7. [Google Scholar] [CrossRef] [PubMed]
  5. Loiselle, D.S.; Taberner, A.J.; Tran, K.; Han, J.C. Thermodynamic inconsistency disproves the Suga-Sagawa theory of cardiac energetics. Prog. Biophys. Mol. Biol. 2021, 164, 81–91. [Google Scholar] [CrossRef]
  6. Suga, H.; Sagawa, K. Instantaneous Pressure-Volume Relationships and Their Ratio in the Excised, Supported Canine Left Ventricle. Circ. Res. 1974, 35, 117–126. [Google Scholar] [CrossRef]
  7. Setser, R.; Henson Ii, R.E.; Allen, J.S.; Fischer, S.E.; Wickline, S.A.; Lorenz, C.H. Left Ventricular Contractility is Impaired Following Myocardial Infarction in the Pig and Rat: Assessment by the End Systolic Pressure-Volume Relation Using a Single-Beat Estimation Technique and Cine Magnetic Resonance Imaging. Ann. Biomed. Eng. 2000, 28, 484–494. [Google Scholar] [CrossRef]
  8. Tachibana, H.; Takaki, M.; Lee, S.; Ito, H.; Yamaguchi, H.; Suga, H. New mechanoenergetic evaluation of left ventricular contractility in in situ rat hearts. Am. J. Physiol. Circ. Physiol. 2025, 272, H2671–H2678. [Google Scholar] [CrossRef]
  9. Perlirri, S.; Soldà, P.L.; Piepoli, M.; Calciati, A.; Paro, M.; Marchetti, G.; Meno, F.; Finardi, G.; Bernardi, L. Time course of pressure and flow in ascending aorta during ejection. Int. J. Cardiol. 1991, 30, 169–179. [Google Scholar] [CrossRef]
  10. Mekkaoui, C.; Rolland, P.H.; Friggi, A.; Rasigni, M.; Mesana, T.G. Pressure-flow loops and instantaneous input impedance in the thoracic aorta: Another way to assess the effect of aortic bypass graft implantation on myocardial, brain, and subdiaphragmatic perfusion. J. Thorac. Cardiovasc. Surg. 2003, 125, 699–710. [Google Scholar] [CrossRef] [PubMed]
  11. Ross, J., Jr. Point of view myocardial perfusion-contraction matching implications for coronary heart disease and hibernation. Circulation 1991, 83, 1076–1084. [Google Scholar] [CrossRef] [PubMed]
  12. Ross, J.; Braunwald, E. Studies on Starling’s Law of the Heart IX. The Effects of Impeding Venous Return on Performance of the Normal and Failing Human Left Ventricle. Circulation 1964, 30, 719–727. [Google Scholar] [CrossRef]
  13. Burkhoff, D.; De Tombe, P.P.; Hunter, W.C.; Kass, D.A.; Contractize, D.A.K. contractile strength and mechanical efficiency of left ventricle are enhanced by physiological afterload. Am. J. Physiol. Circ. Physiol. 1991, 260, H569–H578. [Google Scholar] [CrossRef]
  14. Fan, L.; Namani, R.; Choy, J.S.; Kassab, G.S.; Lee, L.C. Transmural Distribution of Coronary Perfusion and Myocardial Work Density Due to Alterations in Ventricular Loading, Geometry and Contractility. Front. Physiol. 2021, 12, 744855. [Google Scholar] [CrossRef]
  15. Fan, L.; Namani, R.; Choy, J.S.; Awakeem, Y.; Kassab, G.S.; Lee, L.C. Role of coronary flow regulation and cardiac-coronary coupling in mechanical dyssynchrony associated with right ventricular pacing. Am. J. Physiol. Hear. Circ. Physiol. 2021, 320, H1037–H1054. [Google Scholar] [CrossRef]
  16. Fan, L.; Namani, R.; Choy, S.; Kassab, G.S.; Lee, L.C. Effects of mechanical dyssynchrony on coronary flow: Insights from a computational model of coupled coronary perfusion with systemic circulation. Front. Physiol. 2020, 11, 915. [Google Scholar] [CrossRef]
  17. Schipke, J.D.; Stocks, I.; Sunderdiek, U.; Arnold, G. Effect of changes in aortic pressure and in coronary arterial pressure on left ventricular geometry and function Anrep vs. gardenhose effect. Basic Res. Cardiol. 1993, 88, 621–637. [Google Scholar] [CrossRef]
  18. Ichihara, K.; Neely, J.R.; Siehl, D.L.; Morgan, H.E. Utilization of leucine by working rat heart. Am. J. Physiol. Metab. 1980, 239, E430–E436. [Google Scholar] [CrossRef]
  19. Neto-Neves, E.M.; Frump, A.L.; Vayl, A.; Kline, J.A.; Lahm, T. Isolated heart model demonstrates evidence of contractile and diastolic dysfunction in right ventricles from rats with sugen/hypoxia-induced pulmonary hypertension. Physiol. Rep. 2017, 5, e13438. [Google Scholar] [CrossRef]
  20. Herr, D.J.; Aune, S.E.; Menick, D.R. Induction and assessment of ischemia-reperfusion injury in langendorffperfused rat hearts. J. Vis. Exp. 2015, 27, e52908. [Google Scholar] [CrossRef]
  21. Ashruf, J.F.; Ince, C.; Bruining, H.A. Regional ischemia in hypertrophic Langendorff-perfused rat hearts. Am. J. Physiol. Circ. Physiol. 1999, 277, H1532–H1539. [Google Scholar] [CrossRef]
  22. Bell, R.M.; Mocanu, M.M.; Yellon, D.M. Retrograde heart perfusion: The Langendorff technique of isolated heart perfusion. J. Mol. Cell. Cardiol. 2011, 50, 940–950. [Google Scholar] [CrossRef]
  23. Fan, L.; Ziaei-Rad, V.; Bazil, J.; Lee, L.C. Connecting developed pressure-Preload relationship in ex-vivo beating heart with cellular sarcomere lengh-Tension relationship. J. Biomech. 2025, 183, 112597. [Google Scholar] [CrossRef]
  24. Akar, J.G.; Akar, F.G. Mapping arrhythmias in the failing heart: From Langendorff to patient. J. Electrocardiol. 2006, 39, S19–S23. [Google Scholar] [CrossRef]
  25. Headrick, J.P.; Peart, J.; Hack, B.; Flood, A.; Matherne, G.P. Functional properties and responses to ischaemia-reperfusion in Langendorff perfused mouse heart. Exp. Physiol. 2001, 86, 703–716. [Google Scholar] [CrossRef]
  26. DeWitt, E.S.; Black, K.J.; Kheir, J.N. Rodent working heart model for the study of myocardial performance and oxygen consumption. J. Vis. Exp. 2016, 16, e54149. [Google Scholar] [CrossRef]
  27. Reichelt, M.E.; Willems, L.; Hack, B.A.; Peart, J.N.; Headrick, J.P. Cardiac and coronary function in the Langendorff-perfused mouse heart model. Exp. Physiol. 2009, 94, 54–70. [Google Scholar] [CrossRef]
  28. Itter, G.; Jung, W.; Linz, W. The isolated working heart model in infarcted rat hearts. Lab. Anim. 2005, 39, 178–193. [Google Scholar] [CrossRef]
  29. Pigot, H.; Soltesz, K.; Paskevicius, A.; Liao, Q.; Sjöberg, T.; Steen, S. A novel nonlinear afterload for ex vivo heart evaluation: Porcine experimental results. Artif. Organs 2022, 46, 1794–1803. [Google Scholar] [CrossRef]
  30. Alavi, R.; Aghilinejad, A.; Wei, H.; Niroumandi, S.; Wieman, S.; Pahlevan, N.M. A coupled atrioventricular-aortic setup for invitro hemodynamic study of the systemic circulation: Design, fabrication, and physiological relevancy. PLoS ONE 2022, 17, e0267765. [Google Scholar] [CrossRef]
  31. Knight, W.E.; Ali, H.R.; Nakano, S.J.; Wilson, C.E.; Walker, L.A.; Woulfe, K.C. Ex vivo Methods for Measuring Cardiac Muscle Mechanical Properties. Front. Physiol. 2021, 11, 616996. [Google Scholar] [CrossRef]
  32. Eiby, Y.A.; Lumbers, E.R.; Headrick, J.P.; Lingwood, B.E. Left ventricular output and aortic blood flow in response to changes in preload and afterload in the preterm piglet heart. Am. J. Physiol. Regul. Integr. Comp. Physiol. 2012, 303, 769–777. [Google Scholar] [CrossRef] [PubMed]
  33. Usai, D.S.; Aasum, E.; Thomsen, M.B. The isolated, perfused working heart preparation of the mouse—Advantages and pitfalls. Acta Physiol. 2025, 241, e70023. [Google Scholar] [CrossRef] [PubMed]
  34. Müller-Strahl, G.; Hemker, J.; Zimmer, H.-G. Afterload-and preload-dependent interactions in the isolated biventricular working rat heart. Exp. Clin. Cardiol. 2002, 7, 180. [Google Scholar] [PubMed]
  35. Pappritz, K.; Grune, J.; Klein, O.; Hegemann, N.; Dong, F.; El-Shafeey, M.; Lin, J.; Kuebler, W.M.; Kintscher, U.; Tschöpe, C.; et al. Speckle-tracking echocardiography combined with imaging mass spectrometry assesses region-dependent alterations. Sci. Rep. 2020, 10, 3629. [Google Scholar] [CrossRef]
  36. Bardenheuer, H.; Schrader, J. Relationship between Myocardial Oxygen Consumption, Coronary Flow, and Adenosine Release in an Improved Isolated Working Heart Preparation of Guinea Pigs. Circ. Res. 1983, 52, 263–271. [Google Scholar] [CrossRef]
  37. Xin, L.; Yao, W.; Peng, Y.; Lu, P.; Ribeiro, R.; Wei, B.; Gellner, B.; Simmons, C.; Zu, J.; Sun, Y.; et al. Primed left ventricle heart perfusion creates physiological aortic pressure in porcine hearts. ASAIO J. 2020, 66, 55–63. [Google Scholar] [CrossRef]
  38. Larsen, T.S.; Belke, D.D.; Sas, R.; Giles, W.R.; Severson, D.L.; Lopaschuk, G.D.; Tyberg, J.V. The isolated working mouse heart: Methodological considerations. Pflug. Arch 1999, 437, 979–985. [Google Scholar] [CrossRef]
  39. Macgregor, D.C.; Covell, J.W.; Mahler, F.; Dilley, R.B.; Ross, J.; Relations, J.R. Relations between afterload, stroke volume, and descending limb of Starling’s curve. Am. J. Physiol. Content 1974, 227, 884–890. [Google Scholar] [CrossRef]
  40. Bittner, H.B.; Chen, E.P.; Peterseim, D.S.; Van Trigt, P. A Work-Performing Heart Preparation for Myocardial Performance Analysis in Murine Hearts. J. Surg. Res. 1996, 64, 57–62. [Google Scholar] [CrossRef]
Figure 1. ECHOs of the LV in (A) longitudinal view and (B) short view.
Fluids 10 00234 g001
Figure 2. (A) Retrograde perfusion in Langendorff mode (indicated by red arrow) and antegrade perfusion in working heart mode (indicated by green arrow). (B) Isolated heart perfusion system.
Fluids 10 00234 g002
Figure 3. LV pressure waveforms at different pump speeds in 5 cases under retrograde Langendorff constant-flow perfusion condition. (A) Rat 1, (B) Rat 2, (C) Rat 3, (D) Rat 4, (E) Rat 5. Each pressure waveform under different pump speeds is isolated by black dash line.
Fluids 10 00234 g003
Figure 4. The relationship between the changes in the LV developed pressure and aortic blood flow.
Fluids 10 00234 g004
Figure 5. (A) LV pressure–volume loops (PV loops), and (B) representative LV pressure and volume waveforms under working heart constant-pressure mode.
Fluids 10 00234 g005
Figure 6. LV pressure waveforms at three different afterloads represented by LV ESP in 5 cases under working heart conditions. (A) Rat 1, (B) Rat 2, (C) Rat 3, (D) Rat 4, (E) Rat 5. Each pressure waveform under different afterloads is isolated by black dash line.
Fluids 10 00234 g006
Figure 7. Effects of the LV afterload on average value of (A) developed pressure, (B) mean aortic pressure (MAP), (C) aortic blood flow (Q), (D) end-diastolic volume (EDV), (E) ejection fraction (EF), and (F) stroke work (SW), with standard deviation. In this plot, LV afterload is represented by LV ESP (x-axis).
Fluids 10 00234 g007
Figure 8. LV pressure waveforms at three different LV preloads in rat 1 and six different LV preloads in rats 2-5 under working heart conditions. LV preload is represented by LV EDP (x-axis). (A) Rat 1, (B) Rat 2, (C) Rat 3, (D) Rat 4, (E) Rat 5. Each pressure waveform under different preloads is isolated by black dash line.
Fluids 10 00234 g008
Figure 9. Effects of the LV preload on average value of (A) developed pressure, (B) mean aortic pressure (MAP), (C) flow (Q), (D) end-diastolic volume (EDV), (E) ejection fraction (EF), and (F) stroke work (SW), with standard deviation. In this plot, LV afterload is represented by LV EDP (x-axis).
Fluids 10 00234 g009
Table 1. ECHO analyses for 5 rats.
Rat No.EDV (mL)ESV (mL)SV (mL)EF
(%)
CO (mL/min)GLS
(%)
GCS (%)HR (bpm)
10.350.070.2778.8749.17−13.05−0.49339
20.450.240.2247.6564.09−15.26−14.74246
30.390.120.2769.1162.67−23.84−6.13309
40.490.180.3164.2459.31−8.41−11.84344
50.550.200.3563.5685.07−25.19−14.74350
Mean ± SD0.45 ± 0.080.16 ± 0.060.28 ± 0.0564.69 ± 11.3264.06 ± 13.11−17.15 ± 7.18−9.59 ± 6.18317.60 ± 43.03
Table 2. Average changes in LV and aortic functions with varying LV afterload over 5 rats.
AfterloadESP (mmHg)DP (mmHg)MAP (mmHg)Q (mL/min)ESV (mL)EF (%)SW (mmHg∙mL)PVA (mmHg∙mL)HR (bpm)
197.02 ± 12.4669.45 ± 11.4356.38 ± 11.576.04 ± 4.320.34 ± 0.1736.72 ± 18.238.84 ± 2.137.07 ± 5.32167 ± 20.56
298.16 ± 11.0570.38 ± 10.3959.4 ± 7.033.96 ± 2.650.34 ± 0.1735.17 ± 18.819.27 ± 2.957.49 ± 5.46172 ± 21.97
3110.72 ± 5.2082.54 ± 6.1463.78 ± 6.042.49 ± 3.260.38 ± 0.1934.66 ± 18.4910.98 ± 4.069.08 ± 7.01176 ± 25.60
Table 3. Average changes in LV and aortic functions with varying LV preload over 5 rats.
PreloadEDP (mmHg)DP (mmHg)MAP (mmHg)Q (mL/min)EDV (mL)EF (%)SW (mmHg∙mL)PVA (mmHg∙mL)HR (bpm)
123.02 ± 4.2791.03 ± 9.8270.66 ± 1.135.34 ± 1.560.49 ± 0.1352.57 ± 24.9516.13 ± 5.0213.39 ± 8.87186 ± 33.68
223.81 ± 4.6591.61 ± 9.2570.91 ± 1.006.10 ± 1.250.53 ± 0.1146.82 ± 18.8116.16 ± 5.1813.62 ± 8.70191 ± 31.43
324.44 ± 4.6493.31 ± 9.1371.45 ± 1.106.99 ± 1.090.57 ± 0.1242.73 ± 14.7816.75 ± 5.0715.08 ± 7.79195 ± 29.11
424.76 ± 4.5294.12 ± 9.5571.76 ± 1.157.66 ± 0.940.58 ± 0.1341.78 ± 13.7316.82 ± 5.2716.48 ± 7.30198 ± 29.29
525.42 ± 4.3796.08 ± 8.9172.07 ± 1.038.90 ± 0.410.60 ± 0.1341.87 ± 13.1417.57 ± 5.2218.42 ± 7.81199 ± 29.45
625.70 ± 4.3696.91 ± 8.9672.34 ± 1.169.56 ± 0.740.59 ± 0.1442.67 ± 11.7417.81 ± 5.1019.55 ± 6.94196 ± 25.00
Disclaimer/Publisher’s Note: The statements, opinions and data contained in all publications are solely those of the individual author(s) and contributor(s) and not of MDPI and/or the editor(s). MDPI and/or the editor(s) disclaim responsibility for any injury to people or property resulting from any ideas, methods, instructions or products referred to in the content.